
Over 72% of buildings in Scotland still rely on mains gas as their primary heat source. Scotland must further decarbonise heating in homes and buildings to achieve its climate change targets.
The Scottish Government’s 2021 Heat in Buildings Strategy identified clean heat networks as a strategic decarbonisation technology. However, given the high cost of transforming Scotland’s buildings and limited public sector budgets, additional investment is needed from the private sector.
This study examines existing and potential future financing models for Scotland’s heat network sector and identifies suitable levers and actions to incentivise private finance. Findings are based on a series of interviews with stakeholders, including operators, funders, advisors and public sector representatives, as well as desk-based research. The report draws comparisons and insights from other relevant utility sectors and from other countries (the Netherlands, Germany, Finland, Sweden and Estonia) as well as England and Wales.
Summary of findings
Challenges facing the sector
- The most impactful barriers in the sector are demand uncertainty, revenue instability and the evolving regulatory environment.
International comparisons
- Scotland, the rest of the UK and the Netherlands have a developing heat network sector. Germany is expanding its market. Sweden, Finland and Estonia have mature markets where the sector is tried, tested and trusted.
- Many of the developed and mature markets are unregulated: they use self-governing frameworks and technical codes. This is coupled with high levels of local governance, greater pricing transparency and consistent contractual delivery and routes.
- The more developed markets (including Sweden, Finland and Estonia) have a mixed degree of public ownership. More mature markets are likely to have a higher level of private finance penetration.
- Most of the studied countries have adopted a range of financial levers. Many have applied a similar approach to Scotland, including the continued use of capital grant funding, project development funding or individual grants for expanding and upgrading heat networks.
Utility sectors
Examples of regulatory regimes and financial support mechanisms used successfully in the UK utility sectors to stimulate private sector investment in new infrastructure:
- Contracts for Difference could support heat networks that use decarbonised heat sources (e.g. heat pumps), which are likely to have a higher cost than conventional gas boilers or heat networks using waste heat.
- A Regulated Asset Base model can protect consumer prices whilst also encouraging ongoing capital investment, supporting asset maintenance and providing predictable revenue streams. It would involve significant administrative and resource cost.
- The Renewable Heat Incentive is a well understood revenue support mechanism used in the energy sector. This model would subsidise the cost of heat for consumers if it was based on the amount of heat generated, as opposed to consumption of heat.
Market feedback
To facilitate private investment, stakeholders highlighted the need for:
- Continued grant funding support to de-risk project cashflows
- Clear regulation on key topics such as heat zoning, mandatory connection policies, planning and building regulations and phasing out gas boilers
- Greater clarity on the development of future regulation
If you require the report in an alternative format, such as a Word document, please contact info@climatexchange.org.uk or 0131 651 4783.
Research completed March 2025
DOI: http://dx.doi.org/10.7488/era/5740
Executive summary
Background
Over 72% of buildings in Scotland still rely on mains gas as their primary heat source. Scotland must further decarbonise heating in homes and buildings to achieve its climate change targets. The Scottish Government’s 2021 Heat in Buildings Strategy identified clean heat networks as a strategic decarbonisation technology. However, given the significant levels of capital investment required to transform Scotland’s buildings and limited public sector budgets, additional investment will be needed from the private sector.
Aims
This study examines present and potential future financing models in the heat network sector (“the sector”) and identifies suitable levers and actions for incentivising private finance. Findings are based on a series of interviews with stakeholders, including operators, funders, advisors and public sector representatives, as well as desk-based research. We draw comparisons and insights from other relevant utility sectors and from other countries (the Netherlands, Germany, Finland, Sweden and Estonia) as well as England and Wales.
Findings
Challenges facing the sector
In Scotland and across the UK, the heat network sector has typically been funded by early-stage financing from developers and significant levels of subsidy from the public sector. These public subsidies have encouraged private investment in the sector and supported the roll out of heat networks across Scotland.
The most impactful barriers in the sector are demand uncertainty, revenue instability and the evolving regulatory environment. This limits investment appetite, restricting the roll out of heat networks at scale in Scotland. The barriers are illustrated in Figure 1.

International comparisons
- Maturity – Scotland, the rest of the UK and the Netherlands have a developing heat network sector. Germany is expanding its market. Sweden, Finland and Estonia have mature markets where the sector is tried, tested and trusted.
- Regulation – Many of the developed and mature markets are unregulated: they use self-governing frameworks and technical codes. This is coupled with high levels of local governance, greater pricing transparency and consistent contractual delivery and routes. These markets can focus on consumer pricing that supports investment and stimulates the sector’s development. Additionally, mandatory connections are being used in some circumstances in other countries, to make projects more investible and create demand assurance, which encourages private investment.
- Ownership profiles and private finance – The more developed markets (including Sweden, Finland and Estonia) have a mixed degree of public ownership. More mature markets are likely to have a higher level of private finance penetration. In Finland, public sector ownership remains at a high level, whilst still seeking investment from the private sector. In Germany there’s a growing commitment to re-municipalise infrastructure and reverse privatisations. In the Netherlands, where over 90% of sector finance is private, the government proposed legislation to part-nationalise the sector in 2022 to mitigate concerns around the affordability and reliability of the sector.
The developed markets are mainly regulated by standard frameworks. These markets can access private finance due to the established nature of the sector. However, the technology has been embedded in the culture of these countries for much longer and so regulators can focus on price transparency and fairness for the end user rather than a framework for developing the market.
- Financial levers – Most of the comparator countries have adopted a range of financial levers. Many have applied a similar approach to Scotland, including the continued use of capital grant funding, project development funding or individual grants for expanding and upgrading heat networks. Grant funding is still widely used in the less mature sectors. As the sector matures, intervention rates reduce or there is greater requirement for a higher degree of renewable heat sources to be used. Additionally, state-owned infrastructure banks have been investing in the sector to help refurbishments or provide debt financing for expansion.
Utility sectors
Various regulatory regimes and financial support mechanisms have been used in other sectors to stimulate private sector investment in the development of new infrastructure. The Scottish Government must consider the costs and practical challenges of pursuing financial support mechanism models that are not being adopted in England and Wales:
- Contracts for Difference (CfDs) have proved very successful in securing the necessary investment in a wide range of renewable energy technologies. This approach could provide revenue support to heat networks to incentivise the transition to more sustainable forms of heat generation. In particular, CfDs could support heat networks that use decarbonised heat sources (e.g. heat pumps), which are likely to have a higher cost than conventional gas boilers or heat networks using waste heat. Therefore, as well as providing revenue certainty, a CfD has the potential to subsidise the increased cost of decarbonised heat for end users.
- A Regulated Asset Base (RAB) model, alongside periodic price reviews, can protect consumer prices whilst also encouraging ongoing capital investment, supporting asset maintenance and providing predictable revenue streams. The model would, however, involve significant administrative and resource cost. Prior to the sector maturing, a RAB model might not result in financially viable heat networks without additional capital or revenue support.
- The Renewable Heat Incentive (RHI) model is a well understood revenue support mechanism previously used in the energy sector. Similar to CfDs, an RHI model would subsidise the cost of heat for consumers if it was based on the amount of heat generated (as opposed to consumption of heat). It would therefore contribute to the cost of deployment, helping to address the increased cost of installing this technology and at the same time, mitigating demand risk. A cap on payments could also be introduced to avoid over-incentivisation. However, the value for money of previous schemes has been questioned.
Market feedback
The private sector views heat networks as an attractive investment opportunity but there are areas of uncertainty that must be resolved, including the need for greater clarity on the development of future regulation. To facilitate private investment, stakeholders highlighted the need for continued grant funding support to de-risk project cashflows. They also emphasised the importance of clear regulation on key topics, including heat zoning, mandatory connection policies, planning and building regulations, as well as a definitive policy direction on phasing out gas boilers.
Recommendations
We recommend that the Scottish Government:
1. Maintains capital funding support for the sector, either via existing programmes, or new bespoke capital schemes. Explore opportunities for extending the timescales for drawing down grant funding.
2. De-risking future revenues is key to unlocking heat network development – private capital is available for projects, but they need to be financeable. More detailed analysis of a revenue support model, such as CfD or a RHI equivalent, is merited. However, the Scottish Government must address the challenges of establishing such schemes, including the significant administrative and resource implications of previous schemes.
3. Explores the benefits of implementing a RAB model, following further regulatory developments and the creation of an established asset base (over 10-15 years). However, consider the complexity and feasibility of this model.
4. Continues to work closely with the Scottish National Investment Bank (SNIB) and the UK National Wealth Fund to explore investment opportunities, create a shared understanding of each party’s objectives and ultimately unlock the capital that has been made available to invest. Both organisations are committed to investing into the sector.
5. Maintains and increases support for pre-construction projects, via the Heat Network Support Unit (HNSU) and specific development funding programmes.
6. Monitors the implementation of the UK Government’s zoning approach and, where appropriate, leverage best practice from the Department for Energy Security and Net Zero (DESNZ). This should be used to complement Scotland’s existing zoning approach.
7. Reviews its approach to regulation to help reduce regulatory uncertainty. Where appropriate, this should include leveraging best practice from England and Wales.
8. Continues to work with the UK Government on rebalancing electricity and gas prices. However, this will not eliminate the price difference between electricity and gas.
9. Develops a national Heat Network Strategy setting out a clear long-term vision for heat networks in Scotland.
Glossary / Abbreviations table
|
£/€ bn |
Billions of £/€ |
LCCC |
Low Carbon Contracts Company |
|
£/€ m |
Millions of £/€ |
LCITP |
Low Carbon Infrastructure Transition Programme |
|
ACM |
The Netherlands’ Authority for Consumers and Markets |
LHEES |
Local Heat and Energy Efficiency Strategies |
|
AMP |
Asset Management Plans |
MWh |
Megawatt hour |
|
ASHP |
Air source heat pumps |
NFFO |
Non-Fossil Fuel Obligation |
|
CAA |
Civil Aviation Authority |
NIB |
Nordic Investment Bank |
|
CAP |
Competitively Appointed Provider |
NWF |
National Wealth Fund |
|
CCC |
Climate Change Committee |
ODI |
Outcome delivery incentive |
|
CCUS |
Carbon Capture, Utilisation and Storage |
OFTO |
Offshore Transmission Owners |
|
CfD |
Contract for difference |
ORR |
Office of Rail and Road |
|
CXC |
ClimateXChange |
RAB |
Regulated asset base |
|
DBFO |
Design, Build, Finance and Operate |
RAV |
Regulated Asset Value |
|
DESNZ |
Department for Energy Security and Net Zero |
REMA |
Review of Electricity market arrangements |
|
DHLF |
District Heating Loan Fund |
RESCo |
Regional Energy Services Company |
|
DHN |
District heat network |
RHI |
Renewable Heat Incentive |
|
DPC |
Direct Procurement for Customers programme |
RIIO |
Revenue = Incentives + Innovation + Outputs |
|
EfW |
Energy from Waste |
ROC |
Renewable Obligation Certificates |
|
EY |
Ernst and Young LLP |
rUK |
Rest of the UK |
|
FOAK |
First of a Kind |
SFT |
Scottish Futures Trust |
|
GHNF |
Green Heat Network Fund |
SHNF |
Scotland’s Heat Network Fund |
|
HN |
Heat network |
SNIB |
Scottish National Investment Bank |
|
HNDM |
Heat networks delivery models |
SPV |
Special Purpose Vehicle |
|
HNES |
Heat Network Efficiency Scheme |
SRO |
Scottish Renewables Obligation |
|
HNIP |
Heat Networks Investment Project |
T&SCo |
Transport and storage infrastructure |
|
HNSA |
Heat Networks (Scotland) Act 2021 |
TWh |
Terawatt hours |
|
HNSU |
Heat Network Support Unit |
UK |
United Kingdom |
|
KfW |
Germany’s infrastructure bank |
WCW |
Dutch Collective Heat Supply Act |
|
KPI |
Key Performance Indicators |
WPG |
Germany’s Local Heat Planning Act |
Introduction
Research aims
This report examines the heat network sector (also referred to as “the sector”) and will contribute to the Scottish Government’s ambition to accelerate the pace and scale of heat network rollout in Scotland. The report:
- Summarises current financing models, structures, and barriers in the sector and establishes a baseline for the Scottish heat network landscape
- Draws comparisons and insights from relevant utility sectors
- Draws comparisons with international heat networks and their financing models
- Provides insight into how heat networks are currently viewed by the private and public sector
- Recommends suitable financial levers, models and policies for the sector
“Heat Network” definition
The definition of a “heat network” in the Heat Networks (Scotland) Act 2021 (HNSA) covers both district heat networks and communal heat networks. A district heat network distributes heat from one or more sources to more than one building. In a communal heating system heat is supplied to one building comprised of more than one building unit (for example, a block of flats).[1]
The majority of the findings in this report refer to district heat networks, but we have included both communal heating and district heating in our definition of a heat network.
Heat networks can be powered by a range of different technologies. Historically, heat networks have often utilised fossil fuels, including gas boilers. As a result, many legacy networks still rely on fossil fuel-based technology. Our analysis considers these legacy networks; however, we recognise that the Scottish Government is committed to supporting the roll out of clean heat networks and supporting the reduction in emissions from the sector. This is important context for the conclusions in this report.
Methodology
Our findings are based on extensive desk-based research conducted by sector specialists. The analysis also draws on insights from a series of interviews with sector stakeholders, including operators, funders, advisors and public sector representatives. This information has been used, together with our own sector experience and evidence from existing literature, to set out the existing baseline position in Scotland (and the rest of the UK) and to develop our recommendations for suitable financial levers, models and structures for the heat network sector in Scotland. Finally, the stakeholder feedback also informed our approach for drawing comparisons with other utility sectors and international comparators.
Our stakeholder engagement methodology and questions were agreed with CXC and the Scottish Government Steering Group. The engagement exercise consisted of 20 meetings and Microsoft Teams calls. In advance of the sessions, participants were issued with the questions and given the opportunity to share feedback either in writing or verbally.
Policy Context
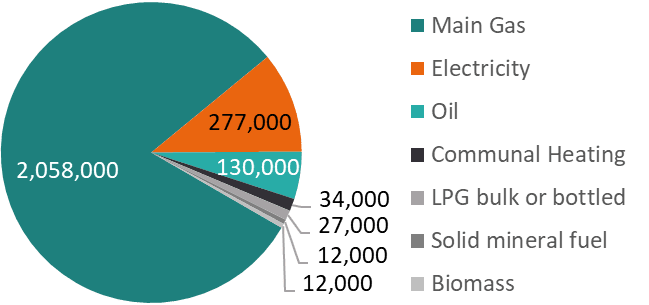
Scotland’s ambitious climate change targets are to achieve net zero greenhouse gas emissions by 2045. To deliver this, Scotland must instigate a step change in decarbonising the heating of its homes and buildings. Domestic buildings account for 15% of Scotland’s total greenhouse gas emissions and around 27% of its total energy consumption[2]. The scale of this decarbonisation challenge is significant – Figure 2 shows that in 2022, over 72% of Scotland’s homes relied on mains gas as their primary heating fuel[3].
Figure 2: Breakdown of primary heating fuel vs number of homes
The Scottish Government’s 2021 Heat in Building Strategy identified clean heat networks as a key strategic technology which is tried and tested and can be scaled up.
The Heat Networks (Scotland) Act 2021 established statutory targets for heat supplied by heat networks, requiring that they supply 2.6 Terawatt hours (TWh) of output by 2027, 6 TWh by 2030 and 7 TWh by 2035. In 2022, the Scottish Government estimated that heat networks supplied 1.35TWh of output[4]. To meet Scotland’s ambitious statutory targets, a significant acceleration in deployment is necessary.
Source: Scottish House Condition Survey 2022
The public sector plays an active role in the sector’s development, both at the national and local level. Local Heat and Energy Efficiency Strategies (LHEES) are local authority-led plans to decarbonise heat and improve energy efficiency, including rolling out heat networks in suitable locations. Momentum is building, with Scottish local authorities publishing their LHEES strategies, which include establishing the role of heat networks as a key decarbonisation measure.
The capital investment required to transform Scotland’s buildings (between now and 2045) is expected to be in the region of £33bn[5]. Given the size of this investment and the limited nature of public sector budgets, significant levels of finance will need to come from the private sector.
Current financing structures and models in Scotland’s heat networks
Scotland’s heat network sector
Heat networks distribute heat from a central source, avoiding the need for individual heating systems (such as gas boilers). There are over 1,090 known heat networks (the majority being communal heat networks) supplying heating and cooling to domestic and non-domestic properties[6]; however, most of the larger networks with significant heat loads are in Scotland’s larger towns and cities. Although recent projects have introduced clean heat sources, the sector still relies on mains gas as its primary heat source[7].
Figure 3: Heat networks in Scotland
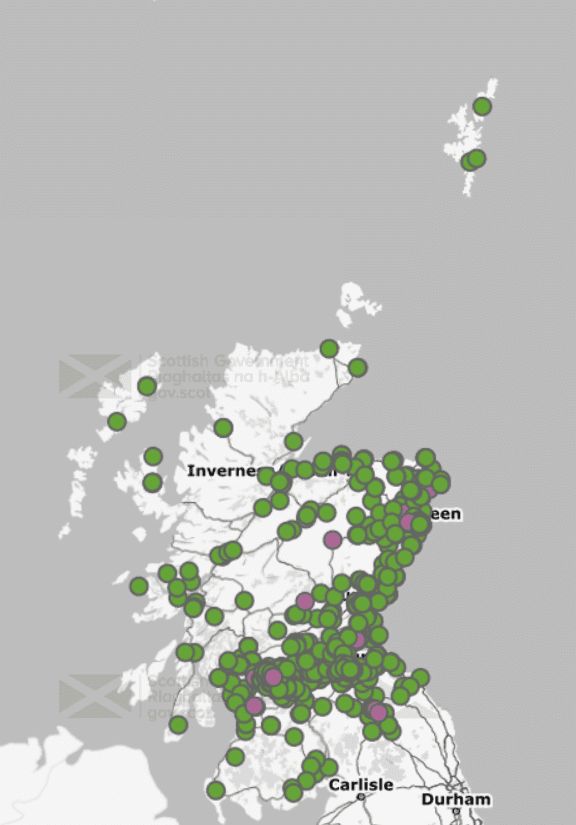
The number of heat networks, both district and communal, is increasing across Scotland. Figure 3 illustrates the distribution of heat networks in Scotland, but the sector is still immature, especially compared to counterparts in Europe, where heat networks have played a central role in heat infrastructure since the 1940s.
Sector growth has been slow, and in recent years, the focus has been on a series of “demonstrator” projects, across a range of sizes and driven by early adopters in both the private and public sectors.
Source: Map – Heat Network Support Unit
Scottish and UK regulatory landscape
There is an emerging focus on the regulation of heat networks within Scotland and the rest of the UK. For the first time in the UK the sector is set to become regulated, like many other utility sectors. Given the decarbonisation requirement and recognising the growing importance and potential of heat networks, the Heat Networks (Scotland) Act 2021 (HNSA) created a regulatory framework for the sector in Scotland.
The regulation of consumer protection (including for heat networks) is reserved to the UK Government. In 2024, the UK Government and Ofgem jointly consulted on regulations to establish an authorisation system to protect heat network consumers under the Energy Act 2023. Ofgem will be the future regulator of that consumer protection regime across England, Scotland and Wales. Ofgem’s will also be responsible for heat network licences and authorisations in Scotland, as set out in the HNSA.
The HNSA includes a series of measures to support the sector and promote growth. These are summarised in table 1 below, alongside the relevant UK position. The UK Government has proposed a regulatory regime but has yet to introduce secondary legislation. For those measures not in force in Scotland, these will also be introduced by the secondary legislation.
Table 1: Scottish and UK regulatory landscape
|
Scottish landscape[8] |
England & Wales landscape |
|---|---|
Zoning, permitting and licensing
| Zoning, permitting and licensing |
Consumer protection | |
Technical standards | |
The HNSA and the new UK Energy Act both aim to introduce legislation that has the potential to align the regulatory landscape across the UK. However, our stakeholder engagement process found that significant regulatory uncertainty currently exists, including the diverging timetable for introducing legislation and the lack of clarity regarding the differences in proposals between Scotland, England and Wales. Without further developments on specific regulatory areas, such as permitting/zoning, this uncertainty will remain. We also acknowledge that there is a complex regulatory landscape, with input required from both the Scottish and UK Governments to clarify the balance between devolved and reserved powers. These observations are further developed in section 4.4.
The HNSA has created an opportunity for Scotland to benefit from a robust regulatory framework that builds trust for consumers and creates certainty for operators. In order to stimulate sector growth, the market requires further clarity on the ongoing process to regulate the sector and more detailed information regarding the introduction of secondary legislation. This should provide clarity regarding investment opportunities, reduce the complexity of the dual regulatory frameworks and make Scotland a more attractive investment proposition.
The sector is also impacted by other Scottish regulation, including the New Build Heat Standard, which requires new homes and buildings to install clean heating systems, rather than relying on mains gas. Additionally, the National Planning Framework 4 includes policies which states that development proposals (within or adjacent to a heat network zone) will only be supported if they connect to an existing heat network.
Existing financing models in the sector
In Scotland and across the UK, the sector has typically been funded by early-stage financing from developers and significant levels of subsidy from the public sector. The Scottish Government has supported clean heat networks through:
- Grant support (also in the form of repayable assistance), including:
- Scotland’s Heat Network Fund (SHNF) – The SHNF offers capital grant funding to support the roll out of new clean heat networks and communal heating systems, as well as the expansion and decarbonisation of existing heat networks across Scotland.
- Low Carbon Infrastructure Transition Programme (LCITP) – From 2015 until it was replaced by the SHNF in 2022, LCITP provided grant funding support to several heat networks, including Queens Quay and Torry heat network.
- Both programmes also provided project development and commercialisation support.
- Loans via the District Heating Loan Fund (DHLF) – Managed by the Energy Savings Trust, the fund provided capital loan funding to support low emission small scale district heating in Scotland until it closed in April 2024.
- Non-domestic rates reliefs – since April 2024 heat networks (where 80% of the thermal energy in any given year is generated from renewable sources) have been eligible for a 90% rates relief.[9] There is also a 50% rates relief if a premises is wholly or mainly being used for a district heating network.[10]
- Many demonstrator projects also benefitted from historical UK Government revenue support through the Renewable Heat Incentive (RHI), now closed to new applicants.
These public subsidies have encouraged private investment in the sector and supported the roll out of clean heat networks across Scotland. Many clean heat demonstrator projects have been self-funded by operators (or funded through bespoke delivery vehicles). However, grant funding is required to bridge funding gaps and enable projects to achieve the internal rate of return – often referred to as a hurdle rate – required by operators. This is more important for clean heat networks than for fossil fuel-based systems, where the requirement for public subsidy is less pressing given the lower capital costs.
The hurdle rate is different for each operator and project. It is impacted by an operator’s cost of capital and project specific risks, but our analysis indicates that, at the time of this report, it tends to range between 8% and 12% (although this range will be impacted by several external factors and will vary on a project-by-project basis). This is explored further in section 0.
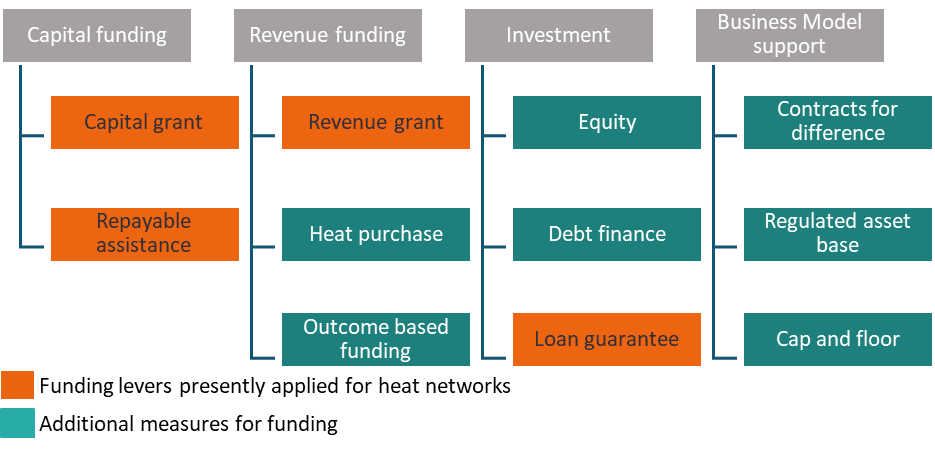
Grant support is among several financial mechanisms (or “financial levers”) which the Scottish Government has historically used. Such support could continue to de-risk heat network projects and help incentivise private sector investment. Figure 4 highlights some of the key mechanisms used to date and others which are considered further in this report. A summary of each mechanism can be found in Appendix B.
Figure 4: Funding levers the Scottish Government could deploy to attract private investment
In order to understand how a step change in private investment might be instigated, it is important to highlight the key factors which drive investor confidence, namely:
- Certainty of demand
- Revenue stability
- A stable regulatory environment
- A clear understanding of project risks with shared ownership and mitigation strategies
These factors and wider deployment barriers are explored in the following section.
Heat network deployment barriers
Overview
The analysis contained in this section includes feedback from our stakeholder interview exercise, as well as our own professional observations. While many of these barriers are well understood in the market, key stakeholders confirmed that they continue to present significant live obstacles for private sector operators and investors, limiting their investment appetite and restricting the roll out of heat networks at scale in Scotland. Following stakeholder feedback, we have grouped these barriers (shown in figure 5) into four categories:
- Financial
- Regulatory and policy
- Technical
- Social and market barriers
Figure 5: Heat network deployment barriers
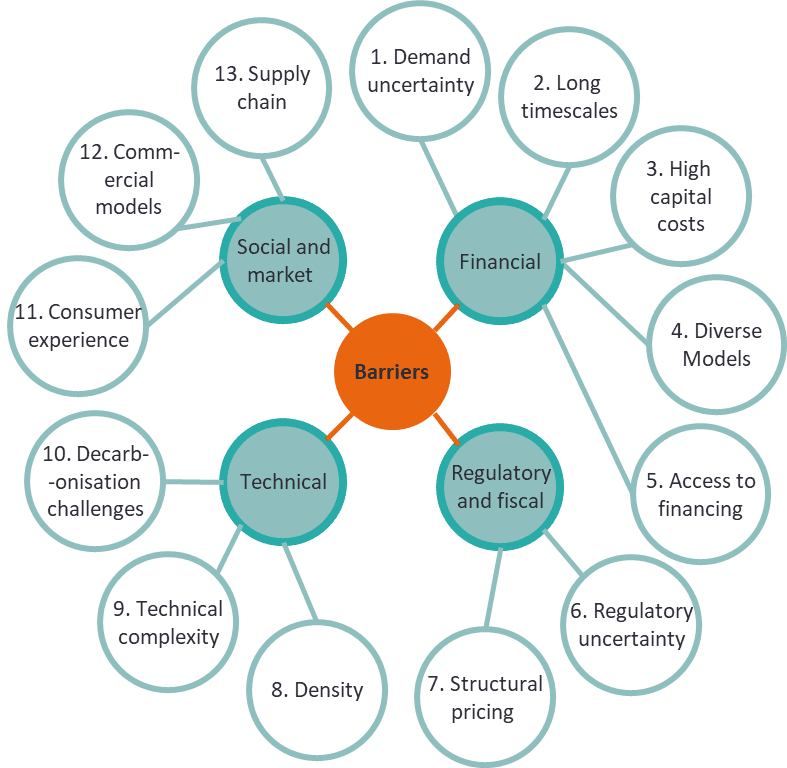
Within these categories, we present the barriers in order of importance (based on the strength of stakeholder feedback). It is important to note that whilst our report is primarily focussed on financial barriers and the private sector, many of these non-financial barriers add further uncertainty and therefore need to be taken into consideration. All these barriers – financial and non-financial – must be addressed in order to instigate a step change in private investment.
Financial barriers
Heat networks involve significant levels of financial risk and uncertainty, making it extremely challenging to forecast a project’s cashflows, thereby deterring private investment. These financial risks are highlighted below:
Demand uncertainty
Demand uncertainty is the biggest factor inhibiting private sector investment. For a heat network to be financially and commercially viable, it should generate a minimum level of committed revenue in order to meet the operating costs of the network and contribute to the repayment of the initial capital investment. This can be challenging if it is unclear when and how many buildings will connect to the network, their heat offtake requirements and the resulting revenue that will be generated.
For many Scottish “demonstrator” projects, demand and revenue risk have been reduced by securing anchor loads via public sector buildings, which require large heat offtake requirements and therefore to provide some revenue certainty. Developers and investors prioritise the de-risking of revenue flows as it provides greater certainty in a project’s ability to service the repayment of any debt or shareholder loans and/or equity return. As a result, securing longer term supply agreements with customers is a critical step in securing additional investment.
Operators stated that investment decisions are not speculative – the extent of committed revenue and certainty of connections are critical considerations to a potential developer and/or investor. To date, projects have typically been funded using balance sheet finance of the project sponsors (corporate finance) in the form of shareholder loans and equity, rather than more conventional third-party debt finance in the form of limited or non-recourse debt finance. When a heat network project reaches critical mass with mature connections and revenues, this provides an opportunity to refinance and secure more competitive finance terms due to reduced lending risk.
Long development and construction times
Many heat network projects have significant development and construction timescales, which present barriers to funders. In some cases, projects can take two or more years to develop and several more years to construct. This results in significant development and commercialisation costs, requiring high levels of upfront finance.
Historically, as a means of mitigating these development costs, the public sector offered support through the Heat Network Support Unit (HNSU) and specific grant funding programmes. However, stakeholders identified a misalignment between the grant funding drawdown profile (the existing grant funding programmes have shorter funding windows, typically four years) and the long construction cost profile (upwards of 5-7 years). This means that operators have had to condense the delivery programmes to meet the grant drawdown deadline or seek additional sources of financing.
High capital costs
Heat networks require significant levels of capital investment. Several recent Scottish heat network projects have had capital cost estimates of between £10m and £50m[11]. This barrier is exacerbated in times of high inflation and cost uncertainty. The high levels of capital investment are commensurate with other utilities such as water, gas and electricity. All require significant investment in underlying infrastructure prior to connection with residential, commercial and public sector buildings.
Large capital projects are often regarded as higher risk and therefore more challenging to finance. Due to cash flow uncertainties, this sector has historically relied on significant levels of grant funding. Public support (including Scottish Government programmes such as LCITP and SHNF) has been essential for improving private sector returns and sharing the risk of the high capital costs. When this support is unavailable, operators mitigate this risk in other ways, for example, by seeking increased connection fees for end users.
Diverse delivery models and procurement approaches
The lack of standardisation in procurement approaches and delivery models adds complexity, time and cost to a project’s development timeline. Projects develop bespoke approaches that are not necessarily repeatable for new projects. This inhibits the market’s ability to understand the investment landscape and reduces confidence. Investors are far more likely to pursue projects where there are standard procurement approaches and tried and tested delivery models, where the risks are understood.
The availability and access to financing
Debt lenders have been reluctant to invest in the sector due to the risks noted above. Current stakeholder feedback confirms that this remains the case. Typically, large infrastructure projects would look to include both equity and debt to optimise financing costs and spread the risk on investment. However, heat network projects typically struggle to demonstrate that they will have sufficient free cashflows to service the cost of debt. As such, debt lenders will seek to invest their funds in alternative sectors where they have more confidence in the cashflows. If these other sources of financing cannot be brought into the sector, the ability to roll out new projects at scale will be limited.
Regulatory and fiscal challenges
Although the financial barriers are significant, they must be considered alongside regulatory and fiscal challenges. These have created uncertainty in the market and have negatively impacted the private sector’s investment appetite. Stakeholder feedback highlighted the importance of these areas in unlocking Scotland’s heat network ambitions. However, as we discuss below, the Scottish Government does not have the ability to resolve all these issues.
Regulatory uncertainty
The Heat Networks (Scotland) Act in 2021 introduced powers to regulate the Scottish heat networks market for the first time. The Energy Act 2023 was passed by the UK Parliament in October 2023. Differences in implementation, content and timing of regulation between Scotland and the rest of the UK are negatively impacting investor sentiment and creating uncertainty. Developers and funders are also looking for clarity on the future GB-wide consumer protections and technical and service specifications for operators.
Without further clarity on the future secondary legislation in Scotland, operators stated they are more likely to focus resources outside Scotland – for example, in other UK areas – where there is more demand for larger urban heat network opportunities.
This uncertainty also extends to other relevant policy areas, such as the phasing out of domestic gas boilers, which presents barriers to operators. The Scottish Government has introduced the New Build Heat Standard, which states that by 2045, all homes in Scotland will need to have converted to a clean heating system. Across the rest of the UK, there is political uncertainty about this phase out. No equivalent legislation is currently in place, meaning heat networks operators are unclear when customers will be required to adopt low emission heating solutions.
Structural pricing considerations
Reducing the gap between the price of electricity and the price of gas may help support the rollout of low carbon heat networks. Under the current domestic[12] electricity pricing model, electrified low carbon heating solutions are unlikely to offer cost savings to consumers when compared against traditional gas boilers.
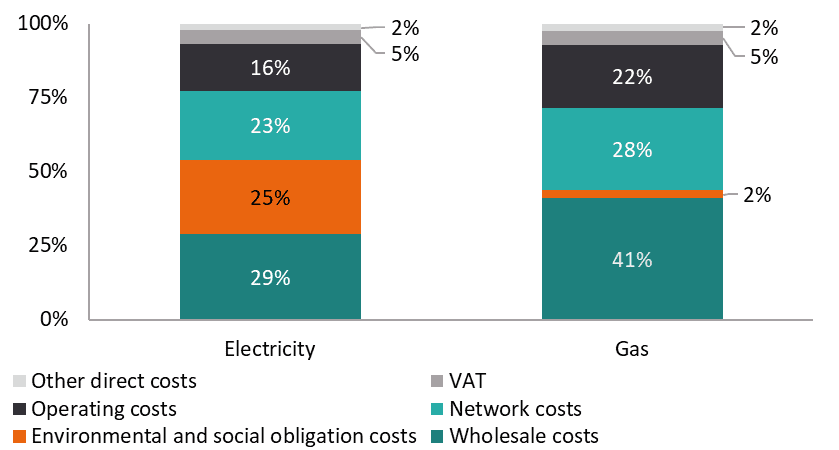
Historically, electricity has been more expensive than gas, partly due to the greater proportion of environmental and social obligation costs (green levies) placed on electricity (23%) compared to gas (2%), as shown by the figure 6 below.
Figure 6: Breakdown of domestic electricity and gas bill
The UK Government is currently consulting on the “Review of Electricity market arrangements” (REMA), which includes proposals for reducing electricity costs for consumers. Removing these levies from existing energy tariff structures would reduce the running costs of electrified heating solutions and encourage the uptake of low carbon heating.[13] However, there are many complexities involved in this change and the impact of rebalancing these costs must be understood further before it can be proven to be an effective mechanism for reducing electricity costs.
In addition to the impact of the levies, electricity prices (and gas prices) also include significant distribution and transmission charges (network costs). Electricity bills could be reduced by permitting heat networks connected to the electricity grid to pay lower network charges (recognising their ability to use electricity at times of low demand).
Regardless of these potential mechanisms, relatively low gas prices will continue to disincentivise the rollout of low emission heat networks, as they make any change to an alternative heat source appear more expensive. This is proving to be a significant barrier in the private sector.
Technical challenges
Operators and funders pointed to several heat network-related technical barriers which create further uncertainty and investor reluctance. The high-level technical challenges noted below are not an exhaustive list but rather provide important context for the rest of this report.
The need for density
In high density urban areas where there are large levels of heat demand, heat networks often provide the lowest cost low carbon heating option. The alternative is for properties to use individual air source heat pumps (ASHPs), which would place greater electricity demands on the grid and may result in higher customer costs and increased operational costs. Scotland has several areas where there is significant scale and suitable density levels for heat networks. However, operators noted that there are a greater number of large urban areas with multiple opportunities in England. This naturally provides significant competition for investment that might otherwise be made in the Scottish locations, especially for operators (operating both in England and Scotland) exploring opportunities across the UK. Additionally, smaller scale communal heating solutions may be appropriate for lower density areas; however, we do not explore this in detail as it is outside the scope of the report.
Technical complexity
Many of the existing heat network projects utilise different heat sources and technological solutions, including things as basic as pipework sizing. As projects increase in size, this lack of standardisation can present challenges for heat networks integrating and/or scaling up.
Decarbonisation challenges
Historically, many heat networks across the UK (and internationally) have been powered by carbon-based heat sources. However, operators consistently noted that customers now expect heat networks to use low emission heat sources. Low carbon technology is typically more expensive, and technologically complex than legacy carbon-based fuel sources and this therefore represents an additional factor impacting the commerciality of new projects.
Social and market challenges
The sector also experiences wider challenges in the development of the market for heat networks.
Consumer experience and scepticism
Operators and funders highlighted recurring customer concerns, including security of supply, pricing and consumer protection, that provide challenges to operators attracting potential domestic consumers to their heat networks.[14] Additionally, countries with a long history of operating heat networks, have an established culture of valuing and trusting the technology meaning consumers better understand the benefits. These factors have supported the development of international heat networks and have resulted in reduced levels of negative consumer experience and scepticism.
Lack of standardised commercial models
The lack of a standard delivery and operating model for heat networks results in developers and public sector partners (e.g. local authorities) having to invest significant time and resources developing proposals for their projects. This is explained further in section 4.5. This additional time and complexity increase development timescales.
Supply chain – the sector has a limited number of heat network developers
There are a limited number of private sector operators in Scotland, which in turn have a limited supply chain. The current developer landscape includes a number of balance sheet backed developers (SSE, EON, Vattenfall) and some infrastructure fund backed developers (Hemiko, 1Energy and Bring Energy).
This places a high dependency on a very small number of corporates relative to the scale of the heat network opportunities in the wider UK. Additionally, local authorities have a significant role to play in developing networks but they have limited in-house capacity and resource and therefore, rely on a small number of financial, technical and legal advisors.
Heat network delivery models – summary/overview
To address some of the barriers restricting the roll out of heat networks at scale, the Scottish Government is exploring a range of levers, including financial, technical and regulatory, and considering the optimum delivery models to support the sector. Although this report does not undertake a detailed assessment of these models, our overview provides context for the financial levers explored further in this report.
In 2022, the Scottish Government commissioned the Scottish Futures Trust (SFT) to undertake analysis on potential delivery models that could accelerate the pace and scale of heat network deployment in Scotland. The subsequent Heat Networks Delivery Models (HNDM) report, published in February 2024, identified four models that warranted further detailed development and consideration, namely:
- Regional Heat Partnership / Regional Energy Services Company (RESCo) model
- Local authority-led joint venture
- Local authority-led delivery, with Scottish Government stake
- Centrally-led delivery
Following the HNDM report’s publication, Scottish Government has collaborated with SFT to further develop the Regional Heat Partnership and Centrally-led models.
Overview of international experience
The Scottish Government can draw insight from comparable European and other international markets. It can be particularly helpful to consider how these sectors are developed, financed and regulated. To develop this insight, we have reviewed approaches in countries with high levels of market maturity, as well as those with characteristics similar to Scotland’s.
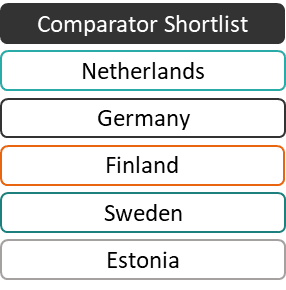
Our analysis is primarily based on five international examples, referred to in this section as the “comparator countries”. As shown in Figure 7, these are the Netherlands, Germany, Finland, Sweden and Estonia. During our shortlisting process, we considered jurisdictions such as the USA, Canada, Belgium, Ireland, Latvia and Poland, but found a lack of relevant data from which meaningful conclusions could be drawn. Our analysis will refer to these other countries where relevant.
Source: EY Analysis
Denmark has a mature and successful heat network sector and is often considered a valuable source of insight for Scotland. It is deliberately excluded from our analysis as the Scottish Government has a detailed understanding of the factors that have contributed to its success. These factors include cultural acceptance of heat networks and high consumer trust. Additionally, it has established regulatory levers such as mandatory connections.
This section provides an overview of:
- The history of comparator countries’ heat networks with a brief market overview
- The availability and impact of public financing levers
- The regulatory structures
- The market ownership profile and level of private finance penetration
- The financial composition of heat network assets
0B provides supplementary information for each international example.
History of international heat networks and market overview
Figure 8 summarises the maturity of each country’s heat network sector, based on the definitions developed by Department for Energy Security and Net Zero (DESNZ)[15]:
- Emerging – the market is still a nascent sector with lots of growth opportunity
- Expanding – the sector is established but is continually growing
- Consolidating – the market is mature and technology is being refined, updated or refreshed
- Refurbishing – the market is very mature and heat network technology is on the nth generation, but the networks are aged and require significant replacement and/or refurbishment
The comparator countries have a range of heat network maturity levels, with Finland and Sweden widely acknowledged as having mature and well-established sectors, while the Netherlands has an emerging heat network sector with many similar characteristics as Scotland.
DESNZ classified the UK and therefore by implication, both Scotland and the rest of the UK as emerging markets. 0B provides a brief historical overview of each international comparator.
Figure 8: Maturity of international heat networks
|
Emerging |
Expanding |
Consolidating |
Refurbishing |
|
Scotland |
Germany |
Sweden |
Estonia |
|
rUK |
Finland | ||
|
Netherlands |
Source: DESNZ (BEIS) “International review of heat network frameworks” (2020)
Key findings
The Nordic countries (Sweden and Finland) and Estonia are in the “consolidating” and “refurbishing” categories. In each country, the sectors are mature and the technology is tried, tested and trusted.
Overall, the Nordics have been leaders in district heat networks since the 1940s. The 1970s oil crisis stimulated a transition to alternative fuel sources and acted as a catalyst for rapid expansion in the sector. This early adoption is a significant factor driving the higher degrees of maturity in their district heating networks. Familiarity of the technology has supported the cultural acceptance. By 2015, 46% of Sweden’s heat networks were supplied by biomass and only 7% utilised oil or gas[16].
Heat networks are common in Germany, with the first pilot system having gone live in the 1950s. The sector has grown over the last decade with significant numbers of large-scale heat networks. Therefore, the market has surpassed the initial emerging phase of high growth but strives to continually expand toward becoming a mature market.
Germany is in the expanding category. Compared to Scotland, Germany has been using heat networks for much longer and the initial rapid growth phase has taken place. There is now a focus on continuing to add connections to existing networks.
Although the Netherlands implemented its first heat networks in a comparable time frame to Germany (Utrecht in 1923, followed by Rotterdam in 1949) this early adoption was not built upon, and no new networks were constructed in the 1950s and 1960s. However, there has been a moderate uptake of district heating schemes since the late 1980s.[17] The market is therefore relatively small but undergoing rapid change driven by a political commitment to decarbonise heat and reduce emissions from buildings. Therefore, there are strong similarities between Scotland and the Netherlands both in heat network market size and nascency and the Government’s ambition to decarbonise heat in buildings using district heating.
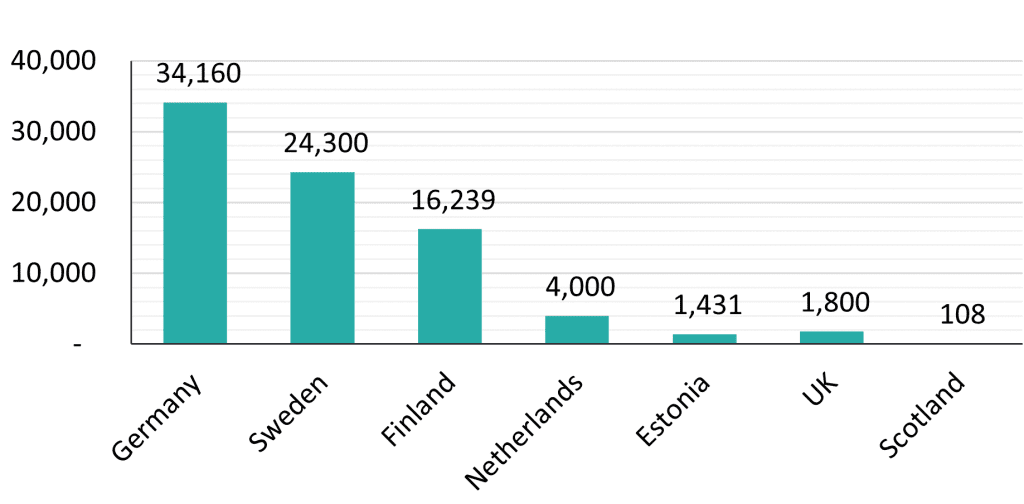
The scale of heat networks in most of the comparator countries differs significantly from Scotland. Figure 9 illustrates the cumulative length of heat networks in kilometres in each country[17]. While country size plays a role, Germany has nearly 35,000km of heat network infrastructure, whilst Estonia, although highly developed, is limited by its comparatively smaller size. Notwithstanding that, Scotland’s relative position to the comparator countries is clear.
Figure 9: Cumulative kilometres of heat networks
Source: EY analysis
Across Europe, the maturity of the sector varies, with countries such as Sweden, Finland and Estonia building on the successful implementation of decades worth of investment in the sector. The sector is still emerging in Scotland, like the Netherlands, where it does not demonstrate many of the characteristics of the more mature countries, such as cultural acceptance of heat networks and scale in the market. This provides important context for the following section reflecting on the appropriateness and availability of financial levers.
Impact of public financing levers
Public financing levers significantly influence the implementation and expansion of heat networks internationally. Financial levers serve as catalysts for innovation, growth and the adoption of low carbon technologies.
Table 2 provides an overview of the financial mechanisms that aid the development and expansion of heat networks. The levers include capital grants, tax exemptions and incentives, revenue grants, individual connection grants and decarbonisation incentives (for example, grant funding for decarbonised technology). Each country is discussed further in Appendix B.
Table 2: Summary of public financial levers used by international comparators
|
Country |
Financial Levers |
|
Rest of the UK |
|
|
The Netherlands |
|
|
Germany |
|
|
Finland |
|
|
Sweden |
|
|
Estonia |
|
Source: EY Analysis
In addition to the financial levers shown above, most comparator countries also benefit from a state-owned infrastructure bank investing in their district heating sector. State-owned infrastructure banks operate on similar terms to commercial lenders but may have the ability to adopt an increased risk appetite. This enables them to support heat networks in circumstances where commercial banks cannot. Additionally, EU member states benefit from access to EU funding where there are no bespoke heat network funding pots.
Recent investments reflect a growing appetite to engage across different markets with varying levels of maturity. For example, banks like the Nordic Investment Bank (NIB) provide investment support to help refurbish existing heat network assets across the Nordics and Baltics, while Germany’s infrastructure bank (KfW) is providing grants to help continue the transition to a more mature market in Germany.
Stakeholder engagement confirmed that both Scottish National Investment Bank (SNIB) and National Wealth Fund (NWF) have ample capital to deploy. The issue was reported to be a lack of investible projects.
0 provides a summary of state-owned infrastructure banks and relevant examples across the chosen countries.
Key findings
As illustrated by Error! Reference source not found., most of the comparator countries have adopted a range of financial levers. Many have applied a similar approach to Scotland, including the continued use of capital grant funding, project development funding or individual grants for expanding and upgrading heat networks.
Grant funding is a common financing lever, especially for the countries who are growing their heat network sectors. For example, in 2022 Germany introduced a €3bn fund to support the development and construction costs of new decarbonised heat networks (where 75% of the heat is sourced from decarbonised heat sources)[18]. This provides grant funding up to 40% of the eligible capital costs. The fund also provides feasibility support to projects. Additionally, the Netherlands is using a €400m fund to support the capital costs of new heat networks. The analysis shows that capital grant funding continues to be popular as an effective funding lever available before the sector reaches maturity. Regarding the UK market, there is continued funding from the Green Heat Network Fund (GHNF), with £288m initially made available and an additional £485m allocated in December 2023. The GHNF is expected to run until 2028, however operators expect that this will continue past 2028.
Another common lever in more mature countries is using individual grants or connection grants to incentivise connection to heat networks. For example, KfW helps deliver anchor loads to networks by offering increased grant support to local authorities for the connection of public sector buildings. Examples of individual incentives include the Estonian Business and Innovation Agency grant, which offers up to €10,000 for small residential buildings to connect to existing networks.
Estonia also offers a phased compensation scheme for the use of heat networks versus existing carbon-based alternatives. The Estonian Government provided compensation of 80% of the additional costs faced by heat network users because of increased energy prices.
Finland is developing a tax credit scheme which projects will be able to benefit from after they become operationally profitable. This has the aim of making project cashflows more appealing to investors, helping increase early returns by reducing the tax expense.
It is clear that many countries are promoting the use of grant funding to varying degrees. Significant levels of support are provided in jurisdictions with less mature sectors, while more mature countries use and develop other forms of support. The use of grant funding in Scotland and the rest of the UK is well established. Similarly, the Netherlands with its less mature sector also provides significant grant funding programmes. In Germany (an expanding country), grant funding continues to be a well utilised financial lever but intervention rates have decreased from predecessor programmes. Additionally, there is a requirement for a much larger proportion of the heat to be from renewable sources. The example of other emerging countries in Europe indicates that the market in Scotland will continue to rely on grant funding, even if the intervention levels decrease (like Germany) or grant funding is targeted at specific areas of sectors.
Regulatory structures
Our international comparator countries employ a range of regulatory structures (regarding operation, pricing and decarbonisation requirements) and national oversight. These range from self-governing municipality frameworks with a limited role for national regulators to nationwide regulatory frameworks governing the entire heat networks market. Whilst regulatory landscapes differ, the varying regimes offer interesting lessons for heat networks in Scotland.
Table 3 provides an overview of the international regulatory landscape and each country’s approach to mandatory connections. Detailed findings for these countries are shown in 0.
Table 3: Overview of international regulatory landscape
|
Country |
Regulated/Unregulated |
Mandatory Connections |
UK |
Regulation in development |
No* |
|
The Netherlands |
Regulated |
Yes |
|
Germany |
Unregulated |
No |
|
Finland |
Unregulated |
No |
|
Sweden |
Regulated |
No |
|
Estonia |
Regulated |
Yes |
*DESNZ is currently shaping its policy approach to mandatory connections. It is expected mandatory connections will be enforced on certain buildings in defined zones to be connected to heat networks by a given deadline[19]. However, details are yet to be fully confirmed.
Key Findings
Across our comparator countries, many of the developed and mature markets (e.g. Finland and Germany) are unregulated. The heat networks have a self-governing framework and abide by technical codes and industry standards but no third-party regulatory oversight. Municipalities have their own governance procedures; they are self-governing with greater pricing transparency, consistent contractual delivery and contractual routes. The evidence suggests that these countries focus on consumer pricing and that introducing standardisation supports investment and stimulates the sector’s development.
Mandatory connection to heat networks is used in some of the comparator countries, establishing base heat loads and reducing demand uncertainty. Mandatory connections are primarily applied to new developments, but barriers exist to using them in the retrofit market. For example, in relation to timing of connection for retrofits: where buildings may have recently installed new carbon-based technologies, connection to a heat network may not be considered for many years until their heat source needs replaced. Finland decided to repeal mandatory requirement having concluded they could be deemed anti-competitive given other decarbonised heating options are also used successfully.
Clear government policies on decarbonisation and the phasing out of carbon-based fuels are evident among the comparator countries. Germany’s Building and Energy Act 2020 requires municipalities to have heating (including heat networks) powered by 65% renewable energy from January 2024 onward and to phase out existing oil and gas heating systems. The German Government is incentivising the transition via KfW and offering bonus support for an accelerated switch to heat networks or other renewable sources. Similarly, the Netherlands has banned new developments from connecting to the gas grid from 2028 via amendments to Gas Act 2018.
Market ownership profile and private finance penetration
Our comparator countries also tend to have different ownership structures, with ownership split between the public and private sector in different ways.
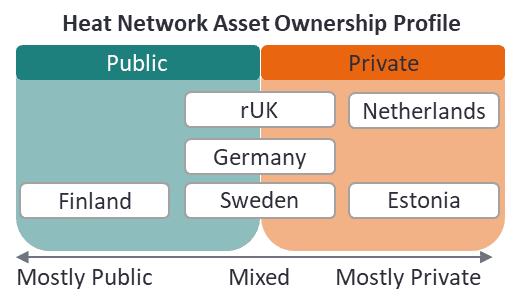
Figure 10 below shows the current profile of heat network ownership across each country, with Finland’s ownership largely public, the Netherlands and Estonia mostly private, and rUK, Germany and Sweden demonstrating mixed ownership structures.
Figure 10: Asset ownership profile
Key findings
Ownership profiles differ across the selected comparator countries with several observable themes. For some comparator countries, there is a high proportion of private sector finance. For example, in the Netherlands more than 90% of heat networks are managed by the private sector. This has helped to scale up investment. Established heat networks offer attractive, stable investments to institutional investors looking for long term consistent returns – as evidenced by Dutch pension institution PGGM investing in Swedish networks.
In other countries, including Finland, public sector ownership in the sector is at a high level. However, they are still seeking investment from the private sector to support established municipally owned heat networks, where budget restrictions limit upgrades and refurbishments. This ownership profile provides an interesting reference point for Scotland, as it allows the sector to benefit from additional investment.
The analysis shows significant levels of public ownership in many of the mature and maturing countries. In Germany, for example, Berlin’s municipality acquired the Berlin heat network for €1.4bn from Vattenfall. This demonstrated a commitment to re-municipalising infrastructure and reversing privatisations to gain more influence over the city’s district heating and gas supply. The municipality believes the Berlin network to be profitable and that it will play a significant role in moving toward climate neutrality.
In the Netherlands, the high levels of private sector ownership have resulted in the Dutch government proposing legislation in 2022 to part-nationalise the sector. Municipalities will have the opportunity to own up to 51% of networks, thereby bringing market ownership into the public sector. The proposal is designed to mitigate concerns regarding the affordability of heat for end users, the reliability of the services and the need to safeguard public sector climate change ambitions and public values. However, this initiative has led to significant concerns from several operators who feel that it will lead to a significant downturn in private sector investment[20]. During our stakeholder interviews, one European operator warned that this move will make the Netherlands “uninvestable”.
Overall, more mature markets tend to have a greater level of private finance penetration due to reduced risks and more stable operations. However, public sector ownership still allows local government to maintain more control regarding price and climate targets. Operators in the Netherlands indicated that the introduction of legislation to restrict private sector investment (and therefore control over the heat networks) can have a significant negative impact on the market and reduce investment security in the private sector. Under the new Dutch model, the incentives for private companies to invest in public projects are small and short term, as the private sector will lose control of the decision making while retaining significant levels of financial risk. Scotland should consider the impact that future regulatory changes may have on private sector investment appetite while balancing this with its broader objectives of reducing fuel poverty and supporting clean heat networks.
Financial composition of heat networks
The upfront capital expenditure expected revenue receipts and cash flow for other asset classes can be estimated with enough certainty to attract debt financing. In contrast, heat networks under development tend to have multiple expansion options and uncertainty around which end users will connect and when. This means costs or revenue inflows are not certain enough to allow a traditional project finance approach.
Rabobank, a Dutch multinational bank, highlighted that district heating companies self-financing their heating grids is a common approach in developing markets like the Netherlands. Their balance sheets typically include a mixture of debt and equity. Additionally, they also identify that traditional project financing is much harder to implement as it requires a significant portion of a project’s cashflows to be secured (by having contracted demand), which is an inherent problem for heat networks.
Rabobank also stated that whilst large credit worthy companies may be able to raise finance to fund heat networks and reduce their equity component of a project, smaller less bankable heat network developments may require government guarantees over any debt to help improve their attractiveness to private sector.[21]
The stakeholder engagement sessions also reflected the view that corporate balance sheet financing will remain the main source of financing in developing markets in the near-term.
Mature markets like Sweden, Finland and Estonia, benefit from more traditional forms of debt financing because they are well established and understood by lenders. For example, the NIB provided a €12m loan repayable over 10 years to help finance the heat network in Pirkanmaa, Finland.[22] These mature markets can also access EU financing to reduce dependence on carbon-based fuels. For example, the Finnish energy company Helen Ltd received a €150m loan in April 2024 via REPowerEU[23] for building a new heat pump plant and converting fuel use from coal to biomass pellets.
Consequently, developing heat networks are often funded purely from equity financing until they reach operational profitability. Only once stable profits are achieved can network operators consider refinancing and attracting debt lenders to expand their networks. Private Equity firms often take an equity stake in a heat network, but the composition of their fund could be a mixture of institutional debt and equity.
Conclusions
Our comparator countries present a mix of maturity levels, various ownership profiles, regulatory structures and financing levers. Those with more developed sectors have a mixed degree of public ownership and the ability to access private finance. They are mainly regulated by standard frameworks within the municipalities with regulators adopting a back seat approach. However, these countries with less regulation have had the technology embedded in their culture for much longer. Therefore, the regulators can focus on price transparency and fairness for the end user rather than a framework for developing the market.
Scotland has the opportunity to overcome the barriers faced by the sector by adopting solutions that have been successful elsewhere, including regulation, clear direction on decarbonisation and financing levers:
- Regulation: Standardised and practical regulatory frameworks help to ensure consistency across the market. They make it simpler for operators to undertake projects by reducing project complexity. Additionally, standardised frameworks and agreements provide greater certainty and transparency regarding control and responsibility of heat network assets. This provides operators with confidence over the assets.
- Decarbonisation: All of the countries on our shortlist are actively moving away from fossil fuel heat networks and incentivising clean heat networks through policy choices. For example, sector development may be encouraged through connection subsidy or a phased ban on carbon-based alternatives. Additionally, mandatory connections provide a baseline for investment cases, making projects investible as demand assurance can be satisfied. Equally, contracted revenues obtained as part of the demand assurance may provide enough certainty to encourage private investment into heat networks.
- Financing levers: Comparator countries have provided financial incentives for connecting to existing heat networks offering further incentives for accelerated uptake. Capital grant support is the most common lever used by international comparators across all market maturities as it can make the investment decision for expansion of heat networks more viable. Similarly, when networks are seeking connections, individuals need to be incentivised to connect. For example, by bridging the gap on cost to their current heat sources, particularly when there are no regulations requiring individuals to connect. Additionally, state-owned infrastructure banks can be used to leverage these solutions as the market develops. For example, if connection fees are mandatory, a connection fee facility could be rolled up into the overall financing solution as there will be enough clarity on contracted revenue cashflows to reduce demand assurance risk.
The key considerations can be summarised as follows:
- simple and standardised frameworks to ensure consistency within the regulations
- clear direction on decarbonisation
- the use of mandatory connections (such as on new developments) to provide certainty
- public financing levers to develop projects and also to incentivise individuals to connect.
Review of financing mechanisms in selected utility sectors
Introduction
The UK utilities sector is a multifaceted industry that provides essential services for the protection and maintenance of modern daily life and commerce. These services include the provision of electricity, gas, water, telecommunications and transport. Each segment and subsector of the utility sector is integral to the economy’s stability, growth and societal well-being. Regulation of such sectors ensures that individuals, and businesses have access to the critical resources they require at a reasonable cost.
Each UK utility sector is governed by a specific regulator responsible for consumer protection (including pricing), safety, reliability and sustainability, ensuring a well-developed network of public services provided under regulatory regimes, as outlined in Appendix C. The primary regulators include:
- The Office of Gas and Electricity Markets (Ofgem)
- The Water Services Regulation Authority (Ofwat) in England and Wales
- The Office of Communications (Ofcom)
- The Office of Rail and Road (ORR)
- The Civil Aviation Authority (CAA)
The global shift towards net zero, with an emphasis on clean heating systems, requires the development of regulatory regimes to incorporate new energy solutions.
Regulatory oversight will remain crucial for balancing the objectives of climate change mitigation with continued access to reliable and affordable utility services. As a result, heat networks are planned to be subject to formal regulation across England, Wales and Scotland by 2024/25 in line with primary legislation introduced as part of the Energy Act 2023 and the Heat Networks (Scotland) Act 2021.
Purpose
This section of the report examines the origins and current characteristics of other regulated utility sectors. We also explore if specific aspects of the regulation of other sectors can inform the regulatory and financial environment, which will help accelerate the development of heat networks in Scotland.
To aid in understanding how potential heat networks regimes may develop, we outline how the sectors have historically been financed and how the regulatory structures have facilitated the deployment of capital.
Methodology
We performed analysis to identify regulated utilities which offer a good comparator to heat networks. This included examining the characteristics of a long list of 39 regulated sectors covering electricity, water, telecommunications, rail and air regulation against the criteria listed in Appendix D. Based upon the preliminary analysis, we progressed 17 utilities for further examination which is discussed in Appendix K.
Further to the completion of the detailed analysis (Appendix K), we determined that offshore wind electricity generation, household water & sewerage undertakers and Carbon Capture, Utilisation and Storage (CCUS) demonstrated relevant attributes for heat networks. The key characteristics of each sector are summarised in Appendix E. This includes risk profile, type of sector the utility operates within and the investment time horizon for each utility.
These three utilities are used to understand how the utility sector is regulated and how investment supports ongoing development. They are also used to explore how heat networks might be regulated and how regulatory approaches impact levels of financing. Each sector is analysed separately below before evaluating how aspects could be applied to heat networks. A summary of regulatory timelines for these sectors is shown in Appendix F.
Offshore wind
Overview
The UK’s offshore wind sector is rapidly expanding and plays a pivotal role in the nation’s transition to renewable energy. Between the UK’s first offshore wind allocation round (AR1 2015) and AR 6 (2024), a total of 21 GW of offshore wind capacity has been supported by Contracts for Difference (CfDs). CfDs are explained in more detail below.
Regulatory Structure
Following the Energy Act 2004, Ofgem has continued to regulate the sector and is adapting its approach as offshore wind projects continue to be deployed, offering new support mechanisms. Ofgem’s regulation of offshore wind is structured around several key elements. It is designed to promote the development of the sector whilst ensuring efficiency, competition and the protection of consumers interests. Regulations cover, licensing, support mechanisms, grid connection, market oversight and consumer protection. Further details can be found at Appendix G.
Ofgem’s remit also extends to the provision of Innovation Funding to support the transition to net-zero energy systems. This includes support to accelerate technological advancements, improve efficiency and reduce costs.
Regulatory Financing Mechanisms
Offshore wind is characterised by large upfront capital expenditure, availability risk (wind variability) and exposure to a competitive and volatile electricity market. All these factors impact the sector’s ability to secure much needed investment. The investment time horizon is around 15 years commensurate with the term of a CfD. Unlike the deployment of heat networks, offshore wind is not exposed to demand risk as it operates on a wholesale basis whereby electricity is exported directly to the national grid.
CfDs provide long-term stable and predictable revenue for offshore wind developers, thus making offshore wind attractive to investors, creating optimised financing structures that can reduce the overall cost of capital. A CfD has the effect of providing a fixed price for each MWh of electricity that the project generates over a specified period (typically 15 years) referred to as the “Strike Price”. The Strike Price typically reflects the price per MWh a developer considers necessary to achieve its applicable return on investment over the period of the CfD. CfDs are awarded through a competitive auction process (Allocation Round) administered by the Department of Energy Security and Net Zero (DESNZ).
The Strike Price is different to the actual market price, known as the “Reference Price”, which is calculated based on the average market price per MWh over a given period. When the Reference Price is lower than the Strike Price, a top up payment of the difference in price is made by the Low Carbon Contracts Company (LCCC) to the offshore generator. Conversely, if the Reference Price is greater than the Strike Price, then the generator must pay the difference to LCCC.
CfDs were originally introduced in 2013 and replaced the Renewable Obligation Certificate (ROC) regime, which was the main support mechanism for renewable energy prior to CfDs. CfDs are an evolution of the support mechanism for renewable energy projects that increases competition and whereby the Strike Price better reflects the underlying levelised cost of the technology.
Household water & sewerage undertakers
Overview
The household water and sewerage sector in the UK provides essential water supply and wastewater services to residential and commercial customers. The sector operates as a natural monopoly and is therefore highly regulated across England and Wales and Scotland.
Regulatory Structure
England and Wales
In England and Wales the sector is regulated by Ofwat. The regulator aims to ensure high-quality services, fair pricing, compliance with environmental standards, and the financial viability of water companies. The regulatory structure has evolved over time to address priorities such as infrastructure investment, customer service improvement and environmental concerns.
Key changes include the introduction of competition to drive efficiency, periodic price reviews by setting price limits and service targets, increased customer engagement, and innovation funding. These changes aim to create a more outcome-based regulatory regime that encourages water companies to be customer-oriented, efficient, and forward-thinking in their operations and investments, ensuring high standards of water quality and environmental stewardship.
Scotland
Scottish Water is regulated by the Water Industry Commission for Scotland (WICS), which ensures value for money and efficiency without a profit motive. This aligns with Scottish Government policies on affordability and public ownership. WICS is governed by the Water Industry (Scotland) Act 2002, as amended by the Water Services etc. (Scotland) Act 2005 and the Water Resources (Scotland) Act 2013.
WICS’ role is to set charge caps, monitor performance, facilitate retail competition for non-household customers, and support the Hydro Nation vision. Price reviews are conducted every six years. Reviews set price limits based on Scottish Water’s business plan, customer input, and factors such as debt service and operational efficiency, with a transition away from the RAB model since 2010.
WICS also sets efficiency targets and, while independent, can be influenced by Scottish Ministers on financial matters, potentially impacting long-term infrastructure maintenance if charges are set too low. Scottish Water receives government loans or grants for large capital projects, reducing reliance on customer charges. However, this funding depends on the impact on the Scottish Government’s balance sheet, requiring careful management for long-term sustainability. Further details on this can be found at Appendix H.
Regulatory Financing Mechanisms
England and Wales
The water and sewerage sector relies on long-term investment provided by the capital markets, typically in the form of shareholder equity and bond finance. Most utilities are highly geared and therefore very sensitive to adverse changes in credit ratings (via Moody’s, S&P and Fitch). Nearly all utilities aim for an investment-grade credit rating to secure optimum lending terms with the primary objective of lowering the company’s Weighted Average Cost of Capital (WACC).
Ofwat’s regulation and associated pricing reviews provide a stable financial environment for investors. They ensure reliable demand due to the monopolistic nature of the customer base despite some revenue risk from bad debt. The application of a Regulated Asset Base (RAB) model (discussed below) along with the submission of Asset Management Plans (AMPs) that contribute to periodic price reviews, is designed to incentivise investment in infrastructure and services whereby the water companies are required to manage risks related to capital programmes, asset maintenance and operational costs similar to those in the heat network sector.
Regulated Asset Based (RAB)
The RAB model regulates water company prices while ensuring infrastructure maintenance and service quality. The RAB represents the value of a company’s capital assets based on historical costs, depreciation, and new investments. Ofwat uses the RAB value to set allowed revenue requirements, applying a WACC to determine the maximum revenue companies can charge, incentivising efficient investment and continual infrastructure improvements. This model is effective in the water sector due to the manageable number of operators, encouraging companies to invest efficiently and include new investments in future revenue streams.
Periodic Price Reviews
Ofwat’s price reviews, conducted every five years, determine the revenue water companies can earn. They take into both capital and operational expenditures into consideration to set price controls and encourage large-scale investment projects. The submission of AMPs contributes to the periodic price review process, which includes performance incentives through Outcome Delivery Incentives (ODIs), rewarding companies for meeting targets and penalising underperformance, aligning financial interests with high-quality service delivery. The periodic pricing reviews, coupled with limited demand risk provides greater revenue certainty for investment.
The latest Asset Management Plan (AMP8) for 2025-2030 focuses on climate change, emissions reduction, water quality improvement, leakage reduction, and reliable services. It also introduces innovative funding solutions such as the Direct Procurement for Customers (DPC) programme to support significant infrastructure investments.
Innovation funding
Although there are many external innovation funds available to water companies, Ofwat has established its own Ofwat Innovation Fund. The aim of this £200m fund is to encourage collaborative initiatives and partnerships within the water sector to tackle the larger challenges the sector faces such as climate change, leakage and affordability.
Scotland
Whilst Ofwat regulates the water sector in England and Wales, privatisation of the sector has resulted in high debt leverage which can give rise to value leakage to shareholders and risk of under investment of infrastructure. Thames Water, England’s largest water company, has requested that Ofwat approves an increase in water bills of up to 40% by 2030.
Scotland has sought to mitigate these specific risks through the water services being publicly owned. Services are operated by Scottish Water which remains accountable to the Scottish Government and its customers. This helps to ensure profits are reinvested in the infrastructure rather than distributed to shareholders. WICS is an Executive Non-Departmental Public Body whose principle statutory functions are to:
- Determine charge caps;
- Monitor Scottish Water’s performance, encouraging efficiency and sustainability;
- Facilitate competition by encouraging the entry of retail water and sewerage providers for non-household customers in Scotland; and
- Support the Scottish Government’s vision of ensuring that Scotland is a Hydro Nation and meet their obligations under the Water Resources Act 2013.
Water charges are set by WICS and remain relatively stable as profits are reinvested. The domestic charges are linked to council tax bands, with prices increasing as bands increase. Historically charges were calculated using a version of the RAB model. However, since the price review in 2010, WICS has moved away from the RAB based model towards looking at business requirements as the basis for setting prices.
Price Reviews
Similar to Ofwat in England and Wales, WICS performs Strategic Reviews of Charges to set price limits for the next regulatory period, usually every six years. The Strategic Reviews of Charges is initially based upon Scottish Water’s long term business plan. This encompasses short and long-term infrastructure investment requirements, debt repayments and operating costs. WICS subsequently evaluates the business plan, with a focus on Debt Service Cover Ratio (DSCR), alongside multiple other factors including inflation, investment needs and operational efficiency to determine annual price caps for customers. These may be adjusted annually within the limits set by WICS to account for inflation or other changes.
Although a proxy RAB continues to exist to act as an internal comparator to England and Wales water sector, Scottish Water’s customer-focussed business plan helps align Scottish Water with Scotland Government objectives.
Government Grants and Incentives
Scottish Water receives loans or grants from the Scottish Government to finance large capital expenditure projects. These reduce reliance upon customer charges, improving affordability for households and businesses. While government-backed loans could offer more favourable terms than private market financing, such a mechanism could impact the Scottish Government balance sheet (borrowing requirement). This impact could mean funding is not granted for infrastructure development and maintenance projects and instead a short-term increase in customer prices would have to be required. As such, any borrowing is carefully managed to ensure long term financial sustainability for both Scottish Water and Scottish Government.
Carbon Capture, Utilisation and Storage (CCUS)
Overview
CCUS is an emerging sector in the UK, crucial for achieving the net zero emissions target by 2050. The government is actively developing a regulatory framework to support its deployment. This framework, shaped by legislation such as the Energy Act 2023, aims to ensure CCUS projects are financially viable, environmentally effective and resilient. It provides regulatory oversight from bodies like Ofgem, the Oil and Gas Authority, and the Department for Energy Security and Net Zero (DESNZ).
Regulatory Structure
The UK’s CCUS sector is in its infancy and, to date, no significant facilities have been developed. As a result, it is referred to as a First of a Kind (“FOAK”) project. To facilitate the development, financing and deployment of CCUS technology, a robust regulatory landscape is required, coupled with effective funding support mechanisms. This includes the need to address the revenue uncertainty associated with demand risk from emitter connections. Further details on this can be found within Appendix I. The proposed regulatory framework aims to enable the sector’s development while contributing to net zero goals, with current proposals including a RAB-based model with revenue support to encourage initial investment and asset maintenance, anticipating evolution as technology and risks develop.
Regulatory Financing Mechanisms
Similar to the water and sewerage sector, the proposed regulatory RAB model for entities developing, owning, and operating CCUS transport and storage infrastructure (T&SCo) aims to provide long-term reliable revenues in order to secure the private sector funding necessary to construct the infrastructure and meet ongoing operational costs. The allowed revenue is determined similarly to other RAB models. DESNZ will initially administer this for CCUS before Ofgem takes over shortly after commercial operations begin. Despite the significant resources and time required to administer a RAB model, it is considered appropriate and effective for attracting private sector investment in T&SCo projects due to the anticipated limited number of such projects. Further details on how a RAB model operates can be found at Appendix H and Appendix I.
Revenue Support Agreement
Due to the uncertain uptake of CCUS technology in the early years, there is significant risk that T&SCos may not generate sufficient allowed revenue under the RAB model. To mitigate this risk, the regulatory structure includes a revenue support agreement, like CfDs in sectors such as offshore wind, until the market matures. The Low Carbon Contracts Company (LCCC) is the proposed counterparty to this agreement, responsible for covering any shortfall in actual revenue compared to the forecasted allowed revenue, thereby mitigating demand and revenue risk until the sector matures.
The CCUS regulatory framework addresses risks associated with FOAK projects by combining previous regulatory support mechanisms and encouraging investment through long-term, predictable revenue for equity investors supported by a contract with LCCC. The RAB model ensures continual maintenance of assets by increasing allowed revenue to cover maintenance costs, promoting adequate net revenue and visibility for future projects. However, this amalgamation of support mechanisms is still in development and remains untested until large CCUS projects begin construction.
Integration of regulatory models with heat networks
For each model described above, the aim has been to provide an economic and financial environment that stimulates private sector investment and develops new infrastructure. Furthermore, it should be noted that such regimes and financial support have evolved over time depending on the maturity of the sector and UK Government’s priorities and policies.
Each energy or utility sector is very different, with unique characteristics necessitating a bespoke approach to both regulation and financial support mechanisms. Such differences can include the maturity of the sector or technology intervention, including FOAK projects such as CCUS, nature of service provision (e.g. wholesale versus retail) such as electricity and water, the extent and maturity of regulation and the quantum of investment required.
Furthermore, each sector will be heavily influenced by legislation, such as Section 92 of the HNSA that sets targets for the combined supply of thermal energy by heat networks, to reach 2.6 TWh by 2027 and 6 TWh by 2030.
Offshore Wind – Contract for Differences (CfDs)
The purpose, mechanism and award process for CfDs is very well understood and has proved very successful in securing the necessary investment in a wide range of renewable energy technologies, in particular Offshore Wind.
CfDs have evolved over time. Its predecessor was ROCs, which were in place between 2002 and 2017, and before that the Non-Fossil Fuel Obligations (NFFOs) and Scottish Renewables Obligation (SRO) launched as early as 1990.
CfDs’ primary purpose, like that of its predecessors, is to provide price assurance to the developer and associated investors in relation to each MWh of electricity generated and sold to the grid. In the majority of cases, the projects utilise proven technology such as Solar PV, On-Shore and Off-Shore Wind, together comprising c.96% of the CfD allocation within AR 6.
Construction and availability risks are both borne by the developer. While offshore wind generation can be reliably estimated, heat networks depend on gradually increasing connections over time, introducing demand uncertainty. With Solar PV and On-Shore and Off-Shore wind generation, capacity broadly remains the same over the operational life of the asset. For these reasons, a CfD may not be an appropriate mechanism at this moment in time for managing the demand risk associated with heat networks, which is currently a key inhibitor to the deployment of more private sector funding.
CfDs could however play a role in providing revenue support to those heat networks seeking to utilise decarbonised heat sources (other than industrial waste heat or heat from energy from waste plants). This type of mechanism could incentivise the transition from fossil-based heat sources (e.g. gas boilers) to more sustainable forms of heat generations (e.g. heat pumps). At present, residential customers are unlikely to be able to afford the increase in the cost of heat compared to conventional gas boilers or heat networks using waste heat.
Household water & sewerage undertakers – RAB-based Model
The RAB model utilised in the water sector, in conjunction with the associated price reviews, has proven to be an effective mechanism for encouraging investment and securing funding from the capital markets. This approach provides a tried and tested framework for recovering the costs of the investment over a period of time. This in turn encourages utilities to embark on much needed infrastructure development. Ofwat is also looking at new mechanisms such as Direct Procurement for Customers (DPC) for much larger scale capex projects.
Integral to the regulation and application of the RAB based model, is management of the inter-generational risk of customer charges. This means today’s customers should not feel any greater financial burden from new investment than the customers in the future. In the water sector, utilities still bear the risks associated with inflation, construction and operation costs, interest rates and to a lesser degree demand and bad debt risk within England and Wales.
The RAB model is widely used across sectors where revenue forecasting is relatively stable due to low demand risk. However, demand risk is highly uncertain for heat networks as a result of the uncertainty of connections. A key risk for potential investors is the heat network sector’s inability to manage demand risk and therefore a RAB model-based approach may not be a viable solution in the short term to incentivise investment. A RAB model could, however, play a key role in the regulation of the sector once it achieves critical mass and the impending regulation of the sector has had sufficient time to evolve and prove effective in the sector.
Key considerations for any RAB model are the resources and time required to regulate a sector effectively. The model and associated regulation works effectively in the water sector not least due the limited number of water utilities (11). Given that the heat network sector will comprise thousands of heat networks of various sizes, a RAB model may not be practical for all projects unless projects are first consolidated on a regional basis, or are subject to a minimum MW size requirement prior to utilising a RAB model. We do understand, however, that the impending regulation of the heat network sector will focus on tariffs (regarding Value for Money) and customer service, but it is unclear whether this will extend to a RAB-based model approach.
Carbon Capture, Utilisation and Storage (CCUS) – RAB Model and revenue support
The CCUS programme comprises T&SCo projects and carbon capture technologies developed at industrial and Energy from Waste (EfW) facilities. They are at a very early stage in the development cycle and as such referred to as FOAK projects. Furthermore, CCUS projects are not only exposed to technology and construction risk (i.e. the technology is considered unproven at such scale) but also are exposed to significant demand risk as industrial and waste emitters decarbonise over time. Such connections to the T&SCo infrastructure are therefore uncertain. Heat network technology is relatively tried and tested, but the issue of timing and quantum of connections is the same dilemma for both the heat network sector and CCUS. The CCUS sector has had to adapt its regulatory framework to address the issue of “demand risk” not mitigated by utilisation of a RAB model alone. A combination of RAB model and revenue support helps mitigate demand risk within CCUS.
This could potentially be largely replicated within heat networks, in particular to support the upfront capital expenditure. However, were this method to be adopted, extensive regulatory and legislative discussions would be required to ascertain a suitable counterparty to the revenue support mechanism. Furthermore, the positioning of who bears bad debt risk would need to be established. However, this risk is generally accepted within the water sector and arguably should be no different for heat networks. While this combination of regulatory support is planned for CCUS, it remains an untested regime with the potential for inefficiencies. This is particularly the case for heat networks given the limitations of a RAB model identified above.
Alternative regulatory structures for heat networks could include offering grants to offset upfront costs and revenue support mechanism to mitigate demand risk. This and other combinations of mechanisms, such as a cap on payments to reduce the risk of over-incentivising, could incentivise investment in heat networks without too great a departure from regulatory norms.
Renewable Heat Incentive (RHI) specifically for heat networks
It may be possible to develop a RHI specific to heat networks. This could bridge the price gap between gas and electric networks whilst encouraging investment. The RHI was a UK Government financial support scheme designed to encourage the uptake of renewable heat technologies. Since 31 March 2021 it has been closed for new applicants. A similar type of incentive for the deployment of heat networks would aim to promote the development and expansion of the sector and could include the features listed in Table 4.
Table 4: Summary of features for a potential RHI-type heat network incentive
|
Feature |
Description |
|---|---|
|
Tariff payments |
Operators or users could receive periodic payments based on the amount of low carbon heat generated and supplied per MWh, which could be guaranteed for a period of time (usually quarterly payments over 20 years) to improve financial viability of projects. |
|
Eligible technologies |
The incentive could cover a range of renewable heat generation technologies that can be integrated into heat networks. |
|
Tiered tariffs |
A tiered tariff structure to encourage efficient operation which pays a higher rate up to a certain level of heat output and a lower rate beyond that could be implemented to incentivise operators to size systems appropriately and manage demand. |
|
Upfront capital support |
In addition to ongoing tariff payments, grants or loans to aid cover upfront capital expenditure would reduce the financial barriers to entry. |
|
Performance standards |
To qualify for the incentive, certain performance and efficiency standards would have to be met. |
|
Metering and monitoring |
Accurate metering of heat production and consumption would be required in order to calculate incentive payments. |
|
Support for innovation |
Additional funding could be made available for projects which demonstrate new technologies or business models helping the sectors development. |
An RHI-type incentive in heat networks would aim to stimulate market growth and help achieve net zero emissions through the integration of carbon-based fuels to renewable energy. It could provide a financial impetus for the adoption of heat networks and making them an attractive option for developers, local authorities and consumers particularly if coupled with grants.
Stakeholder insight
This section summarises stakeholder feedback from the stakeholder interview exercise. The methodology underpinning this exercise is set out in Section 3.3. Stakeholder feedback also informed conclusions in other sections of this report, including:
- Overall views and attractiveness of the sector
- Key investment risks
- Key initiatives that are required to move to a predominantly privately financed model
The private sector views heat networks as an attractive investment opportunity. However, there are areas of uncertainty that must be resolved, including the need for greater clarity on the development of future regulation. To facilitate private investment, stakeholders highlighted the need for continued grant funding support (which will help de-risk project cashflows), clear regulation on key areas such as zoning and mandatory connections, and clear direction on future policy banning carbon-based heat systems. Table 5 below summarises the detailed views of each stakeholder group.
Table 5: Stakeholder Engagement Summary
|
Stakeholder Group |
How attractive is the sector? |
What are the key sector investment risks? |
What are the key initiatives that are required to move to a predominantly privately financed model? |
|---|---|---|---|
|
Capital orientated stakeholders | |||
|
Operators |
Operators see significant interest from private infrastructure investors. However, there are concerns that private sector investment may move to other asset classes if the government does not provide certainty on future regulation and continue to financially support the sector. | The main observations from operators were: |
|
|
Private capital / infrastructure funds |
The sector is attractive to investors, with stable recurring cashflows. There is a clear growth opportunity in the UK. | The main observations from private capital stakeholders were: |
|
|
Policy Banks |
The sector is an attractive investment opportunity however the current market is lacking large commercially ready projects where policy banks can invest. |
|
|
|
Non-capital orientated stakeholders | |||
|
Commercial Advisors |
Established heat networks are viewed favourably by the private sector. The characteristics are similar to a bond therefore attractive to institutional investors. | Observations from commercial advisors included: |
|
|
Legal Advisors |
Less appetite from lenders in early-stage heat networks due to uncertainty of payback. | Key observations from legal advisors included: |
|
Private capital and operator stakeholders were also asked specific questions regarding financial returns, types of financing, key financial metrics and shareholder structure. A summary of responses for each subcategory is provided below.
- Rates of return: Stakeholders gave a consistent view of the minimum internal rate of return (IRR) requirement range for heat network developments. This was between 8% and 12% depending on a project’s specific risk profile (which can vary significantly). For example, established trunk/core developments can have lower IRR where demand assurance and contracted revenues are satisfied, while a higher IRR is required on expansions to make the developments feasible and appropriately mitigate risk.
- Types of financing: Stakeholders unanimously agreed operators would likely use their own balance sheet for financing the short to medium term. Private Equity funds and infrastructure funds would predominantly continue to use equity to invest in the heat network sector. For the reasons outlined in earlier sections, the existing barriers around demand and revenue uncertainty limits debt investment in the sector.
- Financial metrics: Stakeholders noted that they have certain size requirements when investing and deploying capital. For those stakeholders investing in the sector, the minimum investment required ranged from £10m to £25m+. These stakeholders highlighted this can limit their involvement in Scotland as, compared with rUK, there are fewer projects that meet their investment scale requirements. However, stakeholders did say this issue could be mitigated by investing in multiple projects rather one large project.
- Scale: Similarly, stakeholders commented that rUK offers more opportunity due to the number of large city scale projects available. Scotland offers significant potential for large city scale networks but the greater number of cities and urban areas in the rest of the UK is more appealing as it offers more connection opportunities and a greater customer base.
- Shareholder structure: Private capital and operator stakeholders were open to collaborating with Local Authorities in a Joint Venture structure; however, they flagged key legal areas that would need additional scrutiny. For example, clear roles and responsibilities regarding asset risk and reward.
As illustrated by the stakeholder engagement, stakeholder subgroups all highlighted similar risks and themes and what support mechanisms exist for the heat network sector. The engagement exercise identified key issues and barriers that must be addressed to attract private sector investment. The exercise has therefore helped inform our recommendations as set out in the next section.
Recommendations
Summary
The evidence from this report indicates that the Scottish heat network sector is still maturing and, in the short to medium term, requires significant financial support from the public sector. In the medium to long term, we also recommend models for securing private sector finance and for scaling and speeding up the roll out of large heat networks in Scotland.
Figure 11 summarises our recommendations, indicating the suggested timeframe and expected impact of each.
Figure 11: The impact of mechanisms over time
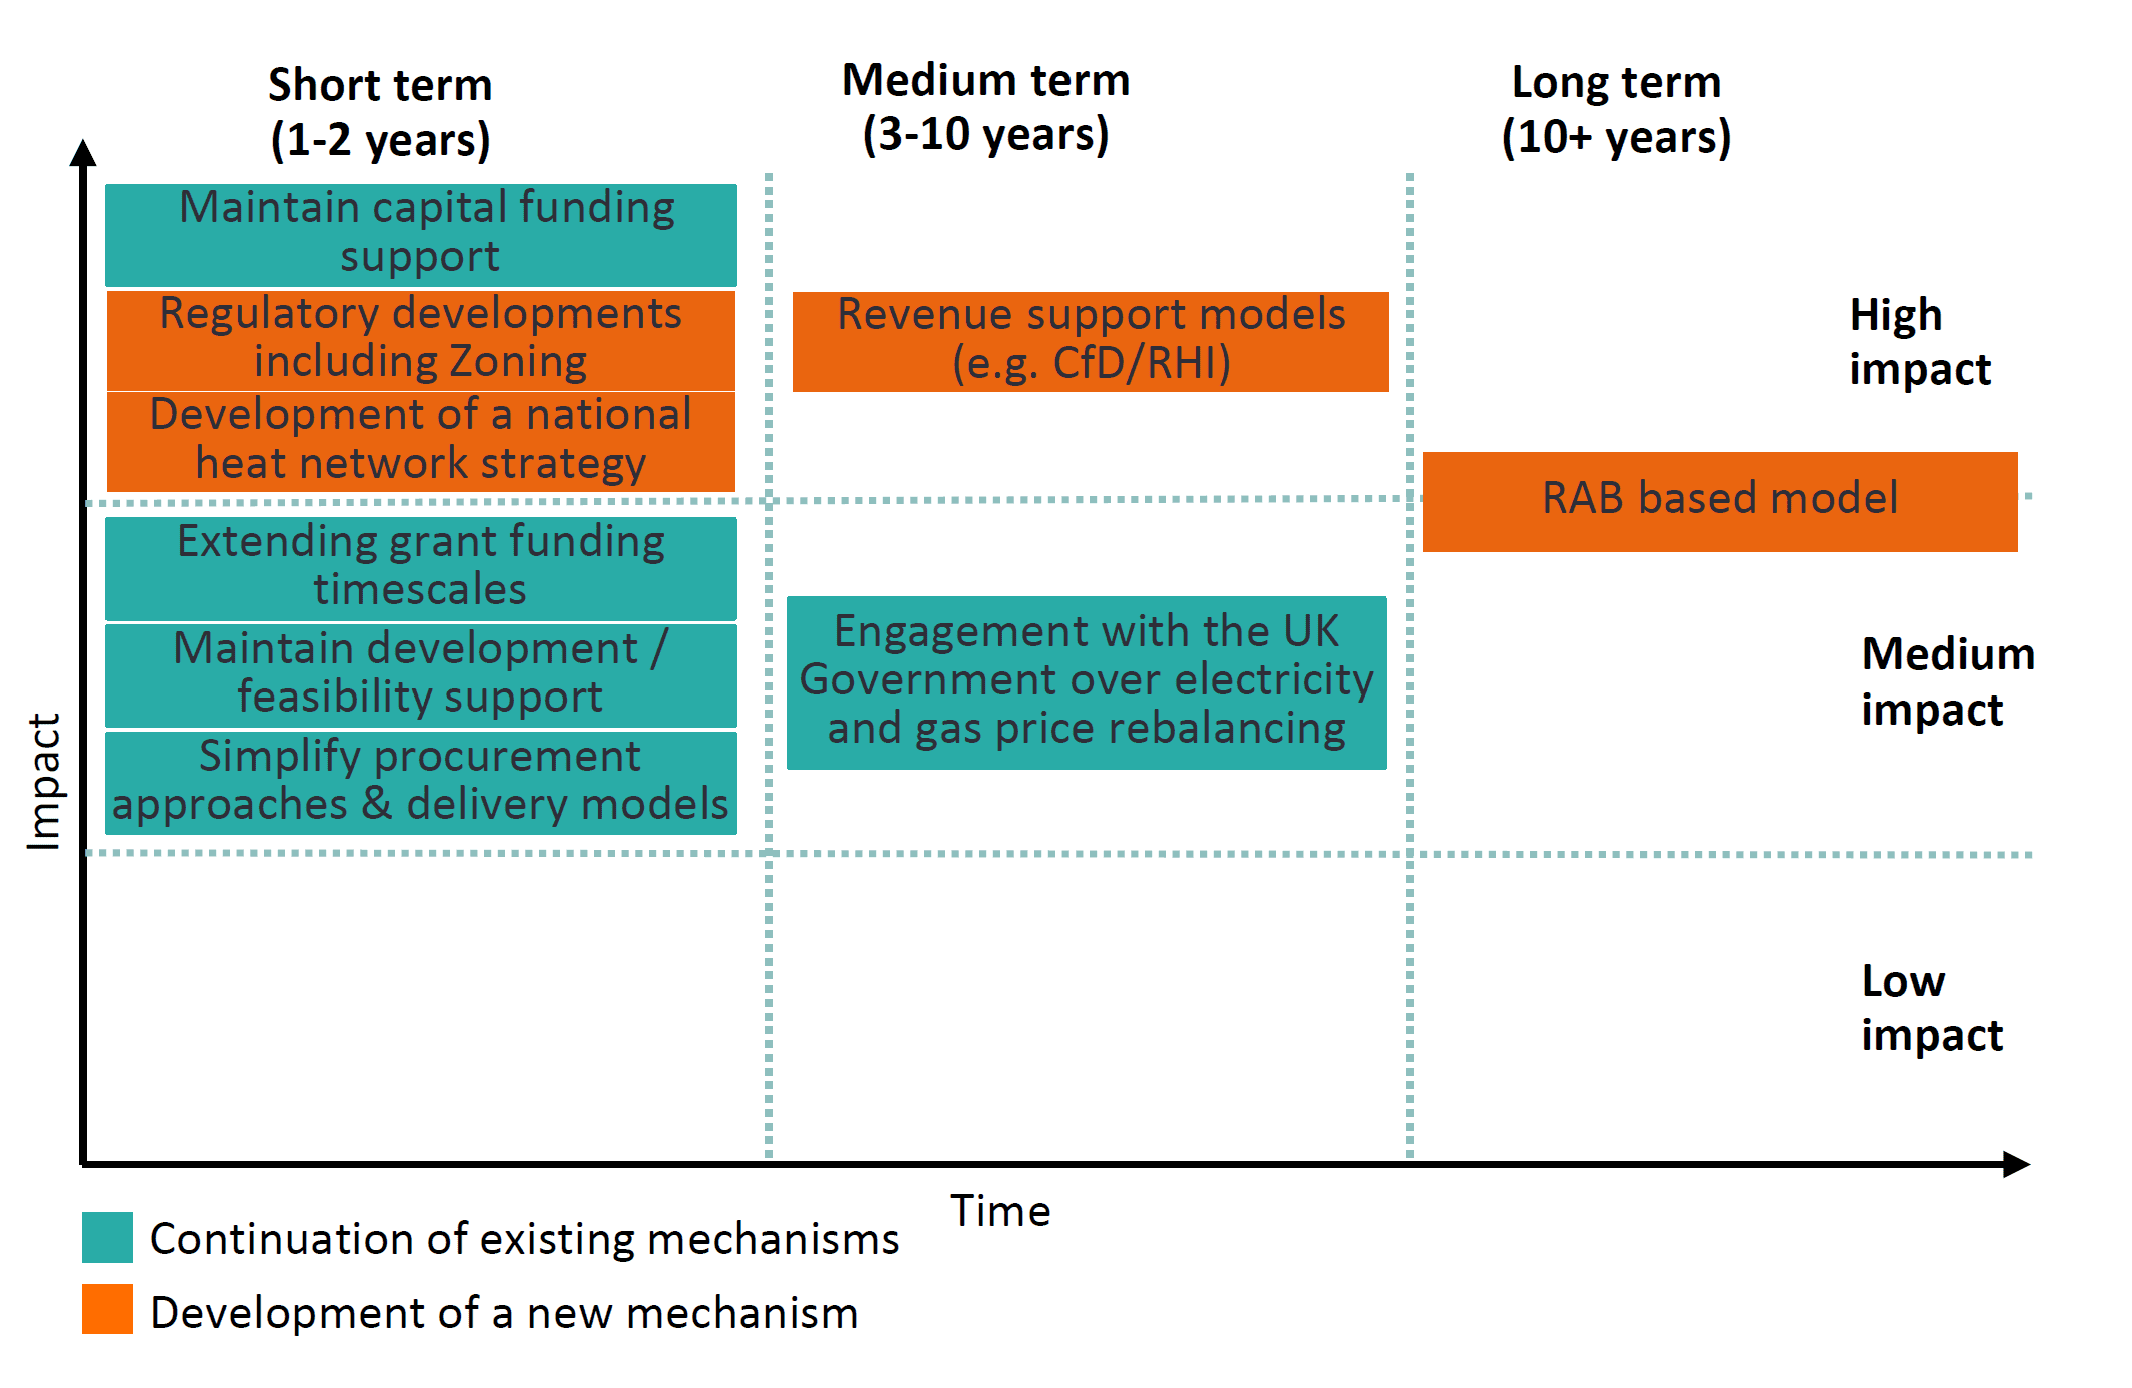
Recommendations for rollout of mechanisms or policy initiatives
The recommendations are explored in more detail below.
Recommendation 1
The Scottish Government should maintain capital funding support for the sector through existing programmes or new bespoke capital schemes. The Scottish Government should also explore opportunities for extending grant funding drawdown timescales.
Timescales – short to medium term e.g. 1-10 years
This recommendation addresses barriers related to high capital costs, demand uncertainty and long development and construction times.
- Stakeholders unanimously agreed that the large-scale deployment of heat networks requires continued public support. There is also precedent from other emerging countries to support the sector in this way.
- Future grant funding programmes must reflect a heat network’s significant development and construction timescales. The Scottish Government aims to avoid piecemeal developments and the development of large-scale heat networks can be significantly longer than the existing grant funding windows. Although cross party support for the sector exists, the Scottish Government could consider secondary legislation which extends timescales. This would provide long term certainty to the market. However, we recognise government funding and budgetary restrictions will make this challenging. We also note that current schemes have open funding windows and seek to create as much flexibility as possible for applicants. Further sub-recommendations could also be considered including:
- Reducing intervention rates. The level of grant support is subject to numerous factors, but any grant support should be sized to provide developers with a reasonable project IRR (noting that this is already standard practice). This will help support a greater number of projects, with lower levels of capital. There is precedent from the GHNF for lower levels of support, but differences between the GHNF and SHNF must be considered (including the varying volume of applications received through both programmes and different assessment criteria).
- Targeting intervention at specific geographical areas or aligning with local regional strategies. This could include aligning support to regional zoning activity or targeting support at specific geographic areas where there are significant opportunities for future heat networks.
- Target grant funding in other ways, for example, to support connection fees and/or enabling costs for end users of new residential areas. There is international precedent for this, including grant support to incentivise anchor loads. Further support for the public sector to meet connection fees could also be considered. Public Sector enabling costs are already supported through the Green Public Sector Estate Decarbonisation Scheme.
- Grant funding could be exclusively targeted at district heating projects rather than smaller communal heating schemes.
Recommendation 2
Our review has found that de-risking future revenues is key to unlocking HN development – private capital is available for projects of this scale, but it must be financeable. Our initial analysis therefore concludes that more detailed analysis of a revenue support model, such as Contracts for Difference (CfD) or a Renewable Heat Incentive (RHI) equivalent, is merited. However, the Scottish Government must address the challenges of establishing such schemes, described below.
Timescale – Medium 5+ years
This recommendation addresses the barriers associated with demand uncertainty.
In section 6 we review the benefits of these models in the context of other relevant utility sectors. However, there are additional factors that the Scottish Government must consider before pursing this further. For example, it must consider the significant administrative and resource costs of establishing such schemes. Additionally, constrained revenue budgets mean that the creation of a new revenue model will represent a significant budgetary challenge for the Scottish Government. Lastly, with differences in regulation, policy and powers, the Scottish Government must also consider how a revenue model could be introduced in isolation from the rest of the UK. Additional CfD and RHI considerations are summarised below:
- Contracts for Difference – Although this is a well-established model, certain complexities must be resolved before it can be deployed in the sector:
- Calculating a reference price – heat prices are bespoke, and cannot be benchmarked to a national market price, unless there is regulation on the price of heat. This must be explored further before the model can be introduced.
- Generation versus consumption – a CfD should be based on the generation of heat, rather than consumption of heat. This will help mitigate demand risk, as the model is not reliant on future unknown connections to the heat network.
- The CfD could also subsidise the additional capital cost of installing expensive clean heat network technology.
- Additionally, the higher cost of underlying electricity (compared to gas) could be mitigated and passed on to customers thereby reducing price risk. However, before introducing an alternative mechanism to grant funding, the CfD cost (compared to the level of grant) must be further understood.
- RHI model – The RHI model is another well understood revenue support model, which has previously been used in the heat network sector. However, previous RHI schemes have been criticised, for example, the National Audit Office stated the UK Government did not achieve value for money.
RHI subsidises the cost of heat generated from clean heat networks, compared to alternative forms of heat generation. However, complexities remain that must be addressed before it can be deployed:
-
- Generation versus consumption – Similar to CfD, an RHI model would need to be based on the amount of heat generated, rather than consumption of heat, and would therefore act as a contribution to the cost of deployment. It would help to address the increased cost of installing a more expensive heat network technology, and at the same time mitigate demand risk.
- A payment cap could be introduced to avoid over-incentivisation within the sector.
- Before adopting an alternative to grant funding, the RHI cost (compared to the level of grant) must be thoroughly assessed.
Recommendation 3
Following further regulatory developments and the creation of an established asset base (possibly 10-15 years), the Scottish Government could explore the benefits of implementing a RAB model.
Timescale – Long term e.g. 10 years +
This recommendation addresses barriers associated with consumer experience and regulatory uncertainty.
- The RAB model (coupled with price reviews) has been shown to be helpful in protecting consumer prices whilst encouraging ongoing investment and maintaining assets.
- However, the cost and resource implications of administering RAB models across a large number of very diverse projects will be significant. This may be mitigated through minimum generation requirements, but this must be explored further. EY and many stakeholders agreed that a RAB model may be appropriate / beneficial in 10-15+ years but only after certain market characteristics are met.
- The Scottish Government must assess the feasibility of developing a Scottish RAB model, which may diverge from the approach in England and Wales.
- A transition from one regulatory mechanism to another could occur in the future. However, for this to occur, the sector must mature and must focus on large scale capital investment. This will impact whether a RAB model alone could be introduced to provide consumer protection or whether it will need to be supported with a revenue support mechanism. Furthermore, the market must be economically feasible (meaning the sector is more mature and financially viable) to regulate the assets themselves prior to introducing a RAB model.
- Importantly, without capital or revenue support, a RAB model will not by itself result in a financially viable heat network. It would therefore need to be coupled with other support mechanisms, as pioneered by CCUS. This reinforces the requirement to pursue short term sector support, including public sector capital funding.
Recommendation 4
SNIB and the UK National Wealth Fund are committed to investing in the sector. The Scottish Government must continue to work closely with these organisations in order to explore investment opportunities, create a shared understanding of each party’s objectives and ultimately unlock the capital that has been made available to invest.
Timescales – short term e.g. now -1 year
This recommendation addresses the barriers associated with access to funding.
- The Scottish Government must also consider infrastructure bank restrictions, including who they can support (e.g. local authorities) and minimum lending requirements.
Recommendation 5
The Scottish Government should maintain and increase support for pre-construction projects, via the Heat Network Support Unit (HNSU) and specific development funding programmes.
Timescales – short term e.g. 1-2 years
This recommendation addresses the barriers associated with access to funding.
- To support the sector’s development a strong pipeline of projects is required. In Scotland, and across the UK, there are a growing number of pre-construction projects that require commercialisation support.
- All stakeholders commented on the need for improved funding to develop heat networks until there are sufficient cashflows enabling networks to support themselves and attract other forms of funding.
- This could include expanding the role of the HNSU to take a more active development role similar to the UK Government’s Heat Network Delivery Unit. However, the HNSU would require additional resources and financial support before it could expand its remit.
- The Scottish Government could also consider engaging with national development banks, e.g. SNIB or the NWF to co-develop development funding programmes.
Recommendation 6
The Sottish Government should monitor the implementation of the UK Government’s zoning approach, and where appropriate, leverage best practice from DESNZ. This should be used to compliment Scotland’s existing zoning approach.
Timescales – short term e.g. 1-2 years
This recommendation addresses the barriers associated with demand uncertainty.
- Robust zoning regulations, with mandatory connections will help reduce demand risk and support private sector investment. Ultimately this will support the roll out of larger heat networks at scale by reducing demand uncertainty for operators and investors.
- Regional Zones, across local authority boundaries, could be used to identify area of high heat demand, and key heat sources.
- These proposals could leverage the Advanced Zoning Programme (AZP) model adopted by DESNZ, where pilot heat network zones have been identified to supply.
- The HNSA creates the opportunity for local authorities and the Scottish Government (in some cases) to designate zones. This should be explored in more detail, including the number of zones required in Scotland. The Scottish Government could also use this route to create larger strategic zones across Scotland.
- However, zoning proposals must account for heat costs and the risk that consumers are forced to connect to a heat source that is more expensive than alternatives.
- The Scottish Government must also consider that its limited resources will reduce its ability to replicate the regulatory developments in England and Wales.
Recommendation 7
We recommend that Scottish Government reviews its regulatory approach to help reduce regulatory uncertainty, simplify delivery and align with the wider UK framework where appropriate.
Timescales – short term e.g. 1-2 years
This recommendation addresses the barriers associated with regulatory uncertainty.
- The introduction of secondary legislation, including further details on consenting and authorisation, will help to reduce the existing uncertainty in the market.
- The lack of standardisation in procurement approaches and delivery models adds complexity, time and cost to a project’s development timeline. The Scottish Government should accelerate its activity to provide more clarity to the market. The UK Government is also developing its delivery models. The Scottish Government could consider aligning with the UK Government approach to ensure a consistent landscape for the private sector.
- As part of the Advance Zoning Programme for Heat Networks in England, DESNZ issued template delivery model guidance for the procurement of Heat Network delivery partners. The purpose this is to assist project sponsors in the identification of opportunities for the acceleration of the scale and pace of zonal heat network delivery. Template documentation provides greater clarity in the marketplace leading to quicker and more effective procurement processes, improving market appetite and reducing bidder fatigue. The guidance for the promoters of AZP projects sets out the principles of three potential delivery models and sets out the characteristics to consider when determining the delivery model to adopt. This includes Development Agreements, the Golden Share and Co-investor models.
Recommendation 8
We recommend that the Scottish Government continues to work with the UK Government on rebalancing electricity and gas prices; however, this will not eliminate the price difference between electricity and gas.
Timescale – Medium 5+ years. However, the Scottish Government does not have the developed powers to implement this recommendation by itself, and therefore further discussions with the UK Government are required.
This recommendation addresses the barriers associated with structured pricing challenges.
- The UK Government is continuing to explore opportunities for rebalancing electricity and gas prices, to reduce electricity costs and support the affordability of clean heat networks for consumers. This initiative is not a devolved matter, so the Scottish Government should continue to work with the UK Government on the proposals. If unsuccessful, a revenue support model should be considered as an alternative to address pricing risk.
Recommendation 9
The Scottish Government should develop a national Heat Network Strategy setting out a long-term vision for Scotland’s heat networks.
Timescales – short term e.g. 1-2 years
This recommendation addresses multiple barriers.
- Not only will this help provide further clarity and confidence to the private sector, but it will also help to educate and explain the benefits of heat networks to the wider Scottish public.
- This view was shared by specific stakeholders and mirrors the recently published Scottish Renewables Heat Network Vision.
- This strategy could also leverage the Scottish Futures Trust (SFT) analysis on sector delivery models which could accelerate the pace and scale of heat network deployment in Scotland.
- Additionally, the strategy should provide:
- Clarity on national and regional Heat Network implementation, crossing local authority boundaries.
- A strategy for future public sector support, including where and how grant funding, should be targeted. This should also include Scottish Government’s external commitment and its ability to invest in the sector.
- Inform the ongoing development and implementation of regulation.
- Plans for engaging with the UK Government on recommendations reserved to the UK Government, e.g. structural pricing plans.
Appendices
Appendix A – Financing mechanisms
There are a number of financing mechanisms that the Scottish Government could utilise to help de-risk heat network investments. These mechanisms, or “financial levers”, could increase the attractiveness of heat network projects to private investors and ultimately increase the pace and scale of their deployment. They may achieve this through reducing investment hurdle rates (by decreasing risk), increasing gearing levels to reduce the overall cost of capital and/or improving the project’s IRR to meet the investors’ thresholds. However, the need for these levers and the decision on which (if any) to employ, will vary from project to project and these factors should be assessed as part of the financial structuring of a project.
The financial levers available to Scottish Government can be broadly grouped into the following categories:
- Capital funding;
- Revenue funding;
- Investment; and
- Business model support.
The need for these levers and the decision on which (if any) to employ, will vary from project to project and these factors should be assessed as part of the financial structuring of a project. This section will summarise the key elements of these funding mechanisms and discuss their implications for resource demand, balance sheet treatment and exist strategy.
Capital funding
Capital funding uses capital budgets to provide gap funding for heat networks. This may be in the form of, for example, a capital grant or repayable assistance.
Capital grant
Capital Grants are allocated to fund activities aligned with government priorities, benefiting public or private entities that contribute to specific public outcomes. These grants come with conditions that must be met to avoid repayment obligations. In Scotland, Repayable Assistance is typically preferred over Capital Grants for heat networks, with the possibility of repayment if profitability exceeds expectations. Administering Capital Grants demands significant resources, particularly during application assessment, construction monitoring and post-commissioning for a period of 3-5 years. The treatment of Capital Grants on balance sheets depends on various factors, including the grant’s size and terms, which may affect asset classification. After fulfilling all grant conditions, the grantee is released from obligations, but the grantor may benefit from maintaining a relationship for continued data access and to support future expansions.
Repayable assistance
Repayable Assistance functions similarly to Capital Grants, with the distinction that it must be repaid partially or in full if the project exceeds certain performance-related thresholds in the initial years of operation. This mechanism is designed to prevent grantees from benefiting excessively from public subsidies. Managing Repayable Assistance requires additional resource to evaluate and challenge financial returns and reports from grantees. The treatment of Repayable Assistance on the balance sheet is comparable to that of Capital Grants, with the classification determined by the delivery model, the proportion of Repayable Assistance to total capital costs of the project and the terms of risk allocation. The exit strategy involves ceasing monitoring once grant conditions are satisfied, which may take longer than for Capital Grants.
Revenue funding
Certain financial levers utilise revenue budgets to fund heat networks, such as revenue grants, heat purchase agreements (or demand guarantees) and outcomes-based funding.
Revenue grant
Revenue Grants fund activities that support government priorities and public benefits, with both public and private entities eligible as grantees. In Scotland, Revenue Grants have often been combined with Repayable Assistance and, from an investor perspective, can help mitigate revenue risk which is one of the most significant barriers to heat network investment. The grants, which are not typically repayable unless certain grant conditions are not met, can be performance-linked to ensure drawdowns align with financial need. The administration of Revenue Grants can be resource-intensive, as they require stringent monitoring across the project lifecycle. The treatment of these grants on government balance sheets is influenced by several factors, including the grants’ size and the delivery model. After fulfilling grant conditions, which may take many years, the grantor’s monitoring ceases, but a continued relationship with the grantee can be beneficial for gathering data and supporting future expansions.
Heat purchase
Heat Network developers require a level of assurance to ensure there will be a sufficient customer-base to make their investment viable. This assurance is crucial as it influences the decision to invest and the capacity to future-proof networks for anticipated demand growth. Anchor loads (significant heat demands that are likely to be the first connections to the heat network, typically large public buildings with sustained high heat demand) are essential for making networks investable. The Scottish Government could provide demand assurance through mechanisms such as Heat Purchase Agreements, where public buildings are offered as anchor loads without a guaranteed minimum demand and Demand Guarantees, which involve a “take or pay” commitment for a minimum quantity of heat.
These agreements require resources for due diligence, negotiation and ongoing monitoring, often requiring specialist expertise and governance to effectively manage the associated risks. The balance sheet treatment of these agreements may lead to on-balance-sheet classification of project assets, if risk transfer is diluted. The exit strategy for such agreements is to have a fixed contract term, after which they can be re-procured or renegotiated, with “take or pay” guarantees being time-bound and including withdrawal clauses under certain conditions, such as when sufficient third-party demand is secured.
Outcomes based funding
Outcomes based funding is a financial mechanism that focuses on achieving specific, pre-agreed outcomes rather than outputs. It operates on the principle of “payment by results”, where organisations (typically local authorities, though could also apply to a private company) invest in infrastructure to deliver set outcomes. If these outcomes are met, Scottish Government would make regular payments over a set period, reflecting the pre-agreed value of the outcomes achieved. For example, these outcomes may be successful commissioning of the heat network, the number of heat network connections, carbon savings and/or the social value created. This model shares risk between the organisation and the government, however it is resource-intensive, requiring careful project selection, development and ongoing monitoring to ensure that the agreed outcomes are met. While it may not be efficient for smaller projects due to the resources needed for monitoring, Outcomes Based Funding can support infrastructure without being classified on the Scottish Government’s balance sheet, if the delivery risk is fully transferred to the grantee. The monitoring period is predefined, often spanning 20-25 years, with revenue payments contingent on achieving these outcomes.
Investment
Equity
Special Purpose Vehicles (SPVs) are often formed for infrastructure projects. SPVs allow for project assets and risks to be held within the vehicle itself and enable investors to make more targeted investments into specific asset classes that align with their desired risk/return profiles. SPVs require one or more shareholders to own the company, appoint its board of directors and provide the necessary funding, typically through equity or shareholder loans as subordinated debt. These SPVs can be solely owned by one entity or jointly owned by multiple organisations, which may include a mix of public and private sector shareholders and can also take the form of corporate joint ventures.
The Scottish Government can participate in SPVs as an equity investor, either independently or in collaboration with private sector partners. This model affords Scottish Government a degree of control over the project’s strategic direction and the opportunity to share in the profits, but also exposes government to the associated investment risks. In heat network projects, government might invest in the network’s distribution assets and later recoup this investment through ‘use of system’ fees from other parties utilising the network. Managing such equity investments requires a long-term commitment and specialised expertise in investment structuring, due diligence and governance, ensuring that the government’s interests and public funds are appropriately safeguarded. The impact of these investments on the government’s balance sheet is influenced by the degree of control the government has as a shareholder, the size of the equity stake and the risk transfer mechanisms in place. In terms of exit strategies, the Scottish Government could sell its equity stake in the SPV once the project reaches a stage of profitable operation, allowing for the recycling of capital into other projects.
Debt finance
Debt finance is a financing mechanism where the government lends money to public or private sector borrowers, who are then obligated to repay the loan with interest according to the terms set out in a loan agreement. There are three key features of debt financing: the seniority of the debt, which determines the order of repayments from project cash flows between debt and equity holders; the security of loans, which may be secured or unsecure; and financial covenants that serve as safeguards for the lender by monitoring the borrower’s financial health and triggering repayment in case of covenant breaches.
Scottish Government could establish a revolving loan facility aimed at supporting projects during their riskier construction and early operational stages, with the possibility of refinancing by the private sector once more stable operations are achieved. This approach facilitates the recycling of capital into new projects and aligns with the preferences of long-term investors seeking lower-risk opportunities. Administering such finance requires significant resources for project selection, development and monitoring, with the balance sheet treatment determined by factors such as loan terms, size and risk. The exit strategy allows for the recovery of investments through repayments or refinancing, potentially leading to capital receipts that can be reinvested or the sale of loan portfolios to investors, thus enabling ongoing economic development.
Loan guarantee
A Loan Guarantee by the Scottish Government provides a safety net over debt repayments to lenders, covering either the entire loan or a portion, with the aim of reducing the cost of capital for borrowers, such as heat network developers. This can make investments more feasible and enable access to loans that might otherwise be unavailable due to risk considerations. While initially having limited budgetary impact, provided the risk of the guarantee being called upon is low, there are Subsidy Control implications that may be offset by charging a fee for the guarantee. Implementing a Loan Guarantee scheme requires resources for design, project assessment, due diligence and ongoing monitoring, requiring specialist expertise and governance to manage financial and reputational risks. The balance sheet treatment of a Loan Guarantee is influenced by various factors, including the delivery model and the size and terms of the guarantee. The Scottish Government’s exit strategy involves offering guarantees for a specific term with withdrawal clauses, allowing for the possibility of refinancing and withdrawing the guarantee once the project is operational and profitable.
Business Model Support
This section outlines common business model support mechanisms in the UK, such as Regulated Asset Base, Cap and Floor and Contracts for Difference, which could potentially be adapted for heat networks. These Business Model Supports would draw upon revenue budgets to heat networks. While these models are theoretically adaptable, they face significant challenges that require careful consideration to tailor them to the heat network sector.
Regulated asset base
A RAB is a regulatory framework that measures the capital used in a regulated entity, where companies are granted a licence by an economic regulator to charge users regulated prices for services linked to an infrastructure asset (operating on a “user pays” model). The regulator sets or caps the charges that the operator can levy for a certain period, reducing pricing risk for investors and ensuring charges allow for the efficient recovery of costs incurred by the operator in the interest of customers. Charges can be controlled through a revenue cap, which protects investors from both price and market existence/demand risk, or a price cap, which only shields from price risk.
Hybrid RAB models, combining a price cap with government cash injections, are being explored for Carbon Capture, Transport and Storage infrastructure to mitigate market existence/demand risk. The RAB operator’s prices are calculated to enable recovery of operating expenditure, depreciation costs and an allowed return on capital, balancing risk reduction for investors with cost-efficiency incentives. Charges are reviewed and reset periodically by the regulator in consultation with the operator and customers, protecting investors from subsidy risk within each regulatory period. If applied to heat networks, a RAB model could significantly shield investors from price and market existence risks. However, current regulatory and policy frameworks for heat networks are not conducive to the model’s deployment at this time.
Cap and floor
The cap and floor mechanism aims to offer investors a degree of revenue certainty while maintaining incentives for efficient operation. The floor guarantees a minimum revenue, covering at least operating costs and senior debt service, thus limiting investors’ risk and enabling financing. Conversely, the cap sets a maximum revenue, with any excess being repaid, limiting the investors’ returns.
A revenue sharing arrangement can be incorporated, where excess revenue is split between investors and user/taxpayers, rather than being fully retained by investors or returned to funders. The mechanism’s terms, including cap and floor levels and the applicable period, are contractually agreed, reducing subsidy risk as the support cannot be abruptly withdrawn. This arrangement mitigates price risk and market existence/demand risk by assuring minimum revenue, independent of demand, although it does not protect against cost variability.
Currently utilised by Ofgem for financing electricity interconnectors and considered for electricity storage in the UK, the mechanism is funded by electricity users or, alternatively, could adopt a ‘taxpayer pays’ model with government involvement. For heat networks, while ‘Cap and Floor’ offers some risk protection, it requires careful implementation to avoid disincentivising network operators from acquiring new customers or charging competitive rates. Additionally, the ‘taxpayer pays’ model could lead to significant financial exposure for the Scottish Government.
Contracts for difference
CfDs are a support mechanism that offers investors a fixed, contractually agreed ‘strike price’ per unit of output. This helps to mitigate potential subsidy risk for investors due to the subsidy being a binding, contractual obligation. The strike price may be fixed or index-linked and CfDs can be signed with the government or a government-backed third party, with funding from taxpayers or users. The ‘reference price’, generally the market price, determines the subsidy level during each CfD period, with investors receiving a subsidy if the market price is below the strike price, or paying back if it’s above. This support incentivises operational efficiency, as investors are exposed to cost variability risk and only receive support once the project is operational.
Although CfDs are used extensively for renewable electricity generation in the UK, applying this mechanism to heat networks poses challenges. It is difficult to define a reference price due to the absence of a wholesale heat market and the localised nature of heat network pricing, which relies on local factors such as the availability of low carbon heat sources and customer demand. Without regulated heat pricing or an accepted methodology for setting a wholesale price, the application of CfDs to heat networks remains complex.
Appendix B – International experience supplementary information
The supplementary narrative below provides a brief historical overview, a summary of the public financing levers available and a summary of the regulatory framework for each country. Additionally, the supplementary narrative is followed by additional information regarding the use of state-owned infrastructure banks.
Rest of the UK (rUK)
Overview
Heat network technology has been in the UK since the 1950s where the Pimlico District Heating Undertaking was the first true district heat network in the UK. The network connected 1,600 council homes to the waste heat generated by Battersea Power Station. However, heat networks fell out of popularity in the 1980s and 1990s as the UK shifted away from high rise flats but regained attention in the 2000s as energy prices increased and financial investment cases became more attractive[24].
Public financing levers:
The UK Government is aligned with international comparators offering up front capital grants in addition to grants for existing underperforming heat networks to encourage efficiency upgrades. These are as follows:
England and Wales have a designated heat network fund, the GHNF which was set up by DESNZ and managed by Triple Point Heat Networks Investment Management[25]. The GHNF is the next iteration of grant funding succeeding the Heat Networks Investment Project (HNIP) loans. The GHNF aims to provide up to 50% of upfront construction costs with the aim of making projects more investable for private sector. The GHNF initially had £288m of capital available but further funds of £485m has been additionally allocated.[26]
DESNZ has also recently published the Heat Network Efficiency Scheme (HNES)[27] which provides both capital grants to part fund installation and revenue grants to fund procurement or mobilisation of external third-party support to carry out Optimisation Studies. This scheme is targeting existing district heating or communal heating projects in England and Wales that are operating sub-optimally and resulting in poor outcomes for customers and operators.
Regulatory structures
Refer to section 4.2 for the UK regulatory structure overview.
Market ownership
The rest of the UK has a mixed market ownership profile with local authority owned, joint ventures and privately owned heat networks. For example, The London Borough of Enfield own the Energetik heat network, a growing network with its own energy from waste plant providing the heat for the network. Vattenfall own Bristol City’s heat network and work in partnership with Argent and Barnet council[28]. There are also private equity backed heat network developers such as 1Energy backed by Asper Investment who have four projects under development, including the Bradford Energy Network. Local authority budget constraints will mean a continued role for private sector involvement. For example, the UK Government’s routes to market proposals focus on the Concession and Joint Venture models.
The Netherlands
Overview
The Netherlands started exploring district heating in the 1920s, but the sector developed significantly following the 1970s oil crisis which prompted a search for more efficient and sustainable heating solutions. The country has since been expanding its heat network infrastructure, focusing on sustainability and the use of residual heat from industrial processes.
Public financing levers
The Netherlands is expanding its heat network market by providing capital grants for qualifying projects and incentivising individuals to connect to heat network via individual grants.
This includes the Heat Networks Investment Grant (referred to as the WIS programme), which supports the construction of new, efficient heat networks. This €400m programme was open between July 2024 and December 2024 and specifically targeted heat networks that help existing homes transition away from natural gas (capped at €30m available per project). The programme funds up to 45% of capital costs and aims to bridge the ‘unprofitable top’ of heating network investments (the difference between the eligible investment costs and the operating profit)[29]. The subsidy can never be more than 100% of this ‘unprofitable top’. WIS can provide support to full projects as well as individual consumers, as it also provides up to €7,000 for small scale consumer connections.
Regulatory structure
The sector has been regulated in the Netherlands since 2014. The legislation was updated with the 2020 Heat Act 2.0, which outlines the requirements for creating a reliable, affordable and sustainable sector. The Act oversees pricing (including price regulation for smaller customers), licensing, private sector profits and customer protections. The Act also sets price caps to ensure that all heat network operators provide price information in a standard format, allowing for greater transparency to consumers.[30] Regarding tariff setting, the Authority for Consumers and Markets (ACM) ensures that costs for a household with a district heat connection are less than an individual condensing gas boiler.[31]
The Netherlands is also developing the Collective Heat Supply Act which aims to bring the heat network sector into public ownership. The Act will look to incorporate a ‘cost plus’ model where tariffs are based on actual cost plus a reasonable regulated rate of return[32]. However, the Act still needs to finalise ownership arrangements between heat generating companies and operators.
Additionally, the Netherlands mandates connections. Municipalities are required to prepare heat plans for their respective areas. This specifies that new buildings have to be connected to a heat network for ten years as part of a heat plan.31 Furthermore, the Dutch Building Code states that a house will get a mandatory connection to a heat network when the network is within 40 metres.
Lastly, the Netherlands amended the Gas Act in 2018 to ban new buildings from connecting to the gas grid and introduced a new incentive scheme (SDE+). SDE+ provides subsidies to companies which generate renewable energy or reduce their CO2 emissions on a large scale. Similarly, the Netherlands will ban new fossil fuel-based heating systems from 2026.[33]
Market ownership
The Dutch heat network market has a large level of private finance penetration with more than 90% of heat networks managed by private heat companies (partly through Public-Private Partnerships) and less than 10% are owned fully by public sector heat companies. For example, Vattenfall (a Swedish state-owned company), Eneco Energy (privately owned) and Ennatuurlijk (Dutch utility company) dominate the market owning approximately 90% of the country’s district heating networks as heat infrastructure has not yet been separated by law from the production and supply of heat (unlike gas and electricity).[34] As such, in 2022, the Dutch government first considered part nationalisation of heat networks via the Collective Heat Supply Act (WCW) with the intention of protecting public interests such as affordability, reliability and sustainability.[35] The intention is that municipalities could own 51% of the network, to help encourage consumers to stop using gas fired central heating. The Dutch government believe more citizens would be willing to switch to heat networks if they are not forced into a model that requires the use of a private sector supplier.
This initiative was met with hostility from operators. Ennatuurlijk withdrew from development of the regional district heating grid Twente, as they were not clear how their assets and investments would be valued at the end of the transition period. Whilst the private sector supports opportunities to give more important roles to local authorities, there are concerns about losing control of the strategy and operations of the heating assets whilst remaining financially responsible for them.
Details and practicalities are still being refined, but it is envisaged that existing private network operators would be given a 20-30 year grace period to recoup their initial investments made before transferring ownership to municipalities35.
GERMANY
Overview
Germany’s district heating has its roots in the late 19th century, but it became more widespread after World War II, particularly in East Germany. Today, Germany continues to invest in district heating as part of its energy transition, with a focus on integrating renewable energy sources and improving efficiency.
Public financing levers
The German Government supports the development of heat networks up front via feasibility, capex funding and additionally operating cost subsidies for renewable projects. Individuals and building owners are also incentivised via grant funding to upgrade heating or connect and further rewarded for an accelerated transition. The levers include legislation where there is €3bn to support the development of 5th generation heat networks[36]. The previous legislation provided funding covering feasibility (up to 60% of costs) and construction (up to 50%). A new BEW fund provides 50% or €600k and 40% of eligible investment/operating cost subsidy, however this is only applicable to projects with 75% renewable heat sources.
Additionally, companies, landlords of rented family homes and condominium owners are now eligible for financing from KfW (Germany’s state-owned infrastructure development bank) for installing low carbon heating systems or connecting to existing heat networks. The scheme can provide up to 30% of investment costs (plus an additional 5% for more efficient heat pumps)[37]. A €2,500 fixed support payment for efficient biomass heating systems is included and a speed bonus is applied if existing gas or oil heating systems are replaced by 2028. The scheme also can support individual home-owners with up to 70% of costs and municipalities will also be able to apply for support in late 2024.
Regulatory structures
Germany has the largest scale heat network market in Europe (illustrated by Figure 9) but it is unregulated. Instead, Germany has regulated electricity and gas markets and operates in a similar manner to Finland, with oversight from competition authorities. Standard terms and conditions for supply of heat networks are defined by Federal law.
Additionally, Germany amended the Building and Energy Act 2020 in September 2023[38] requiring municipalities to:
- Phase out oil and gas heating systems
- develop heating plans by 2028, including a regional heating approach
- that all heating systems installed in Germany after 1 January 2024 must be powered by at least 65% renewable energy
Initially the amendments will apply to new builds but extend to existing and under construction properties too.
The Local Heat Planning Act (WPG) also legally obliges district heating companies to decarbonise their networks[39]. Therefore, residents within these areas are removed from the transitioning process with responsibilities outsourced to professional entities such as private companies or municipal utilities. The WPG also requires building owners to switch from fossil fuels to renewable heating technologies and municipalities with a population over 100,000 to have draft heat plans by June 2026 (smaller municipalities by June 2028) identifying which heating technologies are available to connect to[40].
Market ownership
The German heat network market is in transition with several large heat networks becoming municipality owned. For example, in December 2023 Berlin’s municipality acquired the Berlin heat network for €1.4bn from Vattenfall, showing how one of Germany’s largest heat networks has moved into public sector ownership[41]. The heat network was bought by the state of Berlin as they are committed to re-municipalising infrastructure and reversing privatisations to gain more influence over the city’s district heating and gas supply.[42] They also believe the company will be profitable and key in moving toward climate neutrality. The state was able to buy the heat network via a state-owned financing company which received equity from the state budget and loans from Investitionsbank Berlin which the senate backed by a state guarantee.[43]
As it stands, private companies, for example large energy suppliers, hold a significant share of the market and municipalities owning and operating the other significant proportion of the market.[44] The small remainder of the market is made up via large industrial companies who operate their own networks for industrial processes and heating factory buildings. Whilst market share is small, it is significant in industrial areas. Large public buildings also have their own networks, for example, universities, hospitals and other public sector buildings.
FINLAND
Overview
Finland has a long history of district heating, dating back to the 1950s. The country’s cold climate makes district heating a practical choice for urban areas. Finnish district heating has evolved to use a mix of energy sources, including a significant proportion of renewable and waste energy and it is considered a key component of Finland’s strategy to reduce greenhouse gas emissions.
Public financing levers
The mature Finnish market is upgrading, refurbishing and decarbonising existing networks and is less focussed construction of new networks. The Finnish Government is facilitating the heat transition upgrades by Investing €21.8m across six projects for waste heat recovery, heat pump solutions and energy storage solutions to help move away from carbon-based heating[45]. Similarly, the Ministry of Economic Affairs and Employment has allocated €469m of energy aid from EU funding for renewable projects via the national Recovery and Resilience Plan[46]. However, there does not appear to be a bespoke heat network capital grant fund. Additionally, Finland is providing grant support for end users – €2k-€4 for heat exchangers and €0.5k-€2k for balanced and adjusted heating systems. Furthermore, the Government are introducing a new tax credit scheme to give projects up to €150m worth of tax credits.[47] The idea is once green projects (renewable projects aiding the transition to net zero) become operationally profitable, a tax credit would aid cash flows making the project more feasible and investible.
Regulatory Structures
Finland established a self-governing framework, where there is no official national regulation but instead a clear set of technical codes which form the industry standard[48]. Finland did have legislation with mandatory connections, which was repealed in 2019, as mandatory connections were deemed anti-competitive. Finland has alternative renewable energy heat sources to choose from.
The Finnish government also introduced a €90m scheme to incentivise the move away from carbon-based fuels to biomass CHP networks and €45m to non-combustion technologies (e.g. heat pumps).
Market ownership
The Finnish market currently has a low level of private finance penetration with heat networks being predominantly municipality owned. However, the Finnish Government is seeking foreign investment into the sector, as it recognises public sector budget pressure and the need to attract private sector investment. For example, an important driver behind the introduction of private finance is the requirement to refurbish existing networks as they become old and inefficient.
Private investors note that Finland is very attractive due to the stability of the heat network sector which allows institutional investors to gain comfort and certainty in their investment.[49]
Additionally, Finland has seen private equity infrastructure funds acquire individual networks. For example, the largest heat network owned by Fortum Energy (a state-owned energy company) was recently acquired in 2021[50] by a private equity infrastructure investor (Partners Group) demonstrating the shifting landscape.
Therefore, Finland is demonstrating both the need for private investment as local authorities are capital constrained and offers a stable asset class to invest in an established market.
SWEDEN
Overview
Sweden has been a pioneer in district heating since the early 20th century. The first commercial district heating system was introduced in 1948. The oil crisis of the 1970s also accelerated the transition to district heating, which now utilises a high proportion of renewable energy sources. Sweden’s extensive use of district heating is often cited as a model for other countries.
Public financing levers
The Swedish market is well developed and mature. The Government are using a range of capital funding, personal grant incentives and tax exemptions to expand and refine the heat network market. For example, the Swedish government can provide small grants up to 60,000 SEK (approximately £4,300) for conversion to a new heating system moving away from direct-acting electricity or gas for single family homes[51].
Additionally, Sweden also provides tax exemptions where renewable energy heating sources are exempt from energy and carbon dioxide taxes.[52]
Regulatory structures
The Swedish district heat market was deregulated in 1996 which brought issues surrounding high prices and lack of transparency. Subsequently, light-touch voluntary regulation was reintroduced via the District Heating Act (2008)[53] and overseen by the Swedish Energy Markets Inspectorate (who also regulate electricity and gas). For example, voluntary initiatives for pricing transparency where the Swedish Competition Authority can investigate any signs of potential market abuse. Additionally, the Swedish Energy Market Inspectorate also have standard contract terms for delivery of district heat networks to ensure a consistent delivery approach across the market.
Whilst there is regulatory oversight, connections are not mandatory in Sweden. Although Swedish municipalities are responsible for developing energy plans and have a monopoly planning of district heating developments, building owners decide on their sustainable heating source as long as they follow environmental standards[54].
Market ownership
The heat network sector in Sweden currently has a mixture of privately and publicly owned networks and operators. For example, the heat network assets are owned by the local authorities and municipalities or the state-owned operator Vattenfall, but there are also private sector operators such as Eon and Fortum. Additionally, Sweden also has some joint venture structures for example between the City of Stockholm and Achiale (private investors).
A recent example of private investment was the sale of 50% of the Fortum (a Finnish state-owned energy company) holding in Stockholm Exergi to a group of European institutional investors including pension funds.[55] This demonstrates institutional investors recognising the stable returns provided by established heat networks and the opportunity they present to private investors.
ESTONIA
Overview
Estonia’s district heating systems were developed during the Soviet era, with the first systems established in the 1940s and 1950s. After regaining independence, Estonia reformed its district heating sector, improving efficiency and incorporating more renewable energy sources. The country has one of the highest rates of district heating coverage in Europe.
Public financing levers
As Estonia’s heat network sector is well advanced, there are limited grants and subsidies available. However, Estonia is encouraging refinement of their heat network market via investment support, compensation schemes and individual connection grants. Examples include the recent €20m investment by Gren (a private energy company) into Tartu, Parnu and Ida-Virumaa heat networks. Gren also received €4.2m of financial support from the Estonian Environment Investment Centre via the European Cohesion Fund and European Regional Development Fund[56].
Other forms of public funding included the Government compensation scheme for household energy consumed to counter the rising energy prices[57]. For example, the state compensates up to 80 percent of the part of the average monthly price that exceeds 80 euros/MWh for district heating. The subsidies are automatically applied to the district heating bills.
Additionally, the Estonian Business and Innovation Agency will provide up to a €10,000 grant for small residential buildings for facilitating the connection to an existing heat network[58].
Regulatory structures
The Estonian district heat sector is regulated by the District Heating Act 2003 where heat operators must coordinate the price of heat sold to the consumer with the Competition Authority. Additionally, Estonia uses a dynamic pricing structure where changes in the heat price are influenced by changes in the underlying fuel prices and also the required investment that needs to be made in the heat network sector. The District Heating Act also stipulates that within district heating regions connection to the network is mandatory for all located in the region[59]. Furthermore, municipal governments within Finland, for example Tartu, mandated new and renovated buildings in district heating zones must be connected to a heat network.
Market ownership
The Estonian market has a high degree of private finance penetration as many heat networks are owned by private equity infrastructure funds. For example, Utilitas is the largest operator of heat networks in Estonia and is majority owned by an infrastructure fund. Similarly, recent transactions such as Gren acquiring Viljandi district heating company[60] and Partners Group acquiring a stake in the Finnish state-owned operator Fortum operating in Estonia demonstrate the attractiveness of a mature and developed heat network sector to private investors.
The role of state-owned infrastructure banks
In addition to the public financing levers noted in section 5.2, there are also state-owned infrastructure banks that can support the heat network sector. Table 7 provides a summary of the banks and their financing products. Examples relevant to heat networks are discussed below.
Table 7: State-owned infrastructure banks
|
Country |
Name |
Financing products |
|
rUK |
National Wealth Fund/ UK Infrastructure Bank (NWF/UKIB) |
|
|
The Netherlands |
Bank Nederlandse Gemeenten (BNG) |
|
|
Germany |
KfW Development Bank |
|
|
Finland, Sweden, Estonia |
Nordic Investment Bank (NIB) |
|
Source: EY analysis
Relevant Examples:
- rUK: National Wealth Fund (NWF) was set up in2021 and allocated £27.8bn of capital to deploy from the UK Government. Heat networks are a key strategic pillar for the bank.
NWF explored a connection charge facility[61] to incentivise and fund connection to heat networks and give demand assurance. However, whilst the public sector like the facility to help develop a heat network with the cost of connection rolled into the capex facility, the private sector need clarity on who the risk and responsibility sits with (e.g. project co), and proof of concept to buy in.
NWF also look to provide project gap funding development expenditure and capital expenditure to make heat networks commercially viable for private sector investors. Similarly, the bank is considering early phase guarantees/loans to help crowd in private finance by bridging up front development risk and the early years of projects.
NWF has heat networks as a strategic investment pillar and has the capital available to deploy. However, from our stakeholder engagement sessions an additional barrier to deployment is that heat networks are not yet commercially viable enough to enable what NWF can offer.
- Germany: KfW is the state-owned development bank with a commitment to sustainable infrastructure. The bank has recently introduced support for landlords, homeowners and municipalities to claim grant funding for connecting to existing heat networks or other renewable heating sources. The scheme supports those installing/gaining access to low carbon heating systems with up to 35% of investment costs.[62]
- Nordics & Estonia: NIB was established as an intergovernmental bank between Denmark, Finland, Iceland, Norway and Sweden in 1975. Estonia, Latvia and Lithuania become members of the bank in 2005. The bank has approximately €8.4bn in authorised capital[63]. Whilst not a country in focus, NIB provided €18m loan to finance upgrades[64] to existing heat networks in Riga, Latvia in October 2024, demonstrating how infrastructure banks can support established heat networks.
- Scotland: Scottish National Investment Bank (SNIB) has net zero as one of its key missions. The bank has identified there could be opportunities around decarbonising and expanding existing heat networks as well as financing new networks and connections[65]. The bank does not have any publications regarding bespoke financing solutions for heat networks yet. This presents the opportunity to shape heat network solutions by analysing the market looking at other international innovations.
Appendix C – Major UK regulators: a summary of objectives
Ofgem (The Office of Gas and Electricity Markets)
Ofgem are responsible for regulating the electricity and gas markets, implement measures that protect consumers and promote competition within the sector. Within the UK, there is a well-established group of entities who operate across the generation, transmission and distribution landscape. Generating firms provide the power, transmission networks transport the power and distribution networks move it into residential and commercial premises with electricity and gas retailers being the interface between the energy market and end consumers. The natural gas sector follows a similar delivery structure where gas is extracted, refined and piped into buildings for heating and energy generation (Ofgem, 2024).
Ofwat (The Water Services Regulation Authority)
Ofwat oversees the water and wastewater sector ensuring that water companies provide high quality services at fair prices to consumers whilst ensuring the security of long-term water supplies. Water utilities are responsible for treating and supplying clean water, as well as managing the collection and processing of wastewater. Entities provide these services under strict regulatory supervision to maintain public health and environmental standards. The waste management sector addresses the collection, treatment and disposal of waste, including recycling (Ofwat, 2024).
Ofcom (The Office of Communications)
Ofcom is responsible for regulating the broadcasting, telecommunications and postal industries through maintaining the integrity of communication services. Telecommunications serve a critical role in maintaining connectivity within an ever-increasing digital environment, providing phone services, mobile networks, internet access and the infrastructure that underpins them all (Ofcom, 2024).
ORR (The Office of Rail and Road)
The ORR is responsible for ensuring the safety, reliability and efficiency of the railways whilst protecting the interests of rail and road users. They supervise network operators, such as Network Rail, through licensing to ensure compliance with health and safety law as well as competition law whilst also enforcing economic regulation (ORR, 2024).
CAA (The Civil Aviation Authority)
The CAA maintains a high level of safety in the aviation industry whilst representing the interests of consumers and wider public. It regulates various aspects of airline operations and aircraft management whilst also enforcing economic regulation through controlling pricing at major UK airports to prevent the abuse of market power and ensuring fair charges for passengers and airlines (CAA, 2024).
Appendix D – Overview of utility comparators methodology
The different characteristics of utility sectors have been examined acknowledging the following key attributes associated with the development of heat networks:
- A sector that is immature and in the early stages of its development and growth cycle within the UK
- A sector that provides services direct to its customers (retail in nature) and therefore exposed to a degree of demand, payment and operational risks akin to more conventional services provided in the private sector
- A sector that will be subject to incremental development of heat network infrastructure that will be dependent on accelerated connection of residential and commercial customers, ideally supported through zoning and policy in regard to the mandating such connections
- A sector that must address the affordability challenge of decarbonisation, particularly the cost of transitioning from conventional fossil-based energy sources like gas boilers; noting also that air source heat pumps are increasingly used as the counterfactual cost benchmark when developing an economic case
- The nature of the investment in heat networks, that involves significant upfront capital expenditure, requires funding that can be invested or repaid over extended time of 25 to 40 years, thus requiring investors and developers to take a long-term view of expected return on capital
- A sector that has historically and for the foreseeable future (3 to 4 years) been supported by investment support from the Scottish and UK Governments
Initial analysis was undertaken which focussed on the maturities and similarities between various utility sectors and heat networks across 39 regulated utilities covering electricity, water, telecommunications, rail and air regulation against the criteria listed below, in Table 8. Based upon the preliminary analysis, 17 utilities were taken forward for further examination, which is discussed in Appendix K.
Table 8: Criteria for longlist analysis of maturity and similarity between utility sectors and heat networks
|
Long List Methodology | |
|---|---|
|
Area evaluated |
Description |
|
Maturity of Sector | This reflects the stage of development and stability of the sector within the utility industry as a whole: |
|
Similarities to heat network | This area examines the extent to which the utility sector shares similar characteristics to heat networks. It considers factors such as: |
A shortlist was then derived in accordance with an assessment of the following criteria set out in Table 9.
Table 9: Assessment criteria for the shortlist
|
Short List Methodology | |
|---|---|
|
Area evaluated |
Description |
|
Investment Time Horizon |
This indicates the anticipated timeframe one expects an investor to hold their investment to make an appropriate return on its investment. It can range from the short-term (a few years) to long-term (several decades) depending upon the useful and economic life of an asset, contractual arrangements, market conditions and funding solution. |
|
Retail versus Wholesale Activity |
This distinguishes between services that are provided direct to end consumers (retail) such as those in the water and sewerage sector and those activities that operate higher up in the supply chain within a wholesale market, such as electricity generation. |
|
Stakeholders |
This details the parties with an interest or influence over the sector including the customer base, user of assets base, owner of asset and who is subsidising the regulatory regime. |
|
Investment Support |
This refers to the mechanisms, incentives and financial environment and structure that exist to incentivize investment in the sector. It covers areas such as government grants/subsidies, regulatory frameworks like a RAB model alongside any market mechanisms such as Contracts for Difference (CfDs). |
|
Areas of Regulatory / Financial Difference |
This identifies some of the unique regulatory and financial characteristics of the sector in terms of market operations, investment models and compliance requirements. |
|
Risk Profile |
This evaluates the types and level of risk present within each sector. Whilst risk can be subjective and dependent on the risk appetite of the related party, it encompasses design, construction, operations, maintenance, revenue, availability and revenue risk (demand and bad debt). |
Appendix E – Key characteristics of utility sectors evaluated
The table below summarises the key characteristics of each utility sector evaluated within Section 6.
|
Risk Profile |
Sector |
Investment time horizon | |
|---|---|---|---|
|
Heat networks |
Further to achieving commercial operation of the heat network, there is material demand and revenue risk due to the uncertainty and timing of commercial and residential connections. |
Operates essentially as a retail business whereby sales are direct to end customers and therefore subject to revenue risk (demand and bad debt risk). |
Long term investment time horizon (between 20 and 40 years) due to large upfront capital expenditure, thin operating margins governed by the competitive pricing relative to the counterfactual of gas boilers and/or air source heat pumps. |
|
Offshore wind |
Once at commercial operations, projects are essentially at full operational capacity and connected to the national grid for energy distribution and as such no demand risk. Some availability/revenue risk due to uncontrollable nature of wind. |
Conventionally operates in the wholesale market (direct to grid). |
Long term investment return of around 15 years commensurate with the term of a CfD due to significant upfront capital costs and competitive bid process for revenue pricing. |
|
Household Water & Sewerage |
Demand/revenue risk from users and price reviews by regulator respectively. Large operating expenditure to meet quality assurance requirements. |
In England and Wales, operates in the retail sector which inherently creates revenue risk, in particular, bad debt risk. In Scotland, water is devolved with charges occurring alongside the council tax system. |
Long term investment returns due to significant upfront capital costs, maintenance costs and price reviews for revenue pricing to ensure appropriate inter-generational cost recovery from customers in line with the useful and economic life of underlying assets (25 to 40 years). |
|
CCUS |
Currently a sector proposing to utilise unproven technology at scale, often referred to as a FOAK project (First of a Kind) and therefore subject to material design, construction and commissioning risk. Once commercial operation is achieved, there is material demand and revenue risk due to the uncertainty and timing of connections. |
Operates essentially as a retail business whereby sales are direct to end customers and therefore would be subject to revenue risk (demand and bad debt risk) without regulatory funding support mechanism until the sector matures. |
Long term investment returns due to significant upfront capital costs, maintenance costs and pricing reviews to ensure an appropriate return on initial investment acknowledging the useful and economic life of underlying assets (20 to 40 years). |
Sources: EY, Ofwat (2024)
Appendix F – Timeline of regulatory developments
The figure below represents a timeline of regulatory development across CCUS, offshore wind and household water & sewerage sectors.
CCUS
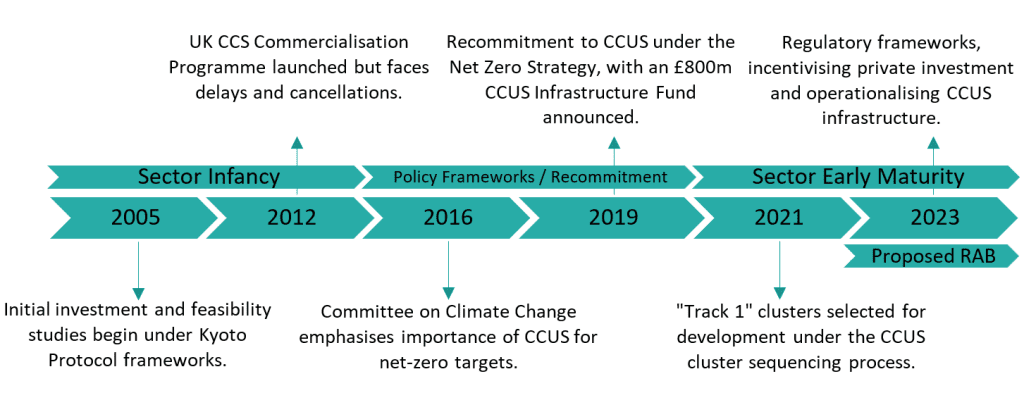
Offshore Wind
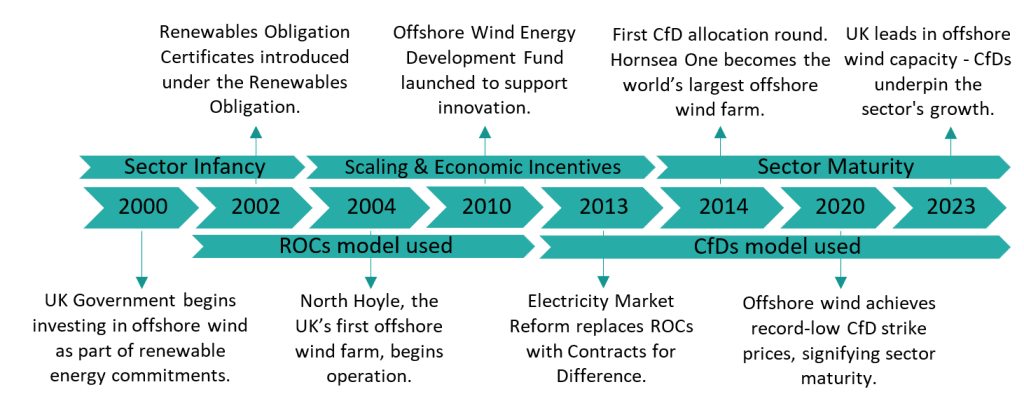
Household Water & Sewerage
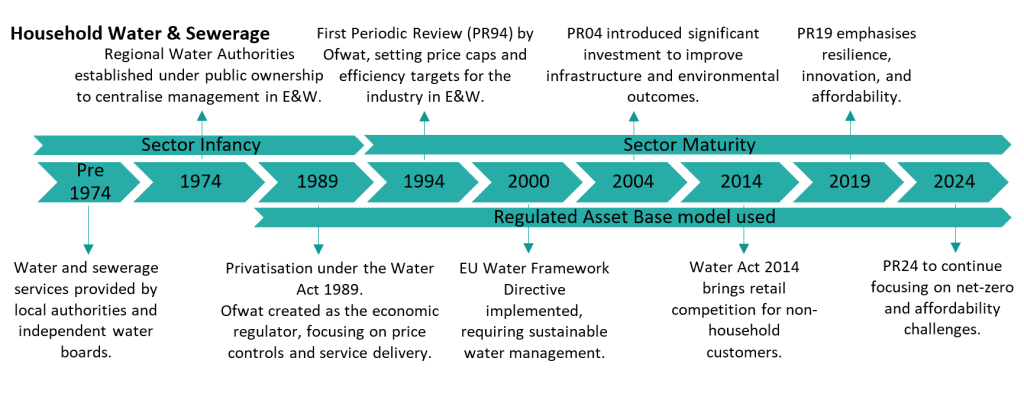
Appendix G – Detailed overview of offshore wind sector
The below provides a detailed overview of offshore wind regulation within the UK alongside the regulatory structure and financing mechanisms within the sector.
Overview
Offshore wind electricity generation in the UK is a rapidly expanding sector which plays a pivotal role in the nation’s transition to renewable energy and the achievement of its climate change goals. The regulatory framework is overseen by Ofgem who ensure that the sector operates efficiently and contributes to the UK’s energy security since the early development of the sector, with regulation becoming more prominent following the significant expansion of the sector in the 2000s. Ofgem is aided by the Crown Estate and Crown Estate Scotland who own the seabed around the UK and are responsible for awarding leases to developers for offshore wind development.
Offshore wind farms are subject to a range of regulations, from environmental impact assessments to marine spatial planning, ensuring that developments are carried out responsibly. Ofgem’s regulatory activities encompass various aspects of offshore wind generation. These include connections to the national grid and ensuring that the market operates effectively to facilitate investment and main secure and sustainable electricity supplied.
Regulatory Structure
Following on from the Energy Act 2004, Ofgem has continued to regulate the sector and is adapting its approach and offering new support mechanisms as deployment continues to grow. Ofgem’s regulation of offshore wind is structured around several key elements designed to promote the development of the sector whilst ensuring efficiency, competition and the protection of consumers interests:
- Licensing – generation licences are issued to offshore wind farm operators which set out the conditions operators must meet to legally generate electricity;
- Support mechanisms – provide long term price/revenue stability and encourage investment in offshore wind through guaranteeing a fixed price for the electricity generated;
- Grid connections and access – administrating the connections from offshore wind farms to the national grid through Offshore Transmission Owners (OFTOs) who own and operate the transmission assets;
- Market oversight – monitoring of the market to prevent anti-competitive practices whilst also ensuring offshore electricity generation is integrated safely to aid in the security of electricity supply;
- Financial incentives and penalties – through the RIIO (Revenue = Incentives + Innovation + Outputs) model, Ofgem sets price controls and performance incentives for offshore wind network entities;
- Consumer protection – ensuring costs associated with offshore wind generation are reflected fairly on consumer bills, with the benefits of low carbon electricity generation passed on to consumers;
- Innovation funding – innovation technologies and practices which reduce generation costs can be funded by Ofgem. The aim is to accelerate technological advancements, improving efficiency and reducing costs to support the transition to net-zero energy systems whilst ensuring best value for consumers. As part of RIIO-ED2, Ofgem extended their Strategic Innovation Fund to cover electricity distribution companies with £450m of funding across RIIO-ED2 alongside £68.4m of additional allowances for smaller scale innovation projects through the Network Innovation Allowances.
These structures collectively create a regulatory environment that supports the growth and investment in offshore wind development while managing costs and ensuring the electricity system remains reliable and sustainable.
Regulatory Financing Mechanisms
Offshore wind offers investors long term equity returns over a period of c.15 years commensurate with the term of a CfD. Offshore wind is characterised by large upfront capital expenditure, availability risk (wind), a competitive and volatile electricity market, all of which impacts the sector’s ability to secure much needed investment.
Offshore wind is not exposed to demand risk, given it operates on a wholesale basis. However, to aid in the mitigation of electricity price volatility, availability risk and premium over and above the wholesale price of electricity for the development of Offshore wind, Ofgem awards Contracts for Difference (CfDs) to provide long term stable and predictable revenue for offshore wind developers. The reduced revenue risk attributable to a CfD make Offshore wind attractive to investors resulting in optimised financing structures reducing the overall cost of capital.
CfDs represent an evolution in the Offshore wind sector from Renewable Obligation Certificates (ROCs) which were originally used as a support mechanism to promote investment in the sector. Further to CfDs offering stable and predictable revenue, continual development of offshore wind assets is promoted through government grants and incentives for innovation and infrastructure development.
Renewable Obligation Certificates
The ROCs framework was designed to promote investment across a number of different renewable energy technologies by providing a financial reward for renewable energy generation. It achieved this through the creation of a renewable energy certificate market whereby for each megawatt hour (MWh) of renewable electricity granted, generators would be eligible to claim ROCs.
These could then be traded on the open market to suppliers who did not meet ROC generation obligations imposed by Ofgem. If suppliers failed to present enough ROCs to meet their obligations, a buy-out fee would be imposed for the shortfall of ROCs. The buy-out fee was set by Ofgem and increased annually with inflation. The money collected by Ofgem from buy out fees was then redistributed to suppliers who had met their obligations to effectively incentivise renewable electricity generation.
ROCs were the main support mechanism for renewable energy before being gradually phased out and replaced by CfDs for new projects in 2013 with the aim of improving the regulatory regime. One of the reasons ROCs were phased out was due to the relatively primitive nature of the support mechanism whereby different technologies received varying amounts of ROCs per MWh produced in addition to the wholesale power price. In 2012, offshore wind typically received 2 ROCs per MWh compared to onshore wind which typically received 1 ROC per MWh.
The difference in ROC allocation by technology was arguably quite arbitrary and did not necessarily correlate with the underlying levelised cost of the technology. This potentially stifled the deployment of some technologies or encouraged the development of other sectors, resulting in windfall gains for developers
Contract for Difference
Offshore wind projects are eligible to participate in a competitive auction process to obtain a CfD. The auction determines the “Strike price”, which effectively equates to a fixed price per MWh of electricity that the project generates over a specified period (typically 15 years). The Strike Price is the price per MWh a developer considers necessary to make its applicable return on investment over the period of the CfD.
The Strike Price is different to the actual market price, known as the “Reference Price”, which is calculated based on the average market price per MWh over a given period. When the Reference Price is lower than the Strike Price, a top up payment of the difference in price is made by the Low Carbon Contracts Company (LCCC) to the offshore generator. Conversely, if the Reference Price is greater than the Strike Price, then the generator must pay the difference to LCCC.
By providing a guaranteed price for electricity, CfDs mitigate price volatility risk within the wholesale electricity market. This helps make offshore wind more attractive to investors and lenders as it reduces financial risk of the project whilst also incentivising generators to produce electricity efficiently and at lowest costs to maximise margins.
CfDs were originally introduced in 2013 whilst the sector was focussing on scaling but have enabled the sector to develop into a mature one. Recently, the CfD allocation round 6 has been completed. It included three new CfDs for offshore wind alongside seven offshore permitted reductions which allows projects previously awarded a CfD contract to withdraw up to 25% of their original capacity and apply to a future CfD round.
The balance in setting the correct Strike Price can prove difficult as demonstrated in allocation round 5 in 2023. Figure 11 highlights that there were no successful CfDs awarded for offshore wind in allocation round 5. This was a result of no bids being submitted by developers for offshore wind, which could have been due to the administrative Strike Price set by UK Government of £44/MWh. This Strike Price remained unchanged from allocation round 4 which made offshore wind developments economically unfeasible due to impacts of inflation on development costs.
Figure 11: Total renewable energy awarded during CfD allocation rounds
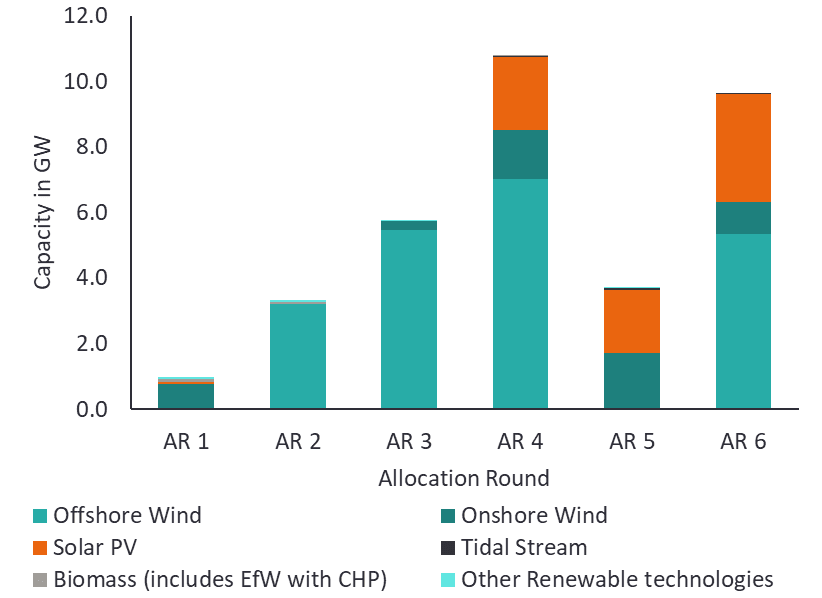
Government Grants & Incentives
Government grants and incentives are critical tools used to promote the development, operation and maintenance of offshore wind assets. Government grants can help to reduce the upfront capital required for the development of offshore wind farms including research, design and construction helping to mitigate some of the financial risks that developers face. The UK Government, often through Ofgem or other bodies such as Innovate UK, provide this funding and includes grants for innovation in turbine design, foundation structure, grid integration and operations alongside maintenance practices.
In addition to 21 GW of wind farms benefiting from CfDs through to allocation round 6, another example of government funding is the Strategic Innovation Fund (SIF). This aims to help transform gas and electricity networks for a low-carbon future. It provides funds to projects that could speed up the transition to net zero at the lowest cost to the consumer. After launching in 2021, Ofgem expects to invest £450m by 2028 through partnering with Innovate UK to deliver the programme. Innovate UK offers multiple innovation funding such as the Net Zero Living Pathfinder Places. Oldham Council has secured funding from this to develop an Oldham Green New Deal Delivery Partnership, focussing on delivering the £5.6bn of low carbon infrastructure Oldham needs to achieve Net Zero.
Appendix H – Detailed overview of household water & sewerage sector
The below provides a detailed overview of household water & sewerage undertakers within the UK alongside the regulatory structure and financing mechanisms within the sector.
Overview
Household water & sewerage undertakers within the UK are a well-established utility sector which provides residential and commercial customers essential water supply and wastewater services. The sector encompasses the entire process of sourcing, treating and delivering water to households and businesses alongside the collection, treatment and disposal of wastewater and sewage. The household water and sewerage sector within England and Wales is typically characterised by a natural monopoly due to the inefficiencies of having multiple sets of water and sewerage infrastructure competing in the same geographic area.
As a result, the sector is subject to economic regulation which, within England and Wales, is regulated by Ofwat to ensure the provision of high-quality water alongside reliable water and wastewater services at fair prices for consumers. The two main issues Ofwat regulation aims to address are service quality and tariff prices. Service quality is less important than in other sectors like electricity. Ofwat oversees the performance of water companies, enforces compliance with environmental standards and ensures that the sector remains financially viable.
Regulatory Structure
The regulatory structure for household water and sewerage companies within England and Wales has evolved over time to adapt to changing priorities in the sector, such as the need for increased investment in infrastructure, improving customer service and addressing environmental concerns. Some of the key changes in the regulatory structure include:
- Introduction of competition – whilst the water industry in England and Wales has been privatised since 1989, there has been a gradual move to introducing competition within the household water sector to drive efficiency and innovation.
- Periodic price reviews – Ofwat has moved towards conducting periodic price reviews (such as ‘PR19’ or ‘PR24’) typically every 5 years to set price limits and service targets for water companies. These reviews establish the framework within which water companies must operate and balance the need for investment in infrastructure with the protection of consumer interests.
- Performance commitments – Ofwat has introduced performance commitments and outcome delivery incentives (ODIs) to ensure water companies focus on delivering outcomes relevant to their customers.
- Resilience and sustainability – regulatory changes increasingly emphasise the importance of long-term resilience and environmental sustainability through encouraging water companies to invest in approaches that mitigate the risk of drought, flooding and other long term climate related challenges.
- Customer engagement – a greater emphasis is now placed on customer engagement within the regulatory process with water companies required to consult with customers and consider their preferences in the development of their business plan.
- Innovation funding – Ofwat has introduced mechanisms to fund innovation within the sector to encourage water companies to develop and adopt new technologies and practices.
These changes reflect a broader shift towards a more outcome based regulatory regime which encourages water companies to be customer orientated, efficient and forward thinking with their operations and investments. The regulatory framework is designed to incentivise water companies to invest in their networks, improve resilience, reduce leakage and maintain high standards of water quality and environmental stewardship.
Regulatory Financing Mechanisms
Within England and Wales, the water & sewerage sector is predicated on a long-term investment time horizon whereby balance sheets are supported by the capital markets in the form of debt (including bond finance) and shareholder equity. Typically, water utilities seek an investment grade credit rating in order to secure the most competitive form of lending within a highly optimised financial structure, most notably gearing. Regulation by Ofwat in England and Wales provides a stable financial environment for investors, whereby the monopolistic nature of the customer base for each utility provides a reliable level of demand assurance, albeit in a retail market that does result in an element of revenue risk from bad debt.
Ofwat uses various financial levers to encourage initial investment in water infrastructure whilst also encouraging water companies to invest in their infrastructure and services. These financial levers are primarily through a Regulated Asset Base (RAB) model, as well as through the existence of price reviews to adapt to market conditions and innovation funding. Key risks that are borne by utilities in the water sector is that of managing capital programmes, maintenance and operational costs. These risks will be similar in nature to those of the heat network sector.
Regulated Asset Base (RAB)
A RAB model provides a structured approach to regulating the prices that water companies can charge alongside ensuring they maintain and improve the infrastructure, whilst delivering high quality services to customers. The RAB represents the value of a water company’s capital assets, such as pipes and treatment plants and is calculated based on historical investment costs, depreciation and new qualifying capital expenditure. The general value of the RAB can be expressed as:
However, for previously privatised UK network infrastructure sectors such as water, the RAB is generally lower than the current replacement cost of the net book value as when privatised, the assets were sold at a substantial discount to the replacement cost. Within the water industry, the current replacement costs of the assets in 2010 prices are greater than £200bn but the privatisation proceeds were just £10.3bn in 2010 prices. This difference is a combination of the privatisation discount and the capital investment net of depreciation undertaken since privatisation. As such, for UK infrastructure industries privatised after 1980, such as water, the RAB value is further defined as:
Ofwat then uses the RAB value to derive the allowed revenue requirement, which is used to ultimately set prices for consumers, to cover the costs of operations, maintenance as well as providing a fair return on the capital investment on the RAB. This is done through the regulator setting a Weighted Average Cost of Capital (WACC)% which is then applied to the RAB value to calculate the total amount of allowed revenues each company can charge to its consumers. This process, albeit simplified and not considering inflation, is expressed as:
The RAB model inherently encourages water companies to invest efficiently in their assets as a company retains some of the savings as profit if it can deliver the required services at a lower cost than the allowed revenue. Furthermore, since depreciation is active in the RAB, unless ongoing capital expenditure is made, the allowed revenue dwindles. This incentivises water companies to continually invest in their infrastructure, with these investments eventually being included in the Regulated Asset Value (RAV) and therefore in future revenue streams (Frontier Economics, 2010). The RAB model works particularly well within the water sector due to the limited number of operators within the sector (11 regional water and wastewater companies in England and Wales) meaning the time and cost requirements of administrating this regime is manageable.
Price reviews
The price reviews performed by Ofwat determine the revenue that water companies can earn from customers, usually lasting for a 5-year period. Price reviews adopt a total expenditure approach, considering both capital expenditure and operational expenditure when setting price controls. Price reviews promote the development of new assets by providing a framework for recovering the costs of the investment over a period of time. This in turn encourages companies to undertake necessary large scale capex projects.
Furthermore, the price review process also includes performance incentives, through ODIs which reward companies for meeting or exceeding targets set by Ofwat. Conversely if targets are not met, water companies are penalised for underperformance. This system helps align the company’s financial interests with the delivery of high-quality utility services.
Every 5 years each utility must submit an Asset Management Plans (AMP) to the regulator Ofwat. Ofwat will then use the AMP to set price increases and review the quality of services provided which take the form of Key Performance Indicators (KPIs).
The latest AMP is AMP8 for the period 2025 to 2030. AMP 8 will have a greater focus on climate change & emissions reduction challenges, improving water quality, reducing leakage and ensuring reliable water supply and wastewater services. Ofwat has highlighted a strong desire to find new and innovative funding solutions to meet the significant investment in infrastructure required to achieve these goals. An example of this is the Direct Procurement for Customers programme (DPC) which involves the utilities competitively tendering services in relation to the delivery of large new water and wastewater assets. It is envisaged the projects will be similar in nature to Design, Build, Finance and Operate (DBFO) whereby the chosen Competitively Appointed Provider (CAP) will be paid essentially a service fee for a period of between 25 and 30 years.
Innovation funding
Innovation funding impacts the financial environment by providing the means and incentive for water companies to invest in the future. It supports an approach to asset management and service delivery which is proactive in nature. Although there are many external innovation funds available to water companies, Ofwat has established their own Ofwat Innovation Fund. The aim of this £200m fund is to encourage collaborative initiatives and partnerships within the water sector to tackle the larger challenges the sector faces such as climate change, leakage and affordability. Most recently, 17 projects have been awarded funding in the fourth round of the Water Breakthrough Challenge (‘Breakthrough 4’), sharing in approximately £40m towards solutions that will bring benefits to water customers, society and the environment. One example of this is the award of £1.6m to Pipebot Patrol. This aims to develop an autonomous sewer robot which constantly inspects sewers, raising alerts to the precise location of blockages as they begin to form. This proactive approach allows maintenance teams enough time to respond before sewer flooding occurs, potentially contaminating the environment.
Although Ofwat regulates the water sector in England and Wales, due to the privatisation of the sector combined with regulatory models used, profits made by companies can be either distributed to shareholders or reinvested in infrastructure. If too great an emphasis is placed on the former, issues can arise in under-investment in infrastructure, impacting the long-term viability of the sector. Thames Water, England’s largest water company, over the years has significantly borrowed debt totalling over £15 billion under the RAB model, creating about 80% leverage in the company. This has allowed owners of Thames Water to take billions of pounds out the company as loans or dividends within the last 5 years, including over £200m in dividends to other group entities. However, the debt servicing requirements, alongside the need for infrastructure investment to meet efficiency targets, has led to Thames Water requesting Ofwat to allow water bills to rise by 40% by 2030. Ofwat has however rejected these proposals and has currently suggested a rise of 23% as part of its 2024 price review and suggests further capital injection from shareholders to develop infrastructure and service debt payments. As such, without careful regulation throughout the years, potential mismanagement of utilities can arise leading to price increases for consumers.
Scotland has mitigated these specific risks through the water services being publicly owned and operated by Scottish Water who remains accountable to the Scottish Government and its customers. This helps to ensure profits are reinvested in the infrastructure rather than distributed to shareholders.
Water Regulation Within Scotland
Scottish Water remains economically regulated by the Water Industry Commission for Scotland (WICS) which ensures Scottish Water delivers value for money whilst achieving efficiency targets. Regulation ensures that public funds are used efficiently with no profit motive influencing decisions. The social focus of WICS places an emphasis on affordability and maintaining public ownership which is aligned with Scottish Government policies. Furthermore, since Scottish Water is the sole provider of water within Scotland, regulation can be simplified as it benefits from economies of scale.
WICS is governed by the Water Industry (Scotland) Act 2002, as amended by the Water Services etc (Scotland) Act 2005 and the Water Resources (Scotland) Act 2013. WICS is an Executive Non-Departmental Public Body whose principle statutory functions are to:
- Determine charge caps and, in so doing, promote the interests of customers of Scottish Water both in terms of quality of services and the charges that have to be paid;
- Monitor Scottish Water’s performance, encouraging efficiency and sustainability;
- Facilitate (in a manner not detrimental to Scottish Water’s core functions) the entry of retail water and sewerage providers that want to supply non-household customers in Scotland;
- Support the Scottish Government’s vision of ensuring that Scotland is a Hydro Nation and meet their obligations under the Water Resources Act 2013.
Water charges are set by WICS and remain relatively stable as profits are reinvested. The domestic charges are linked to council tax bands, with prices increasing as bands increase, and historically were calculated based off a version of the RAB model. However, since the price review in 2010, WICS have moved away from the RAB based model and instead moved towards looking at business requirements as the basis in setting prices during price reviews.
Price Reviews
Similar to Ofwat in England and Wales, WICS performs Strategic Reviews of Charges to set price limits for the next regulatory period (usually every 6 years). The Strategic Reviews of Charges is initially based upon Scottish Water’s long term business plan which encompasses short- and long-term infrastructure investment requirements, debt repayments and operating costs. As part of this business plan, Scottish Water also works with the Customer Forum to ensure that customer views influence the business plan and pricing requests. WICS subsequently evaluate the business plan, with a focus on Debt Service Cover Ratio (DSCR), alongside multiple other factors including inflation, investment needs and operational efficiency to determine annual price caps for customers. These may be adjusted annually within the limits set by WICS to account for inflation or other changes.
Alongside setting price caps, WICS will also set efficiency targets for each period based upon what it deems Scottish Water should be able to achieve. Although a proxy RAB continues to exist to act as an internal comparator to England and Wales water sector, this customer focussed business plan helps to align Scottish Water with Scotland Government objectives.
Although WICS exercises these functions independently of the Scottish Ministers, whose power to direct WICS, is confined to matters relating to the WICS financial management and administration, ministers can potentially influence agreed charges to customers. If agreed charges are lower than Scottish Water’s requirement, the cash surplus may be insufficient to meet required investment and maintenance programmes. This in turn could impact the long-term lifecycle maintenance and development of new assets meaning the extension of useful economic lives of existing assets is required. There is a risk that, despite it being a public body, if agreed charges are continually lower than what Scottish Water deems as necessary, the integrity of the network in the future is compromised.
If a cash shortfall is present for infrastructure expansion or maintenance of assets, public borrowing could provide the required capital for required expansion or maintenance of assets.
Government Grants and Incentives
Scottish Water receives loans or grants from the Scottish Government to finance large capital expenditure projects such as upgrading treatment plants, replacing aging pipes and building flood defences. This aids in reducing the reliance upon customer charges to fund these large capital expenditure projects helping to ensure affordability for households and businesses. This could provide an advantage over private companies as government-backed loans typically offer more favourable terms than private market financing resulting in further cost savings being passed onto consumers. However, this funding route depends upon the impact this borrowing would have upon Scottish Government balance sheet. This impact could mean funding is not granted for infrastructure development and maintenance projects and instead a short-term increase in customer prices would have to be required. As such, any borrowing is carefully managed to ensure long term financial sustainability for both Scottish Water and Scottish Government.
Appendix I – Detailed overview of CCUS sector
The below provides a detailed overview of CCUS within the UK alongside the regulatory structure and financing mechanisms within the sector.
Overview
CCUS is an emerging sector within the UK and is expected to play a crucial role in the UK achieving its net zero emissions target by 2050. The UK Government has recognised the importance of CCUS in reducing carbon emissions from industrial processes and power generation and as such is actively developing a regulatory framework to support the deployment of CCUS related projects.
This framework aims to ensure that CCUS projects are financially viable, environmentally effective and financially resilient to market uptake. The regulatory environment is shaped by multiple pieces of legislation including the Energy Act and the Infrastructure Act which establish the legal basis for CCUS operations and the regulatory role of bodies like Ofgem, the Oil and Gas Authority and Department for Energy Security and Net Zero.
Regulatory Structure
The CCUS sector is in its infancy within the UK and as such projects are unlikely to be at full operating capacity at the point the facilities are commissioned, in terms of emitter uptake. As such, any proposed regulatory structures will need to take into account:
- Financial incentives: Providing financial incentives to encourage investment in CCUS technology and making it cost effective;
- Economic regulation: To provide stable and predictable revenue streams for CCUS infrastructure investments;
- Licensing: Licensing and permits for CCUS operations including the capture, transport and storage of carbon;
- Safety Standards: Safety and environmental standards to protect public health and the environment;
- Liability Frameworks: Liability and risk management frameworks given the first of a kind nature of CCUS;
- Market Development: Facilitating the development of markets for carbon utilisation and promoting innovation in CCUS technologies; and
- Infrastructure Planning: Planning and developing the necessary infrastructure for carbon transport and storage, including considering shared access and usage to maximise efficiency and reduce costs.
The proposed regulatory structure will need to enable the growth of the CCUS sector whilst ensuring it contributes effectively to net zero goals. It is anticipated that the regulatory framework is likely to evolve as technology and risks develop. Current regulatory proposals to encourage initial investment, development and maintenance of assets include having a RAB based model with revenue support.
Regulatory Financing Mechanisms
Regulated Asset Base
Similar to the RAB model used within the water and sewerage sector, it is proposed that the entities that will develop, own and operate the transport and storage infrastructure (T&SCo) will have a regulatory RAB model as the basis to provide long term reliable revenues to service the initial upfront expenditure and ongoing operating costs.
The process for establishing the amount of allowed revenue is derived in the same way as that used in other RAB models, such as that used in water and sewerage. The difference between the RAB model in water and sewerage sector when compared to CCUS is that the allowed revenue and qualifying operating and capital expenditure, will initially be administered by DESNZ prior to Ofgem fulfilling this regulatory role a short period after commercial operations date. RAB based models require significant resources requirements and time to administer. However, on the basis there is not anticipated to be a large number of T&SCo projects, a RAB based model is deemed an appropriate and effective mechanism to provide an attractive financial proposition (environment) to attract investment from the private sector in a cost-efficient manner.
Revenue Support Agreement
As uptake of CCUS technology is uncertain due to the maturity of the market there is a significant risk associated with T&SCos being able to generate sufficient allowed revenue under the RAB model based upon number of emitters committed to CCUS on day one. As such, the regulatory structure, at least until the market is more mature and developed, includes a revenue support agreement which acts in a similar manner as CfDs in other sectors such as offshore wind. LCCC is the proposed counterparty to the revenue support agreement responsible for paying T&SCo any shortfall in actual revenue generated when compared to the allowed revenue forecast as per the RAB model. This support mechanism helps to address demand risk as the sector develops.
The CCUS regulatory framework helps to address risks associated with a First of a Kind (“FOAK”) project through the amalgamation of previous regulatory support mechanisms. Although the current mechanism is likely to evolve as the sector matures, it currently encourages investment within the CCUS sector through providing long term and predictable revenue for equity investors which is supported through a contract with LCCC. Furthermore, it is predicted continual maintenance of assets will occur due to the RAB model and increasing allowed revenue to enable a return on maintenance expenditure. This helps to encourage the adequacy of the level of net revenue alongside the visibility of sufficient value of future similar projects. However, this amalgamation of support mechanisms is not yet practically tested and remains in development until construction beings on large CCUS projects.
Appendix J – Possible implications of regulatory regimes
|
Regulatory Support Mechanism |
Possible impact within heat networks |
|---|---|
|
CfDs |
|
|
RAB & Periodic Price Reviews |
|
|
Grants |
|
|
RHI type Incentive |
|
Appendix K – Regulatory regime overview
The table below includes analysis performed over regulatory regimes and serves as a basis in selecting comparators for heat networks. The analysis includes typical characteristics of the regulatory sector, timeframe of returns, stakeholders typically involved, key differences in the sector alongside the risk profile of each sector.
The table can be accessed by downloading the report as a PDF (see top of page).
How to cite this publication:
Thomson, N., Davidson, H., Smallman, J. (2025) ‘Funding and financing heat networks in Scotland’, ClimateXChange. DOI: http://dx.doi.org/10.7488/era/5740
© The University of Edinburgh, 2025
Prepared by EY on behalf of ClimateXChange, The University of Edinburgh. All rights reserved.
While every effort is made to ensure the information in this report is accurate, no legal responsibility is accepted for any errors, omissions or misleading statements. The views expressed represent those of the author(s), and do not necessarily represent those of the host institutions or funders.
This work was supported by the Rural and Environment Science and Analytical Services Division of the Scottish Government (CoE – CXC).
ClimateXChange
Edinburgh Climate Change Institute
High School Yards
Edinburgh EH1 1LZ
+44 (0) 131 651 4783
info@climatexchange.org.uk
www.climatexchange.org.uk
If you require the report in an alternative format such as a Word document, please contact info@climatexchange.org.uk or 0131 651 4783.
Scottish House Condition Survey 2022 ↑
Heat Networks Delivery Plan: review report 2024 – gov.scot ↑
Heat In Buildings Strategy: Achieving Net Zero Emissions in Scotland’s Buildings ↑
2. Overview of policy & regulatory landscape – Heat Networks Delivery Models – gov.scot (www.gov.scot) ↑
Heat In Buildings Strategy: Achieving Net Zero Emissions in Scotland’s Buildings ↑
Heat networks – Renewable and low carbon energy – gov.scot ↑
Heat Networks Delivery Plan: review report 2024 – gov.scot ↑
Heat Network Projects Quarterly Report : Scottish Government Supported Heat Network Projects – September 2024 ↑
Heat networks are often driven by non-domestic pricing arrangements. Green levies on non-domestic bills represent a smaller proportion of the total costs but are still a driver of higher electricity prices. ↑
Review of gas and electricity levies and their impact on low carbon heating uptake (climatexchange.org.uk) ↑
The Future of Heating: Meeting the challenge (publishing.service.gov.uk) ↑
DESNZ (BEIS) “International review of heat network frameworks” (2020) ↑
CXC “Lessons from European regulation and practice for Scottish district heating regulation” (2018) ↑
Euroheat & Power “DHC Market Outlook 2024” (2024), CXC “Lessons from European regulation and practice for Scottish district heating regulation” 2018, Ministry of Economic Affairs and Communications “Possibilities of efficiency in heating and cooling in Estonia” (2016) ↑
Solarthermalworld.org (2022) – Fund of EUR 3 billion for decarbonising German district heating | Solarthermalworld ↑
Burges-Salmon (2024) – The Heat Network Zoning Consultation: Will you be required to connect? ↑
Dutch state set to take control of district heating schemes – DutchNews.nl ↑
Rabobank “Effects of the New Collective Heat Supply Act Determine Investment Climate for District Heating Sector” (2023) ↑
Nordic Investment Bank “NIB finances investments in electricity distribution and district heating in Finland” (2023) ↑
European Investment Bank “Finland: EIB makes loan to replace Helsinki’s fossil-based heating plants with renewable energy” (2024) ↑
AECOM “The rise of energy-efficient heat networks in the UK’s public sector” 2023 ↑
Triple Point Heat Networks – “Green Heat Network Fund – guidance for applicants version 8.0” (2024) ↑
Gov.uk – “Full Business Case for Green Heat Network Fund GHNF” (2023) ↑
DESNZ– “Heat Network Efficiency Scheme (HNES) – Guidance for applicants version 5.0) (2024) ↑
Vattenfall (2024) – We’re working to deliver low carbon heat to homes and businesses across the UK. – Vattenfall Heat UK ↑
RVO.NL (2024) – “Heat network investment subsidy (WIS)” Heat Networks Investment Subsidy (WIS) ↑
DLA Piper (2024) – The Decarbonisation of Heat – what can the UK learn from the US, Germany and the Netherlands? | DLA Piper ↑
Interreg HeatNet North West Europe (2020) “Netherlands – national policy framework” ↑
Rabobank “Effects of the New Collective Heat Supply Act Determine Investment Climate for District Heating Sector” (2023) ↑
EIBI (2024) – The Netherlands to ban fossil fuel installations from 2026 – EIBI ↑
Dutch News (2022) – Dutch state set to take control of district heating schemes – DutchNews.nl ↑
Rabobank “Effects of the New Collective Heat Supply Act Determine Investment Climate for District Heating Sector” (2023) ↑
Solarthermalworld.org (2022) – Fund of EUR 3 billion for decarbonising German district heating | Solarthermalworld ↑
BMWK (2024) – BMWK – New heating subsidies ↑
DLA Piper (2024) – The Decarbonisation of Heat – what can the UK learn from the US, Germany and the Netherlands? | DLA Piper ↑
DBDH (2024) “The missing actor in the heat market: how to fill the gap in Germany” ↑
Linklaters (2024) – District heating, heat pumps and hydrogen – how Germany plans to decarbonise its heating sector, Ruth Losch ↑
Vattenfall (2024) – Vattenfall completes sale of its heat business in Germany to the State of Berlin – Vattenfall ↑
Berlin (2023) Berlin considers purchase of Vattenfall’s district heating business – Berlin.de ↑
Berlin (2023) State of Berlin takes over heating network from Vattenfall – Berlin.de ↑
DBDH “The missing actor in the heat market: how to fill the gap in Germany” (2024) ↑
Euroheat & Power (2024) – New projects granted Recovery and Resilience Facility Funding in Finland – Euroheat & Power ↑
Finnish Government (2024) – EUR 72.6 million in investment aid granted to 13 clean energy projects – Finnish Government ↑
Bird & Bird (2024) – Significant tax aid for green investments in the pipeline – Bird & Bird ↑
BEIS (2020) – International Heat Networks – Masrket frameworks research – Regulatory document review ↑
Abrdn (2024) – abrdn: Feeling the heat in Finland ↑
Partners Group (2021) – Partners Group acquires District Heating Platform in Northern Europe ↑
Ulma (2023) – Contribution to the energy efficiency of single-family houses: This means the government’s new proposal ↑
RES Legal (2019) – Renewable energy policy database and support: single ↑
CXC “Lessons from European regulation and practice for Scottish district heating regulation” (2018) ↑
Salite et al (2024) “A comparative analysis of policies and strategies supporting district heating expansion and decarbonisation in Denmark, Sweden, the Netherlands and the United Kingdom – Lessons for slow adopters of district heating” ↑
PGGM (2021) – PGGM acquires minority stake in Swedish heating company Stockholm Exergi | PGGM ↑
Gren (2024) – Gren in Estonia invests over EUR 20 million in upgrading heating networks – Gren Finland ↑
IEA.org – “Energy price compensation for households” (2023) ↑
EIS Estonia (2024) – Grant for upgrading heaters for small residences | EIS ↑
Riigi Teataja District Heating Act- District Heating Act–Riigi Teataja ↑
Gren (2024) – Gren acquires Viljandi district heating company ESRO – Gren Energy ↑
Triple Point Heat Networks “Unlocking Private Finance in heat networks” (2023) ↑
Clean Energy Wire “Germany opens heating transition support scheme to all groups of building owners” 2024 ↑
Nordic Investment Bank – Member countries, governing bodies and capital – Nordic Investment Bank ↑
Nordic Investment Bank – NIB and Rīgas Siltums continue cooperation for efficient heating – Nordic Investment Bank ↑
The Scottish National Investment Bank “Scotland’s transition to net zero heat” (2022) ↑
The Scottish Government has committed to a just transition to net zero by 2045. However, the cost of this transition cannot be met by public sector funding alone, so sectors must attract private capital investment to fill investment gaps.
This study aims to develop a robust and repeatable methodology to investigate the investment readiness of net zero sectors in Scotland, and to test this methodology by applying it to onshore wind, offshore wind and hydrogen as a proof of concept. The report also includes key interdependencies, barriers and opportunities for priority action by the Scottish Government or its partners.
Findings
The report defines investment readiness as: “a position where investors can understand the investment opportunity and develop projects with sound understanding of financial fundamentals and risks based on reasonable projections.”
The researchers developed a bespoke investment assessment methodology that uses a scorecard approach. The methodology has been developed based on the well known Porter’s Five Forces model, in order to score sectors against the following criteria:
- market growth potential
- profitability
- policy support
- market accessibility
- supporting infrastructure
- demand
Summary findings
The summary key findings identified from the individual sector assessments are that the onshore and offshore wind sectors are more established and mature markets, and therefore both sectors score higher than the hydrogen sector, which is a more nascent sector.
The Scottish Government is rolling out the methodology across some of Scotland’s other key net zero sectors.
If you require the report in an alternative format, such as a Word document, please contact info@climatexchange.org.uk or 0131 651 4783.
Research completed in April 2024
DOI: http://dx.doi.org/10.7488/era/4468
Executive summary
The Scottish Government has committed to a just transition to net zero by 2045. However, the cost of this transition cannot be met by public sector funding alone, so sectors must attract private capital investment to fill investment gaps.
This study aims to develop an approach for assessing the investment readiness of net zero sectors, and to test this approach in relation to onshore wind, offshore wind and hydrogen as a proof of concept. The report also includes key interdependencies, barriers, and opportunities for priority action by the Scottish Government or its partners.
Key findings
We define investment readiness as: “a position where investors can understand the investment opportunity and develop projects with sound understanding of financial fundamentals and risks based on reasonable projections.” This definition is based on a literature review, stakeholder engagement, and our own expertise.
This definition of investment readiness can be viewed as both:
- A minimum standard of attractiveness at which an investor would consider an opportunity.
- A way of assessing how risky an investment is, which will affect the return that investors demand and, therefore, the cost of capital for the proposition.
The definition is based on the perspective of an investor looking to generate risk-adjusted returns. Where government can improve the investment readiness of a given energy transition sector, this would encourage capital investment from a wider range of investors, and, likely, at a lower cost of capital.
We developed a bespoke investment assessment framework that uses a scorecard approach. Under this approach, sectors are scored against the following criteria:
- market growth potential
- profitability
- policy support
- market accessibility
- supporting infrastructure
- demand
The key qualitative findings we identified from the individual sector assessments are:
- The hydrogen sector scores lower with regards to overall investment readiness compared to the wind sectors, since it is still developing. This is reflected in domestic regulation and incentives which are still in progress. Developing supply chains are vulnerable to external shocks and demand uncertainty. These challenges offer a chance for policy makers to make informed decisions on hydrogen market design, ensuring maximum benefits from the evolving market.
- Market growth potential is strong for both onshore and offshore wind sectors over the forecasted horizon of 5 to 10 years, backed by policy support. Based on the evidence collected and presented in this report, we anticipate growth for hydrogen. However, this growth is expected to be modest compared to the wind sectors due to uncertainties surrounding factors such as end-use scenarios and availability of buyers, as well as the ongoing development of export plans.
- There is a low industry profitability level for both wind sectors in the short-term and long-term. Maturing global supply chains, increased competition levels and interest rates all reduce future profitability. There is below average ability to control costs due to reliance on imports of key components. This presents an opportunity to decrease exposure to global supply chains, and mitigate potential profitability erosion risks from proposed changes to network charges, such as those discussed as part of the electricity market reform processes.
- Onshore and offshore wind sectors scored highly in terms of level of policy support. There are well-established regulatory pathways supporting project development and the industry enjoys broad political support across the major political parties in Scotland. Green hydrogen is generally well perceived in political discussions, but potential challenges with its adoption limits policy support. Domestic regulations and incentives are still being developed for green hydrogen.
- Onshore and offshore wind are mature technologies and are crucial for decarbonising the power sector, resulting in above average scores for the market accessibility – for selected technologies only – reflecting the ability of a company to enter a sector.
- Supporting infrastructure scored poorly relative to each sector’s overall scores. This presents an opportunity to improve investment readiness as sectors continue growing. Existing electricity grids require significant upgrades to compensate for increasing wind capacity. Grid reinforcements progress has been slow despite plans in place according to stakeholder interviews, leading to delays in connecting wind projects. Additionally, stakeholders noted that planning applications for wind developments are tedious and may delay progress. For hydrogen, where supply chains are developing, stakeholders highlighted potential funding gaps for skills and development.
- Stakeholders noted that whilst the ambition to increase supply of wind is a good indicator of a supportive investment climate, investors would need to consider the offtake of that renewable power. At present, there are well publicised network constraints on transmitting Scottish wind power to England where demand is greater. This has led to times when that power is curtailed / turned down and may act as a concern for future investment in wind power. Stakeholder discussions pointed to the importance of ensuring that there is offtake for that power; either through transmission to England, export to third countries, or greater demand from Scottish industry, such as hydrogen electrolysis.
Glossary / Abbreviations table
Introduction
This report provides a methodology to assess the investment readiness of Net Zero sectors in Scotland. The methodology is applied to three test sectors: offshore wind; onshore wind, and hydrogen.
Policy context
The Scottish Government has committed to a just transition to net zero by 2045. The cost of this transition cannot be met by public sector funding alone. It must therefore include substantial private capital investments into net zero sectors, such as energy.
The findings of the study will be used to feed into future policy development such as Scotland’s forthcoming Just Transition Plans, the delivery of the Policy Prospectus, and the National Strategy for Economic Transformation. The methodology designed as part of this study is intended to be used by the Scottish Government in any net zero sectors in the future. This will provide a basis for future measurement and evaluation of these sectors, thereby supporting the Scottish Government’s efforts to improve investment readiness of net zero sectors to reach net zero by 2045.
Research aims
The aims of this research project were to:
- develop a clear definition of ‘investment readiness’
- develop a repeatable methodology to assess the investment readiness of net zero sectors in Scotland
- test this methodology by providing an initial high-level assessment for three of the net zero energy production sectors: onshore wind, offshore wind, and hydrogen
- validate the methodology and assessments with stakeholders, including the Scottish Government, investment managers, and asset owners in the three net zero energy production sectors
- provide a narrative explaining the outcomes of the investment readiness assessment for three net zero energy production sectors
- identify key interdependencies, barriers, and opportunities for priority action by the Scottish Government or its partners.
Defining investment readiness
Investment readiness is a relatively broad concept, and its application varies depending on the wider context. In providing a definition in this project, we aimed to strike a balance of broad applicability (i.e., the definition is broad enough to apply effectively to a variety of sectors) whilst also meeting the needs for the energy transition. The definition is supported by LCP’s experience, a literature review[1], and our stakeholder engagement.
We define investment readiness as follows: a position where investors can understand the investment opportunity and develop projects with sound understanding of financial fundamentals and risks based on reasonable projections.
Understanding the opportunity is crucial for investors. Investors should be able to identify the scale of the opportunity and how it is likely to evolve over the coming years. This is particularly appropriate to energy transition investments, where investors are looking to profit from a rapidly evolving market with high levels for potential growth, widely expected to last for over 30 years (as supported by stakeholders that were engaged for this project).
Having a sound understanding of financial fundamentals and risks is key to energy transition investments. These investments tend to be large scale projects with high volumes of capital committed upfront. Therefore, based on LCP’s experience, investors look to establish detailed, credible financial projections before investing. Further, we note that a large proportion of these investments are in core infrastructure assets – where the investor looks to minimise uncertainty, and therefore risk, in the income produced by these assets. This is often achieved through the use of contractual income schemes such as Contracts for Difference (CfDs) or power purchase agreements (PPAs) for generating assets. We explore risk management for core infrastructure investors further in Appendix B.
“Reasonable” projections depend on the sector that is being analysed. However, for projections to be deemed reasonable, other investors who analyse the same set of information should broadly agree with the projections used.
Ultimately, an environment where risks can be understood and reasonably quantified is a pre-requisite to attracting capital, both equity and debt. The definition of investment readiness provided above can be viewed as both:
- A minimum standard of attractiveness at which an investor would consider the opportunity. If a proposition does not reach that minimum standard, it is not investment-ready.
- A way of assessing how risky an investment is, which will affect the return that investors demand and therefore the cost of capital for the proposition.
The methodology for assessing investment readiness in Section 6 details the factors that investors consider when analysing an investment further[2]. Of course, a sector that is not “investment ready” would be expected to receive a low score on this assessment.
We carried out a literature review to gather broad definitions of investment readiness to test whether our working internal definition was applicable or needed refinements.[3]
We broadly found that other definitions of investment readiness aligned with our definition. Common themes included in definitions include a requirement for sufficient publicly available information to assess and understand an opportunity. Furthermore, there is a requirement for projects to meet investment parameters for investors (i.e., the criteria or factors that investors consider when evaluating potential investment opportunities).
Our investment readiness definition is based on the perspective of an investor looking to generate risk-adjusted returns. Investors will look at projects on a case-by-case basis and determine their attractiveness. Critically, where the government can improve the investment readiness of a given energy transition sector, this would encourage capital investment from a wider range of investors, and, likely, at a lower cost of capital.
How investors take decisions
The section below is based on LCP Delta’s insight into investor decision making. This is was gathered from LCP’s 25 years’ experience in providing investment advice in over £250 billion of invested assets.
When determining whether to invest in a particular sector, investors typically follow a two-stage decision making process, referred to by the investment industry as ‘top-down meets bottom-up’. This can be explained as follows:
- Top-down: Sector level opportunities are screened against the investor’s investment parameters at the macro level. For example, an investor may be looking to invest in certain regions and sectors, and to invest in projects at different stages of development (e.g., greenfield vs brownfield projects). These decisions might be influenced by the history and expertise of the firm as well as its geographical location.
- Bottom-up: Individual deal opportunities are assessed in detail to determine an expected return on investment, and the level of risk associated with the project. At this stage, financial models are developed and, importantly, investors look to establish a credible revenue and cost models, and determine the level of competitive advantage. To perform this level of analysis, investors require sector information to be readily available.
The precise weighting that each investment manager places on each stage varies from investor to investor. We have found that in the energy transition space, sector allocation (i.e., the proportion of the portfolio invested in each region and sector) is often determined by the expertise/area of focus of a specific investment manager rather than a global assessment of the opportunity set.
We have observed many investment managers adopting a bottom-up process when making investment decisions. There is a minimum level below which investors will not invest. Above this minimum level, the more attractive the investor perceives the opportunity to be, the less return they will demand for taking the risk, lowering the cost of capital.
We note that investments in the energy transition will typically be in infrastructure-like projects. These projects can be categorised in terms of their risk and expected return characteristics. We list the key categories as follows, from low risk and return expectations to high:
- Core: a sub-category within infrastructure equity investment, which focusses on low-risk assets with limited asset management required to generate returns. Core infrastructure assets should provide consistent performance throughout all stages of the economic cycle. Examples of core infrastructure would be ports, rail, or roads.
- Value add infrastructure refers to assets that may have similar or the same qualities to core assets but offer the opportunity for additional value creation through further development, new contracts, or increased capacity, for example. An example of a value add infrastructure asset would be a solar farm where most of the asset is operational but the investment manager is developing a significant expansion to the size and capacity of the solar farm, requiring material capital investment.
- Venture capital – a form of private equity investment which finances start-up companies with the potential for significant growth.
Where investors deploy capital into value-add and venture capital opportunities, additional risks might include:
- Additional construction and development activities. The costs for these activities may be greater than the investment manager’s budget, or the activities may take longer than initially expected, introducing additional uncertainty over profits to be received in the short term.
- The use of less mature technologies. The investment manager may invest in newer technologies that have not been used at scale. The potential upside may be higher for the investment manager if the technology becomes widely adopted, however this is balanced with the risk that the technology is less profitable than expected.
- Investing in projects or companies at an earlier stage, where there may be high profit opportunities but higher levels of uncertainty.
Investors often access energy transition investments via closed ended funds – these are funds that have a finite life (usually around 10 years). Investors commit capital at the inception of the fund, and the investment manager invests this capital as opportunities arise. At the end of the fund’s life (in its “wind down” period), the manager disinvests from assets and returns capital (and any gains) to investors. In contrast, open ended funds have a perpetual life, with regular (perhaps quarterly or semi-annual) dealing dates in which investors can invest or disinvest from the fund.
Investment into the energy transition is open to all asset owners, but due to the type of arrangements being offered by investment managers, typically larger institutional investors have dominated as the minimum investment sizes are typically USD10 million per fund. We expect that large asset owners (e.g., those with at least £400 million in assets) are likely to be important investors in the energy transition space.
These observations are backed by the stakeholder engagement we completed with investment managers. These investment managers first screen out opportunities that are not applicable to the specific mandate of a given fund. This screening may take place as follows:
- At the broadest level, the asset class, e.g., equity, bonds, commodities, currencies, etc., and geography is considered – some investors only take equity positions, as opposed to debt positions and only invest in Europe rather than globally, for example.
- Some investment managers screen out certain countries where the investment manager has a lack of knowledge or expertise in that country, despite being within the allowable regions of the fund. One investment manager noted that they will only invest where they believe they have a competitive advantage compared to other investors. Therefore, they would not invest in certain countries where they lack experience.
- Sub-divisions of asset classes are also considered – infrastructure equity investors may have a mandate for core (lower risk) infrastructure assets only, whilst some may invest in higher risk areas such as venture capital. This distinction may be set explicitly in the fund’s terms, or indirectly as indicated by the range of returns that the fund targets.
- Screening may take place based upon a variety of other objectives for the fund. For example, one investment manager’s fund includes an explicit objective of delivering a measurable decarbonization impact. Alternatively, one investment manager has a variety of objectives including extending equality of opportunity, net zero, and innovation. The investment manager also aims to invest where private market funding is lacking. A fund’s explicit objectives will naturally lead to the screening out of certain opportunities.
Frameworks for assessing investment readiness
A wide variety of frameworks have been developed for the assessment of sector attractiveness with regards to investment. Several have gained more traction with frequent use within industry and support in academic literature. We discuss three of the most prominent and relevant frameworks to the energy transition below: Porter’s Five Forces, PEST, and SWOT[4].
Porter’s Five forces
Porter’s Five Forces is used to understand both the attractiveness of an industry, and the levels of competition within it. The framework is very popular in both the academic environment and industry.
The framework focusses on evaluating the factors that determine the level of profit that can be achieved in a particular industry, driven by the level of sustainable competitive advantage. We describe each element of the traditional Porter’s Five Forces model as follows:
- Supplier power. An assessment of suppliers’ ability to set prices. This is driven by factors such as the number of suppliers, how unique each product or service is, relative size and strength of the supplier, and cost of switching from one supplier to another. Where suppliers have power, a sector might face cost pressures which increase the cost.
- Buyer power. An assessment of how effectively buyers can negotiate prices downward. This is driven by factors such as the number of buyers in the market, the importance of each individual buyer to the organisation, and cost to the buyer of switching from one supplier to another. Strong buyer power can reduce profitability.
- Competitive rivalry. The main components of this force are the number of competitors in the market and their similarity to the organisation. If there are many competitors offering very similar products and services, this would lead to downward price pressure and therefore would reduce attractiveness of the sector.
- Threat of substitution. Where close substitute products exist in a market, it increases the likelihood of customers switching to alternatives (especially in response to price increases).
- Threat of new entry. Profitable markets attract new entrants, which erodes profitability. Unless the existing organisations have strong barriers to entry (e.g., patents or high capital requirements) and economies of scale, then new entrants will emerge.
Aside from the application of Porter’s Five Forces in academic literature, literature exists which directly evaluates the effectiveness of the model. Generally, we believe the model is well supported, albeit with certain criticisms that are highlighted in a short sample of this literature in Appendix A. We address these criticisms of the model directly in Appendix B.
Political, economic, social, and technological analysis (PEST)
PEST analysis focusses on the external factors affecting an industry and how these factors will impact the performance and activity of the sector in the long term. PEST is used in academic literature to assess the attractiveness of a wide variety of industries.
The external environment considered by PEST is an important factor to consider for industry analysis. The political and regulatory environment is very important to energy transition investments. LCP’s opinion is that whilst Porter’s Five Forces is generally a more effective model for evaluating the ability to generate strong profits in a particular industry, it is important to ensure that the external factors in PEST are incorporated.
We consider that a key drawback of the PEST framework is that its focus is purely external. Internal factors such as competitive rivalry and barriers to entry are not included, and are fundamental to the attractiveness of an industry – therefore, PEST should not be relied upon alone.
The PESTEL framework expands upon PEST by adding two factors: Environmental and Legal. Energy transition investments are inherently positive for the environment category by their nature and therefore this is generally not a differentiating factor between energy transition sectors. Also, we believe that legal considerations can be captured within the same category as political and regulatory factors.
SWOT
SWOT, or strengths, weaknesses, opportunities, and threats analysis is used to assess both the internal and external forces that may create opportunities or risks for an organisation. The framework is broad and relatively generic, such that it can be applied to a variety of contexts and situations. However, a key drawback of it is that it is much less descriptive than other models such as Porter’s Five Forces and PEST – the factors are less specific, making it more difficult to apply on a consistent basis.
Overall, we believe that the four elements of the SWOT framework are already incorporated within Porter’s and PEST frameworks in a structure that is more relevant to energy transition sectors.
Investment readiness methodology
Our framework to assess investment readiness is based on stakeholder engagement with investors, relevant academic literature as described in the section above and the author’s expertise of the nature of energy transition sectors. On basis of these considerations, we have modified Porter’s approach to include time elements, policy support, supporting infrastructure, and technology readiness. See Appendix B for further detail.
The resulting investment readiness framework is in the form of a scorecard approach composed of six factors:
- market growth potential
- profitability
- policy support
- market accessibility
- supporting infrastructure
- demand.
For ease of visualisation, we have plotted the factors on a ‘radar’ chart, as illustrated in Figure 2. In general, the larger the area bounded by the scores, the more investable a sector is. Where factor scores dip toward the centre, this should indicate that further investigation as to how the score might be improved is warranted.

Figure 2. Example ‘radar’ output.
The factors and the types of aspects underlying their analysis are presented below.
Market growth potential
This factor covers how much the markets are expected to grow in a five-to-ten-year horizon for that technology. Some sectors may expect to see periods of decline or near zero growth whilst others experience growth significantly greater than the rest of the economy. This metric helps capture what phase a technology is at in the lifecycle model – whether the market is emerging, in growth, under maturity, or in saturation and decline. We note that a time horizon of 5-10 years is in line with the time horizon for entering and exiting an investment for managers that we met with as part of the stakeholder engagement.
Profitability
Profitability encompasses a range of factors aimed at capturing security of income. This includes short term factors that indicate whether the sector can make viable profits either now or in the foreseeable future. Examples of these considerations may be current revenue trends and an examination of variable costs (e.g., raw materials, labour) to determine the margin of profit. We also measure how vulnerable the industry is to variable costs and who holds more market power in costing decisions. We also look at longer-term factors to indicate how secure pricing/revenue will be for a certain technology. Some technologies are backed by long term pricing contracts, such as CfD’s, that provide long term pricing security. Other examples that may be considered is the market stability and the impact of technological advancements, such as improvements in efficiency or cost reduction from economies of scale.
Policy support
Policy support measures the extent to which the government (both the Scottish and UK Government) has put in place a policy or regulatory environment designed to support, de-risk and/or aid the growth of the sector. Examples of considerations that can be made are renewable energy targets, subsidies and incentives to encourage investment in the sector, as well as the permitting processes, grid connection regulations, and environmental standards, to determine if they facilitate sector growth. The regulatory environment is combined with an analysis of wider political support which considers whether other political parties are similarly disposed to the sector. These factors help gauge the extent to which current or future governments are providing a supportive, and therefore a de-risked, environment for investing.
Market accessibility
Market accessibility measures the competitive environment and other market factors. This helps to determine the extent to which the sector is exposed to growth, competition, and barriers to entry. Firstly, we look at a range of subfactors encompassing how competitive the market is for a technology or sector. This includes companies that supply similar products that may provide a similar service both in the short and long term. In addition to competition, the maturity of the market is also measured to understand the level of risks for the adoption of a sector or technology. Other aspects that may be considered are competitors’ strategies, including pricing, marketing, and product differentiation, to understand competitive dynamics. Regulatory, technological and capital barriers to entry can be considered. These factors help to understand whether a market for a technology or sector is ripe for new entrants as well as for growth.
Supporting infrastructure
Supporting infrastructure determines the capability of a country to support the growth of a sector or technology. The availability and capability of the domestic installation and maintenance workforce determines the ability to meet demand for the technology or sector. We also measure for the state of domestic infrastructure to see if it would be able to support these technologies or sectors. Further, this factor assesses the development and efficiency of supply chains. A sector with strong supporting infrastructure sends a strong signal to investors that growth will not be constrained by this factor. The factor may include the consideration of physical infrastructure such as roads, bridges, utilities, and telecommunications networks, digital infrastructure to facilitate technology adoption and connectivity, as well as energy specific infrastructure, including power generation, transmission, and distribution systems, to meet the sector’s energy needs.
Demand
Demand measures price competitiveness compared to alternative sources for the product or service against other technologies or sectors. We assess this by looking at two different time horizons: short term (up to 3-years) and long term (5-10 years). Furthermore, the demand for the asset’s product or service is considered over the forecast horizon of five to ten years. A sector or technology with strong demand for its product or service will send strong signals to investors that there will be sufficient levels of demand to satisfy the expected level of supply.
How to use and interpret quantitative results
A detailed scorecard, including specific sub-factors has been provided to the Scottish Government for further development and use. Applying the scorecard to a sector requires the user to assign a 1-6 score to a list of sub-factors that fall under each factor described above. For example, profitability may include sub-factors around current revenue trends, industry vulnerability to variable costs and security of pricing / revenue. The sub-factor scores are averaged to create a factor score. The six factor scores are aggregated using equal weight averaging to create a total score.
It is important not to take either the total score or factor scores as absolutes in terms of whether a sector is investment ready or not. As the sub-factors included in different factors may interact with each other, it is not recommended that total scores are used in the context of sector filtering or ranking. This would require additional analysis.
The scores allow a high-level assessment of relative strengths and weaknesses of sectors and to drill down to the factors and sub-factors that are driving the score. The objective is to identify where scores are lower and to use that as a basis of discussion as to how the score or scores can be improved, or if a score is particularly low that it may in itself be restricting investment despite high scores elsewhere. In general, taking action to improve scores should lead to improved levels of investability and a lower cost of capital[5].
Investment readiness of selected energy sectors
This section presents results from the three example net zero sectors to which our investment ready methodology was applied and tested. The purpose of this analysis is to test the methodology and to provide an initial high-level assessment of the test sectors. The analysis relies on the authors’ internal industry expertise; however, the level of stakeholder engagement was limited by the scope of the project to three industry experts / asset owners and the relevant sector leads at the Scottish Government. Furthermore, the analysis is representative of the authors’ understanding of the sector at the time it was completed, in November 2023 – January 2024.
Figure 3 shows the investment readiness scores for Scotland’s offshore wind, onshore wind, and hydrogen sectors (a score of 1 is lowest, while a 6 is best). Quantitative results are illustrative only due to the limitations explained above.

Offshore wind has the highest overall score, whereas hydrogen has the lowest overall score. Hydrogen receives low scores for several factors mainly because the sector is still in the early stages of development.
Figure 3. Investment readiness scores for offshore wind, onshore wind, and hydrogen
Table 1. Investment readiness scores for the example net zero sectors
|
Factor |
Offshore wind |
Onshore wind |
Hydrogen |
|---|---|---|---|
|
Market growth potential |
6.0 |
5.0 |
4.0 |
|
Profitability |
3.3 |
3.5 |
2.5 |
|
Policy support |
5.5 |
5.0 |
3.0 |
|
Market accessibility |
5.0 |
4.5 |
3.4 |
|
Supporting infrastructure |
4.0 |
3.7 |
2.0 |
|
Demand |
3.7 |
4.0 |
3.0 |
|
Overall average |
4.6 |
4.3 |
3.0 |
*Illustrative results only. See limitations in section 6.7.
Offshore wind
Offshore wind technology involves the installation of wind turbines in ocean waters, where winds are stronger and more consistent than on land. In this assessment, both fixed and floating offshore wind technologies are collectively considered as part of the offshore wind sector as a whole. Overall, this sector receives a strong overall score of 4.4 out of 6.0, surpassing other sectors included in this study. The market growth potential factor scored a maximum 6.0 points, while profitability scored the lowest, at 3.5. The scores assigned are supported by high-level narratives, drawing on a range of data sources and having undergone a validation process. These narratives are discussed below.
Table 2. Detailed investment readiness scores for offshore wind
|
Overall average |
Market growth potential |
Profitability |
Policy support |
Market accessibility |
Supporting infrastructure |
Demand |
|
4.6 |
6.0 |
3.3 |
5.5 |
5.0 |
4.0 |
3.7 |
*Illustrative results only. See limitations in section 6.7.
Market growth potential
We scored the market growth potential for Scottish offshore wind at the highest possible score of 6.0 out of 6.0. The Scottish Government has been clear that wind power is one of the lowest cost forms of electricity and where it is focussing efforts. We expect strong market growth for Scottish offshore wind given Scotland’s commitment to reach 8-11GW offshore wind capacity by 2030 (Scottish Government, 2023). This is also supported by the Scottish Government’s commitment to invest up to £500 million over five years towards Scotland’s offshore wind supply chain through the Strategic Investment Model, with £67 million committed towards the 2024/25 financial year (Offshore Wind Scotland, 2024). Additionally, there is potential for significant additional capacity beyond current ambitions and Scotwind alone could deliver up to 28GW offshore wind by early 2030s (Munro, 2022).
Profitability
We assigned a relatively modest profitability score to offshore wind of 3.3 out of 6.0. We are expecting the aggregated profitability to remain close to breakeven level both in the short-term and within the next 5-10 years due to a number of reasons. The offshore wind sector demonstrates a below-average ability to control costs due to surging supply chain and interest rate costs. Additionally, the Scottish offshore wind sector still relies on imports for key components such as turbine blades (Almqvist, et al., 2023). This could expose projects to risk of supply chain bottlenecks as there is an increasing global trend for offshore wind developments (Global Wind Energy Council, 2023). There is a high certainty for the pricing/revenue mechanism as the sector mainly relies on CfDs. However, Scottish wind projects face additional costs compared to other locations in the UK due to transmission losses and Transmission Network Use of System (TNUoS) charges, making price points to be more expensive by 20-30% compared to rest of the UK (based on stakeholder interviews)[6]. Future policy change will bring risks, such as the potential move to Locational Marginal Pricing (LMP) under the ongoing Review of Electricity Market Arrangements (REMA) (Tam & Walker, 2023). This could be a significant change for the sector and is outside the direct control of the Scottish Government as it is not a devolved matter.
Policy support
The sector scored highly in terms of level of policy support at 5.5 out of 6.0. There is a well-established regulatory pathway supporting the development of projects from the Crown Estate Scotland leasing rights, through to requirements for CfD eligibility (UK Department for Business and Trade, 2020). The industry enjoys broad political support in Scotland, with major parties (including the current governing party) endorsing its expansion. The Scottish Government’s commitment to achieving net-zero emissions by 2045 further solidifies this support (Scottish Government, 2023). The Scottish Government recognizes wind as essential for decarbonising the power sector and the wider economy.
Market accessibility
The overall score for market accessibility is relatively high at 5.0 out of 6.0 mainly due to the sector’s maturity. Fixed-bottom offshore wind technology has been proven in industry at scale in Scotland, and there is a substantial potential pipeline for floating wind capacity (24.7GW) which could be delivered by 2035 (Offshore Wind Scotland, n.d.). Additionally, this industry is vital for both the power sector and the overall economy. It has a great opportunity for growth in the coming years without becoming oversaturated. Currently, the Scottish offshore wind market has around 16 players comprising of a mix between major players (typically large international companies), consortiums, and local companies (Crown Estate Scotland, 2023).
Supporting infrastructure
We assessed the supporting infrastructure for the Scottish offshore wind sector at 4.0 out of 6.0. Scotland has a strong history of producing highly skilled workers for oil and gas, shaped by legacy offshore activities, that supports the capability of wind installation and maintenance workforce (Almqvist, et al., 2023). The Scottish grid infrastructure supports the integration of offshore wind given the availability of power stations and transmission lines across Scotland. However, challenges related to the grid (such as decreasing headroom availability) and connection delays may emerge with the growing capacity of offshore wind installations. Mitigation plans to upgrade the grid are in place (NGESO, 2022), however, the pace of grid delivery compared to planning applications remains underwhelming. This is evident from the long queue of nearly 400 GW energy projects across the UK as of late 2023 (Ofgem, 2023).
The offshore wind supply chain is relatively well-established, yet risks exist with importing key turbine components and availability of supporting facilities like ports and hubs (Almqvist, et al., 2023). However, we have seen efforts underway to upgrade port facilities to support offshore wind deployment, led by both the Scottish Government (Scottish Renewables, 2023) and private equity (Jones, 2023).
Demand
We scored the demand factor for Scottish offshore wind at 3.7 out of 6.0. The power system is changing as we decarbonise. Thermal generation units (such as gas or coal fired power stations) are retiring and being replaced with low-carbon solutions, such as wind or solar which is driving demand for these assets.
Stakeholders noted that whilst the ambition to increase supply of offshore wind is a good indicator of a supportive investment climate, investors would need to consider the offtake of that renewable power. At present, there are well publicised network constraints on transmitting Scottish wind power to England where demand is greater. This has led to times when that power is curtailed / turned down and may act as a concern for future investment in wind power. There is further network investment planned which should alleviate some of these concerns (for example, the B6 boundary – the boundary between Scotland and England – is due to double in capacity).
In the future, hydrogen is expected to be an offtaker for wind-generated electricity instead of curtailment, but this remains uncertain as the hydrogen sector is still developing. Moreover, hydrogen electrolysis will compete with other technology options for using curtailed energy, such as interconnection, battery storage, demand-side response and new pumped hydroelectricity capacity (Hawker & Oakley, 2022).
In stakeholder discussions, investors pointed to the importance of ensuring that there is offtake for that power; whether through transmission lines to England, export to third countries, or greater demand from Scottish industry (such as hydrogen electrolysis).
Onshore wind
Onshore wind technology involves the installation of wind turbines that harnesses wind energy through turbines located on land. This sector receives a strong overall score of 4.3 out of 6.0, sitting marginally behind offshore wind, but ahead of green hydrogen. Market growth potential and policy support scored highly, each scoring a 5.0, while profitability and supporting infrastructure scored the lowest at 3.5 and 3.7, respectively.
Table 3. Detailed investment readiness scores for onshore wind
|
Overall average |
Market growth potential |
Profitability |
Policy support |
Market accessibility |
Supporting infrastructure |
Demand |
|
4.3 |
5.0 |
3.5 |
5.0 |
4.5 |
3.7 |
4.0 |
*Illustrative results only. See limitations in section 6.7.
Market growth potential
We scored the market growth potential for Scottish onshore wind at 5.0 out of 6.0. Growth for the Scottish onshore wind sector is supported by national ambitions (Scottish Government, 2023) to increase onshore wind capacity to 20 GW by 2030. This is a positive ambition, but delivery will be impacted by several factors. Stakeholder interviews highlighted that actual growth will depend on the pace of the consenting process by the Scottish Government. Whilst there are various routes to market for onshore wind, including PPAs, the CfD scheme operated by the UK Government will be important.
Profitability
Profitability is the lowest scoring factor for onshore wind at 3.5 out of 6.0. Levels of profitability are expected to decrease as the sector becomes even more mature. As domestic competition increases, Scotland’s first mover advantage becomes less significant, given less opportunity for greater innovation or learning-by-doing. Onshore wind benefits from consistent global cost reductions due to technological advancement and supply chain maturity. However, the sector may be exposed to supply chain bottlenecks as Scotland is still relying on import for key wind turbine components (Almqvist, et al., 2023). As with offshore wind, there are uncertainties for costs and pricing going forward. While CfD ensures stability for revenue stream and costs for onshore wind, the introduction of LMP (Tam & Walker, 2023) may affect this in the future. Additionally, the existing TNUoS charges will continue to impact the profitability of the onshore wind sector.
Policy support
We scored the policy support factor for Scottish onshore wind at 5.0 out of 6.0. There is strong policy support and regulations favouring the onshore wind sector (Scottish Government, 2023). This support is a contrast to the UK Government where onshore wind has had much less favourable support – this has been to the benefit of Scotland as developers look to Scotland as the only viable GB market. Similarly to offshore wind, the onshore wind sector also enjoys broad support from major parties (including the current ruling party) and the public. The Scottish Government’s commitment to achieving net zero emissions by 2045 further solidifies this support. However, there is a potential risk stemming from REMA that could significantly impact the market arrangements, for example LMP or other reforms to the CfD mechanism.
Market accessibility
We scored the market accessibility factor for Scottish onshore wind at 4.5 out of 6.0. Onshore wind is a mature technology that has been used at scale in Scotland. There is currently 8.8 GW installed onshore wind capacity in Scotland, equal to 60% of the overall UK onshore wind capacity (Kerr, 2023). The technology is considered important to support the power sector and achieving net zero by 2045. There is significant capacity in the pipeline, mostly delivered by several key players (Scottish Renewables, n.d.). This shows that there is competition within the market, but not so much that it is oversaturated. This is a result of market entrance being relatively expensive and requiring long lead times.
Supporting infrastructure
We scored the supporting infrastructure factor for Scottish onshore wind at 3.7 out of 6.0. Scotland has a strong record in producing highly skilled workers for the energy sector, albeit within oil and gas. The level of skilled personnel and access to training in the onshore wind sector are slightly limited, which could impact operation going forward. On top of existing connection issues, there are potential risks on grid stability as more onshore wind turbines are installed (NGESO, 2021). As with offshore wind, plans are in place to mitigate these issues (NGESO, 2022), although the pace of progress is still deemed to be a limiting factor. The sector also faces supply chain challenges. Most turbine components are imported and therefore exposed to supply chain bottlenecks (Almqvist, et al., 2023). Some manufacturers have shown their interest in building a turbine manufacturing facility in Scotland; however, no further details have been announced for investment (Emanuel, 2023).
Demand
We scored the demand factor for Scottish onshore wind at 4.0 out of 6.0. The levelized cost of electricity using onshore wind is relatively low and provides a competitive advantage over other low-carbon power generation sources such as nuclear or CCGT with carbon capture. Furthermore, over the next 5-10 years, it is expected that prices will decrease as the sector matures further and competition increases (UK Department for Business, Energy and Industrial Strategy, 2020).
Scotland’s first mover advantage in onshore wind could result in a new revenue stream from end-of-life services given by the end of the forecast period. End-of-life services include activities such as repowering, decommissioning, or recycling the production capacity after a project’s technical or commercial end of life (Almqvist, et al., 2023).
Currently, and as highlighted for offshore wind, generation output is already surplus to demand in Scotland (Scottish Government, 2024), and the sector is potentially exposed to the effects of oversupply as more projects are completed (LCP, 2022). As discussed in the Offshore Wind section, stakeholder discussions identified the importance of ensuring there are offtakers for this low-carbon power, through transmission to England, export opportunities to third countries, or increased demand in Scotland through electrification and potential hydrogen electrolysis.
Hydrogen
For hydrogen, the focus was on the production of green hydrogen through the deployment of electrolyser technology. This sector receives the lowest overall score of 3.0 when compared to the other sectors assessed in this study. Market growth potential scored the highest with 4.0 out of 6.0, supported by potential export opportunities while supporting infrastructure scored the lowest at 2.0.
Table 4. Detailed investment readiness scores for onshore wind
|
Overall average |
Market growth potential |
Profitability |
Policy support |
Market accessibility |
Supporting infrastructure |
Demand |
|
3.0 |
4.0 |
2.5 |
3.0 |
3.4 |
2.0 |
3.0 |
*Illustrative results only. See limitations in section 6.7.
Market growth potential
We scored the market growth potential for Scottish green hydrogen production at 4.0 out of 6.0. Green hydrogen is expected to grow in Scotland due to ambitious production capacity targets (Scottish Government, 2022) and recently announced large-scale hydrogen production projects (LCP Delta, n.d.). However, we expect slow market growth within the next 5-10 years as currently there isn’t a clear case for large-scale hydrogen use in Scotland. Furthermore, despite Scotland’s ambitious hydrogen export target, no exclusive agreements have been made for hydrogen exports with international markets which would provide a demand for the product.
Profitability
Profitability for Scottish green hydrogen production scored relatively low at 2.5 out of 6.0. At present, green hydrogen projects rely heavily on government subsidies, meaning that the industry is currently not profitable. However, the aggregate industry level profitability is expected to increase as projects scale up and electrolyser costs decrease (IRENA, 2021). We expect the sector to have poor ability to control costs. This is due to a relatively high supplier power for electrolyser supply and raw materials (for domestic electrolyser production). There is a reasonable level of certainty on the revenue model following the CfDs for hydrogen (Hydrogen Allocation Round 1 [HAR1]) under the Hydrogen Business Model scheme (UK Department for Energy Security and Net Zero, 2023).
Policy support
We scored the policy support factor for Scottish green hydrogen production at 3.0 out of 6.0. Green hydrogen is generally well viewed in political discussions given it is potentially a low-carbon solution for multiple sectors. However, there is debate regarding how big a role it will play in a low-carbon economy, given the uncertainties. The Scottish Government has established national targets, action plans and funding to support its development (Scottish Government, 2022). However, some stakeholders may not show their full support due to the potential challenges with hydrogen adoption. For example, facilitating hydrogen use requires significant costs for repurposing existing gas grids and building new infrastructure (LCP Delta, 2023). Furthermore, domestic regulations and incentives are still being developed for green hydrogen in Scotland since the sector is still developing. Currently, the revenue support mechanism for hydrogen is regulated by the UK Government and Scottish Government has little to no ability to influence this. Additionally, there is a slight shift in the current focus of hydrogen consumption: the UK is focused predominately on domestic consumption, whereas there is a greater focus in Scotland on potential export opportunities. We are expecting further policy and regulatory developments as the sector matures.
Market accessibility
We scored the market accessibility factor for Scottish green hydrogen production at 3.4 out of 6.0. There are various types of electrolyser technology with varying TRLs (IRENA, 2021). Green hydrogen will likely be a dominant technology for hydrogen production over the forecast horizon. However, the market is relatively new and risks remain. There are some barriers to entering the market, including scaling up the technology and availability of Engineering, Procurement, and Construction (EPC) contractors. We expect competition to exist in the medium term as these barriers are relatively manageable.
Supporting infrastructure
Supporting infrastructure received the lowest score among all factors for Scottish green hydrogen production, with 2.0 out of 6.0. There is currently a limited skills base given the immaturity of the sector (RGU Energy Transition Institute, 2021); however, there is a strong potential for transferable skills from the large oil and gas workforce base in Scotland. A large amount of training is being dedicated to this area but the sector will not benefit greatly in the short term. On the infrastructure side, Scotland will need to upgrade the existing gas grids and build more hydrogen storage to facilitate hydrogen transport. Green hydrogen supply chains are still being developed and may be exposed to external shocks, such as certain countries controlling the supply chain or other geopolitical events (Baringa, 2023). Additionally, there are potential issues from the availability of water sources, as the electrolysis process would need a significant amount of water.
Demand
We scored the demand factor for Scottish green hydrogen production at 3.0 out of 6.0. For the short term, green hydrogen may be more expensive compared to other forms of energy. Production costs are expected to decrease over the next five to ten years due to learning and economies of scale. This will bring down Scottish green hydrogen prices to be aligned with European green hydrogen prices (Kerle, Herborn, Prickett, & Ltd, 2024). However, demand for hydrogen in Scotland is expected to be relatively low over the forecast horizon, placing further emphasis on export markets. Ongoing trials for hydrogen use in heating and transport have not progressed to commercialisation. Additionally, Scotland’s early-stage plans to export hydrogen into the wider European market may face challenges, including the requirement for new transmission lines and finding an international buyer.
Conclusions
This report developed a clear definition of ‘investment readiness’ which we define as: “the position where investors can understand the investment opportunity and develop projects with sound understanding of financial fundamentals and risks based on reasonable projections.” This definition has been formed from a literature review, stakeholder engagement, and our own expertise.
When determining whether to invest in a particular sector, investors typically follow a two-stage decision making process, referred to as ‘top-down meets bottom-up’. This can be explained as follows:
- Top-down: Sector level opportunities are screened against the investor’s criteria at the macro level.
- Bottom-up: Individual deal opportunities are assessed in detail to determine an expected return on investment, and the level of risk associated with the project.
To assess investment readiness a wide variety of frameworks have been developed but each has its own limitations. We carefully considered the limitation of key frameworks (Porter’s Five Forces, SWOT, and PEST), and when combined with stakeholder validation and LCP’s expertise of energy transition sectors and experience working with investors, we developed a framework that uses a scorecard approach. This approach entails assigning numerical scores against selected factors.
Our investment readiness definition is based on the perspective of an investor looking to generate risk-adjusted returns. Investors will look at projects on a case-by-case basis and determine their attractiveness. Where the government can improve the investment readiness of a given energy transition sector, this would encourage capital investment from a wider range of investors, and, likely, at a lower cost of capital.
The Scottish Government will be able to apply this methodology to other sectors to assess the investment readiness of net zero sectors in Scotland. This methodology can be applied to the same sectors periodically to track the progress of net zero sectors as the Scottish Government aims to reach its net zero goals by 2045 from a just transition.
Key findings of the investment readiness of net zero sectors
Market growth potential is strong for the onshore and offshore wind sectors over the forecast horizon, backed by strong policy support. Growth is present for hydrogen, although relatively modest compared to the wind sectors.
The Scottish Government is setting ambitious targets for both offshore and onshore wind with substantial capacity in the pipeline. Actual market growth will depend on both the Scottish and UK Government’s support. Green hydrogen has market growth potential supported by production and export targets, and the Hydrogen Business Model (a UK Government revenue support scheme to hydrogen producers to overcome the operating cost gap between low-carbon hydrogen and high-carbon fuels). However, we expect this growth to be lower relative to both wind sectors due to uncertainties around demand.
Both onshore and offshore wind are mature technologies, resulting in above average score for market accessibility.
Wind technology is mature and has been proven commercially at scale in Scotland. Going forward, offshore and onshore wind will be crucial for decarbonising the power sector and the broader economy. This forms the basis for the maximum scores in technology readiness and sets it as a dominant technology to deliver electricity to the wider economy. Onshore wind has fewer barriers to entry and more competition than offshore wind due to the sector’s maturity, thus slightly lowering its overall market accessibility score relative to offshore wind.
Green hydrogen is assessed lower than wind since the hydrogen sector is still developing. This brings uncertainties across the various factors, prompting the lower score.
Scores for policy support, supporting infrastructure, and market growth potential are significantly lower for green hydrogen than wind. Hydrogen is generally well-received, with good political support across the political spectrum although domestic regulation and incentives are still being developed. On supporting infrastructure, the supply chain for hydrogen is still being developed and may be vulnerable to external shocks. There are also risks related to water source availability and how the sector somewhat depends on wind electricity (as green hydrogen is envisioned as a potential offtaker for surplus wind electricity). However, these challenges offer a chance to make informed decisions on the hydrogen market design, including realising potential to export production volumes to mainland Europe, to ensure maximum benefits from the evolving market.
The profitability levels of the industry for both onshore and offshore wind are relatively low in the short and long term.
Maturing global supply chains, increased levels of competition and interest rates in the sectors is reducing future profitability. Furthermore, there is a below-average ability to control costs with the sectors relying on imports of key components of turbines. This level of uncertainty directly impacts investment confidence in the sectors. However, it also presents an opportunity to develop the attractiveness of the sectors from decreasing exposure to global supply chains, and by mitigating risks to the erosion of profitability from LMP-REMA and TNUoS charges.
Uncertainty on LMP-REMA could be a significant barrier to investment in offshore wind, onshore wind and green hydrogen.
Various stakeholders highlighted this point for all sectors. However, the exact effect remains uncertain, particularly given the delay in the REMA process (Paul, 2024). The Scottish Government has published key plans and strategy for upscaling all three sectors, but long-term uncertainty remains from the UK Government on the future policy landscape.
Supporting infrastructure scored poorly relative to each sectors’ overall scores. This presents an opportunity to largely improve investment readiness in the three sectors analysed as sectors continue to scale.
Scotland has a large base of skilled workforce and potential to upskill existing oil and gas workers. However, stakeholders highlighted potential funding gaps for skills and development across all sectors (particularly for hydrogen). Furthermore, engagement highlighted that existing electricity grids require significant upgrades to integrate increased wind capacity going forward. Plans are in place for grid reinforcements but progress to resolve this has been slow. Additionally, stakeholders noted that planning applications for wind developments are long-winded and may delay progress.
For green hydrogen, where supply chains are developing, there is an opportunity to significantly upgrade infrastructure (existing gas grids, new transmission lines and storage facilities) to support increasing green hydrogen production capacity for domestic use, as well as exports.
Supply chain issues exist for all sectors due to reliance on import, as faced by the rest of the economy. Yet, when combined with the evident market growth potential, this provides an opportunity to expand domestic manufacturing, which could turn into a new revenue stream.
Stakeholders noted that whilst the ambition to increase supply of wind is a good indicator of a supportive investment climate, investors would need to consider the offtake of that renewable power.
The future power system is changing as we decarbonise. Thermal generation units (such as gas or coal fired power stations) are retiring and being replaced with low-carbon solutions, such as wind or solar, which is driving demand for these assets. At present, there are well publicised network constraints on transmitting Scottish wind power to England where demand is greater. This has led to times when that power is curtailed / turned down and may act as a concern for future investment in wind power(Scottish Government, 2024). Stakeholder discussions pointed to the importance of ensuring that there is offtake for low-carbon wind power; whether through transmission lines to England, export to third countries, or greater demand from Scottish industry, such as hydrogen electrolysis (Hedley, 2024; Hunter, 2024).
References
Almqvist, M., Parker, R., O’Gorman, S., Pritchard, A., Jones, A., Nyström, S., & Ltd, R. U. (2023). Assessment of the structure, conduct and. Edinburgh: Climate XChange.
Baburaj, Y., & Narayanan, V. K. (2016). Five Forces Framework.
Baringa. (2023, September). The geopolitics of hydrogen – navigating the new world order. Retrieved from https://www.baringa.com/globalassets/insights/low-carbon-futures/the-geopolitics-of-hydrogen/geopolitics_of_hydrogen_part_2.pdf
Capital Dynamics. (2023, October 31). Sainsbury’s signs PPA with Capital Dynamics’ Longhill Burn Wind Farm in Scotland. Retrieved from Press Releases: https://www.capdyn.com/news/sainsburys-signs-ppa-with-capital-dynamics-longhill-burn-wind-farm-in-scotland/
Crown Estate Scotland. (2023, July 13). ScotWind Leasing Supply Chain Development. Retrieved from Crown Estate Scotland: https://www.crownestatescotland.com/news/scotwind-leasing-supply-chain-development-statements-updated
Crown Estate Scotland. (n.d.). Our role in offshore wind. Retrieved from https://www.crownestatescotland.com/scotlands-property/offshore-wind/our-role-in-offshore-wind
Crown Estate Scotland. (n.d.). ScotWind leasing round. Retrieved from https://www.crownestatescotland.com/scotlands-property/offshore-wind/scotwind-leasing-round
Dälken, F. (2014). Are Porter’s Five Competitive Forces still Applicable? A Critical Examination concerning the Relevance for Today’s Business. Retrieved from University of Twente – Student Theses: https://essay.utwente.nl/65339/
Dulčić, Ž., Gnjidić, V., & Alfirević, N. (2012). From Five Competitive Forces to Five Collaborative Forces: Revised View on Industry Structure-firm Interrelationship. Procedia – Social and Behavioral Sciences, 1077-1084.
Emanuel, C. (2023, November 17). Vestas plans Scottish turbine factory. Retrieved from TGS 4C Offshore: https://www.4coffshore.com/news/vestas-plans-scottish-turbine-factory-nid28268.html
Fellnhofer, K. (2016). Literature Review: Investment Readiness Level of Small and Medium Sized Companies. International Journal of Managerial and Financial Accounting.
Global Wind Energy Council. (2023). GLOBAL OFFSHORE WIND REPORT 2023. Brussels: Global Wind Energy Council.
Goyal, A. (2021). A Critical Analysis of Porter’s 5 Forces Model of Competitive Advantage. SSRN.
Gregory, D., Hill, K., & Keen, S. (2012, July). Investment Readiness in the UK. Retrieved from TNL Community Fund: https://www.tnlcommunityfund.org.uk/media/research-documents/social-investment/er_invest_ready.pdf?mtime=20190215124536
Hawker, G., & Oakley, G. (2022, November). The potential for hydrogen to reduce curtailment of renewable energy in Scotland. Retrieved from CXC: https://www.climatexchange.org.uk/media/5627/the-potential-for-hydrogen-to-reduce-curtailment-of-renewable-energy-in-scotland-jan-23.pdf
Huppé, G. A. (2014, July 24). Building Impact Investment Readiness. Retrieved from Stanford Social Innovation Review: https://ssir.org/articles/entry/building_impact_investment_readiness#
IRENA. (2021, March 23). Hydrogen series – Part 2: Scaling up Electrolysers. Retrieved from https://www.irena.org/-/media/Files/IRENA/Agency/Events/2020/Jun/IRENA-Insights/Part-2-Green-Hydrogen-Cost-Reduction/IRENA-Insights—Electrolyzer-report-webinar.pdf?la=en&hash=DAA78A2CD061F4894EA5F62E43FC209996308F21
IRENA. (2021). Making the breakthrough: Green hydrogen policies and technology costs. Abu Dhabi: IRENA.
Jones, F. (2023, April 24). Scottish port acquires $374m in private equity for wind power development. Retrieved from Power Technology: https://www.power-technology.com/news/scottish-port-acquires-374m-for-wind-power-development/?cf-view
Kerle, F., Herborn, M., Prickett, S., & Ltd, O. A. (2024, January). Cost reduction pathways of green hydrogen production in Scotland – total costs and international comparisons. Retrieved from https://www.climatexchange.org.uk/research/projects/green-hydrogen-production-and-international-competitiveness/
Kerr, N. (2023, April 26). Wind energy in Scotland: current position and future plans. Retrieved from The Scottish Parliament – SPICe Spotlight | Solas air SPICe: https://spice-spotlight.scot/2023/04/26/wind-energy-in-scotland-current-position-and-future-plans/#:~:text=Currently%2C%20Scotland%20has%208.8GW,capacity%20was%2077GW%20in%202021.https://spice-spotlight.scot/2023/04/26/wind-energy-in-scotland-current-posi
LCP. (2022, May). Renewable curtailment and the role of long duration storage. Retrieved from Drax: https://www.drax.com/wp-content/uploads/2022/06/Drax-LCP-Renewable-curtailment-report-1.pdf
LCP Delta. (2023, August 22). Heating homes in different regions of Great Britain. Retrieved from Citizens Advice: https://www.citizensadvice.org.uk/Global/CitizensAdvice/Energy/Locational%20costs%20of%20heat%20technologies%20in%20Great%20Britain%20-%20FINAL%20REPORT.pdf
LCP Delta. (n.d.). HYbase-Hydrogen Intelligence Service. Retrieved from https://delta.lcp.com/research-services/hydrogen-intelligence-service/
Mason, C., & Kwok, J. (2014). Discussion Paper on Investment Readiness Programmes. Retrieved from OECD: https://www.oecd.org/global-relations/45324336.pdf
Mooney, A. (2023, June 11). Gridlock: how a lack of power lines will delay the age of renewables. Retrieved from Financial Times: https://www.ft.com/content/a3be0c1a-15df-4970-810a-8b958608ca0f
Moray West Offshore Wind Farm. (n.d.). Developing the Moray West wind farm. Retrieved from Moray West Offshore Wind Farm: https://www.moraywest.com/about-us/project
Munro, M. (2022, November). The Bank and ScotWind: Working with Developers to Maximise Scottish Impact & Embed the Energy Transition. Retrieved from The Scottish National Investment Bank: https://www.thebank.scot/sites/default/files/2022-11/scotwind-blog-2.pdf
Net Zero Technology Centre. (n.d.). Hydrogen Backbone Link: Connecting Scotland to Europe. Retrieved from https://www.netzerotc.com/reports/hydrogen-backbone-link-report/
NGESO. (2021). How do we balance the grid? Retrieved from ESO: https://www.nationalgrideso.com/electricity-explained/how-do-we-balance-grid/what-inertia
NGESO. (2022, July). The Pathway to 2030 Holistic Network Design. Retrieved from Future energy: https://www.nationalgrideso.com/document/262676/download
NGESO. (2023, July). Future Energy Scenarios. Retrieved from https://www.nationalgrideso.com/document/283101/download
Offshore Wind Scotland. (2024, February 20). Strategic Investment Model Stage 2 projects announced. Retrieved from https://www.offshorewindscotland.org.uk/news/2024/february/20/sim-projects-published-highlighting-offshore-wind-sector-priorities-for-supply-chain-and-infrastructure/
Offshore Wind Scotland. (n.d.). Offshore Wind Scotland – What’s happening and where? Retrieved from https://www.offshorewindscotland.org.uk/#:~:text=All%20of%20the%20above%20puts,all%20potentially%20deliverable%20before%202035.
Ofgem. (2023, November 13). Ofgem announces tough new policy to clear ‘zombie projects’ and cut waiting time for energy grid connection. Retrieved from Ofgem – Press release: https://www.ofgem.gov.uk/publications/ofgem-announces-tough-new-policy-clear-zombie-projects-and-cut-waiting-time-energy-grid-connection
Paul, K. (2024, January 8). Looming election delays UK power market reform – analysts. Retrieved from Montel: https://www.montelnews.com/news/1534725/looming-election-delays-uk-power-market-reform–analysts
RenewableUK. (2022, February 22). New poll shows majority of Scottish voters support building more onshore wind. Retrieved from News & Publications: Press Releases: https://www.renewableuk.com/news/596321/New-poll-shows-majority-of-Scottish-voters-support-building-more-onshore-wind.htm
RGU Energy Transition Institute. (2021, May). Robert Gordon University. Retrieved from UK Offshore Energy Workforce Transferability Review: https://www.rgueti.com/wp-content/uploads/2021/05/workforce-transferability-report.pdf
Scottish Development International. (2023, July 5). Green hydrogen: assessing the fuel economics and Scotland’s advantages. Retrieved from https://www.sdi.co.uk/news/green-hydrogen-assessing-the-fuel-economics-and-scotlands-advantages
Scottish Government. (2022, September 2023). Assessment of Electrolysers – Final Report. Retrieved from https://www.gov.scot/binaries/content/documents/govscot/publications/research-and-analysis/2022/10/assessment-electrolysers-report/documents/assessment-electrolysers-final-report/assessment-electrolysers-final-report/govscot%3Adocument/assessment-electrol
Scottish Government. (2022, October 13). Assessment of electrolysers: report. Retrieved from https://www.gov.scot/publications/assessment-electrolysers-report/pages/4/
Scottish Government. (2022, December). Hydrogen Action Plan. Retrieved from Hydrogen Action Plan: https://www.gov.scot/binaries/content/documents/govscot/publications/strategy-plan/2022/12/hydrogen-action-plan/documents/hydrogen-action-plan/hydrogen-action-plan/govscot%3Adocument/hydrogen-action-plan.pdf
Scottish Government. (2022, December 21). Onshore wind policy statement 2022. Retrieved from https://www.gov.scot/publications/onshore-wind-policy-statement-2022/pages/6/
Scottish Government. (2022, February 22). Sectoral Marine Plan – Offshore wind for innovation and targeted oil and gas decarbonisation: initial plan framework. Retrieved from https://www.gov.scot/publications/initial-plan-framework-sectoral-marine-plan-offshore-wind-innovation-targeted-oil-gas-decarbonisation-intog/
Scottish Government. (2023, January). Draft Energy Strategy and Just Transition Plan. Retrieved from https://www.gov.scot/binaries/content/documents/govscot/publications/strategy-plan/2023/01/draft-energy-strategy-transition-plan/documents/draft-energy-strategy-transition-plan/draft-energy-strategy-transition-plan/govscot%3Adocument/draft-energy-strategy
Scottish Government. (2023, February 13). National Planning Framework 4. Retrieved from https://www.gov.scot/publications/national-planning-framework-4/documents/
Scottish Government. (2023, September 21). Onshore wind sector deal. Retrieved from https://www.gov.scot/publications/onshore-wind-sector-deal-scotland/
Scottish Government. (2023, January 10). Scotland’s Energy Strategy and Just Transition Plan: Ministerial statement. Edinburgh, Scotland.
Scottish Government. (2023, December). Sectoral Marine Plan for Offshore Wind – EIR. Retrieved from https://www.gov.scot/binaries/content/documents/govscot/publications/foi-eir-release/2023/12/sectoral-marine-plan-for-offshore-wind-energy-eir-release/documents/eir—202200331120—information-release-part-2/eir—202200331120—information-release-part-
Scottish Government. (2023, November 14). Update on Scotland’s renewables and wind power potential. Retrieved from https://www.gov.scot/publications/renewables-and-wind-power-update-to-scottish-affairs-committee/#:~:text=For%20offshore%20wind%20specifically%2C%20capacity,total%20installed%20offshore%20wind%20capacity
Scottish Renewables. (2023, December 18). Letter to the Scottish Parliament – Just Transition for the North East and Moray Inquiry – Planning and Consenting. Retrieved from Members of Economy and Fair Work Committee – The Scottish Parliament: https://www.parliament.scot/-/media/files/committees/economy-and-fair-work-committee/annex/scottish-renewables.pdf
Scottish Renewables. (n.d.). Statistics. Retrieved from Scottish Renewables: https://www.scottishrenewables.com/our-industry/statistics
SGN. (n.d.). H100 Fife. Retrieved from https://www.h100fife.co.uk/
Tam, B., & Walker, A. (2023, May 2). POSTnote 694 – Electricity Market Reform. Retrieved from UK Parliament POST: https://researchbriefings.files.parliament.uk/documents/POST-PN-0694/POST-PN-0694.pdf
Thomas-Peter, H. (2023, April 5). ‘Damning’ report calls for major National Grid changes to prevent UK missing key wind power targets. Retrieved from Sky News – UK: https://news.sky.com/story/damning-report-calls-for-major-national-grid-changes-to-prevent-uk-missing-key-wind-power-targets-12850663
Twidale, S. (2023, November 16). Britain to boost offshore wind auction power price guarantees by 66%. Retrieved from Reuters: https://www.reuters.com/sustainability/climate-energy/britain-boost-offshore-wind-auction-power-price-guarantees-by-66-2023-11-16/
UK Department for Business and Trade. (2020, March 4). Policy paper – Offshore wind Sector Deal. Retrieved from GOV.UK: https://www.gov.uk/government/publications/offshore-wind-sector-deal/offshore-wind-sector-deal
UK Department for Business, Energy and Industrial Strategy. (2021, August). Hydrogen Production Costs. Retrieved from https://assets.publishing.service.gov.uk/media/611b710e8fa8f53dc994e59d/Hydrogen_Production_Costs_2021.pdf
UK Department for Energy and Climate Change. (2014, November). Urban Community Energy Fund – Getting your project ‘investment ready’. Retrieved from https://assets.publishing.service.gov.uk/media/5a7de55de5274a2e87dae369/intro_to_investment.pdf
UK Department for Energy Security and Net Zero. (2023, December 14). Retrieved from Hydrogen Production Business Model / Net Zero Hydrogen Fund: HAR1 successful projects (published December 2023): https://www.gov.uk/government/publications/hydrogen-production-business-model-net-zero-hydrogen-fund-shortlisted-projects/hydrogen-production-business-model-net-zero-hydrogen-fund-har1-successful-projects
UK Department for Energy Security and Net Zero. (2023, September). Government Response to the Call for Evidence on introducing non-price factorsinto the Contracts for Difference Scheme. Retrieved from https://assets.publishing.service.gov.uk/media/64f9c596a78c5f00142657f9/cfd-scheme-non-price-factors-cfe-government-response.pdf
UK Department for Energy Security and Net Zero. (2024, January 22). Hydrogen Allocation Round 2. Retrieved from https://www.gov.uk/government/publications/hydrogen-allocation-round-2
UK Department for Energy Security and Net Zero. (2024, March 12). Review of electricity market arrangements (REMA): second consultation. Retrieved from https://www.gov.uk/government/consultations/review-of-electricity-market-arrangements-rema-second-consultation
Appendices
Appendix A – Investment readiness definition literature
We carried out a literature review to gather broad definitions of investment readiness to test whether our working internal definition was applicable or needed refinements.
We broadly found that other definitions of investment readiness aligned with our definition. Common themes included in definitions include a requirement for sufficient publicly available information to assess and understand an opportunity. Furthermore, there is a requirement for projects to meet investment parameters for investors (i.e., the criteria or factors that investors consider when evaluating potential investment opportunities).
Table 5. Literature supporting the investment readiness definition
With regards to the specifics of definitions, it is important to consider the context and purposes of each one. For example, in the papers listed in the table above, whilst investment readiness for SMEs provides useful information regarding the ability to generate reasonable financial projections (which also applies at the sector level), the strength of a management team is less applicable when analysing a sector as a whole.
Regarding Urban Community Energy Fund – Getting your project ‘investment ready’, we note that securing a bank loan (or other investment) generally would require the presentation of detailed financial fundamentals and the development of reasonable projections. Given that energy transition sectors are relatively new, a key challenge is to build confidence in these fundamentals and projections. It is important that investors have enough available data to be able to assess these points.
Literature review of Porter’s Five Forces
Table 6. Literature review of Porter’s Five Forces
|
Paper |
Key findings |
|---|---|
|
A Critical Analysis of Porter’s 5 Forces Model of Competitive Advantage (Goyal, 2021) |
The author notes that Porter’s Five Forces is an “incredible model”. It is very inter-linkable with other models such as PEST (outlined in Section 5.1.2). The model correctly emphasizes the importance of searching for imperfect markets which create opportunities for supernormal profits. The author notes that governments can have major consequences on the profitability of businesses and that this is not currently reflected in the model. Another criticism noted is that the model is static – capturing an industry at a single point in time, whilst markets are highly dynamic. |
|
Are Porter’s Five Competitive Forces still Applicable? A Critical Examination concerning the Relevance for Today’s Business. (Dälken, 2014) |
The author introduces Porter’s Five Forces as a powerful tool with much support but notes that it has also been criticized as being outdated due to new market dynamics such as digitalization, globalization, and deregulation. After examining the relevance of the model in today’s business environment, the author concludes that the framework still has relevance and that it cannot be considered as wholly outdated. However, the author notes that including additional external forces such as digitalization, globalization, and deregulation does indeed help to enhance the model. |
|
From Five Competitive Forces to Five Collaborative Forces: Revised View on Industry Structure-firm Interrelationship (Dulčić, Gnjidić, & Alfirević, 2012) |
The author notes that there is no doubt that Porter’s framework is a helpful tool to better understand an industry. However, the author notes that the model is static and proposes the addition of time dynamics (i.e., timescales). The author notes that that initial empirical evidence from its study suggest that adding time dynamics is indeed useful. |
|
Five Forces Framework (Baburaj & Narayanan, 2016) |
The authors explain that the five forces framework has been highly influential in strategy literature. However, there are two key limitations: an assumption of stability in the structural characteristics in markets (i.e., a lack of a time dimension), and that the framework is best suited for industry analysis in developed economies (rather than developing economies). |
Appendix B – approach to developing a framework
Our own framework to assess investment readiness is based on:
- our expertise of the nature of energy transition sectors,
- many years’ experience working in these sectors,
- stakeholder engagement with investors (discussed further in this section), and
- relevant academic literature (as above).
On basis of these considerations, we developed an investment readiness framework in the form of a scorecard approach. This is composed of a series of factors and sub-factors that are most important to investors in an energy transition sector scored from 1 (lowest) to 6 (highest). Sub-factor scores are aggregated to the factor level using equal weighting. Factors are aggregated to the overall sector level using equal weighting.
There are four key considerations when developing this framework, these are described below.
Factors for inclusion
We set out the factors to be included in the scorecard in Section 6. Below, we provide a mapping of Porter’s Five Forces and other components (such as elements of PEST) to the final scorecard factors in the table below.
Table 7. Mapping Porter’s Five Forces to our scorecard
|
Factor |
Relationship to Porter’s Five Forces |
|
Market growth potential |
Literature critique of Porter’s Five Forces noting that a time dimension should be included. |
|
Profitability |
Derivations of powers of suppliers and competitive rivalry. |
|
Policy support |
Literature critique of Porter’s Five Forces noting that relevant external forces should be considered, and that elements of PEST can be combined with the model. |
|
Market accessibility |
Derivations of threat of new entry and competitive rivalry. |
|
Supporting infrastructure |
It is crucial for infrastructure investments to be highly connected with other areas of the economy to be profitable. |
|
Demand |
Derivations of power of buyers and threat of substitutes |
Academic literature provides strong validation for the factors provided, which are based on Porter’s Five Forces and PEST, with further enhancements where literature and stakeholder engagement indicate limitations. Our solutions to overcoming such limitations are outlined in Table 8.
Table 8. Addressing model limitations
|
Limitation |
Solution |
|---|---|
|
Literature notes that Porter’s Five Forces is static in nature – representing an industry at a particular point in time. |
Given the considerable growth required in the energy transition space, we address this limitation by adding the “Market Growth Potential” factor. Further, we note that many of the sub-factors are to be assessed over a 5-10 year horizon, rather than a single point in time. |
|
Literature notes that Porter’s Five Forces does not directly account for external forces such as those in PEST Analysis. |
Whilst some PEST factors indirectly affect the Porter’s Five Forces, we introduce an additional “Policy Support” factor, given the heavy reliance of the energy transition on a favourable policy environment. |
|
Infrastructure investments typically require large scale development and to be profitable must be highly connected with other areas of the economy. Porter’s Five Forces does not directly account for this. |
To account for this feature of infrastructure investing, we have added a “Supporting Infrastructure” factor. |
|
Many energy transition sectors are relatively new. As highlighted in our stakeholder engagement, many core infrastructure investment managers will only invest in energy transition technologies that are well proven and ready to be scaled at a commercial level. |
We add a “Technology Readiness” sub-factor within the “Market Accessibility” factor to allow for the assessment of technological maturity. |
The factors in the investment readiness scorecard, outlined in Section 6, were very well supported by discussions with investment managers. Each factor had been referred to either directly or indirectly across the meetings.
Of the investors we spoke to, a number accessed energy transition assets through a core infrastructure style of investing. In this approach, there is a strong emphasis on risk management by accessing stable, contracted revenues. Investment managers generally favour long term contracts of 10 to 15 years that include explicit inflation linkage, with counterparties that are financially sound (whether they are private or public institutions). Contracted revenues such as these are more often accessed in electricity generation sectors (as opposed to energy storage or network sectors, for example).
Infrastructure style investors also note technology maturity as a consideration. Some investment managers only invest in proven technologies that are ready for wider commercial adoption, rather than investing in early stage or unproven technologies. One investment manager noted that one of their funds would generally not invest in any technology lower than level 8 on the Technology Readiness Levels (TRL) scale. The maturity of technology was also referenced through our engagement with key stakeholders from the Scottish Government, with specific reference linking this to the TRL scale.
More generally, stakeholder engagement identified the need to consider the demand for the product or service the sector produces in relation to the market potential. This considers the potential imbalance of supply and demand for the product or service which ultimately can challenge potential market growth. Therefore, despite strong market growth potential, a lack of demand may pose a challenge to market expansion and operability of existing assets.
Qualitative versus quantitative scoring
There are merits of both quantitative and qualitative scoring systems, but for reasons outlined here we decided to use a qualitative system. The scoring framework needs to work for a variety of energy sectors, which would make quantification challenging. For example, the scale applied to the market size of EV adoption would be very different to that of onshore wind and there will be different units of measurements between sectors. This is a key reason for the approach taken to use a qualitative scale scoring system (see Section 6).
Further, in order to take a quantitative approach to setting scores for each factor, a prerequisite is the existence of frequent, up to date, and reliable data upon which to base the scoring. This data would be used in a quantitative model that incorporates back testing and statistical proof to ensure that a given factor is appropriate for the model. However, energy transition sectors are relatively new and largely consist of private assets, which have lower data reporting requirements than publicly listed companies. Therefore, there is a generally a lack of high frequency, high quality data in the energy transition space. As a result, qualitative scoring is the only viable and appropriate method that can be used. Where quantitative data is available, we provide guidance on how this can be used to generate consistent outcomes.[7]
Factor weighting versus unweighted
Based on LCP’s extensive experience and stakeholder engagement, weightings for models may appear to be an intuitively attractive element as people, by nature, often have a high-level innate sense of what is more important in a decision. However, as factors become more granular, this sense is less reliable, making a weighting system fraught. In a high data frequency environment, weightings can be derived statistically, but these must be kept under constant review as to their continued effectiveness. Given that we do not have quantitative data, or any method of empirically testing the appropriateness of weightings, we decided to leave the factors and sub factors unweighted.
Further, we note that the weight placed on any given factor would depend on the opportunity or sector being assessed, as opposed to a sector level assessment. This is supported by the stakeholder engagement we completed. We aim to provide a framework that is broad such that it can be applied to various sectors, and as such we believe that not applying a weighting is most prudent for the framework.
Numerical scoring versus Red Amber Green (RAG) rating
This is generally a lower order decision and one of preference. RAG ratings can be intuitively and visually attractive but are limited by the effective three colour ‘score’. Conversely, scoring using a high number for a maximum rating can lead to too much debate and time spent on nuances that do not affect real-world outcomes.
We decided to use a numerical scoring from 1 (worst) to 6 (best) for each factor, which allows sufficient distinction to be made between the attractiveness of energy transition sectors, whilst avoiding unnecessary complexity.
Appendix C – Technology Readiness Levels
Technology Readiness Levels (TRLs) are a method for estimating the maturity of technologies. They enable consistent and uniform discussions of technical maturity across different types of technology. TRLs are used in our methodology for assessing net zero sectors to distinguish between sectors that are reliant on well-established technologies, compared to technologies which are newly emerging and less proven, which therefore may introduce more risk[8]. The TRLs can be defined as:
Table 9. Technology readiness level categorisation
|
Technology Readiness Level |
Description |
|---|---|
|
TRL 9 |
Actual system proven in its operational environment (competitive manufacturing in the case of key enabling technologies). |
|
TRL 8 |
Active Commissioning: The technology has been proven to work in its final form and under expected conditions. Qualified for full-scale manufacturing but may require minor changes or improvements to the manufacturing process. |
|
TRL 7 |
Inactive Commissioning: The technology has been proven to work in its final form and under expected conditions. However, it has not been qualified for routine use. |
|
TRL 6 |
Large Scale: The technology is proven to work in its final form and under expected conditions. In almost all cases, this TRL represents the end of true system development. |
|
TRL 5 |
Pilot Scale: The basic components of the technology are integrated with reasonably realistic supporting elements. This is high-level technology readiness. |
|
TRL 4 |
Bench Scale: Basic components of the technology are integrated to establish that they will work together. This is relatively low-level technology readiness. |
|
TRL 3 |
Proof of Concept: Active research and development is initiated. This includes analytical studies and laboratory studies to physically validate analytical predictions of separate elements of the technology. |
|
TRL 2 |
Invention and Research: Applied research begins to be translated into practical application. Theoretical applications are developed and applied through analytical and laboratory studies. |
|
TRL 1 |
Basic principles: Scientific research begins to be translated into applied research and development. Examples might include paper studies of a technology’s basic properties. |
Appendix D – Stakeholder engagement methodology
A key consideration for this project was to validate the methodology and sector assessments with stakeholders. This included engaging key stakeholders for the Scottish Government, investment managers, as well as asset owners and industry experts in the three net zero energy production sectors. We completed this by splitting stakeholder engagement into three groups based on the stakeholder type. The objective of the engagement with each stakeholder group differed depending on their expertise. The split of stakeholders engagement by type and objectives are:
- Gaining feedback on the objectives and approach taken to complete the research. This involved the Scottish Futures Trust, and the three Scottish enterprise agencies who were engaged in a single round table. The meeting objective was to inform them of the research and ultimately gain feedback on the approach, methodology, and the key considerations for each sector that was assessed. Follow-up meetings were arranged with Scottish Enterprise to discuss the project in more detail.
- Investment process discussions. This included the Scottish National Investment Bank (two meetings) and two investment managers we identified. Each stakeholder was engaged individually to discuss their investment process, the key factors considered for investments, and any emphasis on individual factors or sub-factors.
- Key factors that are considered for investments. All remaining stakeholder groups: Scottish asset owners, industry experts and the Scottish Government energy sector teams were engaged to discuss the key factors considered for investments in each area. All stakeholders were engaged individually, with exception to the Scottish Government policy teams. The policy teams were engaged in a single roundtable to discuss their respective sectors. These interactions helped validate the methodology presented in this report. Additionally, the sector assessments and key challenges in each of the sectors was discussed with the stakeholders.
The below table summarises the stakeholder engagement we completed:
Table 11. Stakeholder engagement overview
|
Aim of engagement |
Stakeholder(s) engaged |
Status of engagement |
|---|---|---|
|
Scottish Futures Trust, Scottish Enterprise, South of Scotland Enterprise, Highlands and Islands Enterprise |
Round table completed 09/01/2024. Follow-up meeting completed with Scottish Enterprise 30/01/2024. |
|
SNIB (Scottish National Investment Bank), and two other investment managers selected by us |
SNIB meetings completed 20/12/2023 and 16/01/2024. Investment manager calls completed during December 2023. |
|
Scottish Government energy policy teams for hydrogen, onshore wind and, offshore wind, three industry experts / asset owners in the three energy sectors |
Round table for Scottish Government policy teams completed 09/01/2024. 3 separate calls completed for industry experts / asset owners during December 2023 and January 2024. |
© The University of Edinburgh, 2024
Prepared by LCP Delta on behalf of ClimateXChange, The University of Edinburgh. All rights reserved.
While every effort is made to ensure the information in this report is accurate, no legal responsibility is accepted for any errors, omissions or misleading statements. The views expressed represent those of the author(s), and do not necessarily represent those of the host institutions or funders.
See overview of literature reviewed with regards to investment readiness in Appendix A. ↑
The process by which factors for the methodology were selected and validated is provided through Section 5 and Appendix B. ↑
Further details on the literature review used to gather definitions of investment readiness are outlined further in Appendix A. ↑
Literature review for the models is provided throughout Appendix A and B. ↑
Improving investment readiness scores (reflected by a higher ranking in the scorecard methodology) addresses the key risks and uncertainties associated with the sector, technology, or asset. As these perceived risks decrease, the sector, technology, or asset becomes more likely to meet the maximum risk appetite for a greater number of investors. Therefore, a wider array of investors will be more willing to commit capital to the sector. Similarly, as the perceived risk decreases, the cost of debt reduces as the level of interest that investors require on debt instruments, while the minimum return shareholders may require on their equity investment will also be reduced. Combining these factors leads to a decrease in the cost of capital, making it cheaper for the company to raise funds for its operations and investment projects. ↑
TNUoS charges recover the costs of the transmission system. As a result, generators located close to demand centres face lower charges than those located further away, e.g. generators in the north of Scotland located far from large demand centres in the south of England. ↑
The qualitative information that was used in the assessment of the three example sectors was evaluated using LCP Delta’s expertise in energy markets. ↑
More information on TRLs can be found here: Guide to Technology Readiness Levels for the NDA Estate and its Supply Chain (publishing.service.gov.uk) ↑
This study assesses the likely impact of an electricity pricing model known as locational marginal pricing (LMP), as well as its potential alternatives, in the context of the Scottish Government’s Draft Energy Strategy and Just Transition Plan ambitions.
LMP is a component of the UK Government’s ongoing Review of Electricity Market Arrangements (REMA) and could significantly impact Scotland’s energy landscape.
The assessment is based on a literature review and engagement with an expert advisory panel, including members from across the energy industry. The study was conducted between September 2023 and January 2024 and the assessment is based on the literature available at the time.
Under LMP, the national wholesale electricity market would be split into several smaller areas. This creates the opportunity to provide different local price signals that incentivise the optimal siting of generation, demand, and flexibility across the areas. Such incentives can improve the utilisation of renewable energy, reduce the need for network build and reduce costs.
Additionally, variations in price provide flexible assets with locationally specific dispatch signals. This encourages these assets to adjust their consumption or generation to match local grid requirements, further reducing system costs. However, LMP creates significant uncertainty for market participants and could discourage investment in some low-carbon technologies in different parts of GB.
Findings
- Without insulating mechanisms, LMP would heighten price risk (£/MWh sold) and volume risk (MWh sold) for Scottish renewable generators. Delays to transmission network build would exacerbate this. Elevated risk could increase the cost of capital for new developments, potentially negating the modelled system benefit of LMP. Renewables support mechanisms could help mitigate disruption to Scotland’s renewables pipeline, reducing UK decarbonisation risks. Wider benefits of the green economy in Scotland are closely tied to the continued buildout of renewables.
- Studies suggest that, due to the significant existing capacity of renewables, Scottish consumers could benefit from some of the lowest wholesale power prices in Europe under LMP. Conversely, as LMP creates regional differences in price, some GB regions would see increases in prices. The extent to which this materialises depends on policy design and the pace at which LMP is implemented. The impact of LMP is reduced the later it is implemented as the network is reinforced to 2035, reducing transmission constraints.
- LMP is unlikely to accelerate the decarbonisation of the power sector. LMP could even slow decarbonisation down by causing a hiatus in investment if implemented without sufficient mitigations demonstrating that renewable support can be maintained. However, the potential to improve system efficiency could decrease the cost of the UK power system between £0.2bn-1.6bn annually. In Scotland, lower wholesale prices could reduce the cost of electrification of sectors such as transport, heat and industry, and could play a part in attracting new industries and green hydrogen production.
- LMP has the potential to encourage the efficient location and operation of assets that provide flexibility to the electricity system. Due to significant capacity of renewables in Scotland, LMP could attract further investment in flexible assets. This would help to reduce network congestion in Scotland, allowing for greater penetration of renewable generation. However, strategic planning is necessary to ensure that Scotland receives the network capacity required for further development of renewables.
Further details can be found in the summary report, which provides a non-technical summary, and in the full report.
If you require the report in an alternative format such as a Word document, please contact info@climatexchange.org.uk or 0131 651 4783.
Research completed: July 2024
Non-technical summary
This is a non-technical summary to a report published separately as GB wholesale electricity market reform: impacts and opportunities for Scotland. The reader is invited to refer to the full report for detail.
Context
This study assesses the impact that the introduction of locational marginal pricing (LMP) to the Great Britain (GB) wholesale electricity market would have for Scotland, as well as the impact of potential alternatives. LMP has been proposed as a potential reform in the UK Government’s Review of Electricity Market Arrangements (REMA) consultation, which aims to reform electricity markets to enable a net zero energy system. LMP would be a significant reform and is of particular interest to Scotland, as the country is likely to be affected differently to other parts of GB.
We conducted a literature review and assessment of LMP and its alternatives between September 2023 and January 2024. It is an independent review and is not the view of the Scottish Government. This included a detailed assessment of quantitative and qualitative literature, as well as input from an expert advisory panel. The panel was invited to attend two 2-hour discussions, commented on, and reviewed interim findings. It consisted of stakeholders across government, energy research centres, renewables developers, flexibility providers, industry and business representatives, energy suppliers, large consumers of electricity in Scotland, a community energy group, and a consumer protection and advocacy body. Its views have been considered and included in the development of this review. This is the non-technical summary, with a detailed report published separately.
Locational marginal pricing
The wholesale electricity market is where electricity is bought and sold before it is delivered to consumers. Its main participants are electricity generators and suppliers. The current wholesale market is national and marginal. This means that electricity can be bought and sold anywhere in GB at a single national price[1], regardless of the physical constraints, or bottlenecks, on the transmission network. An example of this can be found at the B6 boundary that separates the transmission network between Scotland and England. Constraints arising here limit power flow (typically southward). Generators and consumers are not directly incentivised by the wholesale market to place and operate physical assets that generate or consume electricity in a way that is efficient for their specific location on the electricity network.
Electricity is traded in advance based on a predicted amount of electricity demand. The amount of electricity generated in real-time is adjusted by the electricity system operator (National Grid ESO) to meet the actual, rather than the predicted demand. The cost incurred by National Grid ESO is then passed on to consumers through their electricity bills. When traded generation is expected to exceed the maximum power flow of the network (creating a constraint), additional trades need to be made by National Grid ESO in affected areas to change the expected operating schedules of generators or consumers. With network build not keeping up with the growth in renewables, this inefficiency is accelerating and contributing to higher electricity bills for consumers (National Grid ESO, 2022a).
LMP could help reduce this inefficiency by splitting the national market into smaller geographic areas called zones or nodes (see Figure 1). This creates smaller markets that reflect the supply and demand in an area, and the constraints of the network. Areas where the supply is higher than demand will see prices fall, and areas with higher demand will see prices rise. This could incentivise generation and demand to locate where they do not exacerbate constraints. However, it is necessary to consider the wider, non-price factors that also influence decisions by generators and consumers on where to locate. These include the availability and quality of renewable resources (e.g. wind speed or seabed space), supply chains, skills, planning and consenting.
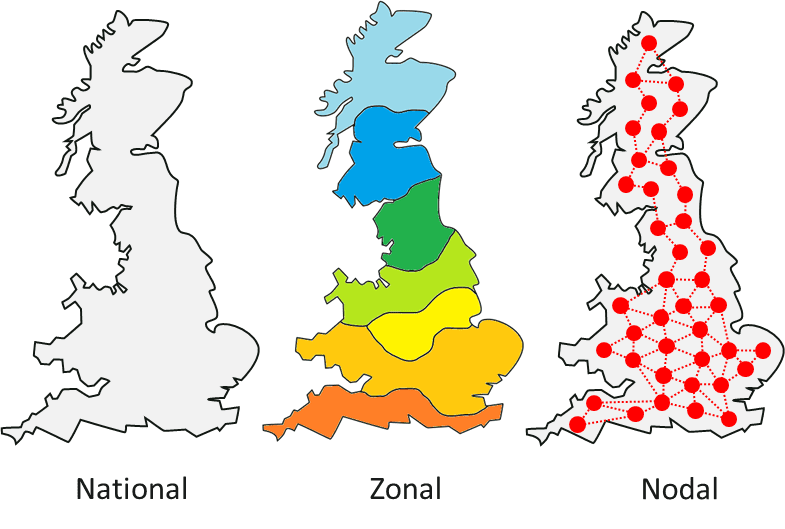
Additionally, the daily variation in price within these locational markets would reflect the instantaneous state of the local network. The result of this would be to create better signals that indicate how to operate flexible assets such as battery storage, international interconnectors, demand side response and dispatchable low-carbon generation (such as hydrogen or biomass) more efficiently. This helps to balance generation and demand and reduce constraints on the network. This further reduces operating costs for National Grid ESO, which are passed directly to consumers.
LMP could, however, make investment in renewable electricity generation less attractive in certain areas of the UK. Without appropriate investment support, it would place additional risks on market participants and create market uncertainty due to the radical nature of the reform. This could have positive impacts on investment in new sources of flexibility (such as storage), but negative impacts on renewables ambitions, particularly in Scotland. Policies could be put in place to mitigate these risks. The impact of LMP on renewable energy development in Scotland will be highly sensitive to whether such policies are implemented effectively.
Objectives of the Scottish Government
The Scottish Government outlined key ambitions in the Draft Energy Strategy and Just Transition Plan (ESJTP 2023), amongst other strategy papers. This review was completed before the publication of the final Energy Strategy and Just Transition Plan in 2024.
The review aims to discuss how LMP could impact the Scottish Government in achieving these ambitions. They have been summarised using four broad categories most relevant to wholesale market reform:
- Support ambitions to scale up low-cost renewable energy.
- 8-11GW of offshore wind by 2030 (ambitions from draft ESJTP).
- 20GW of onshore wind by 2030 (ambitions from draft ESJTP).
- Adhere to the principles of a fair and just transition.
- Deliver affordable energy that isn’t subject to global fossil fuel price volatility.
- Enable community participation.
- Incentivise wider economic benefit including jobs, skills, supply chains and investment.
- Support accelerated decarbonisation of heat, transport and industry, including through carbon capture and hydrogen.
- Decarbonise heat and transport using renewable electricity/hydrogen.
- Scale hydrogen generation and develop carbon capture in Scotland.
- Enable a secure and flexible net zero energy system, which is not dependent on fossil fuels.
- Enable energy security through the development of own resources and energy storage.
- Invest in grid infrastructure at pace to allow for a net zero transition.
Key outcomes for wholesale market reform
Wholesale market reform will have widespread impacts on Scotland’s energy strategy, as well as wider social and economic implications. By reviewing Scottish Government strategy papers and assessing where wholesale market reform has significant impact, the authors have developed key outcomes that need to be prioritised for electricity market reform to align with Scotland’s ambitions:
- Strategic coordination of renewable development and network investment is required to ensure that renewables stay in Scotland and net zero is achieved.
- Local price signals are necessary to encourage investment in and optimise the use of flexible assets, such as batteries, and enable an efficient use of renewables.
- Mechanisms that allow electricity users to benefit from low-cost renewable generation are required.
- Benefits and costs of a green transition need to be shared fairly to consumers, communities, and businesses.
Findings
In this section we present the key findings on how LMP and its alternatives could impact Scotland’s energy transition ambitions. This is split into four broad categories:
- The scale up of low-cost renewable energy.
- The fair and just transition.
- The decarbonisation of heat, transport, and industry.
- Enabling a secure and flexible net zero energy system.
Scale up of low-cost renewable energy
LMP would create regional differences in wholesale prices across GB, which depend on local levels of generation and demand. Areas such as the south of England, where demand is higher than supply, would likely see wholesale prices rise. Areas with an oversupply of renewable generation, such as Scotland, would see wholesale prices fall. The primary purpose of LMP is to create a market that is more reflective of the cost of delivering electricity to specific locations on the grid. In doing so, this encourages the placement of generation and demand where it is most suitable and cost-effective for the energy system. The wholesale price signal seen by renewables developers in Scotland could disincentivise investment, as market revenues would decline. Modelling by Aurora (2023) and FTI Consulting (2023) suggest a general southern shift in solar generation, away from Scotland. Changes in the buildout of on- and off-shore wind are more contested due other non-price factors such as the effective on-shore wind ban in England, as well as limited off-shore site availability due to leasing rounds from the Crown Estate. Certain market arrangements could be developed to help shield generators from excessively low local wholesale prices, however this would somewhat diminish the benefit of LMP.
Additionally, LMP introduces a change to the rights of access participants have to the market. Currently, electricity generators can sell electricity on the wholesale market regardless of transmission network constraints. They have firm access rights to the market. Under LMP, generators lose their firm access to the network. As a result, they can only sell their electricity within their zone/node or when it can be transmitted to consumers. This introduces a significant risk for generators in Scotland, as there are times when more electricity is produced from wind in Scotland than can be transmitted to domestic and commercial consumers within Scotland and to the rest of the UK. National Grid has proposed to significantly upgrade the network to 2035, however some excess flows from Scotland are likely to persist even after the new transmission is built.
The new risks created by LMP, combined with additional implementation uncertainty (as a result of reforming wholesale market arrangements), could lead to increases in the cost of capital. The cost of capital reflects the cost of money (e.g. interest on debt) required to finance projects. It represents the return required for an investment to be worthwhile and increases with project risk. As renewables require major upfront investment, the cost of capital has a significant impact on investment levels and the final cost of electricity for consumers. Overall, modelling completed by Aurora (2023), FTI Consulting (2023) and AFRY (2023) shows that small increases in the cost of capital caused by introducing LMP could wipe out any benefits linked to cost savings resulting from LMP.
UK decarbonisation relies on significant renewables capacity in Scotland. As such, the introduction of LMP alone would risk Scottish renewables deployment and therefore GB decarbonisation ambitions. To mitigate this, a possible solution is to reform the renewables support scheme, referred to as Contracts for Difference, to reduce risk in low carbon electricity generation development. This solution must be explored further for possible options and feasibility. Alternatively, improved Transmission Use of System Charges (TNUoS) could provide similar locational investment signals to LMP. These charges are paid by generators and suppliers to recover the cost of installing and maintaining the transmission network. However, reformed TNUoS would lack the operational incentives for flexible assets that LMP could provide.
Fair and just transition
If LMP benefits are realised, the total cost of running the electricity system should decrease moderately as a more efficient electricity system is developed. If these benefits are not offset by increases in the cost of capital for renewables, the modelled annual net economic benefit to the cost of the electricity system lies between £0.2bn-1.6bn (AFRY, 2023; Aurora, 2023).
Due to significant existing renewables capacity, LMP could see Scottish consumers benefitting from wholesale electricity prices lower than current prices as well as prices in other regions of GB. This benefit would reduce over time, though according to one study, Scottish prices would remain as some of the lowest in Europe (FTI Consulting, 2023). As transmission network is reinforced to 2035 and more electricity generation facilities are built closer to where they are needed, prices across GB will converge.
However, initially prices would rise in some areas in GB, although not as much as they would decrease in Scotland (FTI Consulting, 2023). It is possible that some consumer groups, e.g. domestic customers, would be shielded from wholesale prices through arrangements with their electricity retail companies, or UK Government policy design. Additionally, energy suppliers may not pass savings directly to customers, as their costs may rise in other regions. As wholesale electricity prices only constitute a proportion of the domestic electricity bill, with other components including network charges and green levies, the impact of LMP on overall domestic electricity bills will depend on the proportion of the bill that wholesale prices make up at any given time.
Overall, the benefits are more likely to be seen by commercial and industrial consumers in Scotland, who are less likely to be shielded from wholesale prices. The extent to which these benefits are realised depends on when LMP is implemented. The modelling shows the earlier it is implemented, the greater the benefit, as networks are reinforced and become less constrained to 2035 and beyond. However, National Grid ESO suggests LMP will take at least four to eight years for implementation (National Grid ESO, 2022a), limiting the benefits that can be attained.
The development of employment opportunities and other wider economic benefits due to accelerated renewables development is a significant benefit for Scotland. To ensure this, continued development of renewables is necessary through supporting policy. LMP also provides a significant economic opportunity through investment in new demand and industrial sectors. Lower electricity prices could attract investment in sectors such as green hydrogen, data centres or green steel – though none of the reviewed studies directly model this. The Fraser of Allander Institute study (FAI, 2023) shows that the renewable energy sector already supported more than 42,000 jobs across the Scottish economy and generated over £10.1 billion of output in 2021. With decarbonisation seeing the decline of the Scottish oil & gas industry, renewable energy and new demand sectors could provide significant employment opportunities and economic growth.
Decarbonisation of heat, transport and industry
Overall, the modelling in reports published by Aurora (2023) and FTI Consulting (2023) suggests that even if LMP is implemented successfully, it would not significantly affect the pace of decarbonisation of the electricity system. In fact, implementation of LMP without appropriate accompanying mitigations could risk UK decarbonisation efforts through a hiatus in renewable generation investment. The main benefit of LMP is that it could reduce the cost of decarbonisation, especially in Scotland, where the price of electricity could decrease the most.
The electrification of heat and transport is a significant aspect of decarbonisation. Lower wholesale costs under LMP in Scotland can contribute to heat pump and electric vehicle (EV) uptake. This is more likely for heat pumps, as electricity cost is a larger proportion of the total lifetime cost compared to EVs. Analysis by the authors indicates that a 35% reduction in wholesale cost in Scotland would reduce the total cost of ownership of an EV (in years 1-4) by 2%, and 10% for heat pumps. Both still have significant upfront costs that would need to be addressed.
LMP could make the development of green hydrogen more attractive in Scotland. Aurora’s modelling (2023) suggests hydrogen produced in Northern Scotland could have some of the lowest costs in Europe. This is because electricity is one of the main cost components of hydrogen electrolysis. This could generate a hydrogen export economy that could also benefit the decarbonisation of other industrial processes.
Carbon capture on the other hand is not likely to benefit from LMP. The implementation of carbon capture is linked to identifying industrial sites with good transport and carbon storage opportunities.
Enable a secure and flexible net zero energy system
LMP incentivises the optimal location and operation of flexible assets. Flexible assets can shift the consumption or generation of electricity in time or location. The significant capacity of renewable generation in Scotland means that prices in the wholesale market would show significant variation. This would attract investment of flexible assets in Scotland, as operators can access higher revenues. A system with a large proportion of renewable generation requires greater capacity of flexible assets. Such assets relieve network constraints and reduce the overall requirement for generation capacity and network build. Both Aurora (2023) and FTI (2023) show a significant increase in the capacity of battery storage in Scotland due to the implementation of LMP.
Under LMP, the operation of flexible assets is more efficient. A national wholesale market sends the same price signal to all flexible assets, anywhere in the country, regardless of local constraints. This would be improved under LMP, as flexible assets would respond to wholesale price variation, which would reflect local grid requirements. A particular benefit seen is the improved use of interconnectors to other countries. Overall, this enables a cheaper, more secure power system.
Local constraint markets (LCMs) could provide alternative locational signals for flexibility in this respect. LCMs are new electricity markets designed around network constraints. They provide incentives for operators to change their generation/consumption schedules, so that limits on the network are not exceeded. LCMs could, to an extent, replicate LMP market signals for flexibility. However, they would likely create additional barriers and be more complex by creating multiple markets and signals for flexibility to respond to.
Conclusions
The conclusions are based on the authors full independent assessment of the opportunities and threats that LMP and wider electricity market reform could have on the Scottish Government’s ambitions. Based on the findings of this study, the Scottish Government should support the development of a GB-wide strategic plan for renewables and network investment. The Scottish Government should fully explore the implementation of LMP with accompanying reformed support for renewable generation, specifically Contracts for Difference, to ensure continued investment in Scotland.
On the basis of this assessment, the following conclusions are presented in order of importance.
- Scotland must prioritise and coordinate a strategic plan for renewable generation and network reinforcement with the UK Government.
Without support mechanisms for renewables that shield energy generators from LMP, there would be additional risks that disincentivise renewables development in Scotland. Delays to transmission network reinforcement would exacerbate this. Long-term locational signals to strategically locate investment is essential to achieve a low-cost net zero power system. LMP, alongside support mechanisms for renewables, could provide these signals and continue to enable renewables development in Scotland. It is essential that mechanisms such as reformed Contracts for Difference are tested for feasibility before implementation. Alternatively, improved Transmission Network Use of System charges could provide the market with similar signals that indicate the best locations to invest, although this will not improve dispatch signals in the way LMP would.
- LMP would provide the clearest dispatch signal for flexibility, delivering efficient investment in and operation of flexibility.
Maximising the use of renewables can only be done with significant electricity system flexibility. LMP can provide effective investment signals for its development in Scotland and improve operational signals to optimise its use. This would reduce whole system investment requirements in generation capacity and network, reducing bills for consumers. LCMs could be an alternative in this regard, however, could also result in more complex markets and are unlikely to fully replicate the benefits created by LMP.
- The potential benefits of LMP for consumers are greater the earlier it is introduced.
LMP would create the most significant benefit for Scottish consumers before the transmission network is reinforced to 2035, and therefore, would need to be implemented quickly to maximise benefits. The extent to which this can be achieved is limited, as National Grid assumes implementation may take 4-8 years. A well-developed plan to implement LMP is required that accounts for the creation of support mechanisms which protect renewable generation, ensuring benefits are realised.
- Careful implementation of LMP is required to address regional differences in price.
Scottish consumers benefitting from lower wholesale prices would be a clear winner of LMP. However, this is not evenly spread across the rest of GB and must be considered.
Scotland has a clear opportunity to benefit from a net zero power system by making the most of low-cost renewable energy and distributing those benefits to consumers. Proposed changes to wholesale electricity markets could improve system-wide efficiency and offer cheaper electricity in Scotland. However, it could increase risk associated with investment in Scottish renewables, increasing costs. The Scottish Government needs to engage carefully with the electricity market reform process to ensure that prospective benefits are realised, and that potential disbenefits are avoided or mitigated.
© The University of Edinburgh, 2024
Prepared by Environmental Resources Management Ltd. on behalf of ClimateXChange, The University of Edinburgh. All rights reserved.
While every effort is made to ensure the information in this report is accurate, no legal responsibility is accepted for any errors, omissions or misleading statements. The views expressed represent those of the author(s), and do not necessarily represent those of the host institutions or funders.
If you require the report in an alternative format such as a Word document, please contact info@climatexchange.org.uk or 0131 651 4783.
The national price for all generators is set by the most expensive generation selling power on the wholesale market in the period (marginal). ↑
Research completed in July 2024
DOI: http://dx.doi.org/10.7488/era/4431
Executive summary
Introduction
This study assesses the likely impact of an electricity pricing model known as locational marginal pricing (LMP), as well as its potential alternatives, in the context of the Scottish Government’s Draft Energy Strategy and Just Transition Plan ambitions. LMP is a component of the UK Government’s ongoing Review of Electricity Market Arrangements (REMA) and could significantly impact Scotland’s energy landscape.
The assessment is based on a literature review and engagement with an expert advisory panel, including members from across the energy industry. The study was conducted between September 2023 and January 2024 and the assessment is based on the literature available at the time.
Under LMP, the national wholesale electricity market would be split into several smaller areas. This creates the opportunity to provide different local price signals that incentivise the optimal siting of generation, demand, and flexibility across the areas. Such incentives can improve the utilisation of renewable energy, reduce the need for network build and reduce costs. Additionally, variations in price provide flexible assets with locationally specific dispatch signals. This encourages these assets to adjust their consumption or generation to match local grid requirements, further reducing system costs. However, LMP creates significant uncertainty for market participants and could discourage investment in some low-carbon technologies in different parts of GB.
Findings
Based on the Scottish Government’s energy transition ambitions, we have categorised the impacts of LMP into the following four categories:
- The scale up of low-cost renewable energy
Without insulating mechanisms, LMP would heighten price risk (£/MWh sold) and volume risk (MWh sold) for Scottish renewable generators. Delays to transmission network build would exacerbate this. Elevated risk could increase the cost of capital for new developments, potentially negating the modelled system benefit of LMP. Renewables support mechanisms could help mitigate disruption to Scotland’s renewables pipeline, reducing UK decarbonisation risks. Wider benefits of the green economy in Scotland are closely tied to the continued buildout of renewables.
- Adhere to the principles of a fair and just transition.
Studies suggest that, due to the significant existing capacity of renewables, Scottish consumers could benefit from some of the lowest wholesale power prices in Europe under LMP. Conversely, as LMP creates regional differences in price, some GB regions would see increases in prices. The extent to which this materialises depends on policy design and the pace at which LMP is implemented. The impact of LMP is reduced the later it is implemented as the network is reinforced to 2035, reducing transmission constraints.
- Support accelerated decarbonisation.
LMP is unlikely to accelerate the decarbonisation of the power sector. LMP could even slow decarbonisation down by causing a hiatus in investment if implemented without sufficient mitigations demonstrating that renewable support can be maintained. However, the potential to improve system efficiency could decrease the cost of the UK power system between £0.2bn-1.6bn annually (AFRY 2023, Aurora 2023). In Scotland, lower wholesale prices could reduce the cost of electrification of sectors such as transport, heat and industry, and could play a part in attracting new industries and green hydrogen production.
- Enable a secure and flexible net zero energy system.
LMP has the potential to encourage the efficient location and operation of assets that provide flexibility to the electricity system. Due to significant capacity of renewables in Scotland, LMP could attract further investment in flexible assets. This would help to reduce network congestion in Scotland, allowing for greater penetration of renewable generation. However, strategic planning is necessary to ensure that Scotland receives the network capacity required for further development of renewables.
Conclusions
The authors have critiqued quantitative and qualitative studies on the possible impact of LMP, assessing the strength of assumptions used in the studies. This overview of the conclusions is based on this literature review as well as evidence gained through the expert advisory panel.
- Scotland must prioritise and coordinate a strategic plan for renewable generation and network reinforcement with the UK Government.
If LMP is to be introduced, mechanisms to support renewables need to be feasible. Long-term locational signals for strategically siting renewables are vital for achieving a low-cost net zero power system by 2035. Support mechanisms like a reformed Contracts for Difference scheme that protect against revenue and volume risk, are essential to maintaining investor confidence in Scottish renewables. Alternatively, reformed Transmission Network Use of System charges could offer locational investment signals in a national market, although they lack the same operational signals created by LMP.
- LMP would provide the clearest dispatch signal for flexibility, delivering efficient investment and operation of flexibility.
Maximising the use of renewables can only be done with significant flexibility. LMP can provide effective investment signals for the development of flexibility in Scotland. Of the options evaluated, LMP can also provide the clearest operational dispatch signals to optimise the use of flexibility. Local constraint markets are a potential alternative to LMP, although they may introduce further market complexity and are unlikely to fully replicate the effects of LMP.
- The potential benefits of LMP for consumers are greater the earlier it is introduced.
A quick implementation of LMP would create the most significant benefit for Scottish consumers. As the transmission network is upgraded to 2035, the benefits of LMP are reduced. However, LMP will likely take four to eight years to implement and must be done with care, providing support for existing and future renewable generation.
- Careful implementation of LMP is required to address regional differences in price across GB.
LMP will create regional differences in price across GB that need to be carefully considered. Scottish consumers would likely be a key winner of LMP, benefiting from lower wholesale prices. However, support for renewables needs to be secured to ensure that investment stays in Scotland, jobs are realised, and the wider benefits of net zero can be delivered. Future renewables support needs to be designed and communicated ahead of a transition to LMP.
Abbreviations table
|
CfD |
Contracts for Difference |
|
BAU |
Business-as-usual |
|
BM |
Balancing Mechanism |
|
CCUS |
Carbon capture, utilisation, and storage |
|
EAP |
Expert advisory panel |
|
EV |
Electric vehicle |
|
FES |
Future Energy Scenarios |
|
FTR |
Financial transmission right |
|
H2 |
Hydrogen |
|
HDV |
Heavy duty vehicle |
|
HND |
Holistic Network Design |
|
HP |
Heat pump |
|
LCM |
Local constraint market |
|
LCOH |
Levelised cost of hydrogen |
|
LMP |
Locational marginal pricing |
|
MO |
Market operator |
|
NGESO |
National Grid Electricity System Operator |
|
NOA |
Network Options Assessment |
|
PPA |
Power purchase agreement |
|
REMA |
Review of Electricity Market Arrangements |
|
SO |
System operator |
|
SWOT |
Strengths, weaknesses, opportunities, and threats |
|
TCO |
Total cost of ownership |
|
TNUoS |
Transmission Network Use of System |
|
WACC |
Weighted average cost of capital |
|
VAT |
Value Added Tax |
Glossary
|
Assets |
In the context of this report, assets include any source of power demand or generation on the electricity system. This includes generating assets, demand-side assets, energy storage, and interconnectors. |
|
Balancing |
The continuous adjustment of generation and consumption of electricity to maintain a stable grid. As generation and demand need to be matched in real-time, National Grid ESO performs balancing actions to do so. The primary mechanism for this is the Balancing Mechanism. |
|
Capacity |
Maximum amount of instantaneous power an asset can provide (usually measured in MW). |
|
Capacity Market |
A mechanism from the UK Government to ensure there is enough generating capacity to enable security of supply. The Capacity Market provides payments for the availability of reliable sources of power. |
|
Congestion |
When there is insufficient network capacity to transport electricity from generators to consumers. |
|
Congestion rent |
Additional revenue collected by the Market Operator under LMP markets when the network is congested. Areas with an oversupply will see generators receiving lower prices. Areas with an undersupply will see consumers paying higher prices. The difference between these is collected as congestion rent. |
|
Contracts for Difference |
The main mechanism through which renewable generation is supported in the UK. Enables stable revenues by auctioning “strike prices” for generators. When wholesale prices fall below the strike price, generators receive a top-up. When wholesale prices exceed the strike price, generators must pay back excess revenues. |
|
Curtailment |
The intentional reduction of electricity generation, primarily due to excess generation (e.g. during high wind periods), or grid constraints. |
|
Demand-side response |
Demand-side response is a form of flexibility by shifting electricity consumption according to grid requirements or market signals. This can achieve an equal but opposite effect of flexing generation. |
|
Dispatch |
The process of determining which generating units will supply electricity to meet demand at any given moment. In the UK generators “self-dispatch,” choosing when to provide electricity, while National Grid ESO can then proceed to redispatch electricity according to real-time balancing requirements. |
|
Dispatchable generation |
Generating assets that can be controlled and scheduled, such as gas power plants or hydro-electric plants. |
|
Distribution network |
The network that transports electricity from the transmission network to consumers. Some new intermittent renewable energy sources are also directly connected to the distribution network. |
|
Electrolyser |
A device that uses electricity to split water into its constituent parts: hydrogen and oxygen. |
|
Embedded generation or storage |
Any assets that can deliver power and are connected to the distribution, rather than transmission system. In the UK, most solar generation is connected to the distribution system. |
|
Firm access rights |
The guaranteed access to the network for certain types of assets. In the GB national wholesale market, this means generators can sell electricity without considering the impact on network constraints. |
|
Flexibility |
The ability to adjust the generation/consumption of electricity to meet grid requirements. This is essential to provide a reliable and stable grid in an electricity system with growing intermittent renewable generation. Includes dispatchable generation, energy storage, interconnectors, and demand-side response. |
|
Flexibility market |
Markets operated by NGESO or distribution network operators that procure flexibility to ensure the needs of the grid are met. Flexibility providers are typically paid on either an availability (£/MW/h) and/or utilisation (£/MWh) basis. |
|
Interconnector |
High-voltage power cables that connect the grid in GB with other countries e.g. France and the Netherlands, allowing for power trading across markets. |
|
Liquidity / illiquidity |
The degree to which electricity can be bought and sold easily, quickly, and with minimal impact on prices. |
|
Locational element / signal |
Incentives to invest and/or operate assets in ways that reflect local grid requirements i.e. generation, demand, network constraints. |
|
Locational marginal pricing |
A wholesale electricity market reform that divides a single national market into smaller markets. |
|
Market Operator |
In an LMP market, the Market Operator is responsible for the operation of the wholesale market and administering the pricing mechanism of the market. If introduced in the UK, this task would likely fall to National Grid ESO. |
|
Network constraints |
Physical bottlenecks on the electricity network that occur when the amount of electricity that needs to be transmitted from generating assets to demand exceeds the maximum possible flows of the network. In this study, network constraints generally refer to constraints on the transmission network. |
|
Operational efficiency |
In the context of wholesale markets, the ability for assets to appropriately schedule generation or consumption to best match grid requirements, enabling a cost-effective system. |
|
Peaker plant |
A type of generating plant that is designed to operate intermittently during periods of high electricity demand (peak demand). |
|
Power purchase agreement |
Bilateral agreements between generators and suppliers or consumers that allow generators to reduce wholesale market price risk by selling electricity at a pre-agreed price. |
|
Redispatch |
A change in the operating schedule of a generating asset to balance supply and demand or resolve network constraints. National Grid ESO may pay generators to redispatch. |
|
Settlement period |
Half-hourly period in which electricity is traded in UK markets. |
|
Transmission losses |
The electricity dissipated as heat when transmitted across the network. |
|
Transmission network |
High-voltage network that transports bulk electricity from large generating assets to distribution networks. Most large-scale generation is connected to the transmission network. |
|
Variable renewable energy / generation |
Renewable energy sources that generate intermittently based on variable resources like wind or solar, as opposed to dispatchable generation that can be actively adjusted. |
|
Wholesale electricity market |
The main market for electricity to be sold between generators and suppliers on day-ahead or intra-day time scales. Electricity not sold in bilateral trades will be sold in the wholesale market. |
Introduction
In this section we will introduce the context of this literature review and the concept of locational marginal pricing (LMP). This is followed by a brief introduction on the ambitions of the Scottish Government regarding the climate transition, how this relates to electricity market reform, and what the key limitations of this review are.
Context
This study has been commissioned by ClimateXChange, acting on behalf of the Scottish Government, to explore the likely impact that LMP, as an approach to wholesale electricity market reform, could have in Scotland. LMP is currently being explored as part of the Review of Electricity Market Arrangements (REMA), the UK Government’s consultation on the reforms required to make electricity markets fit for a net zero energy system. REMA’s scope of potential reform is very wide, looking at almost all aspects of electricity markets. As LMP has the potential to significantly impact Scotland’s energy landscape, it is of particular interest.
This is an independent review of LMP and its alternatives and does not represent the view of the Scottish Government. The authors have critiqued quantitative and qualitative studies on the possible impact of LMP, assessing the strength of assumptions used in the studies. The study was conducted between September 2023 and January 2024 and the assessment is based on the literature available at the time. The conclusions are based on this evidence as well as evidence gained through an expert advisory panel (EAP). The EAP was invited to contribute and comment on the interim findings of the study. Members of this panel include various stakeholders across government, energy research centres, renewables developers, flexibility aggregators, industry, community, consumer and business representatives, energy suppliers, and large consumers of electricity in Scotland. This panel was invited to two 2-hour presentations and roundtable discussions. The panel’s views have been considered in our analysis, and certain commentary has been highlighted in this report. In addition, the study team responded to additional engagement requests for bilateral discussions with members of the panel representing industry and energy system representatives. One of these was followed by detailed letters setting out the members’ views on the interim findings.
The review has been structured into three sections. Firstly, a literature review of LMP and its alternatives, including an assessment of recently published cost-benefit assessments. Secondly, an analysis of how LMP may impact – positively and negatively – the Scottish Government’s key ambitions outlined in the Energy Strategy and Just Transition Plan, amongst others. Thirdly, the study presents a set of conclusions and suggested next steps.
Locational marginal pricing
Electricity that is not traded under bilateral agreements between generators and suppliers/consumers is sold in the wholesale market. The current GB electricity wholesale market is a national market with marginal pricing[1]. This means that across the market, electricity can be bought or sold regardless of the location of the consumer or generator and the resulting grid conditions this creates. As the price is set by the cost of the marginal generator, the revenue or cost seen by all generators or consumers is the same price across GB for each settlement period. A settlement period is the 30-minute period in which volumes of electricity are traded.
Under LMP, the wholesale market would be split up into several zones (zonal pricing), or many (multiples of) nodes (nodal pricing), see Figure 1. With zonal pricing, the boundaries between zones reflect network constraints (bottlenecks) on the transmission network. These network constraints occur when power flow is limited by the capacity of the physical network. With nodal pricing, each location where demand or generation is connected to the transmission network is known as a node. For each settlement period, consumers and generators in different zones/nodes can experience different wholesale prices, depending on the local level of generation, demand, and network constraint.

LMP is being proposed in REMA as a potential mechanism to tackle the drawbacks of a national market in a net zero power system. A key drawback of a national wholesale market is that transmission losses and network constraints are not considered in the wholesale price of electricity. Therefore, national pricing does not incentivise efficient investment decisions for generation, demand and flexibility to locate where it is most helpful for the system. On a constrained network with a national market, generation often needs to be re-dispatched to resolve constraints, creating additional costs. The annual cost of this transmission constraints has been growing in recent years (£170m in 2010, £1.3bn in 2022), and will likely increase with a higher proportion of renewable generation outpacing transmission capacity (National Grid ESO, 2022a).
The main theoretical benefits of LMP are improved locational signals for investment, as well as improved operational efficiency. This improves whole system efficiency, thus reducing cost. Different prices across zones or nodes set by local generation, demand, and network constraint, create new investment incentives for assets and consumers to locate where it is most economical. In the long-term this should create a more efficient system, reducing the need for network reinforcement. Additionally, as locational pricing reflects the current level of demand and supply in the region, price signals incentivise optimal dispatch of generation, demand and flexibility, improving operational efficiency. However, operationally, there are also non-price factors which influence investment decisions – including Government policy, planning, natural resources, access to skills, supply chains and connectivity.
Objectives of the Scottish Government
The Scottish Government has outlined its ambitions relating to the energy transition in its Draft Energy Strategy and Just Transition Plan (ESJTP) (2023). The ambitions of the Scottish Government have been further detailed in the Heat in Buildings Strategy (2021), the Hydrogen Action Plan (2022), and the National Transport Strategy 2 (2020). This study aims to discuss how LMP will impact the Scottish Government in achieving these ambitions. The ambitions can be summarised into the following four broad categories:
- Support ambitions to scale up low-cost renewable energy.
- Adhere to the principles of a fair and just transition.
- Support accelerated decarbonisation of heat, transport, and industry, including through CCUS and hydrogen.
- Enable a secure and flexible net zero energy system which is not dependent on fossil fuels.
In Section 4 of this report, we detail which ambitions are sensitive to the impact of LMP and summarise the key strengths, weaknesses, opportunities, and threats (SWOT) of LMP relating to Scotland’s ambitions.
Key outcomes for wholesale market reform
Wholesale market reform will have widespread impacts on Scotland’s ESJTP, as well as wider economic implications. By reviewing Sottish Government strategy papers and assessing where wholesale market reform has significant impact, we have developed key outcomes that need to be prioritised for electricity market reform to align with Scotland’s ambitions:
- Strategic coordination of renewable development and network investment is required to ensure that renewables continue to be deployed in Scotland and net zero is achieved.
- UK decarbonisation relies on significant capacity of renewables being built in Scotland.
- Strategic planning of renewable development is required to place generation where it is most suitable, whilst considering existing and future network capacity and the pace required for decarbonisation.
- More efficient locational dispatch signals are necessary to encourage flexibility and enable greater renewable penetration.
- Granular locational dispatch signals that provide the right signals for flexibility, in the right places, are essential for a power system with a high penetration of renewables and significant network constraints.
- Mechanisms that allow demand, including industry, businesses, and domestic consumers to benefit from the lower cost of renewable generation are required.
- GB already generates significant electricity from renewable sources, yet consumers still pay prices largely defined by national gas generation.
- Benefits and costs of a green transition need to be shared fairly.
- Changes in market arrangements need to consider the winners and losers of reform, as well as the status quo, to ensure that costs and benefits are distributed fairly.
- Market arrangements need to ensure that investment is incentivised at pace yet is also cost efficient, minimising energy bills for consumers.
- Wider economic benefits, skills, fair work, and quality jobs need to be maintained and created for local communities.
Key limitations in the quantitative modelling of LMP
This review is based on a qualitative assessment of existing published literature. As such, it does not include any further detailed modelling. The main limitation of the assessment of LMP in the Scottish and GB context is the uncertainty of quantitative outcomes published in reports by Aurora (2023), FTI (2023), and AFRY (2023). These constituted the main published economic cost-benefit analysis of LMP in GB at the time of writing, between October 2023 and February 2024.
It needs to be noted that significant assumptions are made within the existing modelling that can materially impact any outcomes. Firstly, the benefits of the studies are compared to a counterfactual of the existing national market arrangements. Regardless of whether LMP is implemented, the market will likely see significant reform. As alternative reform is not predictable, comparing LMP to the existing market arrangements provides a baseline to assess wider reforms and alternative measures against in future studies. We acknowledge the limitations with this approach; however, this reflects the nature of existing studies and literature. This will likely lead to an overestimation of the benefits of LMP compared to a future reformed national market. On the contrary, some negative impacts may be overstated due to the mitigations that wider reforms – particularly to investment policy – could deliver.
Indeed, additional reforms introduced alongside LMP are equally uncertain. The design of investment policy (e.g. the reform of Contracts for Difference, CfD) will have a significant impact on scale of the benefits of LMP. The modelled benefits of LMP are also significantly impacted by the level of transmission network buildout. National Grid ESO are proposing substantial levels of network build. Each study includes various scenarios which make assumptions about the level of network buildout expected over the modelled period. Finally, the timing of when LMP is introduced will have a significant impact on the potential scale of benefits. The benefits will likely reduce the later LMP is introduced, as network build progresses and alleviates constraints costs. However, the rate of required buildout is unprecedented[2] (National Grid, 2023) and may see delays.
Due to these limitations, the absolute values of the outcomes in these studies will have significant levels of uncertainty. Therefore, while we have used absolute values for subsequent analysis, in general, we have conveyed the general trends of the outcomes of the studies.
A literature review of the impacts of LMP and alternatives
This section comprises of a literature review of the impacts of LMP and its alternatives. We have included both quantitative and qualitative studies in the GB context, with some additional insight from international markets. This section has been split into the following themes to guide the review:
- Consumers and end users
- Investment and decarbonisation
- Market arrangements
Furthermore, this section provides a critique of the modelling assumptions taken in the literature and a high-level review of the alternative reforms to LMP explored in the literature.
Consumers and end users
System cost/net economic benefit
The net economic benefit of introducing LMP, both zonal and nodal pricing, has been most extensively modelled by Aurora (2023), FTI Consulting (2023), and AFRY (2023) in recent studies. These assess the impact that LMP will have on the whole system cost of the power system. Whole system cost includes wholesale cost, balancing costs, CfD cost, and congestion rent. Overall, these cost benefit analyses suggest that, in the broad terms, LMP would improve market efficiency and reduce net costs to the consumer (Table 1), i.e. reduce whole system cost. However, the total reduction in whole system cost remains relatively small (% change in whole system cost, Table 1). The modelled periods in these studies are not all the same, making direct comparison of total net savings difficult.
Table 1: Modelled net economic benefit of LMP in GB. Whole system cost and net benefits for AFRY and Aurora are presented in 2021 base year. FTI values are converted from 2024 to 2021 using CPI inflation and 2.2% assumption for 2024[3].
|
AFRY (2023) |
FTI (2023) |
Aurora (2023) | ||
|
Period |
2028-2050 |
2025-2040 |
2025-2060 | |
|
Scenario |
Consumer Transformation |
System Transformation – Leading the Way NOA7 |
Net zero 2035 | |
|
Base case whole system cost |
£466bn |
N/A |
£1310bn | |
|
Zonal |
Net benefit |
4.2bn |
5.2 – 12.8bn |
23bn |
|
% change in whole system cost |
-0.9% |
N/A[4] |
-1.8% | |
|
Nodal |
Net benefit |
4.5bn |
11.0 – 20.5bn |
35bn |
|
% change in whole system cost |
-1.0% |
N/A |
-2.7% | |

On an annual basis, the modelled benefit on the overall cost of the system varies greatly, ranging from £0.2bn to £1.3bn for a nodal arrangement (see Figure 2). These differences show the significant impact that different inputs and scenarios can have on the modelling outcome and indicate uncertainty in the modelling.
The components of where these benefits come from broadly align in the studies. In both Aurora and FTI modelling, average wholesale prices increase for consumers across GB, however this is balanced out by reduced balancing costs and congestion rent revenues. Modelled CfD costs are expected to increase. However, these will largely depend on the assumptions made as to how CfDs will be reformed alongside the wholesale market.
Congestion rent is a new source of income for the Market Operator (MO) that is created under LMP. The role of the MO is to optimise dispatch and calculate prices under LMP markets. The System Operator (National Grid ESO in the UK) could take this role. Congestion rent is the revenue gained by the MO by moving electricity between zones/nodes with different prices and is generally assumed to be passed to the consumer.
A concern highlighted by one member of the EAP is that without understanding the full package of market reform that will be undertaken, it is difficult to model the impact that LMP will have as a standalone change. Additionally, there has been concern that radical market reform would create increases in the cost of capital or an investment hiatus, which could reduce or eliminate any benefits seen. This will be discussed later.
Wholesale power prices
LMP would introduce regional wholesale electricity markets, leading to regional differences in prices. These differences are created when network constraints between two different zones or nodes limit the amount of power that can be transferred at a given moment. Across the UK, consumers in areas with an oversupply of renewable generation, such as Scotland, stand to benefit the most from reduced wholesale prices due to LMP. Areas such as the south of England, which have high demand, are expected to see wholesale prices increase when compared to a national wholesale market.
Across the three reviewed studies, the most detailed analysis on prices is in the FTI report. AFRY modelling is generally at the national level, while Aurora reporting focuses on whole system costs and spreads of capacity and generation.
In FTI’s modelling, price projections in oversupplied areas such as Scotland decrease more compared to the national wholesale price, than price increases in undersupplied areas (see Figure 3). The north of Scotland could even benefit from the lowest prices in all of GB.


The extent to which differences in wholesale prices between different regions are maintained will depend on the location and scale of future demand and generation, as well as network build. These differences will diminish over time as generation is built closer to demand, new demand re-sites to where prices are lowest (to an extent), and importantly new network build reduces constraint.
Electricity bills for residential consumers and shielding of demand
Currently, the average domestic electricity bill in Scotland is one of the highest in the UK (DESNZ, 2023c). A significant factor that causes regional differences in bills are unevenly distributed network charges, which make up approximately 23% of the average electricity bill (Ofgem, 2024). Network charges include distribution, transmission, and balancing components. The other main components of a domestic electricity bill in the UK are wholesale costs (29%), supplier operating costs (16%), environmental/social obligation costs (25%), and VAT (5%). In Scotland, transmission network charges are generally lower, as demand is located closer to generation. Distribution network charges make up the greatest difference between regions and are particularly high in Northern Scotland. Overall, this means that the average domestic direct debit bill in Scotland is £1,282, compared to £1,252 in England and Wales, and £1,152 in Northern Ireland, based on fixed consumption levels (DESNZ, 2023c). The introduction of LMP could reduce the wholesale cost contribution to Scottish electricity bills.
LMP would likely create different regional inequalities in the cost of electricity across GB. Particularly in a nodal arrangement, some regions could see significant changes due to significant oversupply or undersupply of generation in the area. This can be mitigated by shielding demand from wholesale market price exposure (see Table 2) and could be done to protect consumers at risk of fuel poverty. Shielding would reduce the benefit Scottish consumers would see from lower wholesale prices. The greater the extent that demand is shielded from differences in wholesale price, the less effective LMP would be in providing a locational signal to improve market efficiency on the demand side. FTI consulting has completed a demand shielding sensitivity, showing net economic benefits of LMP reduce (FTI Consulting, 2023). This reduces the net benefit from £13.1bn to £11.4bn (Nodal, System Transformation NOA7 Scenario). The reporting does not show the regional impact of demand shielding, however, does indicate that average wholesale prices for GB would be higher than without load shielding.
Table 2: Citizen’s Advice (2023) has summarised different options for shielding demand from price exposure under LMP.
|
Type |
Description |
Effect |
Example |
|---|---|---|---|
|
National average |
Consumers pay a weighted average national price. |
Eliminates all price differences and reduces price volatility. |
Italy |
|
Adjust for regional variations |
Consumers pay national average wholesale price, but regions preserve different time of use profiles. |
Socialises differences in average cost between regions, but still sends local dispatch signals. |
None – hypothetical scenario |
|
Zonal average |
Consumers pay a regional (zonal) average price in a nodal market. |
Reduces, but does not eliminate regional differences in price. Reduces price volatility. |
California, New York |
|
Minimal intervention |
Up to suppliers to offer range of tariffs, with varying exposure, for consumers to choose from. |
Variable. Will likely send strongest price signal through to consumers. |
Denmark, New Zealand |
|
Opt-in |
Choice between exposure to locational price, or national/regional price. |
Provides consumers the choice to be exposed to a potentially more volatile price. |
Ontario, PJM (USA) |
|
Shield by type of user |
Expose some users (e.g. commercial and industrial) but shield other consumers (e.g. residential). |
Considers the ability of different types of users to respond to locational prices. Still exposes large consumers to price signals. |
Most jurisdictions (e.g. Ontario) |
|
Phased exposure |
Expose some types of large and flexible demand first, before expanding to other types. |
Incentivise uptake of technologies to improve grid flexibility, before domestic consumers are exposed. |
New York |
Investment & decarbonisation
Changes in location of renewable development
One intended outcome of LMP is that locational wholesale prices provide incentives for generation and demand to be built where it is most efficient. In theory, where there is oversupply, prices fall and there is an incentive for demand to co-locate. High demand leads to higher prices, incentivising new generation capacity to co-locate. This should incentivise a more efficient system in which generation is located closer to demand, reducing the need for network build, as well as reduced re-dispatch.
The modelling of capacity siting decisions in Aurora and FTI Consulting generally allows new capacity to re-site within certain limitations. The limitations and assumptions made significantly affect the outcome, e.g. FTI assumes no new onshore wind in England, with offshore wind re-siting being limited by seabed leasing. Aurora assumes that most capacity in their net zero scenario requires some form of subsidy support, thus will have limited ability to respond to locational signals. AFRY suggests that the sharpness of the locational signal under LMP is stronger before 2030, but then becomes weaker than the national base case after 2035. As current locational network charges will be largely integrated into the wholesale market under LMP, once transmission constraint is relieved in the medium-term, after 2035, the overall locational investment signal will be reduced. This analysis is aligned with the trend of wholesale prices across GB converging over time under LMP and reflects a system with less constraint.
In Aurora and FTI modelling, the overall patterns seen for capacity siting in Scotland are a general increase in battery storage capacity[5], as well as a reduction in solar generation capacity[6], as compared to the national base case (see Table 3). Changes in wind capacity are contested. FTI assumes that offshore wind will generally re-site away from Scotland[7], Northwest England and Northern Wales to the Humber and East Anglia. Onshore wind is limited by not being able to re-site in England, showing increased capacity in the Northern Scotland[8]. FTI also assumes there is no change in locations of pumped hydro for any scenario. Aurora shows limited changes in wind capacity locations.
A significant limitation of the modelling is that it assumes capacity buildout will continue at the same rates, simply responding to locational signals. Several members of the EAP relay the concern that the impact of unmitigated LMP on general investment levels in renewable energy could be severe. As renewable energy is very capital intensive, changes in the risk profile, and thus the cost of capital can have significant negative consequences.
Table 3: Changes in generation and storage capacities under LMP, as compared to the national base case.
|
Area |
Aurora Zonal |
FTI Zonal |
FTI Nodal |
|
Northern Scotland (above B4 boundary[9]) |
|
| |
|
Southern Scotland (between B4 and B6 boundary) |
|
|
|
|
England & Wales |
|
|
|
The table above shows general trends in the re-siting of generation caused by LMP. These general trends are read from charts in the studies. Detailed data on exact capacity changes in specific regions is generally not reported. Large uncertainties in absolute modelling outputs mean general trends are more useful to assess.
Impact on renewable development
A significant change that would be introduced under LMP, particularly affecting generators, is the loss of firm access rights. Under a national market, generators have “firm access” to the grid. This means generators can sell electricity on the wholesale market without consideration of network constraints. Therefore, generation can act independently of network buildout, and future scenarios for generation inform network build out plans.
In an LMP market, generators lose firm access to the market outside of their respective zone. This means generators lose the right for compensation when the lack of network capacity means they cannot export onto the network, requiring a change to business models and investment approaches.
Scotland is currently in an oversupplied region behind an export constraint, meaning more electricity is generated than consumed locally (National Grid ESO, 2022b). The B6 boundary between Scotland and England limits the power that can be exported such that generators in Scotland are often curtailed off. There is currently significant network buildout planning to increase the capacity across the B6 boundary, which would reduce this risk for Scottish generators. However, excess flows across the B6 boundary are still maintained, even with these upgrades (National Grid ESO, 2023b). The loss of firm access under LMP is a significant new risk for generators in Scotland, as they will lose volume certainty when the network is constrained.
Existing generators could lose out on revenue from markets or CfD payments as they lose firm access rights to sell electricity to wholesale market. This would make many projects (especially in Scotland) unviable. Projects that are in development face similar risks. Should no new CfD scheme be implemented, new renewable development in areas behind constraints with high existing renewables (like Scotland), will have to compete for already very low wholesale prices during times of wind output, likely making projects unviable. For planned projects, lack of revenue certainty would either drive up the cost of capital (due to sizeable increase in risk) or lead to an investment exodus to markets in other parts of GB/Europe with more certain/lucrative revenue streams.
However, overall renewable curtailment across GB is projected to decrease under LMP, though this may not be the same in oversupplied Scotland. FTI’s modelling shows less renewable curtailment in both zonal (510-636 TWh between 2025-2040) and nodal markets (426-502 TWh), with the difference to the national base case (591-812 TWh) increasing to 2040 (National Grid, 2022b). This is due to improved dispatch, interconnector use, flexible demand, and the re-location of generation closer to demand. Aurora’s modelling suggests Scottish wind generation will face slightly higher curtailment in a zonal market, 3% more than in the national base case in 2035.
The risks to generators are further increased because under LMP, particularly in a nodal market, wholesale electricity markets are split into small areas. Aurora suggests that, particularly in smaller, more illiquid zones or in a nodal system, revenues can become less predictable for generators as price volatility increases. This is because local demand and supply become harder to predict. This could increase the cost of capital and reduce investment. FTI suggests that liquidity problems that may arise from smaller markets in a nodal system could be solved using trading hubs (as in USA), reducing liquidity problems.
Pace of power market decarbonisation
As electrification of transport, heat, and industry are key components of decarbonisation, a decarbonised power sector is a key step towards net zero. Under LMP, the modelled pace of GB power sector decarbonisation does not show a significant change. In a scenario where a net zero power sector is achieved by 2035, Aurora modelling shows emissions tracking the national base case closely. FTI modelling show an emissions reduction of 25-100MtCO2 between 2025-2040. This equates to 2-7 MtCO2 per year, or 2-7% of 2022 power sector emissions. This reduction is due to modelled improvements in dispatch, siting efficiency, and interconnector use, reducing the requirement for fossil fuel peakers. Overall, there is little difference in power sector decarbonisation as FTI and Aurora generally model continued buildout of generation at a similar pace.
A major limitation of LMP is the significant time it will take to implement. AFRY argue that the earliest implementation date would be 2028, meaning the window for investment decisions to impact emissions by 2035 (UK Government ambition for power sector decarbonisation) is limited. Additionally, the detrimental risk of causing an investment hiatus could threaten power sector decarbonisation in GB. This has not been properly captured in the modelling.
Scotland’s decarbonisation efforts will require an increased focus on flexibility alongside continued deployment of renewables. Scotland already has significant renewable generation, and thus a significantly decarbonised power sector. Under a constrained network with significant variable renewable generation, greater volatility in local wholesale prices can attract the deployment of flexibility (i.e. storage and demand side response), which enables a more efficient use of said generation.
Interconnector use
A significant potential benefit of LMP is the improved use of interconnectors. Interconnector flows are largely determined by price differentials between markets (Ofgem, 2014). This means that interconnectors can exacerbate network constraints under current market conditions.
The example in Figure 4 shows how a national market allows for import from Norway to Scotland and export from England to France, exacerbating the constraint between England and Scotland. This is a hypothetical example developed by National Grid ESO, as no interconnector between Norway and Scotland currently exists. When there is high wind in Scotland in an LMP market, Scottish prices would be lower than in the south, due to the oversupply of renewable generation. Interconnector flows would reflect price differentials between markets, allowing electricity generated in Scotland to be exported through the hypothetical GB interconnector to Norway, alleviating the constraint to England. Overall, this would enable greater export of Scottish renewable generation.


There has been overwhelming agreement of this benefit of LMP in the EAP sessions. Some members suggest that LMP is the best way to enable improved interconnector use, stating there has been a significant lack of alternative options tabled by industry that could solve this issue.
Energy storage and demand response
LMP markets would create locationally granular dispatch signals that enable the efficient use of flexibility. Price differentials in the wholesale market create an opportunity for assets that can be used flexibly to generate value, including BESS (battery energy storage system), pumped hydro, long duration energy storage, and demand response. Under a national market, wholesale price signals do not consider local constraints, so there is no incentive to place flexible assets in particular locations (National Grid ESO, 2022a). This means that flexible assets, placed in the wrong location, do not necessarily contribute to alleviating constraints.
In an LMP market, prices reflect local constraints on the network. As such, the dispatch signal created by the wholesale market will more accurately reflect the current needs of the network. For example, local oversupply is reflected in the wholesale market and incentivises charging of local storage assets, reducing export constraint. In a national market, the price signal will not only be weaker, but also not send specific signals to assets that are ideally located.
Increased price volatility increases revenues for battery and other energy storage projects, incentivising investment. Scottish price volatility is expected to be higher due to the significant capacity of variable renewable generation. Aurora and FTI modelling suggest Scotland will therefore likely see increased buildout of battery storage, making use of more volatile local nodal and zonal prices. Pumped hydro is likely to also benefit from this, however reporting on this technology is limited in the literature. According to Aurora modelling, overall GB market volatility is expected to decrease over time, but will persist in Scotland.
For this reason, improved locational dispatch signals provided by the wholesale market under LMP could help reduce congestion in Scotland and reduce curtailment by incentivising storage assets and demand response to respond in an efficient way.
Stakeholders in the Expert Advisory Panel agree that improved flexibility is a significant benefit of LMP for GB and Scotland. Improved flexibility allows for the more efficient use of renewable generation, and LMP provides the locationally granular price signal that otherwise needs to be created in separate flexibility markets.
Market arrangements
Additional market complexity under nodal arrangement
The introduction of LMP necessitates a decision between adopting a nodal or zonal market arrangement. FTI and Aurora modelling show that nodal markets can achieve greater power system cost benefit than zonal markets, however, increase complexity significantly.
Nodal markets would require radical change that increase the barriers to entry in the electricity market. International nodal markets have generally required central dispatch, forcing generators to participate in wholesale markets, and therefore require generators to develop new mechanisms to hedge against price risk. This is to enable the MO to run a clearing algorithm that allows for the most optimal cost-efficient dispatch at hundreds of nodes. Zonal markets exist with both centralised dispatch, and self-dispatch internationally.
For Scotland and GB, the benefits of an LMP market could be enabled in a zonal market, reducing the risk of increased complexity and radical reform required in a nodal market. With increased market complexity and associated uncertainty in a nodal market, there is heightened risk for investors.
Market arrangements to allow for bilateral trading
Generators in LMP markets can only directly access their specific nodal/zonal price. This increases risk as any local changes in network build, demand, and generation can have a significant impact on the price. To reduce such risk some international nodal markets have introduced Financial Transmission Rights (FTR) to allow for price risk hedging.

An FTR gives the holder the right to cash flows relative to the difference in price across nodes, thus allowing generators in oversupplied areas to potentially access higher prices (see Figure 5). They are funded by congestion rent, accrued by the MO. The MO may assign FTRs to electricity suppliers, with the intention that congestion rent is passed as a saving to consumers.
As all market actors need to participate in the wholesale market in a nodal system (as they are centrally dispatched), FTRs are also necessary to enable Power Purchase Agreements, (PPA). PPAs are a mechanism that allow generators to reduce price risk of the wholesale market by directly selling electricity to an electricity supplier or consumer at an agreed price. In a nodal market, the consumer and generator within a PPA still need to buy and sell electricity on the wholesale market. The prices bought and sold at will not necessarily be the same when they are not on the same node. An FTR between the nodes allows for some of the price difference to be compensated, though additional cashflow may be required if the value of the FTR is not equal to the agreed upon PPA price (Gill et. al, 2023).
As greater volumes of FTRs are created by the MO, the impact of nodal pricing on generators will be reduced, as fewer are exposed to local prices. It is therefore unlikely that enough FTRs are created that all generation can be hedged.
Implementation of a CfD scheme
Creating a CfD scheme under a locational market would be a novel development, with associated risks in implementation. Designing a CfD scheme under LMP faces significant new complexities, however, would be important to support the mass buildout of renewable generation in Scotland. Currently, CfDs provide generators top-up revenue calculated by the difference between their reference price (wholesale market price), and the auctioned strike price (price to which uplift is calculated, ensuring revenue certainty). When wholesale prices are higher than their strike price, generators also need to pay back excess revenues. A key decision for a CfD scheme under LMP is the extent to which generators will be shielded from local prices. A CfD scheme that completely protects generators from locational signals could be seen as counterproductive, as it would reduce the benefit of signalling where generation should be built.
Choosing a strike price, to which uplift is calculated, can be done either nationally or at the zone/node. Auctioning strike prices nationally, would provide similar support to all generators, and auctions would tend to minimise cost. Alternatively, a zonal/nodal strike price would support generators across regions differently, and the cost to the consumer would vary across regions. An auction that minimises CfD cost would minimise the average cost of uplift, rather than minimise the strike price, which is the current mechanism. Such an auction would require significant modelling to assess which generators will require the least uplift. In our view, regionally auctioned strike prices would favour generators located in areas with favourable conditions such as high-capacity factors and lower grid costs, yet still reduce the locational signal of the wholesale market.
The way the reference price is chosen in an LMP market impacts the strength of the locational signal and the cost of support (Figure 6). A zonal/nodal reference price completely shields the generator from the locational wholesale market. A national reference price provides equal uplift for all generators (given the strike price is the same). Generators in low price regions are still exposed to the lower wholesale price, so earn less revenues unless hedged. This allows for some exposure to locational wholesale prices.

Some members of the EAP see the continuation of a reformed CfD scheme under LMP as potentially difficult to implement. Many choices need to be made that will significantly affect the extent of the impact that LMP can have, whilst also introducing additional complexity in CfD administration, auctioning, and cost. Other EAP members have stated that to ensure continued investor confidence, existing CfD schemes will likely need to be grandfathered. This means existing CfD generator revenues are secured such that they remain unchanged, regardless of market reform.
Critique of LMP modelling assumptions
Introduction (description of modelling approaches)
The two key studies that have been used in this literature review to assess the economic and system benefit of LMP are Aurora (2023) and FTI Consulting (2023). To date, these are the only cost-benefit analyses that have published a significant level of detail, with AFRY (2023) only publishing overall results. The key modelling approaches can be seen in Table 4.
Table 4: Key configurations of Aurora and FTI Consulting’s modelling of LMP.
|
FTI Consulting |
Aurora | |
|
Zones |
7 |
7 |
|
Nodes |
850 |
Not stated |
|
Period |
2025 – 2040 |
2025 – 2060 |
|
Scenarios |
3 scenarios each with different network build assumptions, including Network Options Assessment 7 (NOA7) and Holistic Network Design (HND), as well as decarbonisation pathways Leading the Way (LtW) and System Transformation (ST). |
2 scenarios of a net zero power system by 2035 and by 2050. HND is included in network build assumptions. |
|
Sensitivities |
Dispatch only, load shielding, increased cost of capital. |
Increased cost of capital, delayed network build, dispatch only. |
Impact of network build assumptions
Network buildout has a large effect on the impacts of LMP, and how they are distributed geographically. It is therefore a core assumption that determines the benefits of LMP. In an unconstrained network, LMP will have no benefit over a national wholesale market. If the modelling underestimates the level of network build, it will overestimate the impact of LMP.
NGESO identify which parts of the network require reinforcement and assess the cost-effectiveness over other possible measures. The Network Option Assessment 7 (NOA7) sets out the requirements for new infrastructure out to 2030. However, NOA7 has been supplemented by the new Holistic Network Design (HND), which accounts for additional upgrades required to support offshore wind (National Grid ESO, 2022b).
FTI Consulting only uses NOA7 as its central network buildout scenario, with a second scenario exploring HND. However, as HND has already been approved, only the HND scenario should be considered. This reduces the FTI net benefit of LMP by 40%. Aurora accounts for HND in its net zero scenario, then models further grid reinforcement after 2035 using their own network congestion/revenue algorithm. Sensitivities of delayed network build in Aurora modelling also show that this increases whole system cost in both national and LMP markets. LMP markets, however, can partially mitigate this impact.
Wholesale price projections
Wholesale price projections in the national base case will affect the absolute magnitude of the modelled net impact of LMP. Comparing to DESNZ national wholesale price projections (DESNZ, 2023a), Figure 7 illustrates that Aurora projects higher prices than DESNZ before 2030, then lower prices afterwards. FTI projects significantly lower prices than DESNZ in the short- and long-term. Therefore, the counterfactual national wholesale cost is not consistent between the two studies, leading to different net benefit calculations. When comparing equivalent scenarios, this could partially explain the greater benefits of the Aurora modelling (£1.40Bn/a) compared to FTI (£0.77Bn/a).
When assessing the modelled wholesale prices in Scotland under LMP, both Aurora and FTI prices are similar to (in fact slightly greater than) DESNZ projections for the levelised cost of energy (LCOE) of offshore wind (DESNZ, 2023b). This provides confidence that with LMP, the wholesale prices in Scotland will be closely tied to the levelised cost of wind. As a greater proportion of electricity is supplied by unsubsidised wind in Scotland, the levelised cost of wind will to a greater extent determine wholesale prices in Scotland. The higher projections reflect that additional dispatchable generation/storage is required during periods of low wind output.

Cost of capital for renewable generation
A transition to LMP could have a significant impact on the cost of capital of generation. There is a consensus amongst the literature, as well as from modelling from AFRY, Aurora and FTI Consulting, that even small changes in the cost of capital would eliminate the net benefits of LMP.
A transition to LMP would be a radical market reform, with reduced volume and price certainty and transition uncertainty leading to a potential increase in the cost of capital. A study assessing the impact on introducing a zonal market in Australia, showed the weighted average cost of capital (WACC) increased by 15-20%, which is equivalent to 1-2pp (Rai et al., 2021). Frontier Economics (2022) suggests that price volatility in the GB market under LMP would increase the WACC of wind farms by 1.8-4pp.
AFRY, Aurora, and FTI have modelled sensitivities to estimate the impact that increases of the cost of capital can have on the modelled net benefit of LMP.
- Aurora models that a 3pp (percentage point) increase in the WACC would increase the cost to consumers by up to 5% compared to the national base case.
- FTI models that an expected 0.5pp increase in the cost of capital of renewables would reduce the net economic benefit of the base case by £7.5bn across the modelled period. Further analysis shows a 1.3-3.4pp increase would be enough to eliminate any consumer benefit in their base case.
- AFRY modelling suggests that a 0.56pp increase in the cost of capital would eliminate the net modelled benefit of LMP.
The wider literature suggests it is likely for there to be an increase in the cost of capital upon the implementation of LMP. Modelling of this scenario shows that even small increases could eliminate the net modelled benefit of LMP. The base cases presented by Aurora and FTI consulting therefore likely overestimate benefits as they do not consider this factor. The potential impact of an increased cost of capital on the level of investment, as well as the cost of electricity, is one of the major factors to consider when choosing to implement LMP.
Volatility
Average price volatility, which is a contributing factor to revenue risk and increasing the cost of capital, is unlikely to significantly increase in a locational market. Both FTI and Aurora argue there is not a significant increase in average wholesale price volatility in LMP markets over a national market. FTI does suggest that volatility will increase over time, likely due to increasing renewables, but this would also occur without LMP. However, it is worth noting that in specific nodes/zones where variable renewable generation is high, such as Scotland, volatility may significantly increase. While this provides opportunities for flexibility and energy storage, it could increase risk for generators participating directly in the wholesale market and would likely require continued/reformed CfD support to mitigate against it.
Re-siting of generation and demand
With lower wholesale prices under LMP, some re-siting of renewables away from Scotland should be expected. While Scotland has the highest load factors for both offshore and onshore wind in the UK (DESNZ, 2023d), the greater load factors may not be sufficient to offset lower wholesale prices. However, the extent to which new renewable generation will re-site away from Scotland is limited by several factors. This includes planning, sea-bed leasing, and network availability. Furthermore, short-term changes in the location of advanced development pipelines are unlikely, given the level of planning and permitting required. Development timelines for large generation projects are often very long and so the window for changes to 2035 is limited. At worst, existing pipelines could be cancelled due to lacking investor confidence, which could cause delays in overall GB investment levels as new areas need to be scoped. Consequently, a bigger impact might be expected in the siting of future generation, rather than that which is already planned.
The re-location of some renewable generation in the modelling by Aurora and FTI is a sensible assumption. However, this will be moderated by other non-price factors that could reduce the benefits modelled in the studies.
While significant existing demand is unlikely to re-site according to locational wholesale signals, new forms of demand could re-site within GB or enter the UK market to take advantage of the lower electricity prices in Scotland. Residential demand, constituting 35% of national demand (DESNZ, 2023e), is unlikely to significantly re-site, with most change in this sector likely to be seen in demand response to wholesale price profiles.
Early electrolysers are likely to be developed near centres of demand such as industrial clusters. This is the assumption in both Aurora and FTI studies. FTI allows hydrogen electrolysers to locate on any node with hydrogen gas turbines (as specified in NGESO’s Future Energy Scenarios 2021). Aurora’s main approach is to model new electrolyser locations based on existing pipelines. As electrolyser capacities increase, the siting of their new demand could be an additional benefit of LMP (McIver et al., 2023).
New sources of demand could also be an unmodelled benefit of LMP. Existing industry is less likely to shift locations in the short- and medium-term, however could benefit from lower wholesale costs to drive electrification. New sources of demand such as data centres and green steel could re-locate to Scotland to take advantage of lower electricity prices. Precedence for this is the choice of northern Sweden for the first commercial green steel plant (H2Green Steel, 2023).
Impact of timescales
The period when LMP is introduced has a significant impact on the modelled cost-benefit. The literature agrees that the earlier it is introduced, the more significant the benefits of LMP will be. The more constrained the network is, the greater the benefit that LMP can have on the system. Based on the NOA 2021/22 Refresh (National Grid ESO, 2022b), significant transmission build is planned to 2030. This will relieve the network constraints and reduce the potential benefit of implementing LMP. It will still take a significant amount of time between deciding to implement an LMP market and its delivery. REMA timelines do not allow the implementation of LMP to begin by 2025 (Ofgem, 2023), and National Grid assumes implementing a nodal market would take 4-8 years (National Grid ESO, 2022a). As such, the modelled benefit of LMP is likely overestimated by FTI and Aurora, both models start in 2025. The modelling by AFRY would still overestimate benefits, with a start year of 2028. As such, the realisation of wholesale cost benefits for Scotland are likely more limited than presented. However, any delays to grid build will improve the case for LMP, as seen in sensitivities completed by Aurora (2023). The volume of additional grid required is unprecedented and it could be likely that some is delayed.
Alternatives to LMP
There are alternative options to LMP to further locational signals in the electricity system. Some of the most prominent options, as agreed by the project steering group, will be discussed at a high level in this section.
Transmission Network Use of System reform
Locational signals already exist in the GB electricity system within Transmission Network Use of System (TNUoS) charges, which are paid by generators, embedded generators, suppliers, and directly connected transmission demand. TNUoS covers the cost of installing and maintaining the transmission network. This is passed down to consumer’s electricity bills. TNUoS reform could provide an alternative to LMP investment signals, creating an equivalent benefit to LMP by influencing investment siting. It will however be unlikely to enable benefits seen by improved dispatch under LMP. Currently, the method for calculating TNUoS limits its impact on investment decisions for generation/demand build. Energy UK (2023) have published reforms that would be required to make TNUoS reflective of a modern system to provide an alternative to LMP, summarised in Table 5.
Table 5: A summary of Energy UK (2023) requirements for TNUoS reform.
|
Reform |
Current TNUoS |
Reformed TNUoS |
|
Transparency |
Methodology for calculating TNUoS is not transparent on locational inputs. |
Transparent methodology would help investors forecast TNUoS charges. |
|
Modelling assumptions |
Assumptions underpinning TNUoS are based on an outdated fossil-based power system. |
Reformed TNUoS would reflect a decarbonised system with increasing generation and demand. |
|
Predictability |
TNUoS varies yearly, often with volatile price signals, increasing uncertainty for investors, hence the cost of new generation. |
Long-term TNUoS charges (e.g. fixed for 10 years at point of connection) have been proposed to provide certainty to investors. |
|
Locational charges |
Currently, locational signals in TNUoS are small. |
Signals would need to increase for both generation and demand to reproduce the effects of LMP. |
|
Treatment of storage |
Storage is currently treated as a “conventional carbon generator”, despite being both generation and demand. |
Storage could be given specific treatment to encourage siting areas with net supply. |
Aurora and Frontier Economics (2023) agree that a reformed TNUoS charge could create an equivalent benefit to LMP for the optimal siting of generation/demand. Aurora’s modelling shows that in some locations in Scotland, TNUoS reform would need to increase charges on some renewables to have the same impact as LMP, causing some renewables to re-site away from Scotland. However, their modelling assumes sufficient grid build to incentivise new offshore wind in northern Scotland. Across the whole of Scotland, Aurora model increasing incentives to build flexible generation and storage. As a whole, Frontier Economics argues TNUoS reform could improve investor confidence by providing long-term location signals to influence generation/demand siting. This would mean that the risk of increases in the cost of capital for renewable generation introduced by LMP could be avoided by TNUoS reform.
CfD reform
CfD reform could also provide locational signals in renewable investment. CfDs are the main mechanism through which renewable generation is supported in the UK. They enable stable revenues by auctioning “strike prices” for generators. When wholesale prices fall below the strike price, generators receive a top-up. When wholesale prices exceed the strike price, generators must pay back excess revenues.
This study has identified two main approaches to introducing a locational signal to CfDs, deemed generation (discussed by AFRY, 2023) or non-price factors (discussed by Regen, 2023a).
Table 6: Description of reformed CfD mechanisms.
|
Mechanism |
Actual generation CfD |
Deemed generation CfD |
CfD – non-price factors |
|
Source |
Current mechanism |
AFRY |
Regen |
|
Description |
Revenue top-up based on generation (MWh) based on a fixed £/MWh strike price. |
Revenue top-up based on capacity at a fixed £/kW/yr. Contracts awarded by the lowest deemed £/MWh, rather than the actual MWh produced. |
Introduce non-price factors into the auction that reflect various additional considerations of CfD, including locational and other whole systems benefits. |
|
Benefits |
Ensures best value (£/MWh generated) projects win contracts, reducing wholesale prices in national market. |
Contracts awarded based on forecasts of MWh delivered, accounting for locational factors (e.g. expected load factor and hours constrained). Guarantees revenue at point of contract award. |
Non-price factors reflect various additional considerations of CfD, e.g. location & other whole systems benefits. Recognises projects that provide wider socio-economic benefits. |
|
Limitations |
Generators still topped-up if constrained, so no consideration of network constraints. Generators do not receive revenue during periods of national curtailment. |
Does not necessarily provide best £/MWh generated for consumers. Requires CfD awarder to produce generation and constraint forecasts, increasing mechanism complexity. |
Does not necessarily provide best £/MWh generated for consumers. Increase complexity of mechanism for CfD awarder and developers to introduce/quantify additional benefits. |
Balancing Mechanism reform
The Balancing Mechanism is the main energy balancing market NGESO uses to ensure that demand and supply are matched, as well as to solve constraints on the network. A reformed BM could both influence investment siting decisions, as well as improve dispatch signals, though it is unlikely to fully replicate the benefits of LMP. Note that under a national market with a reformed BM, dispatch is still done through the wholesale market, meaning BM reform would only aim to reduce the cost of redispatch.
Investment siting decisions could be improved under a reformed BM, influenced by the potential revenue offered by the BM. However, currently this is difficult to forecast. Improvements to forecasting could include increasing the transparency of BM dispatch. Reform could go further by introducing/increasing long-term contractual agreements between NGESO and flexibility operators.
Reducing the cost of redispatch could be achieved by BM Wider Access, which will enable participation from aggregation of demand side assets and embedded generation storage. This would increase the number of assets in the BM and increase competition. Increasing the visibility and dispatch of storage assets could increase participation. National Grid is currently working to improve battery storage participation with the Open Balancing Platform, allowing bulk dispatch of batteries. Another potential reform in the BM to increase operational efficiency of the market is to enable interconnectors to participate. This could allow for the redispatch of significant interconnector capacity to resolve constraints on the network.
Local constraint markets
Local constraint markets (LCM) are newly developing flexibility markets that aim to enable wider access of assets to solve constraints on the network. These could go some way to improving locational dispatch and investment signals in a national market.
GB’s first local constraint market (LCM) came into operation in Scotland in 2023, seeking to manage the constraint between England and Scotland. Participants above the B6 export constraint in Scotland turn up demand during periods of high renewable generation. The aim is to provide a service that can solve the constraint at lower cost than the Balancing Mechanism, and simultaneously increase the number and types of assets that can participate in electricity markets by allowing households to participate.
Regen’s Insight Paper (2023b) suggests NGESO should procure flexibility in LCMs over a variety of timescales (intraday, day-ahead, and long-term) to help the optimal locational dispatch of demand in a national price market. If LCMs are guaranteed in certain locations in the long-term, Regen also comment that they could provide investment signals in areas of constraint for the development of flexibility. It is important that such markets provide constraint management at a lower cost than currently through the BM, otherwise they will increase the system cost of resolving constraints.
While LCMs are unlikely able to replicate the granular benefits of LMP, they are a useful addition to national pricing to add a locational signal, and, if the trial in Scotland is successful, could be rolled out in the intermediary period ahead of market reform. A possible downside, also raised in the EAP, is that many separate markets will need to be developed, possibly leading to increased complexity.
Assessment of the opportunities, threats, costs and benefits to the Scottish Government’s objectives
In this section we assess the impact that LMP and its alternatives could have on the objectives of the Scottish government, as outlined in the Draft Energy Strategy and Just Transition Plan amongst other strategy papers. The assessment is split into four main categories:
- The scale up of low-cost renewable energy.
- The fair and just transition.
- The decarbonisation of heat, transport, and industry.
- Enabling a secure and flexible net zero energy system.
We have proceeded to summarise the main findings in a SWOT diagram (Strengths, Weaknesses, Opportunities, Threats).
Scale up of low-cost renewable energy
The development of renewable energy will be significantly affected by any wholesale market reform. This section outlines how Scottish renewables ambitions could be affected by LMP.
Description of Scottish ambitions
Scotland has strong ambitions for the scale up of renewable energy, largely focusing on the scale up of onshore and offshore wind, but also on increasing contributions from solar, hydro, and marine energy. The Scottish Government also has an ambition for an installed capacity of 5GW of renewable and low-carbon hydrogen production by 2030, and 25GW by 2045.
Scotland’s wind capacity ambitions largely align with UK goals and NGESO Future Energy Scenarios (FES) 2023 modelling. The UK Government goal of 50GW offshore wind by 2030 is supported by significant ambitions for 20GW of offshore wind development in Scotland. To reach net zero by 2050, FES 2023 also forecasts 45% of offshore wind to be located in Scotland. In addition to offshore wind, Scotland’s ambition for onshore wind is to develop 8-11GW by 2030.
Scotland’s current wind pipeline is extensive, with 12.7GW of onshore wind projects under construction, awaiting construction, or in planning (Scot Gov, 2023a). 8.3GW of projects stand to deliver the bulk of the offshore wind ambition in Scotland. Additionally, the ScotWind and Innovation and Targeted Oil & Gas (INTOG) leasing rounds reflect very significant market ambitions for offshore wind in Scottish waters. For Scotland, and wider UK decarbonisation, it is key that these projects are not risked by market reform. Renewables development is a significant pillar in the energy strategy of Scotland and underpins other socio-economic and decarbonisation ambitions.
Impact of continued constraint and network delays on Scottish generators

A significant challenge in the development of renewables in Scotland from a power system perspective is the export constraint to England. In FY22/23, export constraints in Scotland resulted in 4.4TWh of balancing actions at a cost of £908 million to the consumer (National Grid ESO, 2023e). To address this, National Grid has proposed transmission build between Scotland and England to allow for flows of 20GW by 2030, and 30GW by 2035 (NOA 2021/22 Refresh). Even with this additional transmission build, the boundary will still likely see excess flows resulting in constraints (National Grid ESO, 2023b). Any delays in this network build would further exacerbate the constraint.
Under LMP, Scottish generators would lose firm access rights to the wholesale market. This means they would be acutely impacted by export constraints and delays to network build, which would limit the market they could sell to, generating a significant volume risk for investors. Excess renewable generation and export constraints in Scotland would drive down wholesale prices, and while this benefits consumers, it would generate further risk for renewable investors’ revenue opportunities. Continued low wholesale prices for consumers in Scotland would still rely on further development of renewables. This risk could be partially mitigated by new opportunities for renewable generators to sell electricity to new sources of demand in Scotland or to Europe, via interconnectors, taking advantage of the lower wholesale prices in Scotland. However, this would unlikely fully outweigh the current opportunity to sell to England under a national market.
Some members of the EAP highlighted that Scotland still is the best location for renewable generation in the UK with the load factors and existing pipelines and supply chains, despite the inability of some of the generation to reach demand. However, another member of the EAP suggested that planning to build more generation in Scotland, when there is not the physical grid to support it is unsustainable. Especially when accounting for a history of slow network build, with required transmission build exceeding current rates significantly. These views set out by EAP members must be assessed on the basis that decarbonisation at the lowest cost to the consumer should be prioritised, however within the timeframe to achieve a net zero power system by 2035.
Market arrangements for mass renewables in Scotland
A long-term strategic plan for renewable generation and network upgrades could be implemented in a future market design to achieve a decarbonised power system at the lowest cost to the consumer, within the timeframe set by the UK Government’s decarbonisation targets. Such a plan would need to coordinate the location of generation and network upgrades (and flexibility) to send a clear signal to investors about where generation is required to de-risk investment and ensure confidence in mass renewable buildout. The establishment of the Strategic Spatial Energy Plan (SSEP) by 2025 could provide the framework to achieve this. This will be a UK Government led strategy that outlines where, when, and what energy infrastructure needs to be built to enable a net zero system.
Under LMP, it is most efficient and profitable to place generating capacity near demand, reducing the cost of transmission. This is a short-term market signal that does not consider the future location of new generation and network build. It places all the risk on investors to forecast how local grid conditions will evolve when developing their business case. The necessity of the Scottish pipeline for broader GB decarbonisation efforts should be considered before implementing reform that could risk development, considering the limited time for action. Market arrangements are needed that ensure the development of renewables in strategic locations but protect generators.
Support mechanisms such as CfDs would provide revenue certainty whether LMP is introduced or not. However, under the current CfD mechanism, the awarding of CfD does not consider locational factors (past planning and renewable resource) and places all volume risk on consumers (there is no top-up payment if the reference price falls below £0/MWh for recent CfDs). CfD reform could encompass locational considerations when awarding contracts. Such considerations should locate low-cost renewable generation where it minimises cost for consumers, considering the constraints on the network, planned upgrades, and centres of demand. Furthermore, under LMP, CfD reform would need to consider how it could protect renewables from volume risk to improve investor confidence in renewable development in the UK. We discuss this in more detail in section 5.2. Regardless of LMP, CfD reform should consider the increasing periods of national curtailment of renewables as capacity increases and the additional volume risk for investors this will bring.
An alternative method to LMP and reformed CfDs to provide long-term investment signals for the location of renewables is a reform to TNUoS charges. Depending on the timeframe of the investment signal, TNUoS charges could be used to both incentivise or disincentivise the development of renewables in Scotland. The potential benefit of TNUoS reform is that radical market reform is not required. TNUoS reform could be rapidly adopted under a national price market, with fewer of the associated transition risks. However, TNUoS charges would be unlikely to provide regular and accurate locational dispatch signals and so would have to be combined with additional reforms to replicate the full potential benefits of LMP.
Cost of capital
A significant risk that is presented throughout the literature, as well as the modelling, is the impact of an increase in the cost of capital. As renewables development is very capital intensive, changes in the cost of capital will have significant effects on the levels of investment and the final cost of electricity. A small increase in the cost of capital can significantly affect the total cost of a project, impacting its financial viability.
The cost-benefit modelling sensitivities simulated by Aurora, FTI, and AFRY, show that small increases in the cost of capital can easily wipe out the net modelled benefits of implementing LMP. Therefore, well-planned implementation of LMP is essential to limit the increases in the cost of capital for renewables. Furthermore, supporting policies such as CfDs, could work to derisk renewable development, if reformed for a LMP market, reducing the impact of market reform on the cost of capital of renewables.
Strengths, Weaknesses, Opportunities & Threats
Table 7: Strengths, Weaknesses, Opportunities & Threats of LMP regarding renewables development in Scotland.
|
Strengths |
Opportunities |
|
|
|
Weaknesses |
Threats |
|
|
Fair and just transition
This section outlines how LMP may affect Scotland’s ambitions to achieve a fair and just transition, as outlined in the draft ESJTP (Scottish Government, 2023c). This is of particular significance, as LMP will create regional differences across GB.
Description of Scottish ambitions
A fair and just transition is the cornerstone of Scotland’s energy strategy and aims to ensure that benefits and risks of the energy transition are distributed fairly. This means delivering affordable energy to Scottish consumers which is not subject to global fossil fuel price volatility. It also includes the wider economic developments of the energy transition. Scotland aims to maintain or increase employment in the energy production sector, amongst the backdrop of a historically strong oil and gas sector. Further growth in the energy sector should also come alongside boosting the skills base and local supply chains, ensuring technology, manufacturing, and know-how remain in Scotland. The benefits of market reform need to be spread out across all regions of Scotland, and not leave anyone behind. This is of particular concern for those at risk of fuel poverty. Additionally, Scotland aims to grow the community energy sector to 2GW by 2030.
Lower wholesale prices for consumers
LMP could see Scotland’s consumers benefitting from the lowest wholesale prices in GB, and possibly Europe (FTI Consulting, 2023). This is due to the significant capacity of renewable generation that is behind an export constraint, so prices will largely be set by wind generation. Compared to southern England, prices will converge in the long-term, as network build reduces constraint and generation is built closer to demand. However, Scotland is expected to maintain the cheapest prices in GB. It should be noted that there is limited reporting on the finer regional differences on price in the modelling.
As LMP creates regional differences in wholesale prices across GB, some areas will see electricity prices increase. It should be noted that the increase in electricity prices in some areas will not be equal, but less than the decrease in prices in Scotland. Because the current market arrangements are a national marginal price, every consumer in GB pays the price of the most expensive generator across the country. Under LMP, the marginal price of generation may increase in some locations (e.g. due to generation scarcity within the zone/node). However, on average this will only be a small increase on the national marginal price compared to the decrease in locations such as Scotland. In 2025, FTI project average wholesale prices in the most expensive zone and node to increase by 9% and 12% respectively compared to national pricing. This reduces to -4%[12] and 11% in 2040 respectively (FTI, LtW (HND) Scenario). It should be noted that zonal prices can help mitigate some of the most extreme regional inequalities that nodal LMP could create.
Despite this, it is possible given examples of LMP in other markets (see section 3.1) that, at least initially, domestic consumers could be shielded from some wholesale price signals under LMP, to reduce the negative impact on consumer bills where prices go up and protect consumers at risk of fuel poverty. In the reverse this would reduce the benefits on Scottish domestic electricity bills. A concern raised in the EAP is that it may be politically difficult or unpalatable for the UK Government to implement a new policy that disadvantages domestic consumers in specific areas.
Electricity suppliers may also decide not to pass on the whole benefit of reduced wholesale prices in Scotland to Scottish consumers. Increased costs in other areas mean suppliers may decide to effectively average out wholesale cost across their customer base. Additionally, ERM analysis projects that wholesale costs will make up 44% of domestic consumer bills in 2025. Any reduction in wholesale cost will thus be buffered by other components of the electricity bill including distribution network charges, green levies, and supplier costs. This would lead to a 21% reduction in Scottish electricity bills under LMP in 2025, based on a 35% reduction in wholesale cost (FTI Consulting, 2023). This would still be a significant reduction for Scottish consumers, which could result in a wide range of benefits and further a fair and just transition.
Employment, skills, and economic opportunities
A key ambition for a fair and just transition is to encourage economic growth and employment opportunities. The growth of the renewables sector poses a significant opportunity for this. New job opportunities will be needed to offset the decline of the oil and gas industry in Scotland. In 2021, there were around 82,400 direct and indirect jobs in the oil and gas sector (OEUK, 2022). Employment growth in the renewables and green energy sector could be used to offset this. The Fraser of Allander Institute (FAI) study shows that the renewable energy sector supported more than 42,000 jobs across the Scottish economy and generated over £10.1 billion of output in 2021 (FAI, 2023). With Scottish Government ambitions for increased generation capacity across a range of technologies by 2030, the wider employment benefits of renewables development are large. As discussed in section 4.1, LMP without mitigation could see future investment in renewables leave Scotland. This would risk the wider economic and employment benefits associated with renewables development.
However, if implemented successfully, lower wholesale prices could incentivise new industries such as electrolysers and data centres as well as other decarbonised industry with high electricity demand to locate in Scotland. This is a significant opportunity that could bring economic growth and employment to Scotland. An important factor is that the continued development of renewables in Scotland is necessary to provide sustained low electricity prices to attract new demand, as well as provide the actual power required for demand growth. Several members of the EAP supported this view, noting that reductions in electricity bills could be a key driver for new industry to locate in Scotland, especially if paired with additional Scottish Government backed incentives for industrial growth. However, others have stated that lower wholesale prices alone may not be sufficient to encourage new demand in certain industries.
Community energy
Without further support, community owned energy renewable generation is likely to become less attractive under LMP in Scotland. Renewables support mechanisms are likely to target larger scale projects, potentially leaving smaller community projects behind. Without support, lower wholesale prices are expected to make renewable energy projects less profitable in Scotland, reducing incentives for investment. Demand-side community energy projects will not be directly affected by wholesale market reform, other than the effect of lower and more volatile prices in Scotland. Members of the EAP noted that community energy projects are already lacking access to finance. Additional market reforms would be required to ensure the growth of community energy and enable easier routes to market, which is needed for a net zero system. Overall, there is not much literature on the impact of LMP on community energy, both regarding generation and demand-side projects.
Strengths, Weaknesses, Opportunities & Threats
Table 8: Strengths, Weaknesses, Opportunities & Threats regarding a fair and just transition under LMP in Scotland.
|
Strengths |
Opportunities |
|
|
|
Weaknesses |
Threats |
|
|
Decarbonisation of heat, transport, & industry
Wider decarbonisation efforts are often closely linked to electrification. In this section we will outline how regional changes in electricity prices that LMP creates could affect heat, transport, and industrial decarbonisation in Scotland.
Description of Scottish ambitions
Scotland’s ambitions for decarbonisation extend beyond the power sector to include heat, transport, and industry. Scotland aims to decarbonise heat and transport using renewable electricity or hydrogen. This includes the delivery of 6TWh of heat through heat networks (13% of 2021 heat demand). Electrolysis to produce green hydrogen is a significant opportunity, as Scotland already has a significant capacity of renewable generation, with ambitions for significant growth. This would not only use excess generation, store energy, and decarbonise industrial processes domestically, but also enable export of hydrogen to other countries. As such, Scotland aims to develop 5GW of renewable and low carbon hydrogen generation capacity by 2030 and 25GW by 2045. To further enable industrial decarbonisation, Scotland aims to accelerate the development of carbon capture utilisation and storage (CCUS).
Transport decarbonisation
Increasingly the decarbonisation of road transport looks to be dominated by electrification (Element Energy, an ERM Company, 2021). A reduction in electricity prices in Scotland under LMP could result in a decrease in the costs of electric vehicle (EV) charging. Despite this, the implementation of LMP is unlikely to significantly accelerate the uptake of EVs.
An Element Energy (an ERM Company) study in 2022 shows that electricity costs only make up around 9% of the total cost of ownership (TCO) of an EV car for a first owner (typically 1-4 years). Therefore, a 21% reduction in electricity cost for the consumer under LMP (see section 4.2) would only reduce the total cost of ownership by 2%. This highlights that the key cost consideration for an EV is the upfront purchase cost (and the associated depreciation for a first owner). Note that the potential savings attributed to electricity cost increases as a proportion of the TCO for second and third owners as the upfront purchase cost decreases. However, as with new EVs, operational costs are not a barrier to the uptake of second hand EVs. Additional considerations for EV ownership include access to public EV infrastructure and EV performance. So, while LMP could provide valuable benefits for consumers with EVs by reducing running costs, it is unlikely to significantly accelerate EV car adoption.
The impact is similar for other forms of road transport, such as vans and heavy-duty vehicles (HDVs). While fuel/energy cost can be a greater proportion of the TCO for high mileage vans and HDVs, capital expenditure is still the key consideration for electrification (ICCT, 2023). Access to public EV infrastructure is also essential for the uptake of electric vans and HDVs. Nevertheless, reduced wholesale electricity costs would lead to more favourable TCOs for these EVs, leading to earlier price parity with diesel equivalents and a more rapid uptake.
Heat decarbonisation
As with EVs, electrification will play a key role in the decarbonisation of heat in Scotland. The electrification of heat will focus on heat pumps (HP) and heat networks, with some role for other electric heating technologies including storage heaters and direct electric heating. For the average consumer, electric heating (with a HP) is more energy intensive than an EV, with annual consumptions of 3,000kWh and 1,800kWh respectively (ERM analysis). Therefore, lower electricity prices would have a greater impact on the running costs of a HP than an EV, so could incentivise uptake to a greater extent.
For the same reduction in prices detailed in section 4.2, ERM analysis on the TCO of a domestic HP shows a 10% reduction. For other forms of electrified heat (e.g. storage heaters and direct electric), LMP could similarly reduce running costs in Scotland. However, in the case of HPs, upfront costs can currently be prohibitive for many households. Continuation of Government support schemes to reduce upfront costs will be crucial to drive uptake, even with electricity market reform, particularly amongst lower income households. An example of this is the Home Energy Scotland Scheme, which offers homeowners grants of £7,500 to install a HP, and up to £9,000 in rural areas. A stakeholder in the EAP suggested that the introduction of lower prices in Scotland through electricity market reform could come at a critical moment as the uptake of HPs and EVs accelerates among the majority of consumers.
Hydrogen
A significant opportunity for Scotland under LMP is the development of hydrogen electrolysis capacity for the production of green hydrogen. Electricity cost is the largest contributor to the levelised cost of hydrogen (LCOH) via electrolysis, making it an important factor that contributes to the location of electrolysers (BEIS, 2021). Under LMP, Scotland could benefit from some of the lowest wholesale prices in Europe (FTI Consulting, 2023) which would attract electrolyser growth. This would enable a hydrogen export industry, but also contribute to the decarbonisation of industry by enabling some industries to decarbonise where it is more cost effective to use hydrogen. It can also help to enable a high renewables power system by absorbing excess variable generation. The wider economic benefits of employment and industry are also an opportunity for Scotland. An EAP member stated that the levels of electrolyser capacity in Scotland required for a net zero energy system are already very ambitious in FES 2023. Without market reform it will be very difficult to deliver this.
The main risk is that LMP leads to reduced development of renewables in Scotland, which is required for the significant demand that electrolysers, as well as wider electrification, will create. This could mean that supply may not grow in-line with growing demand, reducing the ability to provide electricity at low cost. Mechanisms to retain renewable development in Scotland are therefore essential for a thriving green hydrogen industry in Scotland.
Carbon capture, utilisation, and storage
Carbon capture can be used to reduce emissions of difficult to decarbonise industrial processes. Carbon capture generally involves three processes: carbon capture, conditioning and compression, and transport and storage. The main drivers for successful carbon capture are the need to mitigate large industrial emissions of CO2, as well as good transport and storage options. The main energy requirement for carbon capture is heat, not electricity, which is usually procured using natural gas. Some electricity is required for processes such as compression. As such, lower wholesale electricity prices would only minimally benefit the cost of carbon capture in Scotland.
Other types of carbon capture, including Direct Air Capture, also predominantly require heat. The solid sorbent DAC process requires lower thermal energy (80-100◦C), which can be delivered using waste industrial heat or industrial heat pumps. The liquid solvent process requires temperatures of 900◦C, which are usually delivered using natural gas (McQueen et al., 2021). Thus, DAC could benefit from lower wholesale electricity prices when using lower-temperature processes coupled with heat-pumps, maximising the use of electricity as the main energy requirement.
Strengths, Weaknesses, Opportunities & Threats
Table 9: Strengths, Weaknesses, Opportunities & Threats regarding the decarbonisation of heat, transport, and industry, including CCUS and hydrogen.
|
Strengths |
Opportunities |
|
|
|
Weaknesses |
Threats |
|
|
Enabling a secure and flexible net zero energy system
A future electricity system must be resilient to the fluctuations in variable renewable generation and demand. Flexibility is a significant aspect of enabling a secure electricity system. In this section we outline how LMP could affect Scotland’s ambitions to achieve this.
Description of Scottish ambitions
The Scottish Government aims to enable a secure and flexible net zero energy system which is not dependent on fossil fuels. As Scotland continues to expand its growing renewable energy capacity, increasing its role as a net exporter of electricity to the rest of the UK, the need to maximise the penetration of renewables will become increasingly important. There are several key factors that can contribute to this. Firstly, the development of energy storage and flexibility. This will enable the efficient use of variable renewable generation. Secondly, investment in grid infrastructure is essential, so that generators are not curtailed to mitigate constraints and electricity can flow where it is needed. Finally, dispatchable low carbon generation, such as hydrogen generation or gas with carbon capture, will be an important component of a secure decarbonised power system during periods of low renewable output. LMP provides a significant opportunity in Scotland for locational price signals to incentivise flexibility, as well as to incentivise efficient dispatch profiles to reduce constraints.
Energy storage and flexibility
The introduction of LMP would incentivise energy storage and flexibility to locate in Scotland due to volatile electricity prices, driven by generation from the high variable renewable capacity in Scotland that at times exceeds demand. Storage and flexibility benefit most when there is greater variation in electricity prices. Under LMP, this will occur in zones where intermittent renewable capacity or peak demand is greatest. Given that Scotland has significant wind capacity, prices will be more volatile than in other regions of GB. FTI find that the standard deviation in electricity prices in N. Scotland in 2025 under LMP would be similar to 2023 national prices, despite average prices being 71% lower. This is greater than in other areas in the country, even those with high demand (e.g. SE England). Such volatility would provide the best environment in the UK for wholesale arbitrage, likely attracting the relocation of battery investment to Scotland. Whilst this opportunity would decrease in magnitude as the transmission network is upgraded between England and Scotland, FTI notes that Scotland would still be among the most attractive locations to locate energy storage within the modelling timeframe to 2040. It should be noted that the implementation of LMP will likely take 4-8 years (National Grid ESO, 2022a), so the opportunity is overestimated when including years that LMP can not actually be realised. Overall, increasing flexibility in Scotland will not only reduce the need for expensive network build, but also improve security of supply.
This view was largely confirmed by the EAP. However, it was raised that the strongest signal to provide certainty for the investment in flexibility in Scotland would be a long-term contract, similar to the Capacity Market. Despite this, the clear signal sent by LMP would be stark in comparison to the weak signals from current locational mechanisms such as TNUoS charges and the Balancing Mechanism.
Furthermore, LMP would introduce locational dispatch signals improving the operational dispatch of flexibility to respond to generation and grid conditions at the node/zone that the flexibility is located. This would improve the efficiency of energy storage and flexibility (including interconnectors). The result of this would be to reduce the flexible capacity requirement and hence the cost of developing a secure and flexible net zero system.
Alignment of investment signals with network upgrades, at correct timescales
LMP provides short-term price signals that identify where the grid is constrained the most, given that it is designed around network bottlenecks. As such, it can be used to identify which zone/node boundaries require network reinforcement. Incentives for generation and demand to relocate should also reduce the need for network reinforcement itself.
However, to build an optimal net zero power system by 2035, rapid transmission build needs to be strategic, and in-line with plans for generation capacity build. This means that network build-out will not always be optimal, but the goal of strategic planning is to deliver electricity to consumers at the lowest cost achievable within the timescale for decarbonisation. This means co-optimising the development of generation, flexibility, and transmission network within these constraints. Such an approach has begun with NGESO proposing the HND, planned around offshore wind seabed leasing, providing more capacity to transport electricity out of Scotland.
Market reforms need to ensure that strategic planning of investment is prioritised. LMP can only send short-term price signals that dictate where network reinforcement is required for the current power system, it does not take into account future developments. Under LMP, this could be achieved through investment mechanisms (e.g. reformed CfDs and the Capacity Market) to ensure generation is developed in locations with a long-term system benefit.
Dispatchable low-carbon generation
Firm dispatchable low-carbon generation is a requirement for a future energy system that relies on variable renewable generation, to ensure security of supply. Dispatchable low-carbon generation is required for longer periods of limited renewable generation, when battery storage is not able to provide power over extended periods of time. This includes gas generation with carbon capture, hydrogen generation, or biomass generation (with carbon capture).
Such generation will be dispatched based on periods of high electricity prices, balancing actions, and Capacity Market instructions. LMP would improve locational signals for this generation, improving the efficiency of dispatch. Therefore, under LMP, dispatchable generation would be incentivised to locate in locations with high renewable generation or where peak demand is greatest. As with flexibility, such conditions would make Scotland an attractive location for dispatchable generation under LMP.
As with renewables, LMP creates additional risks for the investment in low carbon dispatchable generation. In an optimal market, LMP should incentivise investment in low carbon dispatchable generation where it is most required (locations with the highest prices). However, LMP introduces new risks for investors over the certainty of revenue as this will be significantly impacted by when and where network is upgraded. Mechanisms could be implemented alongside LMP to incentivise investment where it is most required while reducing risk for investors e.g. adding a locational element to the Capacity Market. This could be implemented without LMP, but with reduced dispatch efficiency.
Strengths, Weaknesses, Opportunities, Threats
Table 10: Strengths, Weaknesses, Opportunities and Threats for a secure and flexible net zero energy system.
|
Strengths |
Opportunities |
|
|
|
Weaknesses |
Threats |
|
|
Conclusions
Summary of findings
In this study we have reviewed the literature to understand the potential impacts of electricity market reform in Scotland. Based on the ambitions of the Scottish Government in their Draft Energy Strategy and Just Transition Plan, we have applied these impacts to explore how market reform and LMP could help further or risk these ambitions. The key conclusions of this assessment are summarised in Table 11.
Table 11: Key conclusions on the extent that LMP in electricity market reform could aid the Scottish Government’s ambitions in their Draft Energy Strategy and Just Transition Plan.
|
Ambition |
Conclusions |
|
Support the scale up of low-cost renewable energy |
On its own, LMP would create new risks for renewable generators and increase the cost of capital of new developments.
|
|
Adhere to the principles of a fair and just transition |
LMP could provide Scottish consumers with some of the lowest wholesale prices in Europe.
|
|
Support accelerated decarbonisation |
LMP could reduce the cost of electrification and incentivise power intensive industry and H2 production to locate in Scotland.
|
|
Enable a secure and flexible net zero energy system |
LMP is the most effective reform to provide locational signals for flexibility.
|
Overall LMP provides theoretical benefits to consumers of electricity and flexibility in Scotland, reducing wholesale prices and improving dispatch signals. If executed optimally, LMP could reduce the whole system cost associated with decarbonisation. However, LMP only provides short-term market signals and removes firm access rights for generators. Therefore, LMP would be ineffective at providing the long-term investment signals for renewables, which could create risks for the industry in Scotland, nullifying the potential benefits. Nevertheless, if additional market reform, alongside LMP, could protect renewable investment in Scotland, the potential benefits for Scottish consumers of electricity are sufficient to explore such a set of reforms.
Future market arrangements
In this section, we will explore the arrangement in which LMP could be successfully implemented and two counterfactuals, business-as-usual (BAU) with incremental reform, and LMP without further support. This will illustrate how reform could deliver benefits for consumers while protecting renewable generators.
These have been created based on what we believe possible market arrangements could be. First, business-as-usual arrangement identifies the flaws of continuing as usual. We identify the key reforms that would be required if national pricing is maintained to create a market with more effective locational signals. Second, LMP without supporting measures is described to identify the risk to Scottish renewables this arrangement could have. Finally, we explore LMP with mitigating measures as a final arrangement that we believe has the most potential to be successful.

Arrangement 1: Business-as-usual with incremental reform
Firm access to the entire GB electricity market will see renewable generators continue to locate in Scotland. Revenues would be secured by CfDs (regardless of exacerbated constraints, but not national curtailment). Without additional reform, TNUoS charges would be the only locational price driver for investment in renewables and flexibility. Although, non-price factors such as planning and renewable resource would also influence the location of renewables. As such, flexibility would not have a significant incentive to locate near renewables or behind import constraints in centres of demand. Local constraint markets could go some way to provide such signals, however, not without risks of its own (complicated market arrangements and perverse interactions of constraint and wholesale markets). Therefore, without reform, a BAU electricity market will not be optimal to encourage efficient investment in generation, flexibility, or networks for power system decarbonisation.
For consumers, the entire country would pay the marginal price of electricity regardless of the local generation mix. Therefore, wholesale prices will remain uniform across GB and would not provide a signal for demand to relocate to take advantage of areas with surplus renewable generation. As such, Scottish demand sectors would not be able to benefit from the renewable resources present in the country.
As indicated by the current REMA consultation, existing BAU electricity market arrangements are not fit for net zero. Regardless of the introduction of LMP, the electricity market will require reforms to enable a decarbonised energy system. Any reforms will create uncertainty so maintaining confidence for investors and consumers will be essential in any next steps. A combination of alternative reforms could achieve some the LMP’s potential benefits. These could include reforms to TNUoS, CfDs, the Balancing Mechanism, as well as developing local constraint markets. These alternatives could see less disruption, as they would be evolutions of existing arrangements. However, they would be unlikely to fully replicate the benefits of a successfully implemented LMP market.
Arrangement 2: LMP without further renewables support
Under LMP, the loss of firm access rights to markets outside of immediate zones/nodes would greatly increase revenue risk to generators located behind export constraints (such as in Scotland). With the additional prospect of low wholesale prices, due to a surplus in renewable generation in Scotland, LMP would create a significant investment risk in Scotland. This could lead to some renewable generation re-locating to other parts of the UK, or investment leaving for other markets entirely. This would pose further risks to whole system decarbonisation, potentially leading to delays in renewable roll-out in the UK as supply chains move from Scotland to other areas. Likely increases in the cost of capital due to elevated risks for generators would also lead to reduced investment in renewables. This alone could wipe out the power system cost-benefit of introducing LMP.
Flexibility would be incentivised to relocate to Scotland under LMP, where volatile locational prices would provide operational profiles that could see flexibility generate the highest revenue across the UK. Furthermore, consumers would be set to benefit in Scotland. Given Scotland is already a net exporter of electricity, LMP would see a reduction in wholesale prices and hence a reduction in retail prices if passed through to consumers. Note that some consumer groups could be shielded from locational variations in wholesale prices.
Nevertheless, despite the potential benefits for consumers, the risk to the renewables industry in Scotland and the wider economic benefits that it brings means that LMP alone will be unable to deliver on the ambitions of the Scottish Government. Further reform would be needed to insulate renewable generators from the adverse effects of LMP on their investment case.
Arrangement 3: LMP with reformed support mechanisms to insulate renewables
LMP can provide strong incentives for the optimal location and dispatch of flexibility and demand as well as offering Scottish consumers the lowest wholesale prices in the UK. The extent to which Scottish demand could benefit from lower wholesale prices will depend on several factors, including potential shielding of demand and long-term effects on the cost of electricity if cost of capital increases materialise. However, in Scotland it leaves an oversupplied generation market with limited case for further investment until the transmission network is reinforced. A thriving Scottish renewables sector is required to meet the UK Government’s target of a net zero power system by 2035. Therefore, it is vital that renewables continue to be developed in Scotland ahead of planned network capacity upgrades that enable generation to be transmitted to centres of demand across the UK. Should a support mechanism for investment in renewables be implemented on this basis alongside LMP then such electricity market reforms could deliver for all players in the power system: generators, flexibility, and consumers.
While it is out of the scope of this study to fully consider the design of such a support mechanism, it would likely take the form of a reformed CfD. Already, the current CfD mechanism completely insulates renewable generation from market price to de-risk investment. Under LMP, the further reform that would be required to de-risk renewables would be to insulate renewables from market volume. Essentially, this would protect renewables from the loss of firm access rights under LMP. An example of this reform could be moving to a deemed CfD, however other options should be considered.
The argument for such a reform is that renewable generation is inflexible, with no control over when and how much it generates. Given that vast additional renewable capacity is required to reach net zero, renewable energy should not be penalised based on these limitations. The result of this would put additional onus on the UK Government to consider the long-term system benefits when awarding CfDs based on current and future constraint forecasts and network upgrades. It would also likely increase the cost of CfDs for the UK Government. However, given the rapid pace of decarbonisation required to reach net zero, it could be argued that such additional risk and cost should sit with the UK Government rather than investors. This is because, overall, the mechanism should still provide whole system investment and operational savings, which will be passed down to consumers via electricity bills.
Conclusions
The authors conclusions are based on the work presented in this report. They form an assessment of the opportunities and threats that LMP and wider electricity market reform poses to the Scottish Government’s ambitions as per their Draft Energy Strategy and Just Transition Plan. Based on the findings of this study, the Scottish Government should consider supporting the implementation of LMP alongside a GB-wide strategic plan for renewable and network investment through further electricity market reform. The following conclusions are in order of importance and are sequential:
- Scotland must prioritise and coordinate a strategic plan for renewable generation and network reinforcement with the UK Government.
- Alone, LMP poses a significant risk for renewable development in Scotland, threatening the green economy in Scotland, the wider economic benefits it may bring, and a net zero power system by 2035.
- Long-term locational signals to strategically locate investment of renewables are essential to achieve a cost-efficient net zero power system by 2035.
- Due to its existing renewable pipeline, renewable resources, and existing industry, Scotland should be prioritised as a location for renewable investment and network reinforcement.
- Introducing support mechanisms, such as a reformed CfD, which protects against revenue and volume risk in the wholesale market, is essential to the successful implementation of LMP to maintain investor confidence in Scottish renewables.
- Alternatively, improved TNUoS charges, with long-term locational signals, could provide similar locational investment signals in a national market, however without creating the efficient dispatch signals LMP could.
- The Scottish Government has the opportunity to work with the UK Government to implement reform, as the responsibility for these mechanisms lie with the UK Government.
- LMP would provide the clearest dispatch signal for flexibility, delivering efficient investment and operation of flexibility.
- To maximise renewable penetration, net zero will require clear dispatch signals for flexibility to improve siting and operation. These signals under LMP would incentivise the relocation of flexibility to Scotland.
- If implemented effectively, these features of LMP should reduce the whole system investment and operational cost associated with decarbonisation, benefiting consumers.
- Should consumers be exposed to locational prices, Scottish consumers would benefit directly from reduced wholesale prices because of existing renewable generation in Scotland. This would send a clear signal to site new demand in Scotland.
- A zonal market would enable most of the system benefits of LMP, without the complexity and disruption of implementing a nodal market.
- However, should LMP be deemed too disruptive, local constraint markets could serve as an alternative dispatch signal for flexibility. However, this is unlikely to be able to replicate the granular benefits of LMP and could result in complex market arrangements with consequences that should be explored in detail before it is recommended as a complete solution to locational dispatch signals.
- The Scottish Government should account for the potential benefits of LMP for consumers being greater the earlier it is introduced.
- Scottish consumers stand to benefit more from LMP the earlier it is introduced ahead of planned network reinforcement by 2035 and onwards.
- While the priority must be to have a clear and well communicated plan for the implementation of market reform, the earlier LMP could be implemented, the greater the benefits to Scottish consumers.
- The first step would need to be the development of reformed support mechanisms and the grandfathering of existing support mechanisms which protect both existing and developing renewable generation.
- If alternative market reforms are pursued, a similar approach to prioritising confidence in renewables should be adopted.
- Locational market reform would need to be carefully implemented as it would inevitably create winners and losers.
- While Scottish consumers could be a key winner of LMP, the Scottish Government would have to consider how the rest of GB may be impacted.
- Support to protect the future Scottish renewables industry is essential to deliver net zero, while ensuring that the industry remains in Scotland and jobs are realised.
- Future renewables support, also including the grandfathering of current arrangements, should be designed, communicated and implemented ahead of a transition to LMP.
- Zonal pricing could help to remove the most extreme regional inequalities from LMP under a nodal market, reducing the risk of LMP to a just transition.
Next steps
Based on our conclusions, we suggest the Scottish Government takes the following next steps to fully explore whether LMP could be implemented with the appropriate support mechanisms to provide benefits to generation and demand across the whole system:
- Work with the UK Government to develop a long-term strategic plan, such as the SSEP, to achieve a decarbonised power system by 2035 and net zero by 2050. This includes the planning of a cost-effective level of network infrastructure investment, renewables development, and short- and long-duration storage. This would improve the penetration of renewables, reduce constraints, and lead to whole system savings.
- Fully explore the risks and opportunities of reforming CfDs to insulate renewables against price risk and volume risk, and the suitability of implementing such a support mechanism alongside LMP.
- Develop wider support mechanisms to support the benefits of LMP in Scotland, such as new demand sectors, to ensure that Scotland can take full advantage of electricity market reform.
- LMP will take 4-8 years to implement if selected, Scotland should support alternative reforms in the interim to encourage the early development of locational benefits ahead of LMP (e.g. extending the NGESO Local Constraint Market in Scotland).
Scotland has a significant opportunity to benefit from a decarbonised power system by taking advantage of its renewable resources and distributing those benefits to consumers in a decarbonised economy. Proposed changes to wholesale electricity markets could improve system-wide efficiency and offer cheaper electricity in Scotland. However, it could increase risk associated with investment in Scottish renewables, increasing costs. The Scottish Government needs to engage carefully with the electricity market reform process to ensure that prospective benefits are realised, and that potential disbenefits are avoided or mitigated.
References
AFRY (2023) Review of electricity market design in Great Britain. Available at: https://afry.com/sites/default/files/2023-12/gb_electricitymarketdesign_phase2_publicsummaryreport_v500.pdf
Aurora (2023) Locational marginal pricing in Great Britain. Available at: https://auroraer.com/wp-content/uploads/2023/09/Locational-Marginal-Pricing-GB-Aurora-Public-Report.pdf
Baringa (2023) Net Zero Market Reform – Phase 4. Available at: https://www.nationalgrideso.com/document/276841/download
Carbon Tracker (2023) Gone with the Wind? Grid congestion and wind integration in GB. Available at: https://carbontracker.org/reports/gone-with-the-wind/
Citizens Advice (2023) It’s all about location: Will changing the way we price electricity deliver for consumers?. Available at: https://assets.ctfassets.net/mfz4nbgura3g/2esOmp5ZjvBnxChIV7sjd4/8d1a042a8c1e406b189a2491144b9e01/For_20publication_20-_20It_s_20all_20about_20location.pdf
ClimateXChange (2022) Expanding Scottish energy data – heat. Available at: https://www.climatexchange.org.uk/media/5157/cxc-expanding-scottish-energy-data-heat-february-22.pdf
Department for Business, Energy & Industrial Strategy (2021) Hydrogen Production Costs 2021. Available at: https://assets.publishing.service.gov.uk/media/611b710e8fa8f53dc994e59d/Hydrogen_Production_Costs_2021.pdf
Department for Energy Security and Net Zero (2023a) Energy and emissions projections: 2022 to 2040. Available at: https://www.gov.uk/government/publications/energy-and-emissions-projections-2022-to-2040
Department for Energy Security and Net Zero (2023b) Electricity generation costs 2023. Available at: https://www.gov.uk/government/publications/electricity-generation-costs-2023
Department for Energy Security and Net Zero (2023c) Average annual domestic electricity bills by countries in the United Kingdom. Available at: https://www.gov.uk/government/statistical-data-sets/annual-domestic-energy-price-statistics
Department for Energy Security and Net Zero (2023d) Regional Statistics 2009-2022: Standard Load Factors. Available at: https://www.gov.uk/government/statistics/regional-renewable-statistics
Department for Energy Security and Net Zero (2023e) ECUK 2023: Primary energy consumption data tables. Available at: https://www.gov.uk/government/statistics/energy-consumption-in-the-uk-2023
Element Energy (an ERM Company) (2021) Decarbonising the Scottish Transport Sector. Available at: https://www.transport.gov.scot/media/50354/decarbonising-the-scottish-transport-sector-summary-report-september-2021.pdf
Element Energy (an ERM Company) (2022) TCO and tax scenarios for passenger cars in the UK.
Energy UK (2023) Energy UK high-level views on Locational Marginal Pricing. Available at: https://www.energy-uk.org.uk/publications/energy-uk-high-level-views-on-locational-marginal-pricing/
ES Catapult (2021) Introducing nodal pricing to the GB power market to drive innovation for consumers’ benefit: Why now and how? Available at: https://es.catapult.org.uk/report/locational-energy-pricing-in-the-gb-power-market/
ES Catapult (2021) Locational Energy Pricing in the GB Power Market. Available at: https://es.catapult.org.uk/report/locational-energy-pricing-in-the-gb-power-market/
ES Catapult (2022) Informing the REMA debate. International Learnings on Investment Support for Clean Electricity. Available at: https://es.catapult.org.uk/report/rema-international-learnings-on-investment-support-for-clean-electricity/
ES Catapult (2022) Location, Location, Location. Reforming wholesale electricity markets to meet Net-Zero. Available at: https://es.catapult.org.uk/report/location-location-location-reforming-wholesale-electricity-markets-to-meet-net-zero/
Fraser of Allander Institute (2023) The Economic Impact of Scotland’s Renewable Energy Sector – 2023 Update. Available at: https://fraserofallander.org/wp-content/uploads/2023/12/FINAL-The-Economic-Impact-of-Scotlands-Renewable-Energy-Sector-1.pdf
Frontier Economics (2022) Locational marginal pricing – Implications for cost of capital. Available at: https://www.frontier-economics.com/uk/en/news-and-insights/news/news-article-i20310-locational-marginal-pricing-implications-for-the-cost-of-capital/#
Frontier Economics (2023) The benefits of locational marginal pricing in the GB electricity system – A review of FTI’s assessment of the benefits. Available at: https://www.frontier-economics.com/uk/en/news-and-insights/news/news-article-i20234-locational-marginal-pricing-assessing-the-benefits/
FTI Consulting (2023) Locational pricing assessment in GB: Final modelling results. Available at: https://www.ofgem.gov.uk/sites/default/files/2023-10/Key%20findings%20from%20FTI%20Consulting%20presentation%20June%202023%20.pdf
FTI Consulting (2022) Net Zero Market Reform: Phase 3. Assessment of market design options. Available at: https://www.nationalgrideso.com/document/258876/download
Gill et al. (2023) Exploring market change in the GB electricity system: the potential impact of Locational Marginal Pricing. Available at: https://pureportal.strath.ac.uk/en/publications/exploring-market-change-in-the-gb-electricity-system-the-potentia-2
Gill, S. (2023) Review of Electricity Market Arrangements: A Vision for Scotland. Available at: https://www.scottishfuturestrust.org.uk/publications/documents/sft-rema-report-a-vision-for-scotland-november-2023
H2Green Steel (2023) Questions and answers about our establishment in Boden. Available at: https://www.h2greensteel.com/questions-and-answers-about-our-establishment-in-boden#:~:text=We%20chose%20to%20locate%20our,the%20region%20%E2%80%93%20an%20ideal%20environment
ICCT (2023) A total cost of ownership comparison of truck decarbonisation pathways in Europe. Available at: https://theicct.org/publication/total-cost-ownership-trucks-europe-nov23/
MacIver et al. (2023) Exploring market change in the GB electricity system: the potential impact of Locational Marginal Pricing – stakeholder insight report. Available at: https://pureportal.strath.ac.uk/en/publications/exploring-market-change-in-the-gb-electricity-system-the-potentia
McQueen et al. (2021) A review of direct air capture (DAC): scaling up commercial technologies and innovating for the future. Available at: https://iopscience.iop.org/article/10.1088/2516-1083/abf1ce/pdf
National Grid (2023) We’re engaging on our early pans to transform our network for net zero. Available at: https://www.nationalgrid.com/electricity-transmission/were-engaging-our-early-plans-transform-our-network-net-zero
National Grid ESO (2022a) Net Zero Market Reform: Phase 3 Assessment and Conclusions. Available at: https://www.nationalgrideso.com/document/258871/download
National Grid ESO (2022b) Network Options Assessment 2021/22 Refresh. Available at: https://www.nationalgrideso.com/document/262981/download
National Grid ESO (2023a) Monthly Balancing Services Summary. Available at: https://www.nationalgrideso.com/data-portal/mbss
National Grid ESO (2023b) Markets Roadmap. Available at: https://www.nationalgrideso.com/document/278306/download
National Grid ESO (2023c) Future Energy Scenarios 2023 Data Workbook. Available at: https://www.nationalgrideso.com/future-energy/future-energy-scenarios-fes
National Grid ESO (2023d) NZMR Phase 4 Webinar Q&A. Available at: https://www.nationalgrideso.com/document/283516/download
National Grid ESO (2023e) Monthly Balancing Services Summary (MBSS) Mar-2023. Available at: https://www.nationalgrideso.com/data-portal/mbss
OEUK (2022) Workforce Insight 2022+. Available at: https://oeuk.org.uk/wp-content/uploads/2022/11/OEUK-Workforce-Insight-2022.pdf
Office for Budget Responsibility (2024) Economic and fiscal outlook – March 2024. Available at: https://obr.uk/efo/economic-and-fiscal-outlook-march-2024/
Office for National Statistics (2024) Consumer price inflation time series (MM23). Available at: https://www.ons.gov.uk/economy/inflationandpriceindices/timeseries/d7bt/mm23
Offshore Wind Scotland (2023) Offshore Wind Market in Scotland. Available at: https://www.offshorewindscotland.org.uk/the-offshore-wind-market-in-scotland/
Ofgem (2014) Electricity Interconnectors factsheet. Available at: https://www.ofgem.gov.uk/sites/default/files/docs/2014/05/electricity_interconnectors_factsheet.pdf
Ofgem (2023) Assessment of Locational Wholesale Pricing for GB. Available at: https://www.ofgem.gov.uk/sites/default/files/2023-10/Ofgem%20Report%20-%20Assessment%20of%20Locational%20Pricing%20in%20GB%20%28final%29.pdf
Ofgem (2024) Breakdown of an electricity bill. Available at: https://www.ofgem.gov.uk/energy-data-and-research/data-portal/all-available-charts?keyword=bills&fuel_type=1606&sort=relevance
Pollitt, M. (2023) Locational Marginal Prices (LMPs) for Electricity in Europe? The Untold Story. Available at: https://www.eprg.group.cam.ac.uk/wp-content/uploads/2023/07/text-2318-revised-180723.pdf
Rai et al. (2021) Financing costs and barriers to entry in Australia’s electricity market. Available at: https://www.researchgate.net/publication/350358213_Financing_costs_and_barriers_to_entry_in_Australia’s_electricity_market
Regen (2023a) Call for evidence on introducing non-price factors into the Contracts for Difference scheme. Available at: https://www.regen.co.uk/wp-content/uploads/CfE-non-price-factors-CfD-Regen-response.pdf
Regen (2023b) Improving locational signals in the GB electricity markets. Available at: https://www.regen.co.uk/insight-paper-improving-locational-signals-in-the-gb-electricity-market/
Scottish Government (2021) Heat in Buildings Strategy. Available at: https://www.gov.scot/publications/heat-buildings-strategy-achieving-net-zero-emissions-scotlands-buildings/documents/
Scottish Government (2022) Hydrogen Action Plan. Available at: https://www.gov.scot/publications/hydrogen-action-plan/
Scottish Government (2023a) Scottish Energy Statistics HubEnergy Statistics for Scotland – Q2 2023. Available at: https://scotland.shinyapps.io/sg-scottish-energy-statistics/?Section=RenLowCarbon&Subsection=RenElec&Chart=RenElecPipeline https://www.gov.scot/publications/energy-statistics-for-scotland-q2-2023/pages/renewable-electricity-capacity/
Scottish Government (2023b) Just Transition: Grangemouth. Available at: https://www.gov.scot/binaries/content/documents/govscot/publications/strategy-plan/2023/09/discussion-paper-transition-grangemouth-industrial-cluster/documents/discussion-paper-transition-grangemouth-industrial-cluster/discussion-paper-transition-grangemouth-industrial-cluster/govscot%3Adocument/discussion-paper-transition-grangemouth-industrial-cluster.pdf
Scottish Government (2023c) Draft Energy Strategy and Just Transition Plan. Available at: https://www.gov.scot/publications/draft-energy-strategy-transition-plan/documents/
The Crown Estate (2023) The Crown Estate Offshore Wind Leasing Round 4 Selected Projects. Available at: https://www.thecrownestate.co.uk/media/3721/the-crown-estate-offshore-wind-leasing-round-4-selected-projects.pdf
Transport Scotland (2020) National Transport Strategy 2. Available at: https://www.transport.gov.scot/publication/national-transport-strategy-2/
© The University of Edinburgh, 2024
Prepared by Environmental Resources Management Ltd.on behalf of ClimateXChange, The University of Edinburgh. All rights reserved.
While every effort is made to ensure the information in this report is accurate, no legal responsibility is accepted for any errors, omissions or misleading statements. The views expressed represent those of the author(s), and do not necessarily represent those of the host institutions or funders.
Marginal pricing means that one price, the price set by the most expensive selected electricity generation offer to meet demand is received by every successful participant in the electricity generation auction. ↑
National Grid suggest that to meet the Government’s target of 50GW of offshore wind by 2030, more than five times the amount of transmission infrastructure must be delivered in the next seven years, than has been built in the past 30 years. ↑
Historical CPI inflation data from ONS (2024), and 2024 forecast from OBR (2024). ↑
No whole system cost estimate provided, only relative changes. ↑
6.8GW and 3.7GW increase in battery capacity by 2035 in N and S Scotland respectively, compared to 13GW total GB capacity. FTI Consulting (2023) LtW NOA7 Scenario. Values estimated from report charts. ↑
-1.2GW and -1.4GW reduction of solar capacity by 2035 in N and S Scotland respectively, compared to 58GW total GB capacity. FTI Consulting (2023) LtW NOA7 Scenario. Values estimated from report charts. ↑
-1.5GW and -4.3GW reduction in offshore wind capacity by 2035 in N and S Scotland respectively, compared to 76GW total GB capacity. FTI Consulting (2023) LtW NOA7 Scenario. Values estimated from report charts. ↑
6.5GW increase in onshore wind capacity by 2035 in N Scotland, compared to 31GW total GB capacity. FTI Consulting (2023) LtW NOA7 Scenario. Values estimated from report charts. ↑
The boundaries for Scotland and Southern Scotland in the models are generally defined by the B4 and B6 transmission constraints. The B4 constraint separates the transmission network between the SP Transmission and SSEN Transmission interface, from the Firth of Tay in the east to the north of the Isle of Arran in the West. The B6 boundary runs roughly along the border between Scotland and England, on the SP Transmission and NG Electricity Transmission interface. ↑
Up to 2035. ↑
Beyond 2035. ↑
A decrease in the average wholesale price in the most expensive zone by 2040 due to system savings under LMP. ↑
The aim of this study was to investigate the skills need of the solar industry in Scotland, based on a proposed ambition of 4 to 6 gigawatts (GW) installed solar capacity by 2030.
These were addressed through a literature review, model development and stakeholder engagement.
Findings
- The workforce serving the solar industry will need to increase from approximately 800 in 2023 to an estimate of over 11,000 full time equivalent (FTEs) in 2030. Most of this growth is attributed to construction-related activities, especially for ground-mounted solar projects
- People currently employed in the industry have the right skills, however, there is a significant shortage of skilled labour. Therefore, there is a need for more people to be recruited into the solar industry. The existing training provision, with some development and adaptation, can provide the necessary skills to those who do not have direct solar industry experience.
- If skilled workforce shortages are not addressed, the potential impact on the ability to deliver 4 to 6 GW of solar capacity by 2030 could be significant, given the difference between current and required future workforce levels.
- The expansion to around 11,000 FTEs by 2030 includes 9,100 FTEs for construction related activities, almost 82% of the new workforce required. These workforce requirements are relatively temporary. In contrast, approximately 2,000 FTEs will be required for operation and maintenance activities, which provide more lasting employment needs.
- The highest levels of workforce requirements were identified in the following specialisms: electricians, grid connection engineers, high voltage technicians, electrical engineers and constructions workers.
- This research points to two pathways for achieving a suitable skillset for these specialisms:
- Upskilling in addition to general technical training through short courses or in-house training, or
- Adding PV-relevant modules to existing training courses.
- The installation of commercial rooftop projects is and will continue to be concentrated in and around the main clusters of population in the central belt of Scotland, the Borders, Dumfries and Galloway, the east- and north-east of Scotland and in and around the Inverness area.
- The majority of the ground-mounted projects will be located in more rural and less densely populated regions of Scotland, particularly Aberdeenshire, Angus, Fife and Tayside, where there is availability of land at a size appropriate for these larger systems. The installation of ground-mounted systems is expected to require a partly mobile and partly fixed workforce.
- Reliable data relating to the future pipeline of domestic rooftop projects is not readily available.
For further details please read the report.
If you require the report in an alternative format such as a Word document, please contact info@climatexchange.org.uk or 0131 651 4783.
March 2024
DOI: http://dx.doi.org/10.7488/era/4518
Executive summary
Aims
The aim of this study is to investigate the skills need of the solar industry in Scotland, based on a proposed ambition of 4 to 6 gigawatts (GW) installed solar capacity by 2030. These were addressed through a literature review, model development and stakeholder engagement. We also relied on the expertise of solar industry specialists in the study team.
Findings
The modelling was carried out assuming the delivery of 6 GW by 2030. This assumes a split between 3.5 GW ground-mounted, 1GW commercial rooftop and 1.5 GW domestic rooftop solar panels.
We developed a hypothetical deployment pathway that delivers 6 GW of solar power by 2030. On basis of this pathway, the workforce serving the solar industry will need to increase from approximately 800 in 2023 to an estimate of over 11,000 full time equivalent (FTEs) in 2030. Most of this growth is attributed to construction-related activities, especially for ground-mounted solar projects, as shown in Figure 1.

Figure 1. Workforce requirements to deliver 6 GW solar capacity in Scotland by 2030, in FTE. Based on hypothetical deployment pathway.
Overall, stakeholder engagement suggests that the people currently employed in the industry have the right skills, however, there is a significant shortage of skilled labour. Therefore, there is a need for more people to be recruited into the solar industry. The existing training provision, with some development and adaptation, can provide the necessary skills to those who do not have direct solar industry experience.
If skilled workforce shortages are not addressed, the potential impact on the ability to deliver 4 to 6 GW of solar capacity by 2030 could be significant, given the difference between current and required future workforce levels.
The expansion to around 11,000 FTEs by 2030 includes 9,100 FTEs for construction related activities, almost 82% of the new workforce required. These workforce requirements are relatively temporary. In contrast, approximately 2,000 FTEs will be required for operation and maintenance activities, which provide more lasting employment needs.
The highest levels of workforce requirements were identified in the following specialisms:
- electricians
- grid connection engineers
- high voltage technicians
- electrical engineers
- constructions workers, including:
- civil contractors
- general labourers / operators
- crane operators / lifting contractors
- roofers
Our research points to two pathways for achieving a suitable skillset for these specialisms: 1) upskilling in addition to general technical training through short courses or in-house training, or 2) adding PV-relevant modules to existing training courses.
In terms of geographic distribution, we base our estimates on the project pipeline data in the Renewable Energy Projects Database at the time of writing (December 2023). Our estimates suggest that the installation of commercial rooftop projects is, and will continue to be, concentrated in and around the main clusters of population in the central belt of Scotland, the Borders, Dumfries and Galloway, the east- and north-east of Scotland and in and around the Inverness area. The majority of the ground-mounted projects will be located in more rural and less densely populated regions of Scotland, particularly Aberdeenshire, Angus, Fife and Tayside, where there is availability of land at a size appropriate for these larger systems. The installation of ground-mounted systems is expected to require a partly mobile and partly fixed workforce. Reliable data relating to the future pipeline of domestic rooftop projects is not readily available.
Recommendations
Actions to address the skills shortages in Scotland will be essential for the success of Scotland’s solar PV industry in its delivery of 6 GW installed capacity and for meeting broader renewable energy objectives. The development and delivery of these actions should be led by industry, but will require support from and collaboration with schools, colleges, universities, training providers and relevant public sector bodies.
We suggest the following actions to address the skills challenges highlighted:
- Developing strategies to promote the solar industry and attract new entrants. These should highlight its net zero and sustainability credentials and be designed for primary, secondary, further and higher education students, as well as individuals already in the workforce. These should clearly illustrate the wide range of potential career pathways for individuals at all levels of education.
- Putting in place initiatives to design and specify renewable energy and solar-specific course content. Potential options could include:
- a dedicated apprenticeship in renewable energy
- college and university courses (such as electrical engineering) and apprenticeships (such as electrician and construction) that provide the opportunity to specialise in renewable energy and/or solar PV system installation
- extension of the vocational graduate apprenticeship scheme to cover a wider range of subjects, such as electrical engineering.
Glossary / abbreviations table
|
AC |
Alternating current |
|
CAGR |
Compound annual growth rate |
|
DC |
Direct current |
|
DNO |
Distribution network operator |
|
FTE |
Full time equivalent |
|
GW |
Gigawatt, a unit of power |
|
GWO |
Global Wind Organisation |
|
HNC |
Higher National Certificate |
|
HND |
Higher National Diploma |
|
KW |
Kilowatt, a unit of power |
|
LCREE |
Low carbon and renewable energy economy |
|
MCS |
Microgeneration Certification Scheme |
|
MW |
Megawatt, a unit of power |
|
MWelec |
Megawatts of electricity |
|
PV |
Photovoltaic |
|
REPD |
Renewable Energy Planning Database |
|
SAP |
Senior authorised person |
|
SIC |
Standard Industry Classification |
|
TW |
Terawatt, a unit of power |
|
TWh |
Terrawatt hour, a unit of energy |
Introduction
Background
By late 2023, Scotland’s solar energy capacity was recorded at approximately 600 megawatts (MW) consisting of domestic and commercial rooftop installations and a small number of ground-mounted installation[1].
In 2021 Solar Energy Scotland called upon the Scottish Government to commit to a minimum of 4 GW solar energy by 2030, with an ambition to reach 6 GW (Solar Energy UK, 2023). In October 2023, the Scottish Government publicly announced a proposal for a solar deployment ambition of 4-6 GW by 2030 (Scottish Parliament, 2023). A final decision on this proposed ambition will be made in the final solar vision, which is due to be published within the Energy Strategy and Just Transition Plan in summer 2024.
Purpose of this study
To deliver 4-6 GW of solar by 2030, ground-based solar farms and rooftop systems would have to be deployed at a scale that has never been attempted before in Scotland. A skilled workforce would play a crucial part in enabling this scale of activity and it is essential, therefore, that any skills gaps and/or shortages within the workforce are identified, so that skills providers and policymakers can develop actionable strategies to close these gaps. This study investigates the skills needs for the solar industry in Scotland, based on the proposed ambition to reach 4 to 6 GW installed solar capacity by 2030. The key objectives are to:
- Model the current and future workforce requirements in Scotland’s solar industry assuming 6 GW installed capacity by 2030.
- Use these models to estimate the number of skilled workers required at each stage of the project lifecycle for the different types of project (ground-based and rooftop).
- Identify the geographical spread of the workforce, identifying where jobs will be located in Scotland.
- Assess the potential future demand for skills and identify any skills gaps.
Study methodology
The study relies on a literature review, insights from the experience of study team members and ITPEnergised in managing hundreds of solar projects, internal ITPEnergised interviews, study-specific modelling and stakeholder validation. Stakeholder engagement included interviews with ten stakeholders in the solar industry and a presentation at Solar Energy Scotland (the Solar Energy UK Scottish Working Group).
Section 4 provides an overview of the solar industry.
Section 5 details the solar project lifecycle, job roles and skills levels.
Section 6 quantifies the number and types of jobs required currently and to 2030.
Section 7 details the demand for skills, challenges and ways of addressing these challenges.
The report concludes with observations on future skills requirements and makes recommendations for actions required to address the skills challenges identified in sections 8 and 9.
Solar industry overview
Solar photovoltaic systems
The key components of a solar photovoltaic (PV) system are the solar panels that are constructed from layers of highly specialised semiconductor materials. When the sun shines on a solar panel, the energy causes electrons to be released from these materials and flow from one layer to another. When the layers are connected in an electrical circuit, electrons are ‘pushed’ towards the metal conducting elements (electrodes and wires) creating direct current electricity. This is known as the photovoltaic effect.
In addition to the solar panels themselves, other components in a typical PV system could include electrical connections, output power lines, inverters, mounting equipment, devices that manage the electricity exchange with batteries, batteries, meters, wiring, power processing and grounding equipment. The installation, commissioning, operation and maintenance of this equipment requires specialised skills.
Market overview
Global energy generation by solar photovoltaic
Globally, solar PV generation increased by a record 270 terrawatt hours (TWh), up 26%, in 2022, reaching almost 1,300 TWh. It demonstrated the largest absolute generation growth of all renewable technologies in 2022, surpassing wind (International Energy Agency, 2023).
A notable trend in the solar energy sector is the decreasing costs of PV systems. The prices for solar PV modules recently saw a dramatic decline, nearly halving year-on-year. This price decrease coincided with a substantial increase in manufacturing capacity, which reached three times the levels recorded in 2021.
Chinese companies have an almost complete monopoly over the global solar PV cell manufacturing industry, rendering the supply chain more prone to disruption. Overall, China is expected to maintain an 80-95% share in the global solar PV supply chain, as reported by the International Renewable Energy Agency (IRENA) in their Renewable Energy and Jobs Annual Review 2023 (IRENA, 2023).
UK and Scottish market overview
In the UK, the cumulative installed capacity of solar PV reached nearly 16 GW at the end of 2023. In late 2023, Scotland’s solar energy capacity was recorded at 600 MW, as noted previously (Department for Energy Security and Net Zero, 2023).
In addition to the installed capacity, there is, at the end of 2023, an estimated pipeline capacity of 1.74 GW, as shown in Table 1 (data extracted from the REPD database).
|
Development Status |
Capacity (MW) |
|
Planning application submitted (first application or revised) |
727 |
|
No application required[2] |
1.3 |
|
Awaiting construction |
917 |
|
Under construction |
99 |
The data above refers to commercial projects (ground mounted and rooftop) only, as such data is not collected for domestic rooftop installations.
The largest solar farm in Scotland, sited on land at the Errol Estate in Perthshire, came online in 2016 (Scotland Land & Estates, 2023). This 13 MW scheme, incorporating 55,000 solar panels, produces enough electricity to power 3,500 homes. The capacity of the other operational solar farms and commercial roof-top installations is 10 MW or less, with the majority being less than 1 MW.
Despite the reduction in PV system costs, coupled with the recent spike in energy prices in the UK, demand for domestic solar PV has not increased significantly, according to a stakeholder (industry association) contacted during this study. This is due to factors such as relatively high absolute costs and reduced grant availability.
In Scotland, solar value chains are primarily focused on the design, installation and maintenance aspects of solar PV systems. This focus aligns with the global trends in the solar market, with manufacturing centralised in China.
Solar industry context
Interviewees for this study have strongly emphasised the constraints they are facing with regards to obtaining a grid connection and to the processing of planning applications. Although this was not the focus of the study, it is an important contextual detail because bottlenecks in these allied sectors are likely to have a significant impact on how many projects progress through the pipeline. This, in turn, impacts the sector’s demand for skilled workforce. Details are provided in Appendix B.
Solar project lifecycle, job roles and skills levels
Solar project lifecycle
A solar PV project lifecycle has five phases, as shown in Figure 2: equipment manufacture and distribution; project development; installation, commissioning and handover; operation and maintenance; and decommissioning. This has been developed based on the ITPEnergised experience of consulting and managing hundreds of projects for solar PV developers:
Figure 2: Solar project lifecycle
While the figure includes the first stage, equipment manufacture and distribution, this is shown for completeness only due to lack of PV manufacturing in Scotland, as discussed above.
With regards to decommissioning, this does not currently apply, since a typical solar installation has a design life of 25-30 years[3] and the solar industry in Scotland is not sufficiently mature to require skills for decommissioning. However, it is expected that some systems will be coming to end-of-life in the next ten years and decommissioning will become relevant in the timeframe to 2030. For example, the first domestic rooftop panels in the UK were installed in 1994 (Changeworks, 2024).
The project lifecycle covers both ground and rooftop solar projects, although, at a more detailed level there are some differences in the activities carried out at each stage of the lifecycle in a large ground-based project compared to a domestic rooftop. This, in turn, affects the timelines for initial feasibility and the project development stages of these project categories, as follows:
- Large ground mounted – two to three years depending on size and complexity[4].
- Commercial rooftop (average size of 50 KW) – three to six months depending on planning permission requirements[5].
- Domestic rooftop – three to six months depending on planning permission requirements21.
Job roles and skills levels
The job roles required at different project stages depend on the project size and type. Not every type of project will require every job role and the scale of the project will have a significant influence on skills requirements.
The job roles and skills levels at each stage of the project lifecycle relevant to Scotland are considered below. These have been developed based on the expertise of IPTEnergised in delivering solar PV projects for clients[6]. Inputs and validation were also provided by stakeholders consulted during this study.
Project development
A wide range of job roles are required at the early stages of the project lifecycle, see table below. The breadth of specialisms required is an indicator of the importance of this stage of the process.
|
Job role |
Skill level |
Experience |
Ground mounted |
Rooftop |
Rooftop |
|---|---|---|---|---|---|
|
Project manager |
Variable |
2 |
✓ |
✓ |
✓ |
|
Consultant – Site design and modelling |
Degree |
2 |
✓ |
✓ |
✓ |
|
Electrical engineer |
Degree |
5 |
✓ |
✓ |
✓ |
|
Consultant – Energy yield assessors and PV system specialists |
Degree |
2 |
✓ |
|
|
|
Engineering procurement and construction contractor |
Degree/Post-graduate |
5 |
✓ |
✓ |
✓ |
|
Surveyor |
Variable |
2 |
✓ |
✓ |
✓ |
|
Environmental consultant – a range of roles* |
Variable |
2-4 |
✓ | ||
|
Environmental consultant – Cultural heritage / archaeologists |
Degree |
4 |
✓ |
✓ | |
|
Structural engineer |
Degree/Post-graduate |
3 |
|
✓ |
|
|
Roofing contractor |
Variable |
1 |
|
✓ |
✓ |
|
Consultant – Transport |
Variable |
2 |
✓ |
|
|
|
Civils contractor |
Variable |
2 |
✓ |
|
|
|
Financial analyst |
Degree |
1 |
✓ |
✓ |
|
|
Planning officer |
Degree |
4 |
✓ |
✓ |
✓ |
|
Consultant – Grid connection consultancy and application |
Degree |
2 |
✓ |
✓ |
✓ |
|
DNO case worker |
Degree |
4 |
✓ |
|
|
|
Distribution network operator (DNO) Senior Authorised Person (SAPs) |
Variable |
7 |
✓ |
✓ |
|
|
Legal |
Degree |
4 |
✓ |
✓ |
|
*Different types of environmental consultants are required, including: ecological clerk of works, flood risk and drainage specialist, ornithologist, ecologist, hydro/hydrogeo/geologist/peat specialist, noise and vibration specialist, forester.
Ground mounted projects require the broadest range of job roles particularly where the potential environmental impacts of the project need to be considered. For rooftop projects, the services of a skilled structural engineer are crucial to ensure the structural integrity of the building remains intact following system installation. Project developers will, at this stage, commence engagement with the senior authorised person (SAP), a professional that is responsible for the safety of themselves and others working in high voltage areas at the relevant Distribution Network Operator (DNO). They will also engage with DNO engineers and case workers and with relevant planning authorities as required. At this stage, many of the of job roles require the achievement of tertiary education levels, as a minimum and / or a requisite number of years’ experience.
Installation, commissioning and handover
The job roles for the installation, commissioning and handover of a solar project are more focused on construction, with less reliance of specialist consultants and engineers, see Table 3. For ground mounted projects, project management is a key role, typically delivered by an engineering, procurement and construction contractor, and some on-going oversight of potential environmental impacts by an environmental consultant may be required. As before, larger projects, both ground mounted and rooftop commercial, will require ongoing engagement with DNO staff and local authority planners as required. Rooftop projects, specifically, will require an experienced roofing contractor (e.g. slater / tiler). Smaller domestic installations can, typically, be completed by a roofer and an electrician, with limited input required from other job roles.
|
Job role |
Skill/ certification level |
Experience |
Ground mounted |
Rooftop |
Rooftop |
|---|---|---|---|---|---|
|
Engineering procurement and construction contractor |
Degree/post-graduate |
5 |
✓ |
✓ |
✓ |
|
Civil engineer |
Post-graduate |
5 |
✓ |
|
|
|
Civils contractor |
Variable |
2 |
✓ |
|
|
|
Transport operative |
Variable |
5 |
✓ |
|
|
|
Crane/lifting contractor |
HNC/HND/GWO[7] |
2 |
✓ |
|
|
|
Labourer/operator (general) |
Variable |
1 |
✓ |
✓ |
✓ |
|
Back office support |
Variable |
1 |
✓ |
✓ |
✓ |
|
Health & safety officer |
HNC/HND/GWO |
3 |
✓ |
✓ |
✓ |
|
Electrician |
Variable |
2 |
✓ |
✓ |
✓ |
|
Electrical engineer |
Degree |
5 |
✓ |
✓ |
|
|
Roofing contractor |
Variable |
|
|
✓ |
✓ |
|
Environmental consultant (general) |
Variable |
2 |
✓ |
|
|
|
Grid connection installation |
HNC/HND |
5 |
✓ |
✓ |
✓ |
|
Distribution network operator (DNO) Senior Authorised Person (SAPs) |
Variable |
7 |
✓ |
✓ |
|
|
Legal |
Degree |
4 |
✓ |
✓ |
|
Operation and maintenance
The emphasis of the job roles associated with this stage of the project lifecycle include, but is not limited to adjustments, repairs, replacements, cleaning and extension of equipment life. For larger ground-based projects this will, typically, be overseen by an asset manager and may require some input from engineering, procurement and construction contractors. Other contractors will be brought in as required. Generally, the main job roles across all three types of projects will be in the electrical field (electricians and high voltage technicians) and for rooftop projects, roofers will be required. At this stage, some of the job roles require the achievement of tertiary education levels, as a minimum and / or a requisite number of years’ experience, see Table 4.
|
Job role |
Skill/ certification level |
Experience |
Ground mounted |
Rooftop |
Rooftop |
|---|---|---|---|---|---|
|
Engineering procurement and construction contractor |
Degree/post-graduate |
5 |
✓ |
|
|
|
Back office support |
Variable |
1 |
✓ |
✓ |
✓ |
|
Electrician |
Variable |
2 |
✓ |
✓ |
✓ |
|
Roofing contractor |
Variable |
1 |
|
✓ |
✓ |
|
Civils contractor |
Variable |
2 |
✓ |
✓ |
|
|
Asset manager |
Degree |
2 |
✓ |
✓ |
|
|
Crane/lifting contractor |
HNC/HND/GWO |
2 |
✓ |
|
|
|
Health & safety officer |
HNC/HND/GWO |
3 |
✓ |
✓ |
✓ |
|
High voltage technician |
Variable |
5 |
✓ |
✓ |
|
|
Logistics manager |
Variable |
1 |
✓ |
✓ |
|
|
IT manager |
Post-graduate |
2 |
✓ |
✓ |
|
|
Legal |
Degree |
4 |
✓ |
✓ |
|
Decommissioning
As discussed above, the solar industry in Scotland is not sufficiently mature for projects to have reached end of life. The job roles and skills levels required for each type of project in Table 5 are, therefore, based on expert judgement.
|
Job role |
Skill/ certification level |
Experience |
Ground mounted |
Rooftop |
Rooftop |
|---|---|---|---|---|---|
|
Civils contractor |
Variable |
2 |
✓ |
|
|
|
Crane/lifting contractor |
HNC/HND/GWO |
2 |
✓ |
|
|
|
Grid connection installation |
HNC/HND |
5 |
✓ |
✓ |
✓ |
|
Transport operative |
Variable |
5 |
✓ |
|
|
|
Back office support |
Variable |
1 |
✓ |
✓ |
✓ |
|
Health & safety officer |
HNC/HND/GWO |
3 |
✓ |
✓ |
✓ |
|
Environmental consultant (general) |
Variable |
2 |
✓ |
|
|
|
Civil engineer |
Post-graduate |
5 |
✓ |
|
|
|
Electrical engineer |
Degree |
5 |
✓ |
|
|
|
Electrician |
Variable |
2 |
✓ |
✓ |
✓ |
|
Labourer/operator (general) |
Variable |
1 |
|
✓ |
✓ |
|
Roofing contractor |
Variable |
1 |
|
✓ |
✓ |
|
Engineering procurement and construction contractor |
Degree/post-graduate |
5 |
✓ |
✓ |
✓ |
|
Legal |
Degree |
4 |
✓ |
✓ |
|
We note that legal skills may be required at all stages of project lifecycle, most typically for ground-based projects and for larger rooftop projects. This will be to satisfy the requirements for contract negotiations, land purchase, regulatory compliance, and other related legal matters.
Current and future jobs
Current and future jobs numbers by category
The current number of FTE in Scottish solar sector was 800 with the same value reported in LCREE for 2021 and 2022.
To estimate job numbers and roles for 2024-2030 we developed two modelling approaches:
- a top-down model which uses the data on the total employment in the solar sector in 2021 and the installed solar capacity in 2021, and
- a bottom-up model uses IPTEnergised simulated projects (ground-mounted, 50 MW; commercial rooftop, 1 MW; domestic rooftop, 4 KW) and their corresponding FTE requirements.
The top-down model is based on recorded historic data and is aligned with analysis for other renewables sectors. The bottom-up model allows sufficient granularity to generate predictions regarding detailed job roles, information for which is not available in the top-down modelling.
The modelling structure is presented in Figure 3.

Figure 3: Overview of the data sources, assumptions, and simulations used in the top-down and bottom-up modelling approaches.
The bottom-up model is based on a typical solar project lifecycle, associated job roles and skills levels and a hypothetical solar deployment pathway scenario for Scotland that has been developed for this project. It has not been possible to create an evidence-based deployment scenario as the pipeline of projects that would be required to achieve the proposed ambition of 4-6 GW installed capacity by 2030 does not yet exist. The FTE requirements over the period 2024 – 2030 are dependent on this hypothetical capacity deployment pathway. They could look different under a different capacity deployment scenario.
The initial outputs of the two types of modelling, including assumptions about the deployment pathway, were validated by industry and other stakeholders through interviews and a presentation of the draft study findings at a meeting of the Solar Energy Scotland (the Solar Energy UK Scottish Working Group).
Further details on modelling methodology and data sources are included in Appendix C.
Figure 4 provides an annual overview of the projected FTE requirements by project phase and project type to 2030, on basis of our top-down modelling. Both, construction and O&M activities are predicted to increase steadily throughout this timeframe.

Figure 4: Annual FTE requirements in construction and operation of solar projects, by project type
Our modelling shows demand increasing from an estimated 3,291 FTEs in 2024 to an estimated 11,150 FTE in 2030. The highest workforce demand is expected in construction, particularly for ground-mounted projects. These jobs will be a combination of permanent and temporary roles that will exist for the duration of a project.
O&M jobs will be sustained over a period of time, with staff based on site or in close proximity. A number of the construction jobs will also be permanent, albeit mobile, i.e. involving teams of construction workers moving from site to site.
Further information on how these figures have been estimated is provided in Appendix C.
Using the bottom-up modelling approach, the Table 6 shows the estimated total number of FTEs created each year and the average number of FTEs per year over the seven-year period.
|
Job Roles (combined) |
2024 |
2025 |
2026 |
2027 |
2028 |
2029 |
2030 |
Average FTE/year |
|---|---|---|---|---|---|---|---|---|
|
Civils contractor |
61 |
132 |
213 |
321 |
449 |
623 |
776 |
368 |
|
Electrician |
144 |
166 |
249 |
282 |
436 |
492 |
589 |
337 |
|
Grid connection & installation specialist |
136 |
136 |
204 |
204 |
340 |
340 |
394 |
251 |
|
Labourer /operators (general) |
132 |
132 |
198 |
198 |
330 |
330 |
383 |
243 |
|
Health & safety officer |
88 |
107 |
164 |
193 |
295 |
344 |
418 |
230 |
|
Crane/lifting contractor |
24 |
72 |
120 |
192 |
266 |
386 |
496 |
222 |
|
HV technician |
22 |
70 |
118 |
191 |
263 |
384 |
494 |
220 |
|
Roofing contractor |
114 |
119 |
173 |
180 |
286 |
298 |
342 |
216 |
|
Logistics manager |
18 |
58 |
99 |
159 |
220 |
320 |
412 |
184 |
|
EPC contractor |
101 |
111 |
151 |
170 |
249 |
259 |
229 |
181 |
|
Back office support |
35 |
48 |
73 |
93 |
136 |
168 |
206 |
108 |
|
Asset manager |
10 |
32 |
55 |
88 |
122 |
177 |
228 |
102 |
|
Electrical engineer |
46 |
49 |
69 |
74 |
115 |
117 |
118 |
84 |
|
Civil engineer |
36 |
36 |
54 |
54 |
90 |
90 |
106 |
67 |
|
IT manager |
6 |
20 |
33 |
54 |
74 |
109 |
140 |
62 |
|
Surveyor |
34 |
37 |
51 |
56 |
85 |
87 |
83 |
62 |
|
Project manager |
33 |
35 |
49 |
54 |
82 |
84 |
79 |
59 |
|
Consultant – Site design and modelling |
32 |
34 |
47 |
52 |
78 |
80 |
75 |
57 |
|
Consultant – Grid connection consult./application |
29 |
30 |
43 |
45 |
72 |
73 |
76 |
53 |
|
DNO/TO Senior Authorised Person (SAPs) |
21 |
22 |
31 |
33 |
52 |
53 |
55 |
38 |
|
Environmental consultant (general) |
19 |
19 |
29 |
29 |
48 |
48 |
57 |
35 |
|
Planning officers |
16 |
18 |
23 |
27 |
38 |
40 |
33 |
28 |
|
Transport operative |
10 |
10 |
14 |
14 |
24 |
24 |
28 |
18 |
|
Financial analyst |
6 |
8 |
9 |
12 |
14 |
16 |
7 |
10 |
|
Structural engineer |
5 |
5 |
8 |
8 |
14 |
14 |
16 |
10 |
|
Consultant – Energy yield & PV system specialists |
6 |
8 |
8 |
13 |
13 |
15 |
0 |
9 |
|
Environmental consultant – ECoW |
6 |
8 |
8 |
13 |
13 |
15 |
0 |
9 |
|
DNO case worker |
4 |
6 |
6 |
10 |
10 |
12 |
0 |
7 |
|
Consultant – Landscape & visual consultant |
3 |
3 |
4 |
4 |
7 |
7 |
8 |
5 |
|
Consultant – Transport |
3 |
4 |
4 |
6 |
6 |
7 |
0 |
4 |
|
Cultural heritage / archaeologist |
3 |
4 |
4 |
6 |
6 |
7 |
0 |
4 |
|
Environmental consultant* – specialised |
18 |
24 |
24 |
36 |
36 |
42 |
0 |
24 |
|
Total FTE per annum |
1219 |
1563 |
2337 |
2875 |
4273 |
5065 |
5848 |
|
The estimates above are subject to change as the industry experiences ongoing activities in, for example, standardisation of the application process and the rapid changes in policy and consenting processes, as highlighted during discussions with Solar Energy UK.
This modelling approach shows demand increasing from an estimated 1,219 FTEs in 2024 to an estimated 5,848 FTE in 2030.
The average number of FTEs created at the feasibility and constructions stages, over the period 2024 -2030, is estimated at around 1,900. Some of these jobs will be permanent but many will be temporary, mainly appearing during peak construction times. The average number of FTEs created at the O&M stage, over the same period is estimated at around 1,400. Most of these jobs are likely to be sustained beyond 2030.
There will be a particularly high demand for electrical specialists such as electricians, energy yield assessors and grid connection engineers, as these skills are also sought after in other areas of the energy industry. Additionally, the need for construction workers, including civil contractors, general labourers, and operators, will grow quickly to support the building of solar projects.
A detailed breakdown of the estimated job roles by project type and by stage in the project lifecycle is provided in Appendix D.
The FTE job numbers from the top-down model are consistently higher than those from the bottom-up model, although both show similar growth trends. The numbers from the top-down model could, therefore, be interpreted as the upper limit and those from the bottom-up model as the lower limit.
Details of the number of FTE for each job role to deliver 4 GW installed capacity are provided in Appendix C. For this scenario, a further breakdown of jobs into project lifecycle stages was not undertaken, as the 4 GW scenario has not been broken down into ground-mounted, commercial rooftop, and domestic rooftop projects in the way it has for the 6 GW ambition.
Limitations and uncertainties
Results should be interpreted with consideration of the model’s core assumptions, limitations and broader uncertainties in the industry.
The presented models are built on the assumption of workforce intensity per MW installed solar capacity (FTE/MW). This ratio is calculated from LCREE 2021 employment data and a combination of data sources indicating the installed capacity in 2021 (the full methodology is described in the Appendix C). All models assume that the 6 GW installed capacity will be met in 2030.
Mode limitations include the following:
- There are uncertainties associated with the underlying LCREE data, particularly for smaller sectors such as solar PV, where estimates are subject to volatility. Additionally, LCREE estimates are survey-based and gather information from a sample rather than the whole population, meaning that they are subject to sampling uncertainty.
- The top-down model is based on 2021 workforce requirements per MW to estimate future workforce needs. This was the most up to date dataset available at the time this work was undertaken. This approach does not account for potential shifts in workforce efficiency, automation, or technological breakthroughs that could impact the industry.
- The bottom-up model forecasts FTE with total forecasted FTE numbers broken down into specific job roles, acknowledging the short lifespan of some solar projects, especially commercial (< 1 year) and domestic PV (< 1 week) rooftop projects. Although the model normalises the transient jobs in terms of project duration and installed capacity, it is important to recognise that not all FTEs projected by the model will be sustained in the long-term.
- Some jobs will be realised before the start of construction, e.g. those in planning stages of a project, might be realised a year before the construction work. This is particularly relevant for ground-mounted projects. In the absence of information on how quickly different types of projects will move through the planning pipeline, we have assumed in the bottom-up model that FTEs for ground-mounted feasibility stages are created one year before the construction stage. It was not possible to do this for the top-down modelling as the underlying data is not broken down in sufficient detail.
Lastly, the model data should be interpreted in the context of broader developments and uncertainties in the sector that affect the project pipeline.
Predicting the geographical distribution of solar skills demand
Revisiting the REPD, we analysed the pipeline of solar projects awaiting construction and in planning.[8] This determines the geographical distribution of projects and, therefore, the location of the demand for skills, see Figure 5.

Figure 5: Heat map of solar projects awaiting construction and in planning.
Colour coding: yellow represents a relatively lower concentration of project numbers and red represents a relatively higher concentration of project numbers.
The REPD does not include pipeline data for domestic solar installations. It can be assumed, however, that the majority of domestic installations will be concentrated in the main population centres across the central belt of Scotland, the Borders, Dumfries and Galloway, the East and North East of Scotland and around the Inverness area. This is largely in line with the REPD data in the figure above.
Domestic rooftop installations are expected to require a workforce that is anchored in a particular geographical location, for both construction and O&M project phases, with companies delivering services to local customers. As noted above, this will be concentrated in and around the main clusters of population.
On basis of the current experience in the sector, we expect that construction, installation and commissioning of larger ground-mounted and commercial rooftop systems will require teams of workers moving from site to site around the country. These types of installations may require dedicated O&M staff but numbers are likely to be small, as described previously. The number of ground mounted systems under construction, awaiting construction or for which planning has been submitted is shown in the following figure (analysis of the REPD database – December 2023 data). The figures in brackets indicate the installed capacity in MW.

Figure 6: Number (and MW of installed capacity) of ground mounted systems under construction, awaiting construction or for which planning has been submitted, by council area.
This demonstrates that many of these projects will be located in more rural and less densely populated regions of Scotland where there is availability of land at a size appropriate for larger ground mounted systems. The solar potential of an area is also likely to be an important factor, with the East and South West of Scotland tending to have higher levels of solar potential (Global Solar Atlas, 2024). The projects that will be required to achieve 4-6 GW installed capacity do not yet exist, so it can only be assumed, at this stage, that future projects will be deployed in a similar manner in less densely populated regions.
For many of the development activities at the start of the solar PV project lifecycle, location may not be a concern, as much of this work will be desk-based and can be done from anywhere in the country and, possibly, not even in Scotland.
Solar industry skills demand
Skills challenges
To further clarify the job roles and skills that will be in demand as the industry evolves, we engaged with stakeholders as described in the sections above. One of the strongest messages from stakeholder consultations is that there are significant skills shortages at every level and across each stage of the solar project lifecycle. This was highlighted by nine of the ten stakeholders that provided input and was confirmed by members of Solar Energy Scotland when the initial report findings were presented to them. This is not, however, specific to the solar industry and is being experienced by numerous industry sectors across the UK that rely on engineers and tradespeople. One industry stakeholder noted “there are simply not enough people going into engineering[9].”
This is leading to widespread problems for companies in attracting and, importantly, retaining staff. Competition for staff is increasing and this, in turn, is driving up costs. The “brain drain” to the south-east of England was also cited by one company stakeholder as a contributing factor with people being attracted by higher salaries and a wider range of job opportunities. This was also validated by members of Solar Energy Scotland at the meeting in Glasgow in March 2024.
Some of the main skills shortages highlighted include electricians, engineers (electrical, structural and civil), roofers, ground-workers and, in general, construction workers. Six of the ten stakeholders consulted highlighted these specific disciplines. This is discussed in more detail in the context of the solar PV project lifecycle below.
Engineering skills
At the first stage of the lifecycle, project development, there is a requirement for engineers and designers that specialise in solar PV systems. Some stakeholders indicated that these are niche roles and many of the relevant degree courses (such as electrical engineering, civil and structural engineering, and architecture), college courses and apprenticeships (electricians and construction) are quite general. This means that people are coming into the industry with good, general, technical skills but do need to undergo further upskilling to meet specific requirements for solar projects. One interviewee said that “the vocational Graduate Apprenticeship Scheme needs to be broadened to include electrical engineering as the current scheme does not support it…we are crying out for this.”
Some companies in the sector (including all five of the company stakeholders consulted) are, therefore, developing these skills in-house either through on-the-job training or, in some cases, by setting up their own skills academies. Extending or modifying existing university courses and apprenticeships to allow some degree of specialisation in renewable energy technologies, including solar, could go some way to addressing this issue. There is also a strong demand for project managers as their skills are very transferable across all renewable energy sectors, not just solar. This was highlighted by one industry association stakeholder that represents companies across the renewable energy sector.
There were no specific skills shortages highlighted in relation to the construction, installation and operation of large ground-mounted solar projects other than the more general UK wide shortages of engineers and tradespeople. Large ground-mounted solar projects are often undertaken by engineering, procurement and construction companies specialising in this type of work. As the number of such projects in the UK, and especially Scotland, is low, the associated workforce tends to be mobile, moving from site to site.
Roofer skills
For both domestic and rooftop projects the chronic shortage of roofers, especially slaters and tilers, both of which are required for solar PV installation, was highlighted by more than 50% of industry stakeholders as well as an industry association consulted during this study. Furthermore, the average age of a competent roofer is over 50 with 60% of the workforce expected to retire in the next five years[10]. There are not enough people coming into the industry to cover these losses so skills shortages are expected to deteriorate. Roofing skills are, however, essential to undertake an appropriate survey, assess what is possible and install the correct brackets, fixings and panels. One industry association stakeholder commented that diversifying into the installation of solar PV would seem like a logical move for many companies but workforce shortages mean that companies are already overbooked, so the appetite for new opportunities is often limited.
Electrician skills
The other key trade required for rooftop projects is electricians and, again, skills shortages were highlighted by over 50% of the stakeholders consulted. Careful consideration needs to be given, however, when discussing skills, particularly with respect to the installation of solar PV systems in new build properties (domestic or commercial) versus retrofit. At a general level, the electrical skills for both are the same. New build projects, whether housing or commercial, tend to be managed by a lead contractor or project manager that co-ordinates and oversees all activities, including electrical work. This lead contractor should ensure that all construction workers on site have the appropriate level of training and skills required. Retrofitted systems, especially domestic, often will not be project managed and electricians, therefore, need to coordinate with other trades (e.g. roofers) and have overall responsibility for the correct and, more importantly, safe installation and operation of the system. Three company stakeholders and one industry association indicated that this is where some problems can arise, especially if electricians are not trained to appropriate standards and there is little or no oversight of the work they are doing.
Fitting of solar systems, especially in a domestic situation, is not regulated and there is no requirement for engineers or trades to achieve a specified level of training or recognised certification with stakeholders commenting that: “anyone can do it and this leads to quality problems” and that “there is no definition of what a competent installer should be able to do.”
The Microgeneration Certification Scheme (MCS) aims to address some of these issues by working with industry to define, maintain and improve standards for low carbon energy technologies, including solar PV, as well as provide a database of certified contractors. Companies can obtain certification by meeting certain standards which demonstrate their competency but there is no obligation for them to do this.
Planning and distribution network operator skills
Skills shortages in allied sectors (see Appendix B for details) were also cited by three company stakeholders, two industry association stakeholders and during the Solar Energy Scotland meeting as causing issues, which will become more severe as the number, scale and complexity of projects increases. Key job roles for which there are already widespread shortages include DNO engineers and local authority planners. A report published in 2020 (Scottish Renewables, 2020) highlighted that the number of planners employed by councils across Scotland fell by 20% between 2011 and 2020. This shortage of planners, and the resulting delays to the progression of projects that this causes was also highlighted by five of the ten stakeholders consulted, both company and industry association. Furthermore, one company stakeholder and two industry association stakeholders cited the significant shortage of DNO engineers with the required level of competency in solar PV as a major issue, particularly in Scotland where renewable energy generation is much more strongly focused on onshore and offshore wind and hydropower. Skills and competencies have, therefore, developed accordingly.
International solar industry skills strategy development
For the solar PV industry, skills demand is affected by structure of the global supply chain as well as the cross-sectoral nature of installation and maintenance requirements. In 2023, it was estimated that global solar PV employment involved nearly 4.9 million jobs (IRENA, 2023), and almost 40% of workers along the solar PV supply chain require formal training (e.g. electrical engineers and technicians), while 60% require minimal formal training (IRENA, 2021). There is a significant overlap in the skills needed with existing job roles not only across the energy sector, but also in petrochemicals, manufacturing, construction, and other sectors.
The following provides a brief overview of some of the strategies put in place internationally to support the development of the skills in the solar industry.
USA
The USA’s Solar Energy Technologies Office accelerates the advancement and deployment of solar technology to support “an equitable transition to a decarbonised economy” (US Office of Energy Efficiency and Renewable Energy, 2023). It funds solar energy research and development efforts in seven main categories, one of which is solar workforce development. According to the Solar Energy Technologies Office, the US solar workforce will need to grow from approximately 250,000 workers in 2021 to between 500,000 and 1,500,000 workers by 2035. As a result, the Office is funding a range of workforce development initiatives including online and in-person training and education programs, work-based learning opportunities, such as internships and apprenticeships, collegiate competitions, certification programs, and support services such as career counselling, mentorship, and job readiness.
To address the critical need for high-quality and locally accessible training for solar installation, the U.S. Department of Energy established the Solar Training Network (US Office of Energy Efficiency and Renewable Energy, Solar Training Network, 2023). It brings together solar industry representatives, workforce development subject matter experts, diversity group leaders, and other key industry stakeholders to develop and deliver the specialised training needed to meet the demand for skilled workers.
European Union
In May 2022, the European Commission proposed a new strategy, REPowerEU (European Commission, 2023), in response to the energy market disruption caused by Russia’s invasion of Ukraine. This includes a target to more than double solar PV capacity to reach 600 GW by 2030, up from 160 GW in 2021. One of its components, the European Solar Rooftop initiative, sets a legal obligation to install solar panels on new buildings, as well as public buildings. Under more ambitious targets of 750 GW and 1 terawatt installed capacity, that Solar Power Europe (Solar Power Europe, 2022) is advocating, solar energy employment could exceed 1 million jobs (457,000 direct + 576,000 indirect) and 1.5 million jobs respectively, as shown in Figure 7.
Figure 7: Solar sector jobs in 2030 to achieve EU installed capacity targets. Adapted from Solar Power Europe 2022
The EU is promoting employment in the solar industry through initiatives such as the Solar Works platform (Solar Power Europe, Solar Works Platform, 2023) which is a combined jobs board and course advertisement resource for those looking to enter the industry. The electrical skills sector is closely collaborating with developments in solar energy as the key element in the solar deployment value chain.
UK and Scotland
The UK British Energy Security Strategy outlines an ambition to increase the solar capacity in the UK from the current 16 GW to 70 GW by 2035 (House of Commons Library, 2023). To develop and drive forward a plan to achieve this target, a government-industry Solar Task Force has been set up. It has established four topic-specific sub-groups, one of which is focused on skills (Solar Energy UK, 2023). This will focus on the development and delivery of the skills and training needed in the solar industry in the short- and long-term.
Options for closing any current or future skills gaps
The general consensus amongst the stakeholders consulted as part of the study was that, in future, the types of skills required will remain much as they are now as the solar PV project lifecycle will, largely, remain the same. The consensus is that the current setup needs to be scaled up. A key message from all stakeholders is that more people with relevant and transferrable skills will need to be attracted into the industry at all levels and across the various job roles. It is likely that many of these individuals will require retraining or upskilling to meet the specific requirements of the solar industry. Given the growth of the sector that will be required to achieve 6 GW of installed capacity and the small size of many of the companies operating in the solar PV industry, especially domestic solar PV, some external support may be required.
Stakeholders indicated, however, that the construction industry, of which the installation of solar PV is considered to be part, is very traditional, conservative and male dominated. It is not considered to be an attractive career option for many people, especially women, despite a number of stakeholders indicating that there should be more focus on attracting women into the industry. Therefore, greater effort is needed to encourage a younger and more diverse workforce to enter the sector. These will be people coming through further and higher education systems via apprenticeships, or certificate, diploma and degree programmes. These individuals will be critical three to four years from now when installation activity will need to ramp up quickly to achieve 6 GW installed capacity. For those entering technical roles, there will be a need to ensure that existing training, apprenticeships and degree programmes are tailored, or new programmes created as appropriate, to meet the needs of the solar PV industry now and in the future. There is a need, therefore, for concerted action to increase the visibility of the sector to individuals in secondary, further and higher education. These are the people that could address potential workforce shortfalls towards the end of this decade and into the 2030s. This may require a more strategic and co-ordinated approach with industry, training providers, schools and relevant government bodies working in partnership to develop interventions to meet the forecast numbers of skilled workers.
In parallel, raising the awareness of the broad range of career opportunities, directly or indirectly associated with the solar PV sector, would be beneficial as an additional means of attracting more people, and especially young people, into the industry. A good example is the Solar Career Map developed by the USA’s Interstate Renewable Energy Council (Interstate Renewable Energy Council, 2024) which covers the broad spectrum of job roles, potential salaries and routes to career progression.
As has been highlighted previously, the UK as a whole, is suffering from engineering related skills shortages and the skills that are in demand in the solar PV sector will also be in demand from other parts of the renewable energy industry and other industries. Many of the stakeholders interviewed during this study indicated skills for solar PV cannot, therefore, be considered in isolation and that a more strategic action is required to understand the number of jobs roles that will be required to meet the targets and ambitions of relevant industries (e.g. installed capacity ambition in renewable energy and house-building targets in construction) and identify those for which there will be competing demands. This would provide a baseline on which future skills development interventions could build.
Conclusions
Based on the evidence gathered during this study, there are significant skilled workforce shortages in Scotland’s solar industry. This applies to all project lifecycle stages. The workforce currently employed in the industry has adequate skills, according to our stakeholder engagement, however, the number of people working in the industry will need to increase rapidly for the deployment of 4 to 6 GW installed capacity aspirations.
If this shortage is not resolved, the impact on the ability to achieve this installed capacity will be significant. This will be further exacerbated by increasing competition for a pool of skilled workforce that is already insufficient to meet demand from both the solar industry and other parts of the renewable energy sector as well as industry sectors, such as construction.
Specific project findings include:
- Delivering 6 GW of solar PV by 2030 could result in the number of jobs expanding from approximately 800 FTE in 2022 (LCREE data) to a maximum of just over 11,000 FTE in 2030. This includes 9,100 FTE for construction related activities, almost 82% of the workforce. Many of these jobs will be temporary and mobile, mainly appearing during peak construction times.
- Operations and maintenance jobs will increase from an estimated 184 FTE in 2024 to an estimated 2,000 FTE in 2030. These job roles are more likely to be permanent and sustained in the following years.
- The pipeline of projects to achieve 6 GW installed capacity does not yet exist, so is it not possible to state definitively the geographical locations that will have the highest additional skills demand. Based on an analysis of the current ground-mounted and commercial rooftop project pipeline (REPD 2023), Aberdeenshire, Angus, Fife and Tayside are the local authorities with the highest expected MW of installed capacity, 54% of the total, and, therefore, will be the areas with the highest demand for construction FTEs and, subsequently, for operations and maintenance FTEs.
- The growth in the number of domestic rooftop installations that will be required to meet the 1.5 GW installed capacity aspiration for this type of projects by 2030 is more likely to result in a construction, installation and maintenance workforce that is anchored in a particular geographical location, with companies delivering services to local customers. This will be concentrated in and around the main clusters of population in Scotland.
- As these skills are also sought after in other parts of the energy and other industries, there will be a particularly high demand for:
- electrical specialists like electricians: 589 FTE by 2030
- grid connection engineers: 394 FTE by 2030
- high voltage technicians: 494 by 2030
- electrical engineers: 132 FTE by 2030.
- The need for the following job roles will increase quickly to support the build of larger solar projects:
- construction workers, including civil contractors: 791 FTE by 2030
- general labourers and operators: 383 FTE by 2030,
- crane operators and lifting contractors: 496 FTE by 2030 and
- roofing contractors: 342 FTE by 2030.
These are also skills that are readily transferable to and in demand from other parts of the renewable energy sector, as well as the construction sector.
- Existing skills shortages in ‘allied sectors’ such as energy system operation, DNOs and local authority planning are causing delays to the planning, approval and construction of solar projects. A combined average of 73 FTE of these allied sector job roles will be required each year to enable solar PV project developments.
Recommendations
Actions to address skills shortages in Scotland will be essential for the success of Scotland’s solar PV industry in its aspiration to achieve 6 GW of installed capacity, as well as for the achievement of Scotland’s broader renewable energy objectives. The development and delivery of these actions should be led by industry, but will require support from and collaboration with schools, colleges, universities, training providers and relevant public sector bodies.
Based on the evidence gathered during this study the suggested actions to address skills challenges include:
- Develop strategies to raise awareness and promote the solar PV industry to attract new entrants. These should highlight the sector’s net zero and sustainability credentials and be designed for primary, secondary, further and higher education students, as well as individuals already in the workforce. These should clearly illustrate the wide range of potential career pathways for individuals at all levels of education, recognising that younger generations, in particular, are far more mobile in the workforce.
- Build on the work that is already being done by, for example, the Solar Task Force skills working group, to design and specify renewable energy and specific solar PV course content. Potential options identified during this study could include:
- a dedicated apprenticeship in renewable energy
- college and university courses such as electrical engineering and apprenticeships, such as electrician and construction, with opportunities to specialise in renewable energy and solar PV system installation.
- extension of the vocational graduate apprenticeship scheme to cover a wider range of subjects, such as electrical engineering.
References
Office for National Statistics (2021). Low Carbon and Renewable Energy Economy (LCREE) Survey. Available at https://www.ons.gov.uk/economy/environmentalaccounts/bulletins/finalestimates/2021
ClimateXChange (2024). Workforce and skills requirements in Scotland’s onshore wind industry. Available at Workforce and skills requirements in Scotland’s onshore wind industry | ClimateXChange
Department for Energy Security and Net Zero (2023). Renewable Energy Planning Database. Available at https://www.data.gov.uk/dataset/a5b0ed13-c960-49ce-b1f6-3a6bbe0db1b7/renewable-energy-planning-database-repd
The Microgeneration Certification Scheme Installations Database (2023). Available at https://certificate.microgenerationcertification.org/
Solar Energy Scotland (2023). Scotland’s fair share: Solar’s role in achieving net zero in Scotland. Available at https://solarenergyuk.org/wp-content/uploads/2021/10/1SES-Scotlands-fair-share-FINAL-PDF-Version.pdf
Scottish Parliament, Net Zero, Energy and Transport Committee (2023). Available at https://www.parliament.scot/-/media/files/committees/net-zero-energy-and-transport-committee/correspondence/2023/solar-ambition-for-scotland-28-october-2023.pdf
International Energy Agency (2023). More information available at https://www.iea.org/energy-system/renewables/solar-pv
International Energy Agency (2023). Renewables 2023 analysis and forecast to 2028. Available at https://iea.blob.core.windows.net/assets/96d66a8b-d502-476b-ba94-54ffda84cf72/Renewables_2023.pdf
International Energy Agency (2022). Special report on solar PV global supply chains. Available at https://iea.blob.core.windows.net/assets/d2ee601d-6b1a-4cd2-a0e8-db02dc64332c/SpecialReportonSolarPVGlobalSupplyChains.pdf
Scottish Land and Estates, 2023. More information available at https://www.scottishlandandestates.co.uk/helping-it-happen/case-studies
Department for Energy Security and Net Zero (2023). UK energy in brief. Available at https://assets.publishing.service.gov.uk/media/6581cb5aed3c34000d3bfbfc/UK_Energy_in_Brief_2023.pdf
M Sodhia, L Banaszeka, C Mageeb, M Rivero-Hude, “Economic lifetimes of solar panels”, 29th CIRP Life cycle engineering conference, 2022
Changeworks (2024). More information available at https://www.changeworks.org.uk/energy-advice/heat-your-home-efficiently/renewable-energy/solar-panels/#:~:text=our%20insulation%20guides.-,Solar%20panels%20in%20Scotland%3F,to%20power%20around%2090%2C000%20homes
Engineering and Technology (2023). Government urged to plug STEM skills gap at earliest school age. More information available at https://eandt.theiet.org/content/articles/2021/11/engineering-and-tech-giants-join-forces-to-stem-15bn-annual-skills-gap/#:~:text=In%20June%20this%20year%2C%20the,per%20business%20in%20the%20UK
Global Solar Atlas (2024). More information available at https://globalsolaratlas.info/map?c=56.736658,-5.705568,6&s=54.863963,-4.614258&m=site
Scottish Renewables (2020). Planning logjam ‘threatens net-zero’, renewable energy industry warns. More information available at https://www.scottishrenewables.com/news/736-planning-logjam-threatens-net-zero-renewable-energy-industry-warns
IRENA (2023). Renewable energy and jobs annual review 2023. Available at https://mc-cd8320d4-36a1-40ac-83cc-3389-cdn-endpoint.azureedge.net/-/media/Files/IRENA/Agency/Publication/2023/Sep/IRENA_Renewable_energy_and_jobs_2023.pdf?rev=4c35bf5a1222429e8f0bf932a641f818
IRENA (2021). Renewable energy and jobs annual review 2021. Available at https://www.irena.org/publications/2021/Oct/Renewable-Energy-and-Jobs-Annual-Review-2021
US Office of Energy Efficiency and Renewable Energy (2023). More information available at https://www.energy.gov/eere/solar/solar-energy-technologies-office
US Office of Energy Efficiency and Renewable Energy (2023). Solar Training Network. More information available at https://www.energy.gov/eere/solar/solar-training-network
European Commission (2023). REPowerEU sustainable energy strategy (2022). Available at https://commission.europa.eu/strategy-and-policy/priorities-2019-2024/european-green-deal/repowereu-affordable-secure-and-sustainable-energy-europe_en
Solar Power Europe (2022). More information available at https://www.solarpowereurope.org/
Solar Power Europe (2023). #SolarWorks job platform. More information available at https://www.solarworksplatform.org/nl
EuropeOn (2021). Powering green jobs growth with electrical contractors: the job potential of electric renovations and prosumer installations. Available at https://europe-on.org/wp-content/uploads/2021/07/EuropeOn_Job-Potential-Study-2021_Public.pdf
House of Commons Library (2023). Planning and solar farms. More information available at https://commonslibrary.parliament.uk/research-briefings/cdp-2023-0168/
Solar Energy UK (2023). Solar taskforce drives forward on grid access, supply chain, skills and the rooftop market. More information available at https://solarenergyuk.org/news/solar-taskforce-drives-forward-on-grid-access-supply-chain-skills-and-the-rooftop-market/
Interstate Renewable Energy Council (2024). Solar Career Map. More information available at https://www.irecsolarcareermap.org/
Local Government Associations (2023). Available at https://www.local.gov.uk/about/news/1300-clean-power-projects-permission-awaiting-construction-say-councils
National Grid (2020). Available at https://www.nationalgrid.com/document/126256/download
Scottish Government (2023). More information available at https://www.gov.scot/policies/energy-infrastructure/energy-consents/
The MJ (2023). Available at https://www.themj.co.uk/Addressing-the-great-local-government-recruitment-crisis/230614
Scottish Government, 2021). More information available at https://www.gov.scot/publications/householder-permitted-development-rights-guidance-updated-2021/pages/6/
Solar Energy UK (2024). Reported on at https://solarenergyuk.org/scottish-government-eases-planning-restrictions-for-solar-energy/
Office for National Statistics (2021). Available at https://www.ons.gov.uk/economy/environmentalaccounts/bulletins/finalestimates/2021
Department for Energy Security and Net Zero (2023). Available at https://www.gov.uk/government/statistics/solar-photovoltaics-deployment
Appendix / Appendices
Appendix A – Stakeholder consultation process
In total, ten stakeholders were consulted as part of this study to obtain their insights on current workforce needs and how they might change in the future. The organisations that provided input are shown in the table below.
|
Interviewee |
Category |
|
Emtec Energy |
Company |
|
Forster Group |
Company |
|
NFRC Scotland |
Industry Association |
|
RES Group |
Company |
|
Savills Energy |
Company |
|
Scottish Renewables |
Industry Association |
|
SELECT |
Industry Association |
|
Solar Energy UK |
Industry Association |
|
Gensource |
Company |
|
InnoSol |
Company |
The interview structure approved by the project steering group and used to guide the stakeholder discussions, is as follows:
- Lifecycle of a solar installation project: could you talk us through the typical lifecycle of a solar installation project and the key workforce needs at each stage?
- Project-specific workforce requirements: for your current and upcoming projects, what specific job roles and skills levels are a priority for you?
- Workforce composition and numbers: what does the workforce composition look like in terms of job roles and numbers for a typical solar project (rooftop installation versus ground-based project)?
- Skill level assessment: how are the skill levels required for various job roles assessed for each installation or project?
- Skills gaps: are there any skills shortages or gaps being faced by the industry currently? If yes, in which job categories and which geographic areas
- In-house training: What, if any, training is provided in-house, including existing apprenticeship programmes
- Attracting and retaining talent: if you are an employer, do you experience recruitment difficulties for any specific roles?
- Future demand for skills: what skills will be required to achieve the proposed ambition of 4-6 GW of solar capacity by 2030 and what is the likely demand for these skills (i.e. to what size will the workforce grow)? Do you predict any changes in a typical lifecycle of a solar project that would require new/different skills?
- New skills: are there any challenges or changes in the solar industry that are creating demand for new skills or new job roles?
- Competition for skills: is there competition for skills from other industries or from other parts of the UK / Europe? Is the solar industry in Scotland attracting skills from elsewhere? Are there any synergies between the workforce in solar and other sectors (e.g., electrical)?
- Skills development and training: Are universities, colleges and vocational training institutes delivering skills development and training required by the industry? What role can they play in addressing any skill gaps identified?
In addition, the draft findings of this study were presented to members of Solar Energy Scotland, the Scottish working group of Solar Energy UK, at a meeting held in Glasgow in March 2024. At this meeting, further insight into skills requirements now and in the future were provided with additional written feedback provided by email.
Appendix B – Solar Industry Context
This section explores policies and skills demands in allied sectors that will influence the development of the Scottish solar industry.
Electricity System Operation
Electricity system operation (ESO) in the UK is undergoing rapid change as it responds to an exponential increase in pressures associated with planning and operating the UK’s gas and electricity networks as the number and complexity of electricity projects increases. Anecdotal evidence suggests that the waiting time for renewable energy projects to be connected to the grid is, currently, extending into the late 2030s(Local Government Association, 2023).
Seven of the nine individual stakeholders contacted during this study highlighted that the delays to grid connection is the main bottleneck in the industry and is the one issue that is most likely to impact on the deployment of solar PV. Without a strong pipeline of projects progressing through planning and onto construction and operation, jobs will not be created.
In 2020, the National Grid estimated that across their activities, the future energy workforce requirements to 2050 will include approximately 400,000 FTE, of which 260,000 will be an additional demand (i.e. an increase in the overall workforce requirements) and 140,000 will be replacing those leaving the workforce, for example, by retiring (National Grid, 2020). Of these jobs, 48,700 will be based in Scotland. The report highlights the appetite for data, digital, and engineering skills (at technician and graduate levels). Very little has been reported, however, on the upstream skills requirements, including preparation of the regulatory documentation (e.g., Data Registration Code), review of the documentation, environmental skills and competencies, and other enablers of project compliance. Stakeholders consulted during this study, however, have highlighted the challenges being faced by companies across the renewables energy sector, not just solar PV, due to staff shortages at the National Grid and other distribution network operators. One company stakeholder commented “the biggest barrier is the grid.”
Consenting bodies
Electricity generation with a capacity exceeding 50 MW must be submitted to the Scottish Government’s Energy Consents Unit for consideration by Scottish Ministers. Those below 50 MW are authorised by the local planning authority (Scottish Government, 2023).
The REPD database (data extracted for December 2023) shows that there were only four project applications made to the Energy Consents Unit, two of which have been granted planning permission and are awaiting construction. The remaining two are still awaiting planning permission. This means that the bulk of applications must go through local planning authorities and, as far back as 2020, Scottish Renewables was highlighting a renewable energy planning ‘log jam’ that could jeopardise Scotland’s net zero targets. This issue was detailed in a report (Scottish Renewables, 2020) that concluded this issue was, in part, due to the increasing number of planning applications being submitted at the same time as a fall in the number of planners employed by councils across Scotland – 20% between 2011 and 2020 – when this Scottish Renewables report was published. Many of the stakeholders consulted during this study also highlighted this as an issue. Quotes from the interviewees include: “local authority planners are totally stretched,” and “it can take two to three months to get a response from planning and then another two to three months to get a building warrant. This has a major impact on workflows.” Councils are also known to struggle with hiring and retention of staff (The MJ, 2023).
The REPD database (December 2023) includes information relating to when planning applications are submitted and, subsequently, when planning permission is granted. For commercial rooftop projects the data shows that this ranges from four weeks to seven months with the majority being in the range two to three months, which reflects the comments made by stakeholders.
In Scotland, the installation of rooftop projects can be done under permitted development if they meet a set of rules covering minor modifications or improvements made to the outside of homes and commercial buildings. The Scottish Government has produced guidelines (Scottish Government, 2021) on householder permitted development rights and what can be built without submitting a planning application. Any domestic installations that do not meet these rules will require planning permission.
On March 28th 2024 a statutory instrument was put before the Scottish Parliament announcing new measures to help simplify the planning rules (Solar Energy UK, 2024). Amongst the most significant changes are:
- A proposal to remove the current 50 kW limit for permitted development on rooftop solar installations. Currently, any rooftop solar PV installation of 50 kW (approx. 220m2) or greater, must be subject to a full planning application.
- Solar PV installation in conservation areas can be a permitted development under certain circumstances, such as not on primary elevations or facing roads.
- Flat roof solar PV systems can be installed under permitted development provided they do not protrude more than one meter from the roof surface.
These changes are considered to be a significant step forward, streamlining the processes and making it easier to design and install solar PV systems.
Appendix C – Modelling methodology
Background
The top-down model was built using LCREE Survey estimates for the UK between 2014 and 2021 (Office for National Statistics, 2021) that provides FTE job estimates per country and per Standard Industry Classification (SIC) code in relation to the solar sector. Therefore, the solar employment in SIC D: Electricity, gas, steam and air conditioning supply was used as a proxy measure for the number of FTEs in solar project operation and installation in Scotland and SIC F: Construction to estimate the number of FTEs in construction. It is noted that SIC codes are not broken down at a Scotland level so it was assumed that the UK breakdown applies to Scotland. Using the REPD 2021, the capacity (MWelec) in construction and in operation in the solar sector for ground-mounted and commercial rooftop projects was calculated. The datasets describing the sector’s activity in 2021 were used as these were the most recent available at the time of the preparation of this report (LCREE 2022 was released in March 2024), and to allow the comparability with the parallel study focusing on the economic activity and skills requirements of the onshore wind sector (ClimateXChange, 2024). The overview of the data sources and outputs of the models are presented in the main body of the report.
The cumulative MWelec of domestic rooftop projects was estimated using the solar PV deployment database(Department for Energy Security and Net Zero, 2023) and the MCS installations database. These official data sources then yielded the core assumptions of FTE/MWelec in construction and FTE/MWelec in the operation of solar energy projects.
We used REPD data (ground-mounted and commercial rooftop) and MSC data (domestic rooftop) to estimate installed solar capacity in 2021-2023 and the assumption that 6 GW total installed capacity will be met in 2030. The capacity increase between 2023 and 2030 was proportionately divided into three fractions as follows:
- 20% in 2025-2026
- 30% in 2027-2028
- 50% in 2028-2030.
This forecast served as a hypothetical deployment pipeline as the project pipeline to achieve 6 GW of installed capacity does not yet exist. Subsequently, the FTE requirements over the period 2024 – 2030 are entirely dependent on this hypothetical capacity deployment pathway. They could look differently under a different capacity deployment scenario. To note, the prediction for installed capacity in 2024 is based on the sum of already operational projects and projects in construction in 2023.
We used the 2019-2023 REPD data as the industry’s past performance measure and the 6 GW as the assumed capacity in 2030. This was broken down as follows: 3.5 GW ground-mounted, 1.5 GW domestic rooftop, and 1 GW from commercial rooftop. In consultation with technical experts from ITPEnergised, a possible scenario for the installed capacity increase was predicted. The overall workforce requirements in construction and operation of solar projects were then calculated on an annual basis.
For the bottom-up modelling we used the in-house expertise of IPTEnergised and input provided by stakeholders to develop a jobs matrix that describes the stages of a typical solar project across the three project types (ground-mounted, commercial rooftop and domestic rooftop) in terms of FTE requirements. We then modelled how workforce requirements in each job role could increase in the context of the forecasted installed capacity.
Top-down modelling of solar capacity increase and total FTE forecast
The assumptions to top down modelling are presented in Figure 8 and described in section 11.3.1.
|
Capacity increase model |
FTE |
 |

|

|

|

|

|
Bottom-up modelling of job roles and total FTE demands
As indicated previously, conventional bottom-up modelling for the economic activity forecast in the sector is not feasible due to the fact that the projects that will enable a 6 GW deployment are not yet in the development pipeline. As a result, a typical solar project and its workforce requirements have been simulated, based on the following assumptions:
|
Type of solar panel |
Size |
Project duration |
|
Ground mounted |
50 MW |
24 months |
|
Commercial rooftop |
1 MW |
8 months |
|
Domestic rooftop |
4 kW |
3 months |
Using the in-house expertise of IPTEnergised, an established project developer, the job roles required for each project type and at each project stage of the project lifecycle were defined and an estimate made of the FTE for each job role by project type. The number of projects necessary to achieve the 3.5 GW ground-mounted, 1.5 GW domestic rooftop and 1 GW commercial rooftop capacities were calculated and the number of FTEs multiplied accordingly. In the absence of robust information on how quickly different types of projects will move through the planning pipeline, we have assumed that FTEs for ground-mounted feasibility stages are created one year before the construction stage.
Where possible, the job roles and FTE calculations were validated during the stakeholder interview process. In this way, heat maps have been created that illustrate potential workforce requirements across different project types and stages. The heatmap for 6 GW installed capacity is shown in the main body of the report. The heatmap for the 4 GW installed capacity is shown below.
|
Combined |
2024 |
2025 |
2026 |
2027 |
2028 |
2029 |
2030 |
|---|---|---|---|---|---|---|---|
|
Legal |
70 |
110 |
176 |
237 |
349 |
450 |
566 |
|
Civils contractor |
40 |
86 |
141 |
210 |
299 |
414 |
527 |
|
Electrician |
96 |
111 |
166 |
188 |
291 |
328 |
392 |
|
Grid connection installation |
91 |
91 |
136 |
136 |
227 |
227 |
263 |
|
Labourer/Operators (general) |
88 |
88 |
132 |
132 |
220 |
220 |
255 |
|
Health & safety officer |
59 |
72 |
109 |
128 |
197 |
229 |
279 |
|
Crane/lifting contractor |
16 |
48 |
80 |
128 |
177 |
257 |
330 |
|
HV Technician |
14 |
47 |
79 |
127 |
175 |
256 |
329 |
|
Roofing Contractor |
76 |
79 |
115 |
120 |
191 |
199 |
228 |
|
Logistics manager |
12 |
39 |
66 |
106 |
146 |
214 |
275 |
|
EPC contractor |
65 |
65 |
98 |
99 |
164 |
165 |
190 |
|
Back office support |
23 |
32 |
49 |
62 |
91 |
112 |
137 |
|
Asset Manager |
7 |
21 |
36 |
59 |
81 |
118 |
152 |
|
Electrical engineer |
30 |
30 |
46 |
46 |
76 |
76 |
88 |
|
Civil engineer |
24 |
24 |
36 |
36 |
60 |
60 |
71 |
|
IT manager |
4 |
13 |
22 |
36 |
50 |
72 |
93 |
|
Surveyor |
22 |
22 |
34 |
34 |
56 |
56 |
65 |
|
Project manager |
22 |
22 |
32 |
32 |
54 |
54 |
62 |
|
Consultant – Site Design and Modelling |
21 |
21 |
31 |
31 |
52 |
52 |
59 |
|
Consultant – Grid connection consult./application |
19 |
19 |
29 |
29 |
48 |
48 |
55 |
|
DNO/TO Senior Authorised Person (SAPs) |
14 |
14 |
21 |
21 |
34 |
34 |
41 |
|
Environmental consultant (general) |
13 |
13 |
19 |
19 |
32 |
32 |
38 |
|
Planning Officers |
10 |
10 |
15 |
15 |
25 |
25 |
29 |
|
Transport operative |
6 |
6 |
10 |
10 |
16 |
16 |
19 |
|
Financial Analyst |
4 |
4 |
6 |
6 |
9 |
9 |
11 |
|
Structural Engineer |
4 |
4 |
5 |
5 |
9 |
9 |
11 |
|
Consultant – Energy Yield Assessors and PVSyst specialists |
3 |
3 |
5 |
5 |
8 |
8 |
9 |
|
Environmental consultant – ECoW |
3 |
3 |
5 |
5 |
8 |
8 |
9 |
|
DNO case worker |
3 |
3 |
4 |
4 |
6 |
6 |
8 |
|
Consultant – Landscape & Visual Consultant |
2 |
2 |
3 |
3 |
5 |
5 |
5 |
|
Consultant – Transport |
2 |
2 |
2 |
2 |
4 |
4 |
5 |
|
Environmental consultant – Cultural Heritage/Archaeologists |
2 |
2 |
2 |
2 |
4 |
4 |
5 |
|
Environmental consultant – Ecologist |
2 |
2 |
2 |
2 |
4 |
4 |
5 |
|
Environmental Consultant – Flood risk and drainage |
2 |
2 |
2 |
2 |
4 |
4 |
5 |
|
Environmental consultant – Forester |
2 |
2 |
2 |
2 |
4 |
4 |
5 |
|
Environmental consultant – Hydro/Hydrogeo/Peat |
2 |
2 |
2 |
2 |
4 |
4 |
5 |
|
Environmental consultant – Noise & Vibration |
2 |
2 |
2 |
2 |
4 |
4 |
5 |
|
Environmental consultant – Ornithologist |
2 |
2 |
2 |
2 |
4 |
4 |
5 |
The full selection of heat maps by project type can be found in Appendix D. This is for 6 GW installed capacity only. As the 4 GW capacity has not been broken down by ground-mounted, commercial rooftop and domestic rooftop in the same way as the 6 GW capacity, it was not possible to undertake the same level of modelling and analysis, including modelling of one-year lag time between the realisation of FTEs associated with ground-mounted feasibility and construction stages.
Top-down and bottom-up model convergence
Two modelling approaches were developed that sought to:
- Predict the total annual FTE that could enable the delivery of 6 GW solar installed capacity in the timeframe 2024 – 2030.
- Estimate the job roles and their FTE requirements on annual basis.
The FTE job numbers calculated using the top-down modelling approach are consistently higher that the FTE job numbers calculated using the bottom-up modelling approach, although both show similar growth trends. The numbers from the top-down model could, therefore, be interpreted as the upper limit and those from the bottom-up model as the lower limit.
The breakdown into annual FTEs is shown in the figure below.

Figure 9: Workforce Requirements – Comparing the Two Modelling Approaches (FTE)
Appendix D – Workforce requirements by project type and at each stage of the project lifecycle
The following heatmaps show the number and types of jobs required annually to 2030, broken down by project type and at each stage of the project lifecycle. Decommissioning has not been included as solar systems have not yet reached this stage of the lifecycle in Scotland and it is not, therefore, possible to estimate job numbers with any certainty. As noted above, this is only possible for 6 GW capacity as the 4 GW capacity has not been broken down into the different project types.
Ground mounted projects – 6 GW installed capacity
|
Job role |
2024 |
2025 |
2026 |
2027 |
2028 |
2029 |
2030 |
|---|---|---|---|---|---|---|---|
|
Ground mounted, feasibility stage |
|
|
|
|
|
|
|
|
Project manager |
6 |
8 |
8 |
13 |
13 |
15 |
0 |
|
Consultant – Site Design and Modelling |
6 |
8 |
8 |
13 |
13 |
15 |
0 |
|
Electrical engineer |
6 |
8 |
8 |
13 |
13 |
15 |
0 |
|
Consultant – Energy Yield Assessors and PVSyst specialists |
6 |
8 |
8 |
13 |
13 |
15 |
0 |
|
EPC contractor |
22 |
32 |
32 |
51 |
51 |
60 |
0 |
|
Surveyor |
6 |
8 |
8 |
13 |
13 |
15 |
0 |
|
Environmental consultant – ECoW |
6 |
8 |
8 |
13 |
13 |
15 |
0 |
|
Environmental Consultant – Flood risk and drainage |
3 |
4 |
4 |
6 |
6 |
7 |
0 |
|
Environmental consultant – Ornithologist |
3 |
4 |
4 |
6 |
6 |
7 |
0 |
|
Environmental consultant – Ecologist |
3 |
4 |
4 |
6 |
6 |
7 |
0 |
|
Environmental consultant – Hydro/Hydrogeo/Peat |
3 |
4 |
4 |
6 |
6 |
7 |
0 |
|
Environmental consultant – Noise & Vibration |
3 |
4 |
4 |
6 |
6 |
7 |
0 |
|
Environmental consultant – Cultural Heritage/Archaeologists |
3 |
4 |
4 |
6 |
6 |
7 |
0 |
|
Environmental consultant – Forester |
3 |
4 |
4 |
6 |
6 |
7 |
0 |
|
Consultant – Transport |
3 |
4 |
4 |
6 |
6 |
7 |
0 |
|
Civils contractor |
6 |
8 |
8 |
13 |
13 |
15 |
0 |
|
Financial Analyst |
4 |
5 |
5 |
9 |
9 |
10 |
0 |
|
Planning Officers |
4 |
6 |
6 |
10 |
10 |
11 |
0 |
|
Consultant – Grid connection consultancy and application |
2 |
3 |
3 |
5 |
5 |
6 |
0 |
|
DNO case worker |
4 |
6 |
6 |
10 |
10 |
12 |
0 |
|
DNO/TO Senior Authorised Person (SAPs) |
2 |
3 |
3 |
5 |
5 |
6 |
0 |
|
Legal |
30 |
43 |
43 |
68 |
68 |
80 |
0 |
|
Ground mounted, construction | |||||||
|
EPC contractor |
4 |
4 |
6 |
6 |
10 |
10 |
11 |
|
Civil engineer |
36 |
36 |
54 |
54 |
90 |
90 |
106 |
|
Civils contractor |
24 |
24 |
36 |
36 |
60 |
60 |
71 |
|
Transport operative |
10 |
10 |
14 |
14 |
24 |
24 |
28 |
|
Crane/lifting contractor |
2 |
2 |
3 |
3 |
5 |
5 |
6 |
|
Back office support |
1 |
1 |
1 |
1 |
2 |
2 |
3 |
|
Health & safety officer |
48 |
48 |
72 |
72 |
120 |
120 |
142 |
|
Electrician |
10 |
10 |
14 |
14 |
24 |
24 |
28 |
|
Electrical engineer |
2 |
2 |
2 |
2 |
4 |
4 |
5 |
|
Environmental consultant (general) |
19 |
19 |
29 |
29 |
48 |
48 |
57 |
|
Grid connection installation |
4 |
4 |
6 |
6 |
10 |
10 |
11 |
|
DNO/TO Senior Authorised Person (SAPs) |
7 |
7 |
11 |
11 |
18 |
18 |
21 |
|
Legal |
12 |
12 |
18 |
18 |
30 |
30 |
35 |
|
Ground mounted, operational | |||||||
|
EPC contractor |
0 |
1 |
1 |
2 |
2 |
3 |
4 |
|
Back office support |
5 |
16 |
27 |
43 |
59 |
87 |
111 |
|
Electrician |
8 |
25 |
42 |
68 |
93 |
136 |
175 |
|
Civils contractor |
31 |
99 |
168 |
271 |
373 |
544 |
700 |
|
Asset Manager |
10 |
32 |
53 |
86 |
119 |
173 |
223 |
|
Crane/lifting contractor |
22 |
70 |
118 |
189 |
261 |
381 |
490 |
|
Health & safety officer |
8 |
25 |
42 |
68 |
93 |
136 |
175 |
|
HV Technician |
22 |
70 |
118 |
189 |
261 |
381 |
490 |
|
Logistics manager |
18 |
58 |
98 |
158 |
218 |
318 |
408 |
|
IT manager |
6 |
19 |
33 |
53 |
73 |
106 |
136 |
|
Legal |
27 |
87 |
147 |
237 |
327 |
476 |
613 |
Table 9: Ground mounted projects – 6 GW installed capacity scenario, FTE requirements by job role
|
Job role |
2024 |
2025 |
2026 |
2027 |
2028 |
2029 |
2030 |
|---|---|---|---|---|---|---|---|
|
Commercial rooftop, feasibility | |||||||
|
Project manager |
4 |
4 |
6 |
6 |
10 |
10 |
12 |
|
Consultant – Site Design and Modelling |
3 |
3 |
4 |
4 |
7 |
7 |
8 |
|
Electrical engineer |
5 |
5 |
8 |
8 |
14 |
14 |
16 |
|
EPC contractor |
4 |
4 |
6 |
6 |
10 |
10 |
12 |
|
Surveyor |
5 |
5 |
8 |
8 |
14 |
14 |
16 |
|
Structural Engineer |
5 |
5 |
8 |
8 |
14 |
14 |
16 |
|
Roofing Contractor |
5 |
5 |
8 |
8 |
14 |
14 |
16 |
|
Consultant – Landscape & Visual Consultant |
3 |
3 |
4 |
4 |
7 |
7 |
8 |
|
Financial Analyst |
2 |
2 |
4 |
4 |
6 |
6 |
7 |
|
Planning Officers |
2 |
2 |
3 |
3 |
5 |
5 |
6 |
|
Consultant – Grid connection consultant /application |
3 |
3 |
5 |
5 |
8 |
8 |
10 |
|
DNO/TO Senior Authorised Person (SAPs) |
3 |
3 |
5 |
5 |
8 |
8 |
10 |
|
Legal |
33 |
33 |
49 |
49 |
82 |
82 |
97 |
|
Commercial rooftop, construction | |||||||
|
EPC contractor |
4 |
4 |
6 |
6 |
10 |
10 |
12 |
|
Labourer/Operators (general) |
62 |
62 |
93 |
93 |
155 |
155 |
183 |
|
Back office support |
3 |
3 |
4 |
4 |
7 |
7 |
8 |
|
Health & safety officer |
3 |
3 |
4 |
4 |
7 |
7 |
8 |
|
Electrician |
41 |
41 |
62 |
62 |
103 |
103 |
122 |
|
Electrical engineer |
10 |
10 |
15 |
15 |
26 |
26 |
31 |
|
Grid connection installation |
62 |
62 |
93 |
93 |
155 |
155 |
183 |
|
DNO/TO Senior Authorised Person (SAPs) |
8 |
8 |
12 |
12 |
21 |
21 |
24 |
|
Legal |
7 |
7 |
10 |
10 |
17 |
17 |
20 |
|
Commercial rooftop, operations | |||||||
|
Back-office support |
0 |
0 |
0 |
1 |
1 |
1 |
2 |
|
Electrician |
0 |
0 |
1 |
1 |
2 |
3 |
4 |
|
Civils contractor |
0 |
1 |
1 |
2 |
3 |
4 |
6 |
|
Asset Manager |
0 |
1 |
1 |
2 |
3 |
4 |
6 |
|
Health & safety officer |
0 |
0 |
0 |
1 |
1 |
1 |
2 |
|
HV Technician |
0 |
0 |
1 |
1 |
2 |
3 |
4 |
|
Logistics manager |
0 |
0 |
1 |
1 |
2 |
3 |
4 |
|
IT manager |
0 |
0 |
1 |
1 |
2 |
3 |
4 |
|
Legal |
0 |
1 |
2 |
3 |
4 |
6 |
8 |
Domestic rooftop projects – 6 GW capacity
|
Job role |
2024 |
2025 |
2026 |
2027 |
2028 |
2029 |
2030 |
|---|---|---|---|---|---|---|---|
|
Domestic rooftop, feasibility |
|
|
|
|
|
|
|
|
Project manager |
23 |
23 |
35 |
35 |
59 |
59 |
66 |
|
Consultant – Site Design and Modelling |
23 |
23 |
35 |
35 |
59 |
59 |
66 |
|
Electrical engineer |
23 |
23 |
35 |
35 |
59 |
59 |
66 |
|
EPC contractor |
31 |
31 |
47 |
47 |
78 |
78 |
89 |
|
Surveyor |
23 |
23 |
35 |
35 |
59 |
59 |
66 |
|
Roofing Contractor |
23 |
23 |
35 |
35 |
59 |
59 |
66 |
|
Planning Officers |
9 |
9 |
14 |
14 |
23 |
23 |
27 |
|
Consultant – Grid connection consult./application |
23 |
23 |
35 |
35 |
59 |
59 |
66 |
|
Domestic rooftop, construction | |||||||
|
EPC contractor |
35 |
35 |
53 |
53 |
88 |
88 |
100 |
|
Back office support |
20 |
20 |
30 |
30 |
50 |
50 |
57 |
|
Health & safety officer |
23 |
23 |
35 |
35 |
59 |
59 |
66 |
|
Electrician |
70 |
70 |
105 |
105 |
176 |
176 |
199 |
|
Roofing Contractor |
70 |
70 |
105 |
105 |
176 |
176 |
199 |
|
Labourer/Operators (general) |
70 |
70 |
105 |
105 |
176 |
176 |
199 |
|
Grid connection installation |
70 |
70 |
105 |
105 |
176 |
176 |
199 |
|
Domestic rooftop, operational | |||||||
|
Back office support |
6 |
8 |
10 |
13 |
16 |
21 |
25 |
|
Electrician |
15 |
20 |
25 |
32 |
39 |
50 |
60 |
|
Health & safety officer |
6 |
8 |
10 |
13 |
16 |
21 |
25 |
|
Roofing Contractor |
15 |
20 |
25 |
32 |
39 |
50 |
60 |
© The University of Edinburgh, 2024.
Prepared by Optimat and ITPEnergised on behalf of ClimateXChange, The University of Edinburgh. All rights reserved.
While every effort is made to ensure the information in this report is accurate, no legal responsibility is accepted for any errors, omissions or misleading statements. The views expressed represent those of the author(s), and do not necessarily represent those of the host institutions or funders.
If you require the report in an alternative format such as a Word document, please contact info@climatexchange.org.uk or 0131 651 4783.
This estimate comes from data extracted from the Renewable Energy Planning Database (REPD) (Department for Energy Security and Net Zero, 2023), which covers ground-based projects and commercial roof-top installations of 100 kilowatts (KW) and above, and the Microgeneration Certification Scheme installations database (Microgeneration Certification Scheme, 2023), which covers most domestic rooftop installations. ↑
REPD states that a project that does not require planning permission has been announced by the developer. ↑
PVs will continue to generate power after the 25-30 year lifetime duration, but performance and efficiency are likely to decline (M Sodhia, L Banaszeka, C Mageeb, M Rivero-Hude, 2022) ↑
Information provided by ITPEnergised based on the company’s experience of delivering large scale ground-mounted PV solar projects ↑
Information provided by industry stakeholders involved in the installation of commercial and domestic rooftop projects consulted during this study ↑
This includes the provision of environmental and energy consulting services; solar design services for both ground and roof mounted solar PV; yield assessments and due diligence services. ↑
HNC: Higher National Certificate, HND: Higher National Diploma, GWO: Global Wind Organisation ↑
This includes projects for which the planning application was originally rejected and an appeal subsequently lodged ↑
Technical skills shortages are long-standing issues, with a shortfall of over 173,000 workers identified in science, technology, engineering and maths disciplines in 2021 (Engineering and Technology, 2023). ↑
Information provided during an interview with an industry association stakeholder consulted as part of this study. ↑
The purpose of this study was to:
- identify the range of skills needed by the onshore wind industry to increase onshore wind capacity to a minimum of 20 GW by 2030
- inform the enhancement of skills and training provision to meet future sector needs.
Researchers interviewed Scottish onshore wind stakeholders and developed a workforce model.
Findings
- To meet the 2030 ambition, the workforce serving the onshore wind sector will need to increase from around 6,900 FTE (full time equivalent) in 2024 to a peak of around 20,500 FTE in 2027. Over 90% of these roles will be in construction and installation of wind farms. These job opportunities will only be available if estimates regarding the forthcoming onshore wind project pipeline materialise.
- Overall, stakeholders felt that those working in the sector have the right skills, but there are skilled workforce shortages. In the short term, there is a need for more people to join the sector and for individuals from other sectors to be reskilled/ upskilled. Without this, the sector faces challenges in delivering new projects on time, maintaining existing wind farms and maximising economic and environmental benefits.
- Not addressing skill shortages is likely to have a severe impact on the 2030 ambition. By 2027, the model developed in this study predicts that, on average, four times more FTEs will be required for construction and installation than in 2024. Within this, five times more civil contractors will be required. More than 46% of these individuals will be required to build wind farms in Highland and Dumfries and Galloway, regions where stakeholders have highlighted is already difficult to recruit individuals. For operations and maintenance the figures are smaller and the timeframes longer: around 2.5 times as many roles will be required in 2030 than in 2024. The regions with the highest requirement, of around 37%, are again Highland and Dumfries and Galloway.
- There will be significant shortages in technical roles, particularly high voltage engineers and wind turbine technicians. Across Scotland, FTE for electricity grid connections will need to increase from 1,100 in 2024 to 4,500 in 2027, a 400% increase. The number of wind turbine technician FTE will need to increase from around 465 in 2024 to almost 1,200 in 2030, a 258% increase. These will affect project development and operations if they are not resolved.
- The scarcity of skilled planners and specialist environmental consultants is set to continue. An average of 100 FTE planners and 434 FTE environmental consultants is estimated to be required across Scotland each year to enable wind farm developments between 2024 and 2030.
- Digital skills for data analysis and drone inspections need to grow to improve turbine performance monitoring.
- There will be a need for diverse skillsets within the sector, including project management, stakeholder engagement and regulatory compliance.
If you require the report in an alternative format, such as a Word document, please contact info@climatexchange.org.uk or 0131 651 4783.