
The Scottish Government has made successive commitments to delivering a just transition to a net zero and climate resilient Scotland. The Scottish Government and others have made progress in developing monitoring and evaluation (M&E) frameworks to consider the fairness of transition processes and outcomes. However policymakers have found that these were not ready to be implemented in practice.
On behalf of the Scottish Government, ClimateXChange commissioned a research fellow, embedded in the government’s Climate Change Analysis team, to develop a just transition M&E framework that prioritises rigour and practical use.
This research is independent and should not be considered Scottish Government policy.
The framework
The proposed framework is made up of four outcomes, each with a set of indicators – Communities and Places, People and Equity, Jobs, Skills and Economic Opportunities, Environment and Biodiversity.
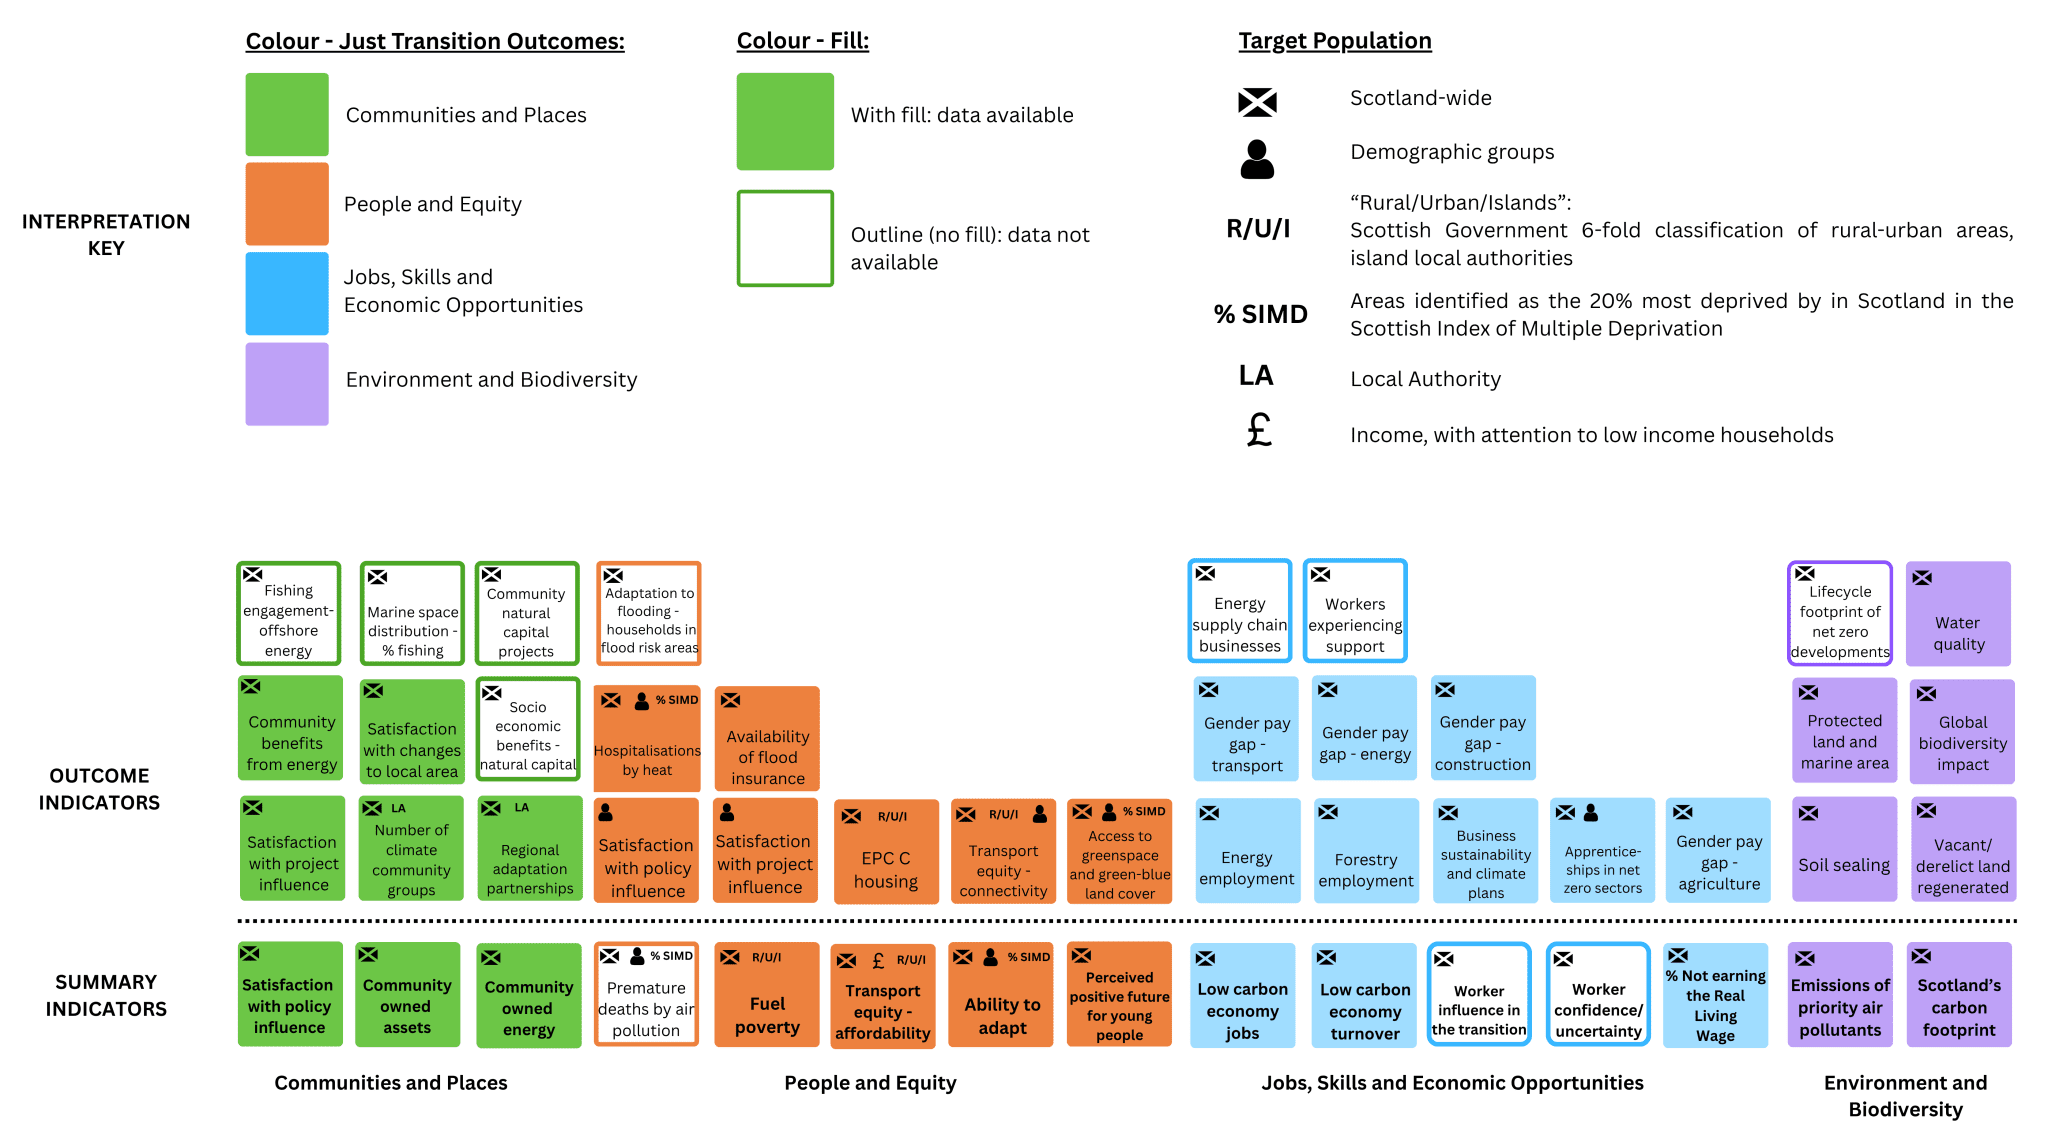
There are 50 outcome indicators in total. 15 of these are identified as summary indicators intended to provide a high-level overview of progress that can be more easily communicated than the full indicator set.
In addition to outcome indicators, this research includes 23 indicators focused on key locations, or hotspots, where the transition to a net zero and climate resilient Scotland is likely to have significant impact.
Hotspots are defined as places either experiencing significant industrial change, for example Aberdeen and Grangemouth, or hosting major net zero developments, such as Shetland and Dumfries and Galloway.
This project also examines possible anticipatory approaches for early warning identification and monitoring of hotspots, transition risks and opportunities.
The proposed framework emphasises the essential role of regular stakeholder engagement to inform all dimensions of M&E. It can be used as a tool for qualitative data collection, an approach for monitoring and indicator interpretation, a real-time tool for risk mitigation and a method for the anticipation of potential transitions.
Recommendations
The research report includes a number of recommendations to further develop the framework and just transition monitoring and evaluation. These include testing and refining through data collection, developing qualitative engagement tools, filling critical data gaps and using communications tools such as data visualisation tools to engage with external stakeholders on just transition progress.
For detailed recommendations and next steps and to learn about the development of the proposed framework, please read the report.
If you require the report in an alternative format, such as a Word document, please contact info@climatexchange.org.uk or 0131 651 4783.
Research completed March 2026
DOI: https://doi.org/10.7488/era/7089
Executive summary
Background and aims
The Scottish Government has made successive commitments to delivering a just transition to a net zero and climate resilient Scotland. As part of this, it is important to understand, as far as is practicable, the extent to which transition processes and outcomes are just. Recent years have seen proactive efforts by the Scottish Government and others to develop monitoring and evaluation (M&E) frameworks for a just transition in Scotland. These made progress but the Scottish Government found they were not yet ready to be implemented in practice.
ClimateXChange commissioned this research on behalf of the Scottish Government to deliver a proposal for a just transition M&E framework that prioritises rigour and practical applicability. The project was led by the University of Edinburgh and delivered by a ClimateXChange Research Fellow embedded in the Scottish Government.
This report is independent: it is not Scottish Government policy, nor does it reflect Scottish Government policy positions.
Results – The framework
This project developed an M&E framework for a just transition to a net zero and climate resilient Scotland, informed by a Theory of Change approach. The proposed framework is made up of four outcomes, each with a set of indicators (number of indicators in parentheses):
- Communities and Places (12),
- People and Equity (13),
- Jobs, Skills and Economic Opportunities (17),
- Environment and Biodiversity (8).
There are 50 outcome indicators in total. The framework also identifies 15 summary indicators which are selected from the 50 outcome indicators. These are intended to provide a high-level overview of progress that can be more easily communicated than the full indicator set.
Figure 1 provides an overview of outcome indicators in the M&E framework. These are categorised by outcome, target population, summary indicators and data availability. Some of the proposed indicators cannot be monitored with existing data.
In addition to outcome indicators, this framework proposes a set of 23 indicators for monitoring key sites of transition, or ‘hotspots’. Hotspots are defined as places directly impacted by industrial change or by net zero developments. This project also examines possible anticipatory approaches for early warning identification and monitoring of hotspots, transition risks and opportunities.
Stakeholder engagement is identified as fundamental for just transition M&E. It is presented as a tool for qualitative data collection, an approach for monitoring and indicator interpretation, a real-time tool for risk mitigation and a method for the anticipation of potential transitions.
Framework limitations
- Data availability, timeliness and scale: There are data gaps for some key just transition concerns. Data availability, quality and coverage also vary at local, regional and national scale. In addition, they do not always match the scale of concern (e.g., local authority data does not represent the sub-local authority Grangemouth and Falkirk towns). Most indicators are published with a time delay and will not reflect transition impacts in real time.
- Framework structure, design and development: This project provides a detailed approach to monitoring a just transition in Scotland and to interpreting outcome indicators. Further work is needed to support evaluation of why a just transition is / is not being achieved.
- The proposed M&E framework emphasises the essential role of regular stakeholder engagement to inform all dimensions of M&E. Effective stakeholder engagement in resource constrained contexts can be challenging and may limit implementation.
Recommendations for just transition M&E
- Start now: test and refine the proposed approach through data collection and indicator interpretation across outcome and hotspot indicators. This will enable an assessment of the practical applicability of the framework and its ability to capture just transition concerns in the Scottish context.
- Identify the conditions necessary for just transition delivery and develop approaches to evaluation. This will include attention to issues of governance, responsibility and policy responsiveness to just transition M&E.
- Develop qualitative engagement tools and analytical approaches as part of just transition M&E, to support the identification of transition risks, indicator interpretation and evaluation.
- Implement more integrated approaches to data collation and sharing across Scottish Government and with external stakeholders.
- Fill critical data gaps, including but not limited to (i) workforce transitions in high emitting sectors, (ii) business vulnerability and adaptation to climate change and net zero, (iii) household vulnerability and resilience to climate change and (iv) land use change implications for a just transition.
- Test and refine anticipatory uses of just transition M&E to identify and monitor sites of transition before transitions are underway. This can support the anticipation of risks and opportunities and inform responsive policymaking.
- Use M&E to improve communication with external stakeholders about transition efforts towards net zero and climate resilience, including successes and challenges. Consider the use of data management and visualisation tools such as dashboards, websites and reports for data management, communication and reporting.
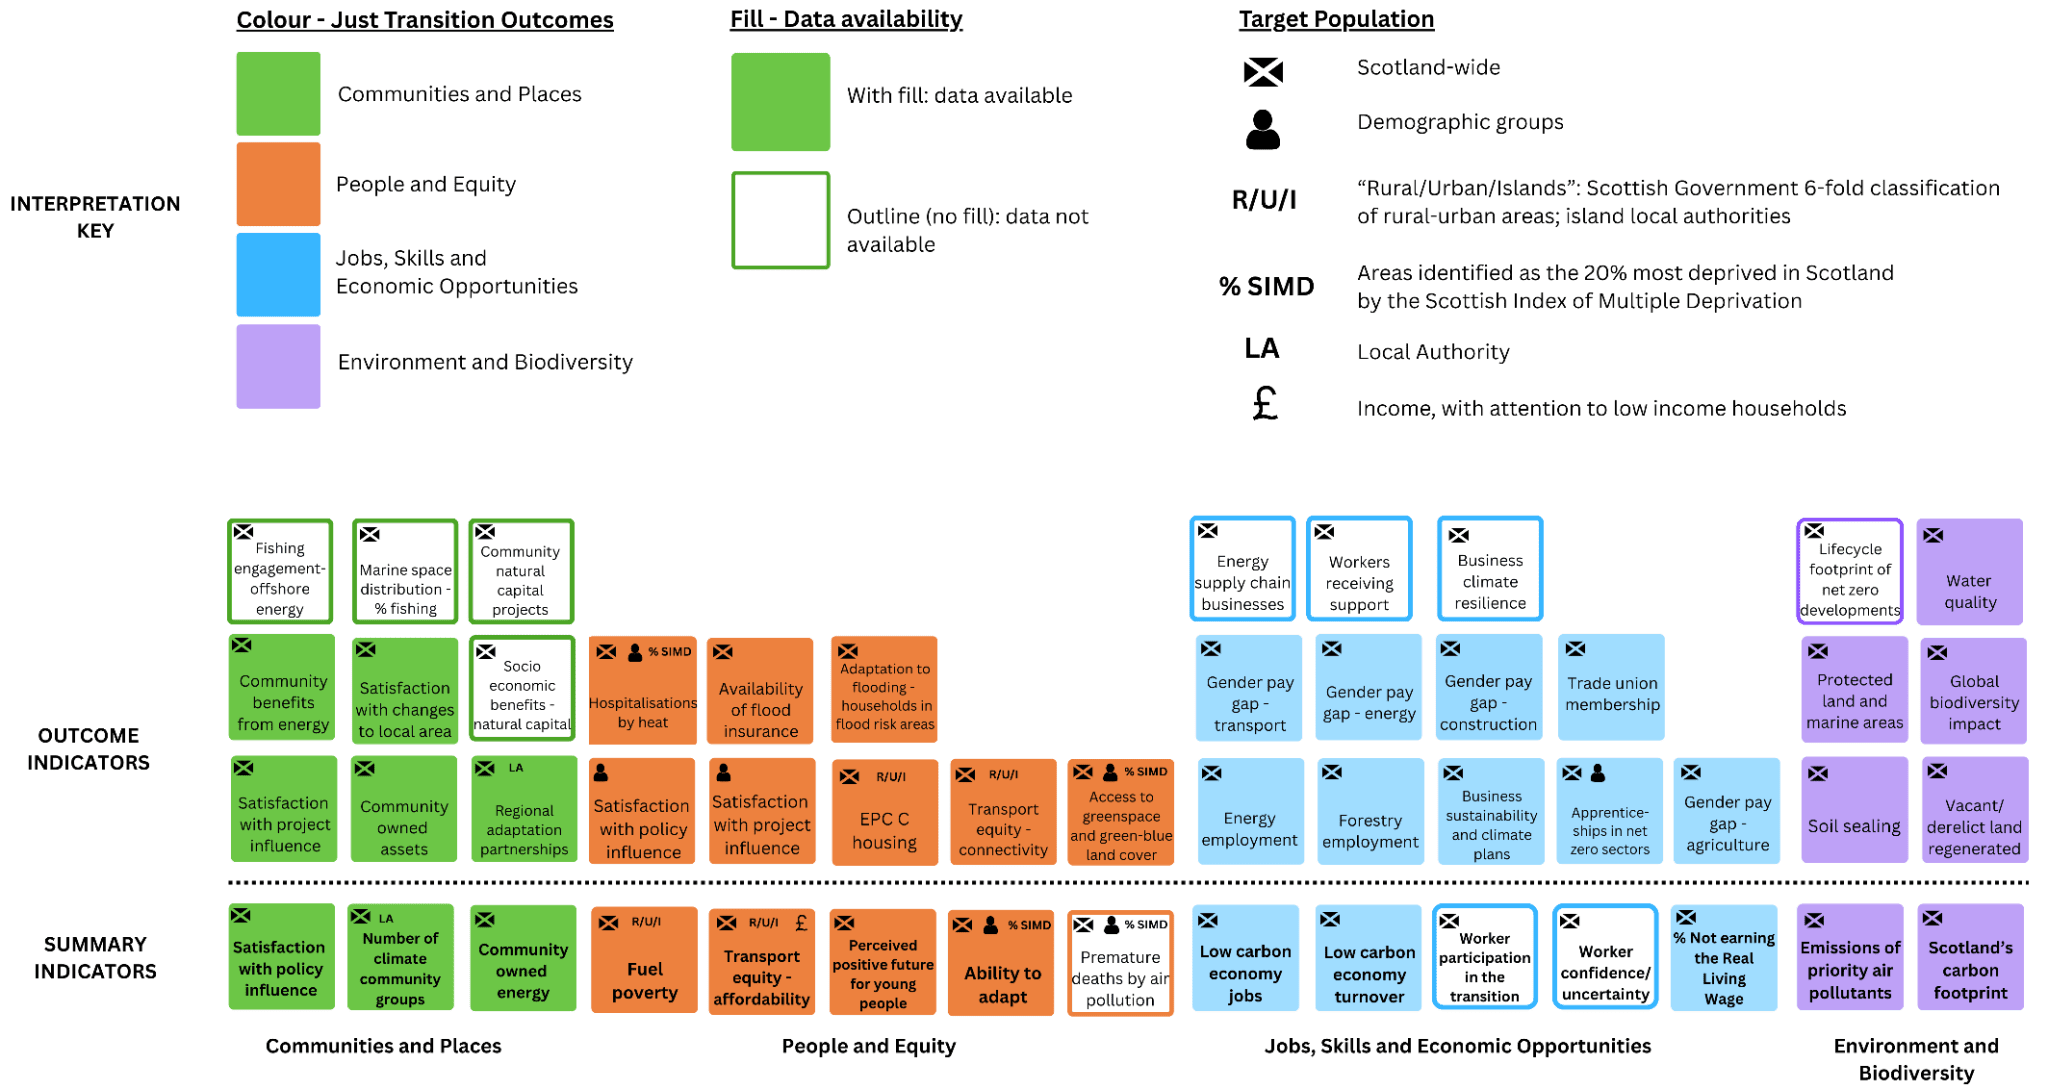
Figure 1. Outcome indicators in the just transition M&E framework. Categorised by outcome, target population, summary indicators and data availability.
Glossary
|
Just Transition |
“For the Scottish Government a just transition means becoming a net zero, climate resilient economy in a fair way that seeks to tackle inequality and injustice. Just transition is about both the outcome – a fairer, greener future for all – and the way we get there in partnership with those most likely to be impacted by the change.” (Scottish Government, 2026a, p.32) |
|
Net zero |
“A situation in which any greenhouse gas emissions put into the atmosphere are balanced out by the greenhouse gases removed from the atmosphere, so that the “net” effect is zero emissions. Scotland has committed to ‘net zero’ emissions by 2045.” (Scottish Government, 2026a, p.33) |
|
Climate resilience |
In this report, climate resilience refers to the results of adapting to a changing climate. “Adaptation to climate change involves the deliberate and systematic adjustment of systems and processes to effectively address both anticipated and actual climate change impacts.” (Scottish Government, 2026a p.32) |
|
Hotspots |
Sites of transition identified on the following basis:
|
|
Monitoring and evaluation |
A practice by which responsible actors can track, measure and assess progress towards identified goals, while analysing the degree to which implemented actions supported the delivery of said goals. |
|
Indicator |
An indicator is a specific, measurable variable which can be monitored over time, often to show trends. An indicator should support assessment of progress towards achieving overall aims. Indicators can be qualitative or quantitative and may be tracked at different timeframes (e.g. annually, biannually, every 5 years). |
Abbreviations
|
CCC |
Climate Change Committee |
|
CCP |
Climate Change Plan |
|
EU |
European Union |
|
JT |
Just Transition |
|
JTC |
Just Transition Commission |
|
M&E |
Monitoring and Evaluation |
|
NSTA |
North Sea Transition Authority |
|
SEPA |
Scottish Environmental Protection Agency |
|
SIMD |
Scottish Index of Multiple Deprivation |
|
STUC |
Scottish Trade Union Congress |
|
SNAP3 |
Scottish National Adaptation Plan 3 |
|
SPRI |
Scottish Pollutant Release Inventory |
|
ToC |
Theory of Change |
|
UK |
United Kingdom |
List of figures and tables
Figure 1. Structure and parts of the full Just Transition M&E framework. 12
Table 1: Methods used in the development of the JT M&E framework. 7
Table 2. Outcomes, M&E framework for a JT to a net zero and climate resilient Scotland. 13
Table 3: Summary indicators for the JT M&E framework. 18
Table 4: Communities and Places outcome for the JT M&E framework. 21
Table 5: People and Equity outcome for the JT M&E framework. 23
Table 6: Jobs, Skills and Economic Opportunities outcome for the JT M&E framework. 25
Table 7: Environment and Biodiversity outcome for the JT M&E framework. 27
Table 8: Hotspot indicators, by hotspot ‘type’ and data source. 36
Introduction
The Scottish Government has made successive commitments to integrating Just Transition (JT) into its policymaking processes and outcomes. JT principles were integrated into the Climate Change Act (Scottish Parliament, 2019) and the Just Transition Commission (JTC) was established with an independent scrutiny role. The Government also published a National JT Planning Framework (2021); draft sectoral JT plans for energy (Scottish Government, 2023), transport (Scottish Government, 2025a) and agriculture and land use (Scottish Government, 2025b); and the Grangemouth Industrial JT Plan (Scottish Government, 2025c). Most recently, JT indicators were included in the Climate Change Plan (CCP) published in March 2026 (Scottish Government, 2026b). The Government also committed support for a JT through the Just Transition Funds for Grangemouth and for the North East and Moray (Scottish Government, 2025c; Scottish Government, 2026c).
JT monitoring and evaluation (M&E) approaches remain in their infancy for various reasons. Defining what is captured within the scope of JT is challenging. In addition, there are difficulties in developing national-level frameworks which also reflect the experiences and needs across people and geographies. There are challenges around the temporal nature of the transition, including the ways in which responsibilities, costs and benefits are spread across generations. The transition to net zero and climate resilience also faces uncertain impacts and unintended consequences, including from unpredictable economic, geopolitical and climatic shocks. From a practical perspective, there are clear data weaknesses and gaps for JT monitoring in Scotland (e.g., Drabble et al. 2024). Finally, there are limited examples of applied frameworks for JT M&E worldwide.
Scotland is embarking on the transition to net zero and climate resilience from a baseline of inequality and existing, legacy injustices (Drabble et al. 2024). The cumulative impacts of climate change, climate adaptation and decarbonisation risk entrenching injustices and creating new ones. At the same time, the systems-wide net zero transition is also an opportunity to correct historical injustices while improving equity, wellbeing and justice in Scotland; goals aligned with the Scottish Government’s JT outcomes in the National JT Planning Framework (2021). It is essential that the Scottish Government can understand, as far as is practicable, how the transition is unfolding, and whether the associated processes and outcomes are just.
Recent years have seen proactive efforts to develop JT M&E approaches in Scotland. Research by the Just Transition Lab in Aberdeen and Aberdeenshire advanced understandings of place-based JT monitoring grounded in local priorities (Shapovalova et al. 2023). The second JTC published various place-based reports (e.g., in Shetland (Voar, 2024), Dumfries and Galloway (2025a) and Aberdeen and the North East (2025b)), showcasing the unique characteristics of net zero transitions in different parts of Scotland. The JTC also published a national JT Theory of Change (ToC) and M&E framework (Drabble et al. 2024). The latter was subsequently translated into the Grangemouth local context (Jenkins et al. 2025). While these works took JT M&E further and provided a broad overview of JT and M&E concerns, the Scottish Government found they were not yet ready to be implemented in practice.
This project was commissioned by ClimateXChange on behalf of the Scottish Government. The aim was to develop a rigorous and pragmatic JT M&E framework that could be made operational by the Scottish Government. As such, it builds on existing work and departs from it, informed by additional empirical stakeholder engagement and a review of the most recent evidence.
The project was led by the University of Edinburgh and delivered by an independent ClimateXChange Research Fellow embedded in the Scottish Government. This report sets out a proposed JT M&E framework and recommendations for JT M&E implementation for the Scottish Government. The report is independent: it not Scottish Government policy, nor does it reflect Scottish Government policy positions.
Conceptualising JT ‘Monitoring and Evaluation’
The term ‘Monitoring and Evaluation’ (M&E) encompasses a range of practices for tracking, measuring and assessing progress towards identified goals. M&E also analyses the degree to which implemented actions supported the delivery of those goals (HM Treasury, 2026; HM Treasury, 2020; Adindu, 2010; Estrella and Gaventa, 1998). The use of M&E frameworks is widespread, often to assess the impact of specific delivery programmes or interventions (e.g., Adindu, 2010).
A ‘JT’ is often not contained to a single policy or project and for some, is an overarching societal goal. Responsibilities and influence over a JT are spread across a variety of stakeholders and its achievement is often conditioned by a broader, shifting context. In this way, it can be comparable to the Sustainable Development Goals (United Nations, n.d.) or aspirational visions of national wellbeing, as reflected in Scotland’s National Performance Framework (currently archived and under revision) (Scottish Government, n.d.).
In Scotland, both Scottish Government policy (e.g., Scottish Government, 2021a) and JTC published reports (e.g., Just Transition Commission, 2024, 2025a, 2025b; Voar, 2024; Drabble et al. 2024; Jenkins et al. 2025) define the JT in expansive terms. This includes a spread of intersecting concerns including employment; community participation and empowerment; the distribution of benefits; industrial change and existing socio-economic inequalities, across scales and sectors. Further increasing complexity, the JT is characterised both as a “process” and “outcome” (Scottish Government, 2021a, p.5; e.g., Jenkins et al. 2025, p.27). So, a JT is as much about the just-ness of how the transition develops, as about the impacts it creates.
In the context of specific delivery programmes, policies or interventions, ‘monitoring’ is the “process of continuously tracking the progress and performance of an intervention, to provide data on whether it is being delivered as intended” (HM Treasury, 2026, p.72). It involves tracking specific data points over time that relate to the overall goal. The cross-cutting, multi-dimensional and multi-stakeholder nature of JT makes such an approach challenging. In the Scottish Government, many policy areas relate to, impact and condition JT delivery, from economic development through to poverty, agriculture, planning or technological development (e.g., Scottish Government, 2021a). Although there is a central JT Unit within the Scottish Government, there is no single, neatly bounded programme for JT delivery.
In a policy context, evaluation can be defined as: “a systematic assessment of the design, implementation and outcomes of an intervention. It involves understanding how an intervention is being, or has been, implemented and what effects it has, for whom and why” (HM Treasury, 2020, p.5). Evaluation is also broader, however, referring to “the process of judging or calculating the quality, importance, amount, or value of something” (Cambridge dictionary, n.d.). It is possible to evaluate what happened, how it happened and/or why it happened. These three types of evaluation are different, require different approaches and all apply in the context of assessing progress towards a JT.
This project understands ‘monitoring’ and ‘evaluation’ as interdependent practices necessary to comprehend the just-ness of the transition to net zero and climate resilience in Scotland. This interdependent approach underpins the conceptualisation and structure of the proposed JT M&E framework. Indicators were selected based on key, monitorable areas related to JT outcomes. Indicator selection was also underpinned by the framework’s evaluation objectives, based on a dual understanding of evaluation as assessing what is happening, and why. Said another way, the framework was designed to enable both an assessment of the just-ness of the transition, and an assessment of why particular impacts have come about.
The framework takes inspiration from ‘Theory of Change’ (ToC). In simple terms, ToC can be defined as “the hypothesis about the way that a program brings about its effects” (Dhillon and Vaca, 2018, p.65). ToC has been identified as a useful tool to design transformational social interventions (Simeone et al. 2023) and has been used by the Scottish Government to inform M&E frameworks for complex, multi-dimensional phenomena. Examples include the third Scottish National Adaptation Plan (SNAP3) M&E framework (Scottish Government, 2024a), and the Grangemouth Industrial JT Plan (Scottish Government, 2025c). Drabble et al. (2024) also used a ToC approach to inform their development of a JT M&E framework for Scotland.
ToC informed M&E frameworks often contain two key dimensions: outcomes and mechanisms. Outcomes are medium term goals, or ‘what success looks like’; while the mechanisms or enablers are the ‘conditions for success’ (Drabble et al. 2024, p. 42). Because mechanisms focus on the conditions for successful delivery of the outcomes, they can support evaluation of why progress is being made.
Drawing on ToC and the JT M&E framework developed by Drabble et al. (2024), the proposed M&E framework is designed to include both outcomes and mechanisms. Within this structure, this project has prioritised (a) outcome identification and refinement and (b) indicator development for monitoring. As currently developed, the framework therefore enables JT monitoring and supports evaluation of what is happening in relation to JT outcomes, but not how or why. The framework’s design enables the future integration of mechanisms to support evaluation of why JT progress is underway. This responds to the project specification to develop:
- High-level quantitative metrics for JT M&E in Scotland,
- Qualitative evaluation proposals to support indicator monitoring, including attention to place-based activity and the experiences of the most vulnerable to negative transition impacts, and
- A proposal for an integrated and practical approach to JT M&E that combines quantitative and qualitative approaches in a coherent theoretical framework.
Project methods and report structure
Methods
The methods used to inform the proposed M&E framework and related recommendations are summarised in Table 1.
|
Method |
Detail |
Purpose |
|---|---|---|
|
Policy review |
Including:
|
|
|
Literature review |
Including:
|
|
|
Semi-structured and unstructured interviews, exchanges |
With external stakeholders and public agencies (Appendix A):
Total: 16 |
|
|
Iterative engagement across Scottish Government areas |
Continuous, routine and ad hoc meetings and follow up discussions with team members across government areas. |
To support indicator development, data identification and recommendations drawing on cross-government expertise. |
|
Workshop |
In-person workshop with purposefully selected stakeholders and Scottish Government team members (held on the 17 November 2025). |
To support indicator identification and refinement across outcomes and attention to affected and vulnerable groups in the transition and climate change context. |
|
Internal sessions |
Internal sessions with Scottish Government team members responsible for the future direction and implementation of JT M&E (organised in February 2026). |
To increase JT M&E framework familiarisation within Scottish Government and inform reflections and recommendations on implementation in a policy context. |
Table 1: Methods used in the development of the JT M&E framework.
The Research Fellow was embedded within the Scottish Government Climate Change Analysis Team in close collaboration with members of the JT Unit. This enabled engagement across government teams, attendance at relevant internal webinars and workshops and direct involvement in discussions on a variety of relevant JT topics. It also informed the methods detailed in Table 1, including through access to support on policy and data identification, workshop design and facilitation, or iterative discussions on M&E framework development. A full list of interviewees, workshop attendees and areas engaged across the Scottish Government is included in Appendix A.
Report structure
Section 2 outlines the evidence reviewed, focusing on Scottish Government policy and JT M&E proposals across policy and academia worldwide. Section 3 presents the key findings from this research. Sections 3.1 and 3.2 detail the core of the proposed M&E framework including JT outcomes, indicator and data selection methods, and outcome indicators. Section 3.3 presents a ‘hotspot’ monitoring approach and indicators, integrating place-based JT M&E within a national M&E framework. It also proposes anticipatory approaches to monitoring as part of JT M&E. Section 3.4 includes detail on interpreting framework indicators. Section 4 sets out framework limitations and reflections on JT M&E. Section 5 presents a set of recommendations and concludes this report.
Evidence review
The Scottish Government published a National JT Planning Framework in 2021 (Scottish Government, 2021a). This included eight JT outcomes focused on empowering communities; skills development and fair work; addressing existing socio-economic inequality; supporting a strong and productive economy; supporting climate adaptation; protecting the environment; ensuring decarbonisation, and furthering human rights while avoiding the creation of new injustice (Scottish Government, 2021a, p.31). The Government also committed to developing sector-specific JT plans for four ‘net zero sectors’: energy (2023), transport (2025a), agriculture and land use (2025b) and buildings and construction (not yet published). In tandem, the Grangemouth Industrial JT Plan was published in 2025.
The National JT Planning Framework, draft sectoral JT plans and the Grangemouth Industrial JT Plan are structured differently and vary in detail and level of indicator development. The sectoral plans and Grangemouth industrial plan all refer to four themes which cluster JT concerns in Scotland: Communities and Places; People and Equity; Jobs Skills and Economic Opportunities, and Environment, Biodiversity and Adaptation[1][2].
In parallel, the second JTC has focused on JT M&E, including through recommendations in their Annual Report (2024) and in their final report in 2026 (Just Transition Commission, 2024, 2026a). They have published numerous JT M&E reports, including by Drabble et al. (2024) who developed a ToC for a JT in Scotland and a national JT M&E framework. The authors detailed JT priorities in the Scottish context, articulating both outcomes (what success looks like) and mechanisms (how to get there). They developed indicators, identified data sources and data gaps and provided a baseline assessment of indicator progress on a traffic light scale (improving – maintaining – declining).
The national JT M&E framework by Drabble et al. (2024) was translated into the Grangemouth local context by Jenkins et al. (2025). This reiterates the importance of place-specific transitions and accordingly, contextualised M&E. Shapovalova et al.’s (2023) work on monitoring a JT in Aberdeen and Aberdeenshire also focused on place-based transitions. Through stakeholder engagement, the authors identified four JT themes and an accompanying suite of indicators, which were analysed in relation to the local context.
The Scottish Government has also commissioned ClimateXChange projects to review and learn from the evolving JT M&E landscape and inform sectoral JT plans. These include a summary of existing approaches to JT M&E (Bergseng, 2023) and three reports by SYSTRA (2023a, 2023b, 2023c). The SYSTRA reports provide JT perspectives into sectoral areas of energy, transport and the built environment and construction.
Drawing boundaries around what is/ is not JT policy is an ongoing challenge. Climate change impacts and actions relating to the transition are cross-cutting issues, as are considerations of justice. Beyond explicit JT policy, there are various Scottish Government policy areas directly relevant to issues of JT. Illustrative examples of strategies and monitoring frameworks which overlap with JT considerations include: the National Performance Framework, the CCP (2026), the SNAP3 M&E framework (2024), the Public Engagement Strategy for Climate Change (Scottish Government, 2021b), the draft Environment Strategy (Scottish Government, 2025e), the Biodiversity Strategy M&E framework (Scottish Government, 2024b), the National Transport Strategy 2 (2020) and related M&E frameworks (Transport Scotland, 2021, 2022, 2024), the National Strategy for Economic Transformation (2022) and the Green Industrial Strategy (Scottish Government, 2024c).
Across Scottish Government JT policies, reports and related policy arenas, there is some convergence around ToC informed approaches to M&E. Most clearly, the Grangemouth Industrial JT Plan includes JT outcomes and ‘transition levers’ (the mechanisms), which capture ‘how the Just Transition will be delivered’ (Scottish Government, 2025c, p.11). In the space of climate adaptation, SNAP3’s M&E framework uses a ToC informed approach with outcomes, objectives and indicators, including a monitored annual baseline and identified climate adaptation ‘enablers’. The ToC has also been mobilised in JT M&E efforts beyond Scotland.
Beyond Scotland
Efforts to monitor and evaluate progress towards a JT are emerging worldwide. The diverse models reflect varying interpretations of the JT both conceptually and in a policy context. In the European Union (EU) context, for instance, JT M&E is proposed in relation to environmental policy (Heyen et al. 2021). The authors present a suite of output, result and impact indicators including measures linked to EU social domains and environmental impacts. More broadly, the EU defines ‘JT regions’ as carbon intensive regions currently supported by the Just Transition Fund (EU, 2024). This contrasts with the more expansive understanding of JT by the Scottish Government.
Kelly et al. (2025) developed a JT M&E approach for the Irish government based on JT ‘domains’. These are broadly sector-oriented (electricity; agriculture and land use; buildings; transport and connectivity, and environment) along with two cross-sectoral domains: skills and employment, and participation and community engagement. The sectoral approach echoes sectoral JT plans under development in Scotland. In Kelly et al. (2025), these are integrated into the core structure for a nation-wide JT monitoring framework for Ireland. The framework is funded by the Environment Protection Agency and sits in relation to environmental policy, as per the EU.
The Spanish Government’s understanding of JT is primarily focused on economic and employment aspects of the transition, alongside additional social concerns (Spanish Government, 2020). In addition, Spain takes an ‘at-risk area first’ approach to JT, which prioritises attention to declining coal and emissions-intensive dependent regions through the implementation of place-based ‘Just Transition Agreements’ (Spanish Government, 2020). From an M&E angle, Spain has been reporting on JT progress for circa five years. Their monitoring and reporting approach is output oriented and focuses primarily on whether policy commitments have been delivered (yes/no), and on data such as the amount of funds invested into different projects (Spanish Government, n.d.). There is lesser attention to Spain’s progress towards a JT overall from an outcome-oriented perspective. Their reports provide detailed, qualitative case studies about place-based ‘Just Transition Agreements’ implementation and delivery (Spanish Government, 2023).
Although not specifically a JT framework, the National Wellbeing Framework for Wales provides an applied example of monitoring multi-dimensional, complex phenomena on an outcome basis, as it has been reported against since 2017[3]. This framework is made up of seven high-level goals (or outcomes) and identifies a suite of 50 indicators which map across the different goals. In this framework, a single indicator may be used to monitor progress across various goals. From these 50 indicators, 16 are selected as milestone indicators to provide a high-level overview of how Wales is doing in relation to wellbeing goals (Welsh Government, 2022a, 2022b). The cross-cutting approach to indicator relevance, along with framework visualisations and reporting experience make this a useful example for JT M&E framework development.
The Taranaki region in New Zealand used a ToC approach to identify JT outcomes for a vision of Taranaki in 2050 (Venture Taranaki, 2020). This framework includes monitoring, causality analysis, policy tracking and evaluation. It is conceptualised in detail but appears at an early stage of implementation, with limited indicator development. Tarfa et al.’s (2024) Monitoring, Reporting and Verification framework for a Just and Gender Inclusive Transition in Nigeria also used a ToC approach. The authors present an overarching JT goal, a vision and eight high-level outcomes, the latter of which are broken down into actions, intermediate outcomes and ultimate outcomes. Indicators cover environmental dimensions like emissions or chemical spillage and pollution, and social dimensions ranging from positive community impacts, reducing social inequalities or the redistribution of oil and gas revenues to social projects.
The Monitoring, Evaluation and Learning framework for tracking a JT in South Africa (ICAT, 2024) is also grounded in a ToC. The authors include restorative justice, procedural justice and distributive justice as underpinning their understanding of JT. This framework incorporates enabling conditions, outputs, milestones and outcomes through which to reach overall JT impact. It identifies 54 priority indicators across these categories. Outcome indicators are focused on fossil fuel consumption, emissions reductions, training and employment creation, and participation measures, at times reporting at smaller geographical levels or by demographic groups.
Research by Oliver et al. (2025) into JT M&E in the Welsh context offers a different approach to ToC and outcome-based frameworks. Drawing on concepts of resilience and vulnerability, the authors identify what would affect a person’s ability to prepare for, respond to, benefit from, and recover from different climate change policies and scenarios. On this basis, they conceptualise a composite, weighted vulnerability index focused on vulnerability to climate change mitigation and rank Welsh local authorities accordingly.
JT M&E has also been explored in academia, often in collaboration with policy or industry. Examples include Htitich et al.’s (2024) methodology for developing a Just Transition Score tool in collaboration with the Social Progress Index, or Kelly et al.’s (2020) composite indicator to identify households at risk of energy poverty. From a policy development and evaluation perspective, Bird et al. (2024) developed a tool to assess ‘Just Energy Transition Plans’, while Kaljonen et al. (2024) set out an approach to combine policy mixes to support JT delivery. McCauley et al. (2023) suggested a JT ranking method through a suite of indicators which they related to theoretical justice tenets. Live, industry-based examples of JT monitoring include the World Wildlife Fund’s tool and scorecard to rank national JT plans (World Wildlife Fund, n.d.); the World Benchmarking Alliance’s JT Methodology (2025) which uses a ‘scoring and weighting’ approach that provides a very high-level numerical score on JT; or the Transition Plan Taskforce’s (2024) review of 13 existing disclosure frameworks that are relevant to transition planning and disclosures.
Summary
The evidence reviewed illustrates a variety of approaches, models and frameworks for JT M&E. These emphasise the use of overarching goals/aims/outcomes, and the different types of monitoring approaches available. Monitoring may be focused on outcome/impact, policy delivery or output tracking. Justice theory (e.g. Heyen et al. 2021; Kelly et al. 2025) and conceptual structures like the ToC explicitly and implicitly underpin several of the reviewed examples. Others, like Oliver et al. (2025), take a composite index approach instead.
Various sources highlight the importance of quality data gathering and indicator development (e.g. Kelly et al. 2025; Tarfa et al. 2024) along with attention to demographic data breakdowns and to the distributional implications of the transition (e.g. Hayen et al. 2021; Oliver et al. 2025; Kelly et al. 2025). The evidence also emphasises the value of M&E and reporting for communication with stakeholders (e.g., ICAT, 2024). In this vein, Kelly et al. (2025, p.25) also recommend the development of a dashboard as a ‘suitable destination framework for communicating and presenting indicators and trends’.
Various reports also refer to the dynamic nature of climate change and the transition. They emphasise the importance of reviewing JT M&E frameworks alongside broader contextual trends over time (e.g., ICAT, 2024). Reports also stress the importance of harnessing an M&E framework and tools for prospective analysis (Oliver et al. 2025), equipping JT M&E and policy with foresight – or anticipatory – capacity (Kelly et al. 2025). This includes anticipatory attention to key ‘at risk’ areas (e.g. Hayen et al. 2021; Spain, 2024; Lázaro Touza et al. 2025).
The Framework
The full structure of the proposed M&E framework (‘the framework’) is illustrated in Figure 1. The objectives of the framework, informed by the evidence, Scottish Government and stakeholder input are to:
- Monitor impacts of the transition across Scotland and provide a stocktake of how Scotland is doing from the perspective of justice,
- Support policy tracing and causality evaluation across mechanisms and policies, in relation to JT outcomes,
- Support anticipation of risks and opportunities of the transition before they happen, including in ‘hotspot’ areas,
- Through the three objectives detailed above, inform policy development,
- Communicate progress in relation to a JT, to (i) hold the government to account and (ii) improve communication of the impacts of the transition.
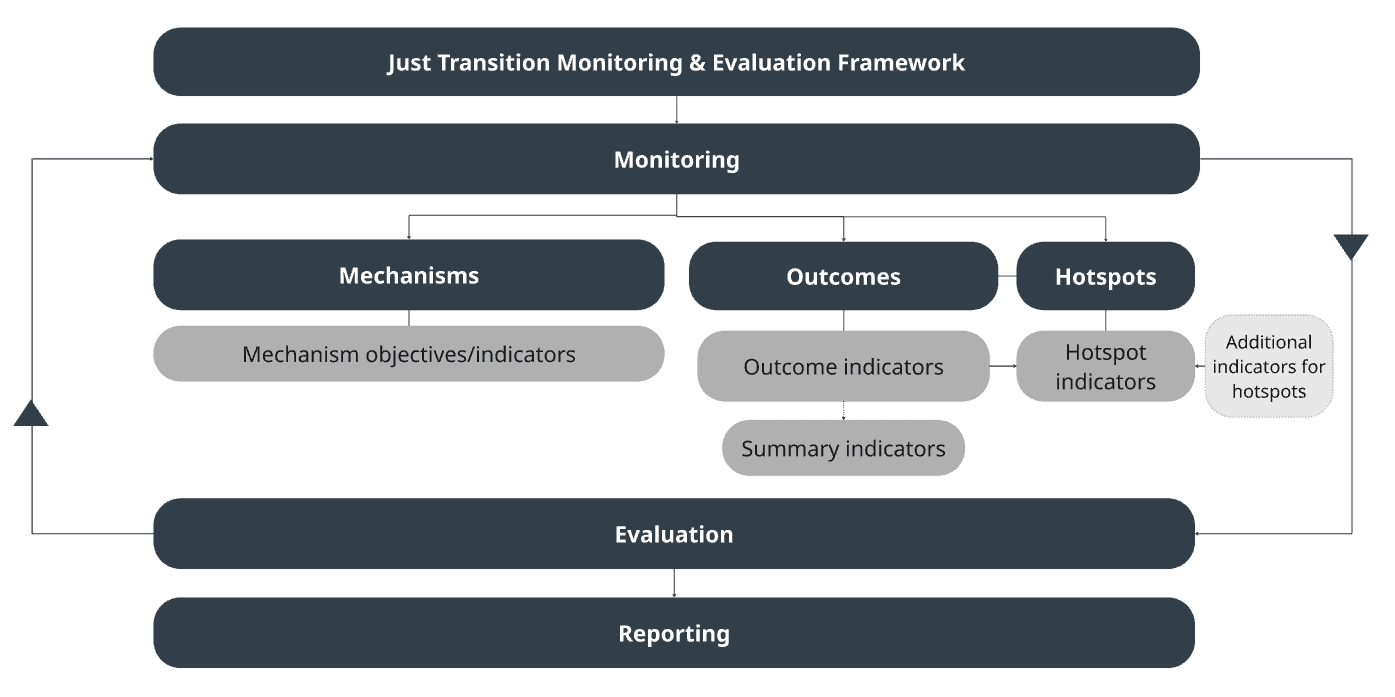
Figure 1. Structure and parts of the full Just Transition M&E framework.
As illustrated in Figure 1, the framework structure is informed by a ToC approach and includes both outcomes and mechanisms, as well as hotspots. Hotspots are defined as places directly impacted by industrial change or by net zero developments, further detailed in section 3.3.
The remainder of this section focuses on outcomes, hotspots and their indicators, as outlined in section 1.1. Section 3.1 details outcome development, followed by outcome indicators in 3.2. Section 3.3 presents the hotspots approach, anticipatory methodologies for hotspot identification and hotspot indicators, followed by recommendations for indicator interpretation in Section 3.4.
Outcomes
This project understands outcomes as ‘what success looks like’ or what characterises a JT in the Scottish context. Within JT policy in Scotland, the definitions and language surrounding JT (and JT M&E) have iteratively evolved since the publication of the National JT Framework in 2021. There have been varying definitions of what outcomes embody a JT in Scotland and for the Scottish Government, and there are arguably inconsistencies. The Scottish Government’s draft sectoral JT plans, for instance, do not refer to the eight outcomes in the National JT Framework (2021)[4]; and neither does the JT section within the CCP (2026). Draft sectoral JT plans, the Grangemouth Industrial JT Plan and the Draft CCP (2025) all refer to four themes: Communities and Places; People and Equity; Jobs, Skills and Economic Opportunities and Environment, Biodiversity and Adaptation. These themes are described as relating to, or grouping JT outcomes (e.g., Scottish Government, 2023; Scottish Government, 2025a)[5].
This project reviewed and mapped references to outcomes, outcome clusters, proxy outcomes, objectives, themes and priority areas (whichever way defined) within existing JT publications by the Scottish Government and in Drabble et al. (2024). Appendix B summarises the terminology and categorisations used in the documents reviewed. This highlighted clear convergence in JT policy and Drabble et al. (2024) around the four themes outlined above. On this basis, this project developed a refined set of four overarching outcomes characterising a JT to a net zero and climate resilient Scotland. These are named according to the four themes and are introduced in Table 2.
The four outcomes below synthesise the key JT areas of concern in Scotland. They were identified and refined based on the evidence review, stakeholder feedback and internal engagement with Scottish Government teams.
|
Outcomes |
|
Communities and Places: The transition to net zero and climate resilience increases agency, social cohesion and community wealth across Scotland through collaboration, empowerment and socio-economic benefit. |
|
People and Equity: The transition to net zero and climate resilience addresses existing inequalities across Scotland and avoids creating new ones, supporting a more equal society overall. |
|
Jobs, Skills and Economic Opportunities: Scotland ensures a managed transition away from high-emissions industries and practices and delivers a diversified, prosperous and climate resilient economy grounded in worker participation, fair work, skills development and thriving business. |
|
Environment and Biodiversity: Through the transition to net zero and climate resilience, Scotland acts within planetary boundaries and restores the natural environment for current and future generations of people and planet. |
Table 2. Outcomes, M&E framework for a JT to a net zero and climate resilient Scotland.
There is inevitable overlap across outcomes. In this framework they are positioned in relation to each other and with no hierarchy (Figure 2). At the same time, each outcome signifies a distinct focus area which enables the thematic grouping of certain indicators per outcome (for a similar approach, see Shapovalova et al. (2023)).
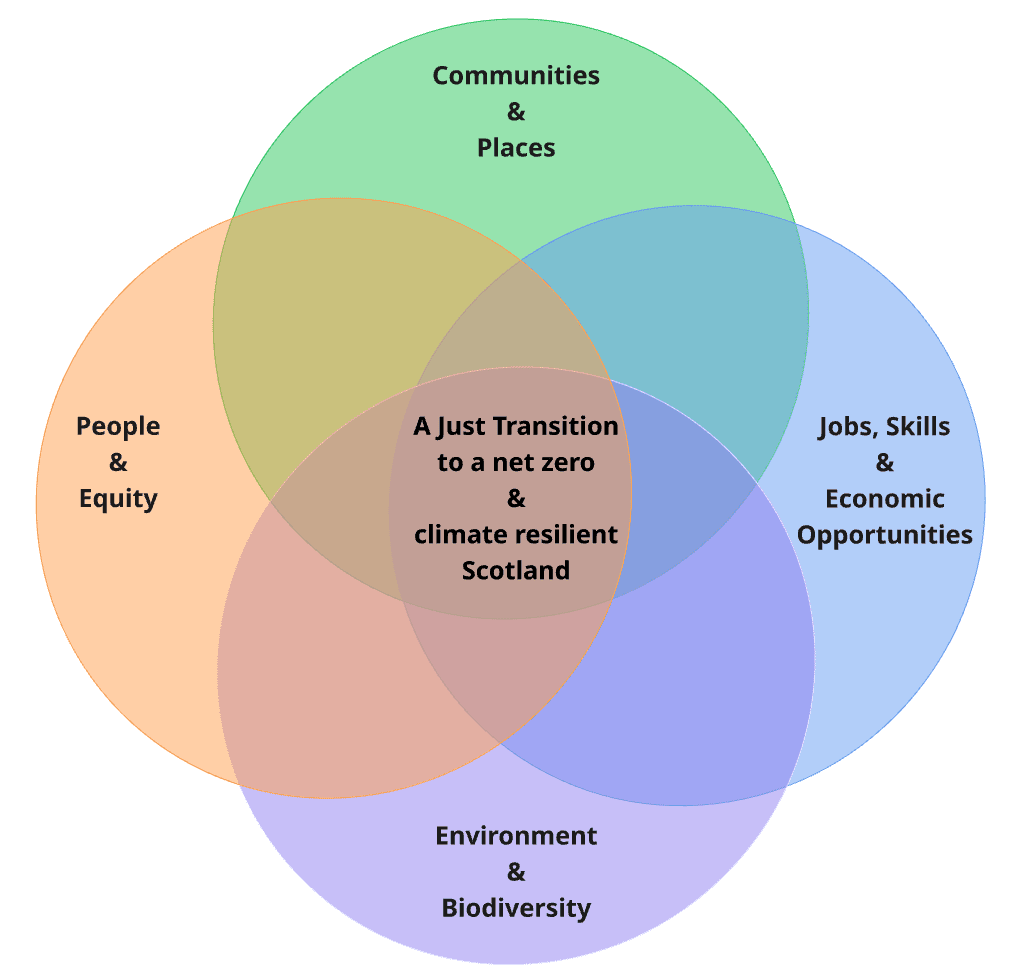
Figure 2. Visualisation of the four outcomes of a JT to a net zero and climate resilient Scotland.
Outcome indicators
Figure 3 provides a visual overview of proposed outcome indicators grouped by outcome, including their target populations for data monitoring. It also signposts the summary indicators (intended to provide a high-level overview of the transition), and identifies the indicators with no data currently available. The remainder of this section presents the indicator development approach followed by an overview of summary indicators and outcome indicators. Additional information on indicators including their desired trend, data timeframes and a quality assessment can be found in Appendix C.
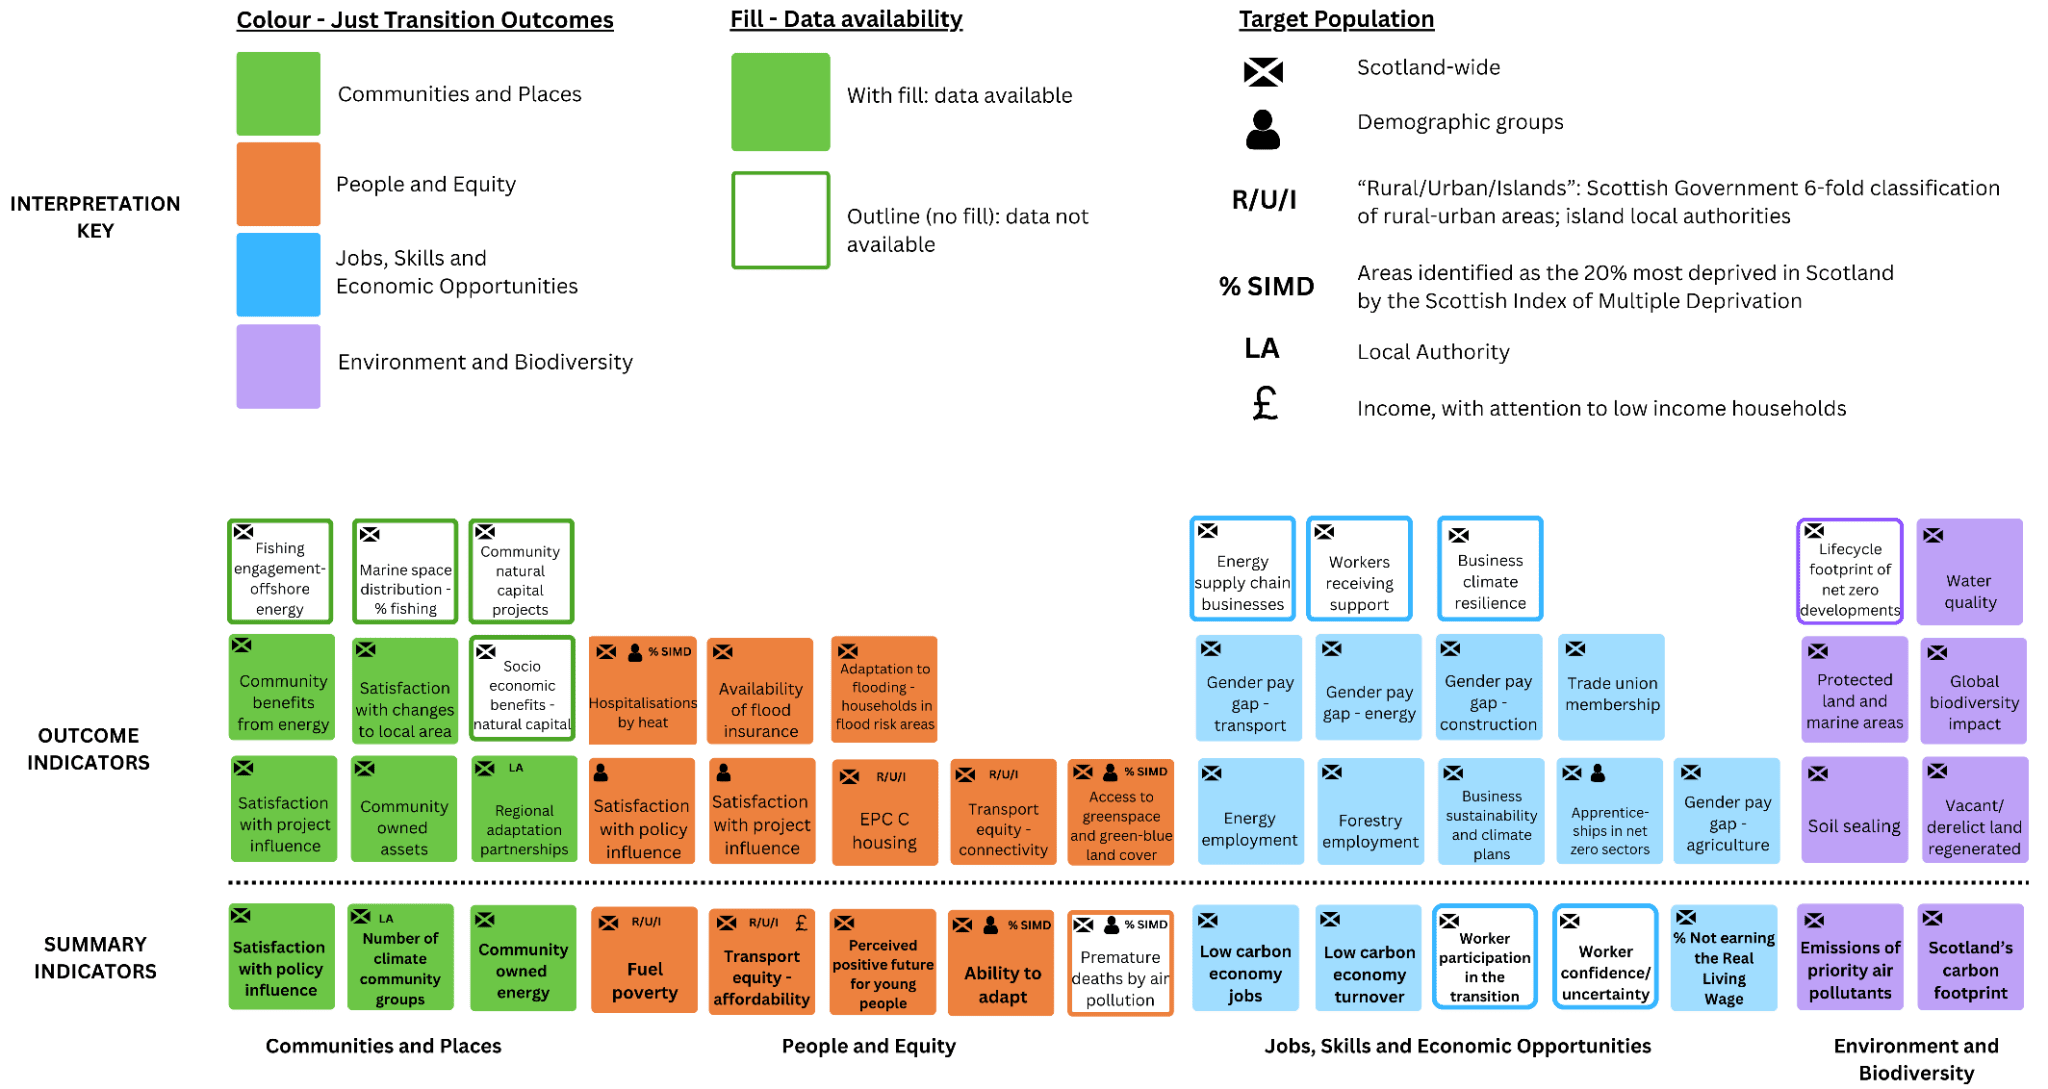
Figure 3. Outcome indicators in the JT M&E framework. Categorised by outcome, target population, summary indicators and data availability.
Indicator development and data selection
Indicator selection was guided by the following priorities: conceptual rigour, relevance and representativeness of a JT in Scotland, data availability, timeliness and responsiveness to the project specification.
Drawing on the evidence review, outcomes were defined first. This established high level JT priorities in the Scottish context. A long list of indicators was developed from policy, reports and academic literature, with attention to their relevance across the four outcomes. This list was complemented with stakeholder input. The workshop and semi-structured interviews were specifically designed to focus on indicator development. To support discussions during these engagements, the four outcomes were sub-divided into descriptive focus areas (available in Appendix D). Informal conversations and meetings with external stakeholders and the Scottish Government further informed indicator development and data identification. The indicator long list was queried and refined to merge, move and remove indicators based on relevance and data availability[6]. Full indicator details and a quality assessment can be found in Appendix C. Further detail on the indicator selection process is available upon request.
The final list of indicators was also informed by data availability. The search for available data involved desk-based research and stakeholder engagement across government teams and with external stakeholders. Tables 1, 2 and 3 in Appendix A summarise the stakeholders and different government areas engaged throughout. Drawing on Taranaki Venture (2020) and SNAP3 (Scottish Government, 2024a), criteria influencing indicator development and data selection included:
- Relevance to the outcomes to be measured,
- Timeliness,
- Sample sizes for Scotland (when data is collected at UK scale),
- Possible breakdowns by socio-economic and geographic scales (where relevant),
- Data availability and accessibility.
Reporting for most indicators is recommended at a ‘Scotland-wide’ target population level. Additional target populations are included for some indicators based on an understanding of their relevance for specific geographies or groups. Target populations for data monitoring (relevant across all outcomes and indicator tables) include:
- Scotland-wide: Data for Scotland as a whole,
- Demographic groups: Age, sex, gender, ethnicity, disability, income (as relevant/ available per data source),
- Scottish Index of Multiple Deprivation (SIMD): By SIMD percentile (e.g., locations identified as the 20% most deprived areas of Scotland) (SIMD, 2020),
- 6-fold urban-rural classification and islands: Geographical data breakdown according to the Scottish Government’s Urban Rural Classification. This distinguishes between large urban areas, other urban areas, accessible small towns, remote small towns, accessible rural and remote rural areas (Scottish Government, 2024d). Alongside the rural-urban classification, this target population group includes monitoring islands separately,
- Local Authorities as relevant to the indicator.
Data identification and indicator refinement were undertaken simultaneously. Efforts focused on identifying indicators where data was readily available, to ensure the feasible implementation of the framework and avoid further delays to JT monitoring. The framework also includes some indicators for which data is currently not available, yet which cover key JT areas of concern. Possibilities for indicator refinement and data collection were also explored for these indicators, the details of which can be found in Appendix E.
Finally, indicators within the framework both draw on and at times, depart from existing Scottish Government JT M&E publications. Appendix F details the parallels and differences between this framework and in particular, JT indicators in the CCP (2026).
Summary indicators
The proposed 15 summary indicators provide a high-level overview of the just-ness of Scotland’s transition across the four JT outcomes. As a small set of indicators, they offer cross-cutting insight into the JT. This may also be useful at reporting stage and for JT communication with internal and external stakeholders.
Summary indicators are selected from across the four outcomes and should be reported on at a Scotland-wide level. Additional reporting by demographic groups is also recommended for three indicators in the list: those about policy influence, opportunities for young people in Scotland and about individuals’ ability to adapt to climate change. These three indicators are selected as proxies for issues of participation, recognition and distribution of impacts and opportunities across groups in Scotland, today and in the future. Table 3 sets out the proposed 15 summary indicators.
|
Outcome |
Summary Indicator (all reported on at Scotland-wide level) |
Target population |
|
Communities and Places: The transition to net zero and climate resilience increases agency, social cohesion and community wealth across Scotland through collaboration, empowerment and socio-economic benefit. |
Proportion of people in Scotland reporting satisfaction with opportunities to influence (i) the Scottish Government’s approach to delivering net zero, and (ii) local policy and planning decisions relating to net zero |
Demographic groups |
|
Number of community groups involved in climate action/sustainability activities, as recorded by the Climate Action Hubs (and case studies). | ||
|
Operational capacity of community and locally owned energy installations in Scotland. Include breakdown (i) by type of ownership (ii) by location and (iii) as a proportion of total renewable energy installed (that year/ overall). | ||
|
People and Equity: The transition to net zero and climate resilience addresses existing inequalities across Scotland and avoids creating new ones, supporting a more equal society overall. |
Percentage of dwellings in Fuel Poverty | |
|
Percentage of people reporting that they can afford their individual transport costs | ||
|
Proportion of people who agree that the transition to net zero and climate resilience will support a more positive future for young people and future generations in Scotland |
Demographic groups | |
|
Level of adaptation action being taken by people in Scotland |
Demographic groups | |
|
Premature deaths due to exposure to fine particulate matter (PM2.5) |
Demographic groups | |
|
Jobs Skills and Economic Opportunities: Scotland ensures a managed transition away from high-emissions industries and practices and delivers a diversified, prosperous and climate resilient economy grounded in worker participation, fair work, skills development and thriving business. |
Employment (full-time equivalent) in the low carbon and renewable energy economy (LCREE) in Scotland | |
|
Low Carbon and Renewable Energy Economy (LCREE) estimated direct and indirect turnover | ||
|
High emitting industry worker participation in decisions affecting them |
| |
|
Sense of uncertainty/ confidence in the transition amongst workers in high emitting industries | ||
|
Proportion (%) of employees earning less than the Real Living Wage | ||
|
Environment and Biodiversity: Through the transition to net zero and climate resilience, Scotland acts within planetary boundaries and restores the natural environment for current and future generations of people and planet. |
Emissions of the eight priority Air Quality pollutants (ammonia, carbon monoxide, nitrogen oxides, non-methane volatile organic compounds, particulate matter, sulphur dioxide and lead) for Scotland | |
|
Scotland’s carbon footprint expressed in million tonnes of carbon dioxide equivalent per year |
Table 3: Summary indicators for the JT M&E framework.
Communities and Places
Table 4 provides an overview of proposed indicators to monitor progress towards the Communities and Places (CP) outcome. This table includes indicator number, indicator, target population (which may include more than one population, indicated as ‘population #2, population #3’) and the data source. Indicators with no currently available data are clustered at the end of the table (CP 9-12). Summary indicators are marked with an asterisk in the CP column (e.g., CP1*). The same approach is used for all outcome tables presented in Sections 3.2.3 – 3.2.6.
|
Communities and Places (CP) | ||||
|
CP |
Indicator |
Population |
Population #2 |
Data source |
|
CP1* |
Proportion of people in Scotland reporting satisfaction with opportunities to influence (i) the Scottish Government’s approach to delivering net zero, and (ii) local policy and planning decisions relating to net zero |
Scotland-wide |
[Demographic group breakdown in P&E] |
Scottish Climate Survey (proposed addition from Autumn 2026) |
|
CP2 |
Proportion of people in Scotland reporting satisfaction with opportunities to influence net zero and climate adaptation developments happening in their local area |
Scotland-wide |
[Demographic group breakdown in P&E] |
Scottish Climate Survey (proposed addition from Autumn 2026) Ad hoc qualitative – with stakeholders |
|
CP3* |
Number of community groups involved in climate action/sustainability activities, as recorded by the Climate Action Hubs (and case studies) |
Scotland-wide |
Local Authorities (qualitative) |
Climate Action Hubs quarterly reporting to Scottish Government Qualitative – with community action stakeholders |
|
CP4 |
Geographical coverage of regional adaptation collaborations [once full coverage, updates on implementation] |
Scotland-wide |
Local Authorities not involved in adaptation partnerships |
Adaptation Scotland reporting to Scottish Government |
|
CP5 |
The proportion of people reporting that changes to their local place due to net zero infrastructure and/or land use change[7] have maintained or improved the quality of their local area |
Scotland-wide |
|
Scottish Climate Survey (proposed addition from Autumn 2026) |
|
CP6 |
Area of community assets (in hectares) |
Scotland-wide |
| |
|
CP7* |
Operational capacity of community and locally owned energy installations in Scotland. Include breakdown (i) by type of ownership (ii) by location and (iii) as a proportion of total renewable energy installed (that year/ overall) |
Scotland-wide | ||
|
CP8 |
Average value of community benefits committed from renewable energy projects commissioned in the last 36 months, where a community or developer form is attached to a project |
Scotland-wide |
| |
|
Indicators with no currently available data |
Population |
Population #2 |
Suggested method/ data source for collection | |
|
CP9 |
Engagement experiences of the fishing sector with offshore energy developments |
Scotland-wide |
|
Qualitative engagement with key stakeholder groups e.g., Regional Inshore Fisheries Group and existing forums. |
|
CP10 |
Distribution of marine space across activities, including % available for fishing |
Scotland-wide |
| |
|
CP11 |
Number of woodland creation projects registered with the Woodland Carbon Code (WCC) and peatland restoration projects registered with the Peatland Code (PC) owned by community groups and small landholdings; and as a % of total registered projects |
Scotland-wide |
|
UK Woodland Carbon Code registry Case studies – qualitative engagement with stakeholders e.g., Scottish Forestry, Peatland Action, Community Land Scotland. |
|
CP12 |
Socio-economic benefits from woodland creation and peatland restoration |
Scotland-wide |
|
Qualitative engagement with key stakeholder groups e.g., Community Land Scotland, Scottish Forestry, Peatland Action, Scottish Land Commission, and with projects under development. The WCC has a benefits self-reporting tool from which data may also be available for the Scottish Government. |
Table 4: Communities and Places outcome for the JT M&E framework.
People and Equity
Table 5 provides an overview of proposed indicators to monitor progress towards the People and Equity (PE) outcome. Earlier versions of the framework included absolute poverty, relative poverty and the GINI coefficient as indicators within this outcome (in keeping with Drabble et al. (2024) and the JTC’s Annual Report (2024)). Following discussions with Scottish Government analysts, these were removed from any one outcome. Instead, they are identified as high level, contextual trends against which to analyse JT progress across all four outcomes. Further detail on the value of using poverty and inequality data as contextual trends for indicator interpretation is provided in Section 3.4.2.
|
People and Equity | |||||
|
PE |
Indicator |
Population |
Population #2 |
Population #3 |
Data source |
|
PE1* |
Proportion of people in Scotland reporting satisfaction with opportunities to influence (i) the Scottish Government’s approach to delivering net zero, and (ii) local policy and planning decisions relating to net zero |
Demographic groups |
|
|
Scottish Climate Survey (proposed addition from Autumn 2026) |
|
PE2 |
Proportion of people in Scotland reporting satisfaction with opportunities to influence net zero and climate adaptation developments happening in their local area. Include breakdown by (a) ocean and (b) land projects |
Demographic groups |
|
|
Scottish Climate Survey (proposed addition from Autumn 2026) Ad hoc qualitative engagement with sectoral stakeholders |
|
PE3* |
Percentage of dwellings in Fuel Poverty |
Scotland-wide |
(ii) 6-fold rural/urban (iii) Island local authorities |
|
Scottish House Condition Survey |
|
PE4 |
Housing with EPC C or above across housing/tenure types |
Scotland-wide |
(ii) 6-fold rural/urban |
| |
|
PE5* |
Percentage of people reporting that they can afford their individual transport costs |
Scotland-wide |
(ii) 6-fold rural/urban |
Income | |
|
PE6 |
Number of people reporting they do not use public transport (buses) due to connectivity issues |
Scotland-wide |
(ii) 6-fold rural/urban classification groups | ||
|
PE7 |
|
Scotland-wide |
Demographic groups |
SIMD percentile (if data is available) |
Ordnance Survey |
|
PE8* |
Proportion of people who agree that the transition to net zero and climate resilience will support a more positive future for young people and future generations in Scotland |
Scotland-wide |
|
|
Scottish Climate Survey (proposed addition from Autumn 2026) |
|
PE9* |
Level of adaptation action being taken by people in Scotland |
Scotland-wide |
Demographic groups |
SIMD percentile |
Scottish Climate Survey |
|
PE10 |
Hospitalisations by heat |
Scotland-wide |
Demographic groups (available by age and sex) |
SIMD percentile | |
|
PE11 |
Proportion of householders with prior flood claims who can receive quotes from 5 or more insurers |
Scotland-wide |
Flood-Re | ||
|
PE12 |
Proportion of people living in a flood risk area who report an inability to implement flood risk measures |
Scotland-wide |
Scottish Climate Survey (proposed addition from Autumn 2026) | ||
|
Indicators with no currently available data |
Population |
Population #2 |
Population #3 |
Suggested method/ data source for collection | |
|
PE13* |
Premature deaths due to exposure to fine particulate matter (PM2.5) (number of premature deaths) |
Scotland-wide |
Demographic groups |
SIMD percentile |
Public Health Scotland |
Table 5: People and Equity outcome for the JT M&E framework.
Jobs, Skills and Economic Opportunities
Table 6 provides an overview of proposed indicators to monitor progress towards the Jobs, Skills and Economic Opportunities (JSEO) outcome. Indicators dependent on UK Sectoral Industrial Classification (SIC) codes may be subject to change and refinement following the revision of UK SIC codes currently underway (Office for National Statistics, 2026). This may result in new sectoral categorisations and sub-categories by activities directly related to ‘net zero’ (e.g., renewable energy) which could support targeted sectoral breakdowns for indicators such as JSEO8, “proportion [%] of employees earning less than the Real Living Wage”.
|
Jobs, Skills and Economic Opportunities | ||||
|
JSEO |
Indicator |
Population |
Population #2 |
Data source |
|
JSEO1* |
Employment (full-time equivalent) in the Low Carbon and Renewable Energy Economy (LCREE) in Scotland |
Scotland-wide |
| |
|
JSEO2 |
Total employment in Energy (including renewables) |
Scotland-wide |
| |
|
JSEO3 |
Employment in forestry and marginal employment changes from woodland creation |
Scotland-wide |
|
Scottish Forestry reporting to Scottish Government |
|
JSEO4* |
Low Carbon and Renewable Energy Economy (LCREE) estimated direct and indirect turnover |
Scotland-wide | ||
|
JSEO5 |
Businesses with 10+ employees with (i) a climate strategy (ii) biodiversity strategy (iii) publishing an annual sustainability report |
Scotland-wide |
|
Business Insights and Conditions Survey (Environment Wave) |
|
JSEO6 |
Number of people in Modern Apprenticeships reporting that their apprenticeship is in a ‘net zero or green sector’ (i) 3-month and (ii) 15-month after finishing |
Scotland-wide |
Demographic groups | |
|
JSEO7 |
Trade union membership density in Scotland |
Scotland-wide |
| |
|
JSEO8* |
Proportion (%) of employees earning less than the Real Living Wage |
Scotland-wide |
|
Annual Survey of hours and earnings |
|
JSEO9 |
The difference between male and female full-time hourly earnings in the transport sector[8]. [SIC H: Transportation and storage] |
Scotland-wide |
|
Annual Survey of hours and earnings |
|
JSEO10 |
The difference between male and female full-time hourly earnings in the energy sector. [SIC B: Mining and Quarrying; SIC D: Electricity, Gas, steam and air conditioning supply] |
Scotland-wide |
|
Annual Survey of hours and earnings |
|
JSEO11 |
The difference between male and female full-time hourly earnings in the construction sector. [SIC F: Construction] |
Scotland-wide |
|
Annual Survey of hours and earnings |
|
JSEO12 |
The difference between male and female full-time hourly earnings in the agriculture sector. [SIC A: Agriculture, forestry and fishing] |
Scotland-wide |
|
Annual Survey of hours and earnings |
|
Indicators with no currently available data |
Population |
Population #2 |
Suggested method/ data source for collection | |
|
JSEO13 |
Number of renewable energy supply chain businesses in Scotland Interim proxy: £ value of ScotWind projects committed to Scottish-based suppliers |
Scotland-wide |
|
Selected industry statistics for business based on pre-identified SIC code sectors. Proxy: Supply Chain Development Statements (accessed via Crown Estate Scotland) |
|
JSEO14 |
Business resilience and ability to adapt to climate change and the transition Interim proxy (in CCP 2026): Proportion of small businesses in Scotland reporting the level of energy prices as an obstacle |
Scotland-wide |
N/A | |
|
JSEO15 |
Number of workers experiencing redundancy in high emitting industries in Scotland receiving support/ reporting that their employers are implementing transition plans for workers |
Scotland-wide |
|
Survey and qualitative engagement with key stakeholders. |
|
JSEO16* |
High emitting industry worker participation in decisions affecting them |
Scotland-wide |
|
Survey and qualitative engagement with key stakeholders. |
|
JSEO17* |
Sense of uncertainty/ confidence in the transition amongst workers in high emitting industries |
Scotland-wide |
|
Survey and qualitative engagement with key stakeholders. |
Table 6: Jobs, Skills and Economic Opportunities outcome for the JT M&E framework.
Environment and Biodiversity
Table 7 provides an overview of proposed indicators to monitor progress towards the Environment and Biodiversity (EB) outcome.
|
Environment and Biodiversity | |||
|
EB |
Indicator |
Population |
Data source |
|
EB1* |
Emissions of the eight priority Air Quality pollutants (ammonia, carbon monoxide, nitrogen oxides, non-methane volatile organic compounds, particulate matter, sulphur dioxide and lead) for Scotland and by industrial sector |
Scotland-wide |
National Atmospheric Emissions Inventory |
|
EB2 |
Improvements to water quality across types in Scotland |
Scotland-wide |
SEPA – Aquatic classification and water classification hub |
|
EB3* |
Scotland’s carbon footprint expressed in million tonnes of carbon dioxide equivalent per year |
Scotland-wide | |
|
EB4 |
Global biodiversity impact (Measures the effect of Scotland’s resource use on biodiversity domestically and abroad) |
Scotland-wide | |
|
EB5 |
Soil sealing |
Scotland-wide | |
|
EB6 |
Regeneration of vacant / derelict urban land (% of which is regenerated through environmental restoration, for climate adaptation and by net zero initiatives) |
Scotland-wide |
Scottish Land Commission/SEPA, qualitative engagement with energy developers. |
|
EB7 |
Number of hectares of newly protected land and marine features across Scotland |
Scotland-wide | |
|
Indicators with no currently available data |
Population |
Suggested method/ data source for collection | |
|
EB8 |
Carbon and social footprint of materials used for net zero developments in Scotland Interim proxy: Carbon Intensity of Materials (Circular Economy Strategy (2026) (Scottish Government, 2026d): indicates whether a nation is consuming more sustainable alternatives, independent of trends in overall GHG impact. |
Scotland-wide |
Data not available. Developers increasingly conduct project lifecycle assessments during the planning process. This may be a starting point for data collection. Proxy: Material Flow Accounts |
Table 7: Environment and Biodiversity outcome for the JT M&E framework.
Monitoring local transitions: hotspot indicators and anticipating risk
In parallel to monitoring indicators for the four, high-level JT outcomes for Scotland, the proposed framework includes a focus on key locations identified as ‘sites of transition’, or transition ‘hotspots’. This is grounded in the inherently spatial nature of (in)justice (Bouzarovski and Simcock, 2017) and the recognised importance of contextualised, placed-based approaches to transitions (e.g., Jenkins et al. 2025; Shapovalova et al. 2023). The hotspots approach integrates attention to specific places experiencing change because of or influenced by[9] the net zero transition.
The definition of ‘hotspots’ as used throughout this report is as follows:
- Places reliant on a high-emitting industry and undergoing industrial change
- Places hosting net zero developments and their aggregated impacts
Some hotspots are already known, while others will need to be identified and may become hotspots over time. Examples of identified hotspots include Aberdeen City, Aberdeenshire and Grangemouth in Falkirk from the perspective of industrial change. Shetland, Dumfries and Galloway or Caithness in the Highland Council are examples of hotspots hosting significant net zero developments (e.g. Voar, 2024; Equitable Energy, 2025; Mountain, 2024; Just Transition Commission, 2025). Two additional hotspot criteria have been identified but remain underdeveloped in this report: (i) places of legacy unjust transitions and aggregated effects and (ii) places facing high levels of climate change risk.
Alongside the importance of place-based transition monitoring, there is growing attention to the need for future-facing, anticipatory approaches to justice (e.g. Santos Ayllón et al. 2025; Trueworthy et al. 2024; Rodhouse et al. 2024). This was also mentioned by stakeholders during the workshop, with reference, for instance, to the known closure of Petroineos oil refinery operations at Grangemouth and a perceived failure to act in a timely fashion. The need for anticipatory, or “early warning” indicators and approaches to JT has also been emphasised in letters and consultation responses to the Draft CCP (2025) (e.g., Just Transition Commission, 2026b).
It is intended that anticipatory approaches to hotspot identification and monitoring as part of JT M&E can help mitigate risks of injustice – and pursue opportunities for more just outcomes – before transitions are locked in (Santos Ayllón et al. 2025).
The hotspot approach developed for this framework draws on existing work on place-based JT M&E. It presents an approach to monitoring place-specific sites of transition and proposes methodologies to anticipate potential transitions. In this vein, sections 3.3.1 and 3.3.2 set out approaches for hotspot identification, not monitoring. These approaches are exploratory and untested in practice and require further analytical development and pilot application. They were informed by support from Scottish Government analysts and by insight from stakeholders such as the Scottish Trade Union Congress (STUC).
Section 3.3.3 details the hotspot monitoring approach and a set of indicators. These indicators are proposed to monitor readily identified hotspots or known sites of transition. The development of the hotspots approach and hotspot indicators integrates place-based JT M&E within the proposed national JT M&E framework for Scotland.
Throughout these sections, this report reiterates the value of formalised and regular stakeholder engagement. Direct engagement with project developers, employers, planning authorities, local councils and sector-specific institutions will be invaluable to understand ongoing transition plans and decisions. This may be one of the most fruitful methods for anticipating potential transitions overall.
Identifying potential hotspots of industrial change
Locating potential industrial transition hotspots will involve identifying places hosting the types of industries which the low carbon economy is expected to move away from. These may include specific sectoral activities (e.g., oil and gas production or domestic vehicle combustion engine construction) and high emitting industrial sites which can be expected to undergo some form of decarbonisation over time.
To identify potential areas of industrial change using available data, the Scottish Government could pre-select a group of high-emitting sectors (e.g., heavy industry, manufacturing, energy, construction, or transport) using UK SIC code classifications. Although SIC code classifications do not precisely match distinctions between emitting and low-carbon activity, industry statistics by SIC code can be broken down to granular sector levels and small-scale geographies across Scotland.
A variety of statistical approaches could be then used to identify potential hotspots in relation to pre-identified sectors. ‘Location quotients’, for example, show the proportion of total employment in a place from a particular industry, compared to the national share. This can show sectors of dependency (or strength) for different local authority areas and at smaller scales. Location quotient data shows Aberdeen City as having a high location quotient in ‘mining and quarrying’ (SIC sector B) of 12.7, and Aberdeenshire of 3.2. This means that the proportion of jobs in ‘mining and quarrying’ in Aberdeen City and Aberdeenshire are 12.7- and 3.2-times the Scotland-wide share respectively (where 0.98% of Scottish jobs are in ‘mining and quarrying’)[10]. The data is sourced from the Business Register and Employment Survey and is available via NOMIS, and used by the Scottish Government, for example, in the Industry Statistics Database.
The Scottish Government could also identify key locations of industrial activity in identified sectors (determined according to SIC codes) based on the following indicators: (i) number of employees and (ii) proportion of employment in the local area dependent on these industries. Data for these measures is available in the Scottish Government’s industry statistics (Scottish Government, n.d.). This proposal takes a slightly different approach to location quotients by recognising the relative importance of industries in places, regardless of their proportional comparison to the rest of Scotland. If a given location is particularly dependent on an industry relative to its local employment levels and economic scale, then a change in this industry could have a significant impact locally (even if the facility is relatively small compared to the Scotland-wide sectoral workforce). Possible geographical scale for these analyses (as advised by analysts in the industry statistics area in government) include, for example, ‘travel to work’ areas, which are based on commuting patterns. Some of these are larger than local authorities, while others are smaller and based around specific towns. The Scottish Government could also use data on ‘anchor firms’ as the largest place-based employers across Scotland to further support hotspot identification.
A sector-based approach could also support the identification of potential net zero ‘growth’ areas, again, using tools such as location quotients or proportion of employment in a local area. The pre-selection of opportunity net zero sectors could be based on existing government strategies and analysis (e.g., the National Strategy for Economic Transformation (2022) and the Green Industrial Strategy (2024)). This will also be conditioned to some extent by available SIC code breakdowns. The current review of SIC code classifications (UK Government, 2026) may enable improved analyses of net zero sectors in the future. There could be overlap between industrial change hotspots and growth areas.
In parallel to sector-based analyses, the Scottish Government could use data sources like the Scottish Environment Protection Agency’s (SEPA) Scottish Pollutant Release Inventory (SPRI), to identify the most emitting industrial sites across Scotland (SEPA, n.d.). This dataset is annually updated and includes an extensive list of pollutants, including key greenhouse gases such as carbon dioxide and methane. As an example, journalist investigations have previously used this data to identify what authors labelled “Scotland’s top 20 climate polluters” with a focus on carbon dioxide emissions (Edwards and Dobson, 2022). The authors identified the single most polluting sites (e.g., SSE’s gas-fired plant at Peterhead) and the most polluting companies (e.g., Ineos). A cement works plant, waste incinerators, a glass manufacturing plant and a whisky distillery were also in the ‘top 20’, highlighting potential transition sites outside of the known industrial transition sectors. This proposal is inspired by similar analyses shared by STUC.
There may also be value in using the regularly updated data and maps from the North Sea Transition Authority (NSTA). NSTA datasets include regularly updated, long term decommissioning plans by well (North Sea Transition Authority, n.d.). Alongside these, the Scottish Government’s Marine Directorate produces spatially mapped data of onshore and offshore oil and gas infrastructure (e.g., MarineScotland, 2020). A spatial, infrastructure-based approach hyper-localises the identification of potential sites of transition and may also support identification of key employers and operators across sites and wells. Additional analysis of the Marine Directorate and NSTA data to identify field names, operators and their employee base could provide further insight into oil and gas transitions more broadly. This project has identified this as a critical area requiring new data collection for JT monitoring.
Identifying potential net zero development hotspots
Scholarships focused on energy, justice and JT have demonstrated the potential negative implications of net zero developments in the places where they are deployed (e.g., Mejía-Montero, 2025; Kalt et al. 2023; Healy et al. 2019). As such, the Scottish Government should also anticipate potential sites of net zero development. This includes both the deployment of renewable energy and related infrastructure (e.g., transmission lines, subsea cables, power stations, and green hydrogen production plants). It also includes sites of land use change like woodland creation and peatland restoration (e.g., for carbon offsetting purposes).
In the case of renewable energy and adjacent energy infrastructure developments, the most comprehensive data source identified is the UK Renewable Energy Planning Database. This is updated multiple times a year (UK Government, n.d.). It tracks the progress of UK renewable electricity projects over 150kW (onshore and offshore) through the planning system across technology types[11]. This data is available in spreadsheet format and as an interactive map, and projects can be filtered by development stages (UK Government, n.d.). The Scottish Government could filter by projects at inception and planning stages as a starting point for anticipatory JT analysis of potential developments.
There is extensive research regarding the justice implications of energy. Data collection associated with renewable energy benefits and ownership distribution is already underway by the Scottish Government. In contrast, this project identifies natural capital projects resulting in land use change for net zero as an important and underexplored area from a JT perspective. The Scottish Crofting Federation, for example, voiced a clear concern regarding land purchase and accumulation through natural capital development opportunities. Conversations across natural capital and Woodland Carbon Code (WCC) areas of government recognised existing concerns about land ownership concentration and the establishment of ‘green lairds’ (McMorran et al. 2022) yet also suggested that ownership concentration is not happening to date. This contrast in stakeholder perspectives demonstrates the relevance of this arena for further research, data collection and anticipatory hotspot attention.
Stakeholder engagement during this project shed light on the limited data available in relation to natural capital projects and their impacts from a JT perspective. Existing data includes publicly available lists of projects registered with WCC and Peatland Code (PC) (Woodland Carbon Code, n.d., Peatland Code, n.d.). In addition, Peatland Action hold and map data regarding completed and in-progress peatland restoration across Scotland (NatureScot, n.d.). Their map includes data on conducted ‘feasibility studies’ which can show sites of future restoration (however, these areas will not necessarily see the development of peatland restoration projects). A similar map was not identified for woodland creation projects. Like energy developments, land use change projects need to obtain consent (e.g., Scottish Forestry, 2025). The Scottish Government could explore avenues to access planning applications for woodland creation and peatland restoration as a step towards understanding planned landscape change for net zero and climate resilience.
Net zero developments are happening at a fast pace and across all of Scotland. This project proposes that the Scottish Government visually map and regularly update related data to enable a more comprehensive understanding of (i) the degree of change across different areas in Scotland and (ii) aggregated effects in a single place. Additional criteria to inform identification of potential hotspots facing net zero developments are (i) considerations of project scale and expected impact and (iii) the local context. This is applicable to both energy and land use change hotspots.
Hotspot indicators
The following section sets out the list of 23 indicators recommended for monitoring hotspots. Various indicators for hotspot JT M&E were selected from the four outcomes in the full M&E framework. Alongside these, additional indicators were identified which provide relevant information regarding transition processes in specific contexts. The selection of indicators was also informed directly by the dual hotspot definition above.
There are known and predicted similarities in the concerns created by specific transition impacts. In the case of industrial change, for example, concerns include worker participation in decision-making processes, unemployment and worker mobility, reskilling, socio-economic wellbeing of the local community, local identity and cohesion and levels of deprivation (e.g., Mayer, 2018; International Labour Organisation, 2015; Walsh et al. 2016; Santos Ayllón and Jenkins, 2023; Shapovalova et al. 2023; Jenkins et al. 2025). For places hosting net zero developments, concerns include transparency and participation in decision-making, stakeholder recognition and decision-making power hierarchies, impacts on identity and place attachment, the distribution of socio-economic impacts and risks of extractivism (Jenkins et al. 2016; Shejale et al. 2025; Raymond et al. 2023; Kalt et al. 2023; Healy et al. 2019; Morrissey, 2023).
Known and predicted concerns informed both the definition of hotspots and the selection of hotspot indicators. As an example, industrial change hotspot indicators include workforce experiences and local economy fluctuations. They also include indicators monitoring alcohol and drug use hospitalisations. While not directly connected to net zero activity, the latter serve as early warning measures of deprivation. Their inclusion draws on Shapovalova et al. (2023) and on the SIMD. Given the SIMD is produced every four to five years, they provide advanced insight into deprivation (SIMD, 2020).
The selection of indicators is further informed by the fact that hotspots directly experiencing industrial or net zero transition impacts (e.g., from the closure of an industrial plant or the deployment of transmission lines), are also impacted by broader transition dynamics captured across the four JT outcomes. In this way, place-specific transitions are layered upon broader JT issues, such as fuel costs, transport accessibility, fair work or participatory capacity in net zero policy-making processes.
Hotspot indicators are proposed as a useful starting point and guide for monitoring hotspot areas. They are not a blanket approach that will apply equally in every site of transition or consistently through time. While hotspots may share characteristics regarding the types of transition underway (e.g. industrial change or decline), each will be unique. Indicators may illustrate similar trends for different hotspots, but this will not necessarily demonstrate that the same transitions are occurring, nor similarities in their just-ness.
Attention should be given to unique, place-based realities including through complementary analytical tools such as the SIMD, existing climate change risk maps and data (e.g., SEPA, 2025; Climate Just, n.d.) and qualitative engagement with stakeholders. This follows recommendations in Jenkins et al. (2025) regarding the importance of bespoke approaches and indicators grounded in the most relevant concerns per place. For the purposes of national-level implementation and taking a national perspective, this report provides a set of indicators as a starting point for hotspot JT monitoring. Table 8 provides an overview of hotspot indicators and their data source. Appendix G provides further detail on hotspot indicators including their desired trend and rationale.
|
H |
Indicator (monitored by selected Local Authority) |
Industrial change |
Net Zero developments |
Data source |
|
H1 |
Employment rate for people aged 16-64 across Scotland |
X |
X | |
|
H2 |
Unemployment rate for people aged 16-64 across Scotland |
X | ||
|
H3 |
Number of people Not in Employment and Education or Training (16-19) |
X | ||
|
H4 |
Number of people in Modern Apprenticeships reporting that (i) their apprenticeship is in ‘green skills’/for the net zero economy’ during, 3-month and 15 months after finishing their apprenticeship and of these, (ii) number of people staying to work in their same Local authority |
X |
X | |
|
H5 |
Population change (with attention to in-out migration) |
X |
X | |
|
H6 |
Business activity/ survivability: Business birth and death rates |
X |
Scottish Government – Sub-Scotland Economic Statistics Database | |
|
H7 |
Sectoral economic dependence/diversification:
Contextualised within broader economic trends per local authority |
X |
X | |
|
H8 |
Proportion of households reporting that they are managing well financially |
X | ||
|
H9 |
Median house price by Local Authority |
X | ||
|
H10 |
People reporting they can afford their individual transport costs |
X |
X | |
|
H11 |
Proportion of adults within 5-minute walk of greenspace |
X | ||
|
H12 |
Operational capacity of community and locally owned energy installations in Scotland. Include a breakdown (i) by type of ownership (ii) by location and (iii) as a proportion of total renewable energy installed in local area |
X |
X | |
|
H13 |
Area of community assets (in hectares) |
X |
X | |
|
H14 |
Community benefits from energy (and for natural capital projects, once available) |
if/as relevant |
X | |
|
H15 |
Number of hospitalisations due to alcohol use |
X | ||
|
H16 |
Number of drug use hospitalisations |
X | ||
|
H17 |
Worker participation in industrial change processes |
X |
Data not currently available | |
|
H18 |
Premature deaths due to exposure to fine particulate matter (PM2.5) |
X |
X |
Data not currently available |
|
H19 |
Fuel poverty |
x (Every 3 yrs) |
x (Every 3 yrs) | |
|
H20 |
Proportion of people who agree that the transition to net zero and climate resilience will support a more positive future for young people and future generations in Scotland |
x (Every 3 yrs) |
x (Every 3 yrs) |
Scottish Climate Survey (proposed addition from Autumn 2026) |
|
H21 |
Proportion of people in Scotland reporting satisfaction with opportunities to influence (i) the Scottish Government’s approach to delivering net zero, and (ii) local policy and planning decisions relating to net zero |
|
x (Every 3 yrs) |
Scottish Climate Survey (proposed addition from Autumn 2026) |
|
H22 |
Proportion of people in Scotland reporting satisfaction with opportunities to influence net zero and climate adaptation developments happening in their local area |
x (Every 3 yrs) |
x (Every 3 yrs) |
Scottish Climate Survey (proposed addition from Autumn 2026) |
|
H23 |
The proportion of people reporting that changes to their local place due to net zero infrastructure and/or land use change have maintained or improved the quality of their local area |
|
x (Every 3 yrs) |
Scottish Climate Survey (proposed addition from Autumn 2026) |
Table 8: Hotspot indicators, by hotspot ‘type’ and data source.
All hotspot indicators share two characteristics: they are all available at local authority level and data is updated on an annual basis (except for the Scottish Climate Survey and fuel poverty data, for which local authority data is available every 3 years). The local authority level is the smallest area for which data is available across all identified indicators. This allows comparability. This scale is also recognised as a limitation to the hotspots approach, given transition impacts may be contained to smaller local areas within local authorities. Highland Council data will not necessarily reflect realities of wind farm and transmission line installations in Caithness, for example, and centralised Orkney Islands level data may be insufficient to understand the just-ness of transitions underway on individual islands within the archipelago.
Annual data collection for most indicators is common and is the most frequent data update period (with some exceptions e.g., labour market trends, which are updated monthly). Given that hotspots are already undergoing transformational change, regular, timely monitoring is critical to understand the implications of the transition. Annual indicators could also serve as early warning indicators for hotspot locations over time. At the same time, this annual updating cycle is recognised as a limitation, given that data will never be available in real time. The limitations of the hotspots approach are returned to in Section 4.
Hotspot indicator monitoring should incorporate regular stakeholder engagement. This will be necessary to better understand both (i) where impacts are localised within each local authority and (ii) to obtain regular, near real time updates while indicator data is unavailable. Regular engagement will also triangulate monitoring with qualitative lived-experience data. The role of stakeholder engagement in JT M&E is expanded on in Section 3.5. A key recommendation for Scottish Government is the further development of effective approaches to engagement as a qualitative monitoring tool.
Interpreting indicators
The sections above have presented a set of proposed indicators across four JT outcomes, a selection of ‘summary indicators’ for these, and an additional set of hotspot indicators. Together, these indicators make up the core for monitoring a JT at a Scotland-wide level and for specific sites of transition in Scotland. The indicators are selected based on their relevance and representativeness of the outcomes and hotspots they relate to, alongside data availability.
The identified indicators are partial. Together, they support an understanding of progress towards JT outcomes, yet they are unable to capture every dimension, nuance and implication of the transition from a JT perspective. The transition itself is underway within a broader landscape of social, economic and planetary change, at local, national and international scales. For improved understanding of the just-ness of the transition, the indicators should be interpreted (i) as interrelated features of a JT within the framework, and (ii) in relation to broader contextual trends. This section addresses each of these points in turn.
Interpreting outcome and hotspots indicators
A JT to net zero and climate resilience is a dynamic, multi-layered process. As an example, an individual may face issues of transport affordability due to the shift towards electric vehicles, gain health benefits from reduced air pollution and be employed in peatland restoration while feeling disenfranchised from decisions about the installation of wind turbines near their home. This understanding of the JT was foundational to the conceptualisation of the proposed JT M&E framework.
A multi-layered and dynamic M&E framework was deemed too unwieldy for feasible implementation. As such, the core of the proposed framework is structured according to a linear logic in which high-level outcomes are monitored by a set of indicators, each with an individual desirable trend. If every indicator in the Communities and Places outcome is progressing in the desired direction, then the Scottish Government could interpret this as progress towards this JT outcome.
A review of individual indicator trends alone, however, is insufficient to assess the just-ness of the transition and may obscure experiences of injustice. As an example, an increasing trend in community energy ownership may not show differences in access to community energy ownership opportunities. These considerations also apply to interactions across indicators, and across outcomes too. Increasing community land ownership, for example, is deemed positive from the perspective of community empowerment and access to net zero opportunities. Yet changes in land ownership could also have negative distributional impacts on people previously employed on the land. The increase in marine protected areas is deemed desirable from the perspective of the Environment and Biodiversity outcome yet may also create additional pressures on fishers and coastal communities in relation to the Communities and Places outcome. Critical inquiry into the indicators, what they do not show and how they relate to each other will improve assessment of JT progress. This critical attention draws from methods developed by the field of responsible research and innovation (e.g., Stilgoe et al. 2013) and has also been proposed in anticipatory justice approaches (e.g., Santos Ayllón et al. 2025). It should be complemented with qualitative, stakeholder engagement, returned to in Section 3.5.
The hotspots approach is designed to capture the multi-layered, cross-cutting nature of the JT more effectively. This is made possible by the narrower scope offered by the hotspots approach. Thus, while hotspot indicators have an indicative desired trend (see Appendix G), they should be interpreted in their local context and, to the extent possible, in relation to each other.
Interpreting indicators against contextual trends
Indicator trends can provide the Scottish Government with an overview of progress towards (or away from) a set of desired outcomes. However, these indicators should be interpreted (i) in the context of climate change mitigation and adaptation actions and (ii) as part of a wider socio-economic landscape. The importance of interpreting indicators within context was emphasised by NatureScot team members, alongside Scottish Government analysts in the industry statistics area. The importance of context to understand quantitative indicators is also clear in Shapovalova et al.’s (2023) narrative interpretation of indicators for a JT in Aberdeen and Aberdeenshire. Contextual interpretation recognises the unpredictability of climate impacts and responses to these, and the ways in which wider trends can impact the ongoing transition (e.g., ICAT, 2024).
This report proposes an initial set of trends which can support the interpretation of monitored indicators. The first two relate to climate change mitigation and adaptation, followed by broader socio-economic trends:
- Greenhouse gas emissions in Scotland: To assess a JT in the context of progress towards climate change mitigation. Greenhouse gas emissions are reported on annually in the CCP (2026) with a time lag of circa two years.
- Climate risk (and adaptation) in Scotland: To assess a JT in the context of changing climate risk. A comprehensive assessment of climate change risk for Scotland is conducted every 5 years by the Climate Change Committee (CCC). Climate adaptation research and policy team members have used the CCC assessment to inform their M&E framework for SNAP3. The CCC presents a set of risks and evaluates these on a scale of high-medium-low. The recommendation is to use this (the number and type of risks per category) as a baseline for climate risk and adaptation (e.g., Climate Change Committee, 2021).
- Land ownership concentration in Scotland: To assess a JT to net zero and climate resilience in the context of evolving land ownership trends in Scotland. Changes in land ownership and land use could have a variety of impacts including potential job losses, landscape change and new distributions of benefits and harms. Land ownership was recognised by stakeholders as key to accessing opportunities from net zero and climate resilience. While data is currently unavailable to monitor land concentration trends, the annual Rural Land Market insights report by the Scottish Land Commission can provide a high-level overview of trends (Scottish Land Commission, 2025). This can be supplemented with insight from relevant Scottish Government teams and stakeholders like Community Land Scotland and the Scottish Land Commission.
- Economic trends in Scotland: To assess a JT to net zero and climate resilience in the context of the health and resilience of the Scottish economy at any given point in time. This can include particular attention to sectoral composition by % of GVA, to support high-level analyses of the direction of the economic transition. Economic statistics are updated annually across Scottish Government. Business and industry surveys are regularly conducted with the least regular surveys taking place on an annual basis.
- Poverty and inequality trends in Scotland: To assess a JT to net zero and climate resilience in the context of structural vulnerabilities and inequity. Relative and absolute poverty statistics, along with GINI coefficient and Palma ratio analyses of inequality are updated annually by Scottish Government.
- Global events: To assess a JT to net zero and climate resilience in the context of global affairs, including geopolitical shocks, economic crises, pandemics or accelerating commitments to climate action. Scotland is part of an interconnected economic, institutional and ecological global landscape. Developments in this landscape will undoubtedly impact on – and could be impacted by – Scotland’s progress towards a JT.
These trends are relevant for JT indicator interpretation across the four outcomes and hotspots[12]. Falling fuel poverty and increasing transport affordability indicate positive advances to address fuel and transport inequities. However, in a context of increasing greenhouse gas emissions these would not necessarily be associated with a net zero transition. A continued increase in poverty levels in a context of falling greenhouse gas emissions and increasing low carbon jobs and economic activity (JSEO1, JSEO4) may signal failings in securing JT objectives. Geopolitical shocks (such as the coronavirus pandemic, Russia’s invasion of Ukraine in 2022, or USA and Israel strikes on Iran in 2026) can impact fuel prices and the cost of living, change government policy priorities and affect public concerns. Analysis of indicators in relation to global affairs can thus support improved interpretation of indicator trends and any sudden shifts these may present.
Stakeholder engagement
The proposed framework is grounded in an underpinning commitment to formalised, regular stakeholder engagement. This is seen as fundamental to supporting JT monitoring. Workshop participants emphasised the value of stakeholder engagement and stakeholder participation both for JT delivery, and specifically to support JT M&E. They explained that building trusted and regular networks with key stakeholders could support data collection, fill data gaps, and improve communication about the transition. This focus on engagement also echoes Mechanism 3 in Drabble et al. (2024, p.47), which identified ‘stakeholder participation in Just Transition decision making’ as one of the conditions for JT success.
Stakeholder engagement is envisaged to enable qualitative data collection for relevant indicators and as a supplement to quantitative data. It is also deemed crucial for indicator interpretation, both to triangulate and contextualise indicators with experience on the ground. Importantly, stakeholder engagement can also provide insight into transition impacts before indicator data is available. Finally, engaging with key stakeholders is also suggested as an anticipatory tool for the Scottish Government to identify potential future hotspots.
Stakeholder engagement can provide granularity, nuance and qualitative case studies grounded in lived experiences of the transition. This can improve understanding of what is and is not captured by indicators, and therefore the multiple implications of the transition. As examples, a Poverty Alliance team member referred to instances in which heat pump installations in social housing had resulted in inhabitants falling into energy debt. During the workshop, a representative from CEMVO explained the difficulties often faced by ethnic minorities in accessing opportunities such as the Community and Renewable Energy Scheme (CARES) funding. Fuel poverty and community energy ownership indicators in the framework (PE3 and CP7) do not reflect these risks and inequalities relating to heat pumps and renewable energy. While indicator data does not capture these experiences, qualitative feedback can.
Some indicators in the framework suggest a combination of quantitative and qualitative data, the latter collected as ad hoc stakeholder insight or case studies. Examples include CP3 on community groups involved in climate and sustainability related activities. Climate Action Hub teams can provide qualitative insight into where community-led action is particularly strong. Conversely, this engagement can also show where it is struggling to take off and offer reasons why. Organisations like the Scottish Community Development Centre and the Scottish Communities Climate Action Network can provide further insight into community-led climate action. Recommendations for stakeholder engagement in indicator JSEO16 (on workforce participation) was informed by a discussion with STUC. This shed light on the legal and practical barriers to worker-involved transitions in high emitting industries.
Some indicators in the framework are fully qualitative. One example is CP9, which monitors engagement experiences of the fishing sector with offshore energy developments. Fishing was discussed not only as an economic activity but a way of life, with strong impact on coastal and island local economies and identities (as explained by the Regional Inshore Fisheries Group and Scottish Government team members). The Regional Inshore Fisheries Group reflected on power and resource hierarchies between offshore energy developers and the fishing sector, and on the different types of fishing and potential diverse impacts. Questions of sectoral coexistence, decline and change in the offshore economy are too complex to be captured in a single data point. Engagement with key stakeholder groups directly involved is therefore key.
The Scottish Government can explore different forms of engagement for JT M&E. These may range from individual meetings to establishing a regular stakeholder forum. There may be opportunities for the Scottish Government to complement these efforts with JTC support, which is to be renewed in 2026 (Scottish Government, 2025f). From the perspective of national JT M&E, the Scottish Government already has extensive knowledge and networks with stakeholder groups and organisations across many JT areas of concern. Internal and external stakeholders engaged with throughout this project are also deemed valuable contact points.
Alongside sector-specific stakeholders, and for national JT monitoring, the Scottish Government can engage with Scottish Government teams working on related Scotland-wide monitoring (e.g., the National Performance Framework or the Wellbeing Economy Monitor) to support contextualisation of indicators into Scotland-wide trends. In addition, the Scottish Government could explore existing connections to local authorities to contrast national-level JT monitoring with local concerns. Stakeholders such as the Convention of Scottish Local Authorities (COSLA) and the Scottish Climate Intelligence Service offer potential to connect nationwide JT monitoring to more local priorities. Local authorities could provide qualitative input to complement indicator monitoring, for example, and could report back on which indicators reflect local priorities at a given point in time.
In the case of hotspots monitoring, the Government could establish regular communication and feedback loops with a bespoke set of stakeholders on the ground. This may include local authority representatives, developers, employers, trade unions and local third sector organisations. Such arrangements could also be used as an anticipatory tool to identify future hotspots facing industrial and net zero change. In addition, existing partnerships and stakeholder networks including the eight Regional Economic Partnerships, for example, or the Sub-Scotland Economic Statistics Group, may be useful to support hotspot indicator interpretation.
While this section has focused on engagement with institutional stakeholders, this does not preclude engagement with individuals directly exposed to and experiencing transition impacts. In some cases, this could be the most direct way to access, listen to and integrate lived experience (e.g., Jenkins et al. 2025). Research into justice in energy transitions has explored the role of intermediaries in translating lived experiences such as of fuel poverty, including both their value and potential risks (e.g., Lacey-Barnacle and Bird, 2018; Santos Ayllón and Jenkins, 2023). This section recommends engagement with institutional stakeholders first for reasons of feasibility, and to ease potential burdens on directly affected groups.
Engagement with individuals experiencing transitions may in some cases be necessary to better understand and evaluate transition impacts. Where needed, the Scottish Government should build in opportunities for ad hoc qualitative research and engagement. The Scottish Government may also explore possible avenues for more formalised engagement approaches to reach lived experience, including through participatory citizens assemblies or ‘experts by experience’ panels (e.g., Elstub et al. 2022; Poverty and Inequality Commission, 2023).
Limitations and reflections
The proposed JT M&E framework has several limitations. Some of these relate to the practicalities of framework implementation, and others to the specific constraints affecting this project. Some limitations reflect the complexity of monitoring a JT itself.
Data availability, temporality and scale
Data availability has played an important role in the final shape of the proposed M&E framework. Broadly speaking, core areas of JT concern are included in the framework across outcomes and hotspot indicator lists. However, for many of these indicators, the data available is partial. For example, ‘adults within 5-minute walking distance of greenspace’ does not provide information on the quality or accessibility of this space. In addition, data for all indicators in the framework is retrospective. While many indicators in the framework are available on an annual basis, others are only available every two or three years. The current lack of real time data is arguably a limitation of any M&E framework aiming to monitor and assess a JT in Scotland.
More broadly, data limitations relate to their collection and categorisation parameters. Two clear examples are industrial classifications by SIC codes or the geographies of data collection, which do not necessarily match geographies of transition. This is particularly key in the case of hotspots. Although data is available at local authority levels, sites of transition often sit within local authorities. Transition dynamics may not necessarily be captured by local authority level data. As discussed in Section 3.5, close engagement with relevant stakeholders will be essential to better understand localised transitions. Engagement will provide as close to real-time data as possible and can triangulate and nuance indicator data. It may also be one of the most effective tools to anticipate future hotspots before transitions begin.
Finally, important data gaps remain. While the framework was developed with feasibility of implementation in mind, it also includes critical areas of JT concern for which both understanding and data is lacking. These gaps suggest areas for further research and data collection. These areas are summarised below:
- Geographic and demographic breakdowns of low carbon and renewable energy jobs (often referred to as ‘green jobs’),
- Education, training and skills development for the economy of the future (in ‘green’ jobs and more broadly),
- Regular data collection on individuals’ sense of influence at smaller geographical scales (Scottish Climate Survey data is only available by local authority every 3 years),
- Worker transitions, including the processes, distributional impacts and lived experience of workers in high-emitting sectors and on retraining pathways,
- Exposure to climate change risk and the ability to access and adopt climate adaptation measures across people and places,
- Climate change and net zero transition impacts on business, with attention to vulnerability, resilience and opportunities for different business types and scales. This includes direct attention to sole traders, who make up 71.9% of businesses in Scotland (Scottish Government, 2025g),
- Implications, benefits and harms of land use change for natural capital projects,
- Opportunities and risks relating to land ownership, access and distribution, with attention to stakeholders such as crofters, farmers and gamekeepers,
- Land and coastal place-based identities and the implications of safeguarding or losing generational occupations and skills (e.g. crofting and fishing),
- The spatial and demographic distribution of environmental degradation, pollution and hazardous sites across Scotland.
The list above relates to all indicators in the framework, including those with available data. For example, although there is an indicator focused on net zero skills development through apprenticeships, this is insufficient to capture the array of skilling and reskilling processes relating to net zero.
Alongside identified data gaps, stakeholder input spotlighted four key areas for further attention. These are not currently captured in the framework because they cut across various outcomes and are affected by extensive data gaps. The Scottish Government could explore (i) how these issues relate to JT delivery in Scotland and (ii) how they may be monitored and evaluated over time:
- Distribution of responsibility, overconsumption and polluter pays considerations: Policy narratives often focus on distributing the benefits of the transition fairly and reducing the burden on disadvantaged households. However, less attention is given to responsibility, overconsumption and polluter pay considerations (at individual, business or industry levels). Participants in the workshop voiced concerns about how ‘climate policy is regressive’. Drabble et al. (2024, p.17) also briefly reflected on these considerations in their reference to ‘assessment of disproportionate benefits’. Most stakeholders engaged in this project and the evidence reviewed did not focus explicitly on issues of historical, international, intergenerational and intragenerational responsibility, often captured by the term ‘climate justice’ (e.g., Roser and Seidel, 2016). Overall, issues of distribution and responsibility are underexplored within a policy context in relation to JT and invite closer attention.
- Intersections between food production systems, stakeholder power, food security, ecosystem and human health, and land use change: Interviews with NatureScot and the Scottish Crofting Federation pointed to the intersections between food production systems, power hierarchies and land use change in the transition to net zero. Concerns were also related to issues of food security, resilience and health. These insights invite further attention into how net zero and climate adaptation actions interact, if at all, with food production, food security and land use, and the risks and opportunities from the perspective of ensuring a JT.
- Intersections between land prices, housing prices and availability and land use change in rural areas: The relevance of land ownership has been highlighted throughout, particularly in relation to distributional justice and access to net zero opportunities. The Scottish Crofting Federation also highlighted issues of land prices, housing prices and the ways in which land use change can affect these, particularly in rural and island areas. This may be directly affected by net zero and climate adaptation developments. In other cases, this may be adjacent to the transition underway and part of broader trends. Improved understanding of how land and house prices interact with the transition will support improved assessment of a JT.
- Implications of human/nature relationships for the planetary crises and JT: There is growing attention to human-and-nature relationships from the perspective of justice, climate change, the energy transition and JT (e.g., Tafon et al. 2023; van Vugt et al. 2025; Tschakert et al. 2020; Stanley et al. 2025). This relates to beliefs, values and ethical systems, similarly to issues of justice (e.g., van Uffelen et al. 2024; Roser and Seidel, 2016). NatureScot interviewees emphasised the importance of assessing the JT within the current, exploitative relationship with nature (in industrial contexts) and its underlying causes. Disconnection from and domination over nature has also been recognised by the Intergovernmental Science-Policy Platform on Biodiversity and Ecosystem Services (IPBES) as an underlying cause of biodiversity loss and nature’s decline (IPBES, 2025, p. 28 Figure SPM.1). In the workshop, indicator discussions for the ‘Environment and Biodiversity’ outcome highlighted diverse perspectives on the role of ‘nature’ within a JT. This included questions about the ways in which the climate and biodiversity crises (also known as the twin-crises) are interlinked; and the implications of this for a JT in Scotland. Overall, the space for nature within understandings of a JT and within JT policy in Scotland is unclear and would benefit from further attention.
Framework structure, design and development
The proposed framework is broadly structured according to a linear logic: outcomes inform the development of indicators which in turn, serve to assess progress towards the outcome. This enables targeted consideration of key areas of concern, along with an opportunity to monitor a suite of indicators providing detail into specific outcomes. At the same time, a linear approach clusters and to some extent, siloes areas and indicators. Indicators captured under ‘People and Equity’ or ‘Environment and Biodiversity’ may also be relevant to monitor progress towards ‘Communities and Places’, for example, but are not easily interconnected in the framework. In contrast to outcomes, a cross-outcome use of indicators is proposed for hotspot monitoring. An example of a cross-cutting indicator approach to M&E is the National Wellbeing Framework for Wales, in which each indicator is relevant to more than one outcome (Welsh Government, 2022b).
Secondly, this framework is designed with in-built stakeholder engagement and qualitative analysis as two fundamental tools for its effective use and delivery. Qualitative approaches are often deemed resource intensive and challenging to implement in practice. Their effectiveness also depends on diverse stakeholders with their own interests and agendas. Emphasis on the role of qualitative approaches also partially moves away from many M&E frameworks that focus predominantly on monitoring quantitative indicator trends over time. Innovation into policy tools and approaches to engage in this feasibly and effectively is a recommendation for the Scottish Government going forward.
Constrained resources for this project resulted in the prioritisation of conceptualisation, outcome and indicator development for monitoring, with less attention to mechanism identification and evaluation proposals. The mechanisms are a key dimension of a full ToC and are important to support evaluation of why a JT is happening, and what actions have driven change (e.g., Drabble et al. 2024, p.42). They allow for “a deeper understanding of what is necessary, and what must be avoided for a ToC to successfully achieve its impact” (Dhillon and Vaca, 2018, p.70). It is recommended that the Scottish Government elaborate on the mechanisms presented by Drabble et al. (2024) to subsequently explore effective and feasible ways for mechanism monitoring. This will also enable more comprehensive evaluations of JT progress.
Finally, the framework has not been ‘tested’ in practice. While indicators have been researched, identified and in some cases, developed, a baseline of data collection has not been undertaken. This report recommends that the Scottish Government collate data across outcome indicators alongside example hotspots such as Aberdeen City or the Shetland Islands. In doing so, it is anticipated that some indicators may evolve, others may be removed and new ones added. This will enable refining of the outcomes and hotspots approach.
Reflections on the temporal nature of (just) transitions
The net zero and climate adaptation transitions, alongside climate change impacts themselves, are by nature fluid, uncertain, and spread over time. Plans such as SNAP3 (2024) and the CCP (2026) set out long term goals to 2045, in keeping with Scotland’s target to reach net zero emissions. This is also reflected in Drabble et al.’s (2024) conceptualisation of a JT ToC for Scotland.
The groups and locations vulnerable to climate change impacts and affected by transition risks and opportunities will change over time. In the case of hotspots, new locations will become focal sites of transition over the next 20 years. The long-term, live and uncertain nature of the transition has implications for any effort towards JT M&E. This requires that the framework be kept live as new issues emerge and new data becomes available. In addition, identifying and defining when sites of transition become hotspots and when their transitions ‘start’ and ‘end’, will be an important consideration for the effective implementation of this framework.
It is recommended that places identified as ‘hotspots’ with known imminent transitions (such as the closure of the Mossmorran chemical plant in Fife (e.g., BBC, 2026)) or those with transitions already underway are monitored as early on as possible. In the case of anticipated hotspots, this becomes a more challenging question relating to pre-empting transitions and the implications of doing so, given that there is no clear cut, pre-determined list of sites of decline or opportunity. Further research into anticipatory policymaking, risk mitigation and future-facing M&E could inform decision-making in this arena.
Reflections on defining the scope of JT
It is also worth reflecting on learnings from this project’s efforts to develop an M&E framework for a JT. Understandings of a JT vary widely. For the development of this M&E framework, this project has understood a JT to be the just-ness of the process and outcomes of the transition in response to climate change through ‘net zero’ and ‘climate adaptation’ in Scotland. Even within these boundaries, issues of JT concern are wide-ranging and incredibly complex. They are also not always comfortably attributable to climate change impacts nor transition actions alone. Instead, they are interwoven with broader local, national and global political, economic and ecological networks, changes and shocks.
The value of tools such as M&E frameworks for a JT should be understood in the messy context of delimiting the scope of JT. Although M&E frameworks will struggle to capture every single aspect and lived experience relating to a JT, they can inform policymaker and societal understanding. They can provide insight into the ways in which the net zero transition and climate adaptation are unfolding and their just-ness. They can also inform interventions and importantly, hold actors in roles of influence and responsibility to account, including the Scottish Government.
Conclusion and recommendations
This project has developed an M&E framework for a JT to a net zero and climate resilient Scotland. The proposed framework supports monitoring of a JT for Scotland as a whole, while integrating attention to specific regions, places and to vulnerable and affected groups. The body of this framework is made up of quantitative indicators alongside recommendations for the development of qualitative indicators. It also integrates qualitative engagement, analysis and interpretation as necessary tools for effective JT M&E.
The proposed framework also builds in a place-based, hotspots monitoring approach. This recognises that specific places will be directly and significantly affected by processes of industrial change and net zero developments. Through the development of the hotspots approach, this framework also presents the future-facing potential of M&E in a JT context, to anticipate and inform transitions towards more just outcomes while mitigating risks (e.g., Santos Ayllón et al. 2025).
This framework is developed within severe constraints on data availability. It offers a step forward towards what is pragmatically possible now. The Scottish Government should keep the framework live and adaptable as the transition unfolds.
The next step is to test the proposed approach through data collection across outcome and hotspot indicators. This will assess how well the framework can be used in practice and its ability to capture JT concerns. In parallel, this report recommends that the Scottish Government develop a set of mechanisms and their monitoring along with approaches to JT evaluation. The identification and development of qualitative engagement tools and analytical approaches for risk mitigation, indicator interpretation and JT evaluation is also encouraged.
Based on stakeholder input and learnings throughout this project, the report closes with a set of key recommendations to Scottish Government for effective M&E of a JT in Scotland:
- Start now: The urgency of understanding transition impacts is clearly felt by stakeholders and within government. The inclusion of JT indicators within the CCP (2026) recognises the centrality of a JT to climate action. In this vein, the Scottish Government should begin to systematically monitor, evaluate and report on progress towards a JT. Implementation of existing (albeit imperfect) frameworks and iterative learning is the next step.
- Data collation and sharing avenues within and beyond government: Data collection and collation in databases, dashboards and reports is underway across teams and directorates in Scottish Government. There is an opportunity to develop cross-team mechanisms to collect and collate this data. There is also an opportunity to put the necessary infrastructure in place for data sharing by non-governmental actors (and to require this, where relevant) with the Scottish Government, to begin to fill data gaps.
- Fill key data gaps with new data collection: Arguably, one of the most pressing data gaps relates to experiences and outcomes of the transitioning workforce in high-emitting sectors. Additional data gaps which require further research from a JT perspective include (i) land use change from natural capital projects, (ii) business vulnerability to climate change and net zero transitions, and (iii) vulnerability to climate impacts and access to adaptation solutions.
- Governance, responsibilities and policy responsiveness: M&E frameworks in other areas of government (such as for SNAP3 (2024) or the Biodiversity Strategy (2024)) have developed governance structures for M&E delivery. It is recommended that the Scottish Government explore questions of JT governance and responsibility, including for JT M&E. This may increase attention and accountability of JT delivery. Relatedly, attention to what bounds JT interventions from a Scottish policy perspective can also support efforts towards governance and attribution analyses, alongside mechanism identification.
- Trial anticipatory approaches to JT M&E: The Scottish Government can use M&E to support proactive JT planning in ways which mitigate risks and pursue opportunities for more just outcomes, particularly in place-specific contexts. The Scottish Government should also identify available tools for policy responsiveness to insights from anticipatory analyses and JT M&E across outcomes and hotspots more broadly.
- Investigate qualitative tools and approaches for M&E: Despite the widespread use of quantitative data for M&E, this project has highlighted the key role of regular stakeholder input, qualitative data and analyses for effective JT M&E. Further development of qualitative engagement tools and analytical approaches is a key recommendation both for indicator monitoring, interpretation and JT evaluation. The implementation of a qualitative-strong JT M&E approach will also require the development and use of strategic analysis capabilities to interpret and evaluate progress towards a JT.
- Use M&E to communicate about the JT and about the transition more broadly: There is value in using JT M&E as a tool for improved communication about climate change, climate action and the impacts of net zero and adaptation. This gains relevance in a political context that is shifting towards anti-climate change and net zero narratives. Monitoring JT indicators and communicating these in relation to net zero and climate adaptation (through dashboards, reports or other tools) is identified as a key avenue for dissemination.
- Identify tools for data management and communication: The breadth and multi-dimensional nature of JT invite the development of digital visualisation tools. These might include websites or dashboards for ease of monitoring, reporting and broader communication purposes. It is also possible to use programmes like Excel to organise data and begin monitoring. This will enable framework implementation in the short-term with readily available tools. It is recommended that transparent internal and external reporting is prioritised.
References
Adindu, A., (2010) ‘Effective Monitoring and Evaluation of Primary Health Care Interventions Requires Participatory Approach,’ Journal of Advancement in Medical and Pharmaceutical Sciences, 4(1), pp. 93-97. Available at: (PDF) Effective Monitoring and Evaluation of Primary Health Care Interventions Requires Participatory Approach
BBC, (2026) ‘Mossmorran stops production after 40 years with jobs at risk,’ BBC News, 3 February, [online]. Available at: https://www.bbc.co.uk/news/articles/cvg1jv77vy8o
Bergseng, A. M., (2023) ‘Monitoring and evaluation of a just transition in Scotland – summary report on international lessons,’ ClimateXChange, April, [online]. Available at: https://www.climatexchange.org.uk/wp-content/uploads/2024/12/CXC-Monitoring-and-evaluation-of-a-just-transition-in-Scotland-%E2%80%93-Summary-report-on-international-lessons.pdf
Bird, M., Büker, P., Keim, M., Treadwell, K., (2024) ‘Assessment Tool for Just Energy Transition Plans: Support for policymakers, stakeholders, and practitioners,’ Deutsche Gesellschaft für Internationale Zusammenarbeit, Just Energy Transition for Coal Regions Knowledge Hub. Available at: https://www.jetknowledge.org/wp-content/uploads/2024/04/IKI-JET-Assessment-Tool-for-Just-Energy-Transition-Plans.pdf
Bouzarovski, S., Simcock, N., (2017), ‘Spatializing energy justice’, Energy Policy, 107, pp. 640-648. Available at: https://www.sciencedirect.com/science/article/pii/S0301421517302185
Brunt, A., Spooner, D., (1998) ‘The development of wind power in Denmark and the UK’ Energy & Environment, 9(2), pp. 279-296. Available at: https://www.jstor.org/stable/44397481
Cambridge dictionary (n.d.) ‘Evaluation meaning’, Cambridge dictionary, [online]. Available at: EVALUATION | English meaning – Cambridge Dictionary https://dictionary.cambridge.org/dictionary/english/evaluation
ClimateJust, (n.d.) Climate Just Map Tool, [online]. Available at: https://www.climatejust.org.uk/map.html
Climate Change Committee (CCC) (2021), ‘Summary for Scotland (CCRA3-IA),’ UK Climate Risk, 16 June, [online]. Available at: https://www.ukclimaterisk.org/publications/summary-forscotland-ccra3-ia/
Crown Estate Scotland, (n.d.) ‘Scotwind leasing round’, [online]. Available at: https://www.crownestatescotland.com/scotlands-property/offshore-wind/scotwind-leasing-round
Department of Health and Social Care, (n.d.) ‘Public Health Outcomes Framework’, [online]. Available at: https://fingertips.phe.org.uk/profile/public-health-outcomes-framework/data#page/0/gid/1000043/pat/15/par/E92000001/ati/6/are/E12000004/yrr/1/cid/4/tbm/1/page-options/car-do-0
Dhillon, L., Vaca, S., (2018) ‘Refining Theories of Change,’ Journal of Multidisciplinary Evaluation, 14(30). Available at: https://jmde.com/index.php/jmde_1/article/view/496/444
Edwards, R., Dobson, P., (2022) ‘The ‘rogues’ gallery’: Scotland’s top 20 climate polluters’, The Ferret, 17 April, [online]. Available at: The ‘rogues’ gallery’: Scotland’s top 20 climate polluters
Elstub, S., Escobar, O., Henderson, A., Thorne, T., Bland, N. & Bowes, E., (2022), ‘Research Report on the Citizens’ Assembly of Scotland’, Scottish Government Social Research, [online]. Available: https://www.gov.scot/isbn/9781802018943
Estrella, M., Gaventa, J., (1998) ‘Who counts reality? Participatory monitoring and evaluation: a literature review’. IDS working paper 70. Available at: https://opendocs.ids.ac.uk/articles/report/Who_Counts_Reality_Participatory_Monitoring_and_Evaluation_A_Literature_Review/26442646/1/files/48090631.pdf
Equitable Energy, (2025) ‘Social value from renewables in the Highlands and Islands,’ Platform, May, [online]. Available at: https://platformlondon.org/app/uploads/2025/05/Social-Value-from-Renewables-EER-280525.pdf
Farrell, C., (2012) ‘A just transition: lessons learned from the environmental justice movement’, Duke Forum for Law and Social Change, 4 (45), pp. 45–63. Available at: https://scholarship.law.duke.edu/cgi/viewcontent.cgi?article=1026&context=dflsc
Healy, N., Stephens, J. C., Malin, S. A. (2019) ‘Embodied energy injustices: Unveiling and politicizing the transboundary harms of fossil fuel extractivism and fossil fuel supply chains,’ Energy Research and Social Science, 48, pp. 219–234. Available at: https://doi.org/10.1016/j.erss.2018.09.016
Heyen, D. A., Beznea, A., Hünecke, K., Williams, R., (2021), ‘Measuring a Just Transition in the EU in the context of the 8th Environment Action Programme – An assessment of existing indicators and gaps at the socio-environmental nexus, with suggestions for the way forward,’ Oko-Insititute, e.V., Trinomics. March, [online]. Available at: JustTransition_Indicator_Paper_final_clean-2021.pdf
HM Treasury, (2026) ‘The Green Book. UK Government Guidance on Appraisal’, UK Government, [online]. Available at: The Green Book – UK government guidance on appraisal
HM Treasury, (2020) Magenta Book. Central Government guidance on evaluation, March, [online], Available at: https://assets.publishing.service.gov.uk/media/5e96cab9d3bf7f412b2264b1/HMT_Magenta_Book.pdf
Htitich, M., Krylová, P., Harmáček, J., (2024) ‘Just Transition Score: Measuring the relative sustainability of social progress,’ Environmental and Sustainability Indicators, 23(100440). Available at: https://doi.org/10.1016/j.indic.2024.100440
Initiative for Climate Action Transparency (ICAT), (2024) ‘Tracking Progress Towards a Just Transition A monitoring, evaluation and learning framework to guide justice-oriented, socially owned transition tracking in South Africa,’ Initiative for Climate Action Transparency, April, [online]. Available at: https://climateactiontransparency.org/wp-content/uploads/2025/01/D8.-JT-MEL-Framework-final.pdf
Intergovernmental Science-Policy Platform on Biodiversity and Ecosystem Services (IPBES), (2025), The IPBES Thematic Assessment Report on the Underlying Causes of Biodiversity Loss and the Determinants of Transformative Change and Options for Achieving The 2050 Vision for Biodiversity (Transformative Change Assessment), [online]. Available for download at: https://www.ipbes.net/transformative-change-assessment
International Labour Organization, (2015), Guidelines for a just transition towards environmentally sustainable economies and societies for all, International Labour Organisation. Available at: https://www.ilo.org/sites/default/files/wcmsp5/groups/public/@ed_emp/@emp_ent/documents/publication/wcms_432859.pdf
Jenkins, K., Drabble, D., Copeland, R., (2025) ‘Assessing the low carbon transition at Grangemouth 2025 A case study for measuring fairness,’ Just Transition Commission, [online]. Available at: https://www.justtransition.scot/wp-content/uploads/2025/07/Assessing-the-low-carbon-transition-at-Grangemouth-A-case-study-for-measuring-fairness.pdf
Jenkins, K., McCauley, D., Heffron, R., Stephan, H., Rehner, R., (2016) ‘Energy justice: A conceptual review,’ Energy Research & Social Science, 11, pp. 174-182. Available at: https://www.sciencedirect.com/science/article/abs/pii/S2214629615300669
Just Transition Commission, (2026a) ‘No Time to Lose Final report of Scotland’s second Just Transition Commission 2022-26,’ Just Transition Commission, 19 February, [online]. Available at: https://www.justtransition.scot/publication/no-time-to-lose-final-report-of-the-2nd-just-transition-commission-2026/
Just Transition Commission, (2026b) ‘Letter to Cabinet Secretary – Developing the Just Transition approach in the draft Climate Change Plan,’ Just Transition Commission, 9 January, [online]. Available at: https://www.justtransition.scot/publication/letter-to-cabinet-secretary-developing-the-just-transition-approach-in-the-draft-climate-change-plan/
Just Transition Commission, (2025a) ‘A Just Transition for Dumfries and Galloway’, 25 March, [online]. Available at: A Just Transition for Dumfries and Galloway – Just Transition Commission
Just Transition Commission, (2025b) ‘A Just Transition for Aberdeen and the North East’, 22 May, [online]. Available at: A Just Transition for Aberdeen and the North East – Just Transition Commission
Just Transition Commission, (2024) ‘Conditions for Success: Annual Report 2024’, 12 December, [online]. Available at: Conditions for Success: Annual Report 2024 – Just Transition Commission
Kaljonen, M., Paloviita, A., Huttunen, S., Kortetmäki, T., (2024) ‘Policy mixes for just transitions: A holistic evaluation framework,’ Environmental Innovation and Societal Transitions, 52(100885). Available at: https://doi.org/10.1016/j.eist.2024.100885
Kalt, T., Simon, J., Tunn, J., Hennig, J. (2023) ‘Between green extractivism and energy justice: competing strategies in South Africa’s hydrogen transition in the context of climate crisis’, Review of African Political Economy, 50(177-178), pp. 302–321. Available at: https://www.jstor.org/stable/48814433
Kelly, J. A., Deegan, C., Collins, A., Milimu, A., Kelleher, L., Farrugia Y., (2025) ‘Just Transition Indicator Framework for Ireland’, Environmental Protection Agency, [online]. Available at: https://www.epa.ie/publications/research/epa-research-2030-reports/Evidence-Synthesis-Report-6.pdf
Kelly, J. A., Clinch, P., Kelleher, L., Shahab, S., (2020) ‘Enabling a just transition: A composite indicator for assessing home-heating energy-poverty risk and the impact of environmental policy measures,’ Energy Policy, 146(111791). Available at: https://doi.org/10.1016/j.enpol.2020.111791
Lacey-Barnacle, M., Bird, C. M., (2018) ‘Intermediating energy justice? The role of intermediaries in the civic energy sector in a time of austerity,’ Applied Energy, 226, pp. 71-81. Available at: https://doi.org/10.1016/j.apenergy.2018.05.088
Lázaro Touza, L., Biones, A., Tirado Sarti, S., Averchenkova, A., López Gunn, E., Escribano, G., (2025) ‘From phasing-out to phasing-in: lessons from Spain’s just transition governance framework,’ Elcano Royal Institute, 27 February, ARI 30/2025, [online]. Available at: https://media.realinstitutoelcano.org/wp-content/uploads/2025/02/ari30-2025-lazaro-et-al-lessons-from-spains-just-transition-governance-framework.pdf
Marine Scotland (2020), ‘Oil and gas sector and infrastructure,’ Scottish Marine Assessment, December, [online]. Available at: https://marine.gov.scot/sma/assessment/oil-and-gas-sector-and-infrastructure
Mayer, A., (2018) ‘A just transition for coal miners? Community identity and support from local policy actors,’ Environmental Innovation and Societal Transitions, 28, pp. 1-13. Available at: https://www.sciencedirect.com/science/article/abs/pii/S2210422417302459
McCauley, D., Pettigrew, K.A., Heffron, R. J., Droubi, S., (2023) ‘Identifying, improving, and investing in national commitments to just transition: Reflections from Latin America and the Caribbean,’ Environmental and Sustainability Indicators, 17(100225). Available at: https://www.sciencedirect.com/science/article/pii/S2665972723000028?via%3Dihub
McMorran, R., Reed, M. S., Glass, J., Bauer, A., Glendinning, J., Macaulay, B., McKee, A., Peskett, L., Rothenberg, L., Rudman, H., Williams, A., (2022), ‘Large-scale land acquisition for carbon: opportunities and risks A SEFARI Special Advisory Group’, SEFARI, Scotland’s Rural College, [online]. Available at: https://sefari.scot/sites/default/files/documents/Final%20report%20v2.pdf
Mejía-Montero, A. (2025) ‘From “just” energy to energy justice? Imaginaries of fair wind power in the Isthmus of Tehuantepec, Mexico’, World Development, 195, p. 107135, pp. 1-11.
Merrell, I., Wheatley, H., Pate, L., Glendinning, J., and MacKessack-Leitch, J. (2025) ‘Rural Land Market Insights Report 2025’, Scottish Land Commission, [online]. Available at: https://www.landcommission.gov.scot/downloads/684fe32f5ede6_SLC-2025-Insights.pdf
Minadakis, P.,Vega-Araújo, J. (2024) ‘Rethinking the social license to operate? A theoretical exploration of its synergies with social acceptance and energy justice for a just transition,’ Energy Research & Social Science, 113(103552), pp. 1-11. Available at: https://www.sciencedirect.com/science/article/abs/pii/S2214629624001439
Morrissey, J., (2023) ‘Coastal communities, blue economy and the climate crisis: Framing just disruptions,’ The Geographical Journal, 189(2), pp. 283-299. Available at: https://rgs-ibg.onlinelibrary.wiley.com/doi/10.1111/geoj.12419
NatureScot (n.d.) ‘Peatland ACTION – Data mapping portal,’ [online]. Available at: https://www.nature.scot/climate-change/nature-based-solutions/nature-based-solutions-practice/peatland-action/peatland-action-data-research-and-monitoring/peatland-action-0
NatureScot, (2025) ‘NatureScot Research Report 1361 – SPANS Scotland’s People and Nature Survey 2023/24 – connection to nature,’ [online]. Available at: https://www.nature.scot/doc/naturescot-research-report-1361-spans-scotlands-people-and-nature-survey-202324-connection-nature
North Sea Transition Authority (NSTA) (n.d.) ‘Interactive maps and dashboards,’ North Sea Transition Authority, [online]. Available at: https://www.nstauthority.co.uk/data-and-insights/insights-and-analysis/maps-and-dashboards/ (NB: Decommissioning data by well can be found under the dashboard heading ‘Power BI’).
Office for National Statistics (ONS) (2026) ‘UK SIC 2026 revision process’, 11 February, [online]. Available at: https://www.ons.gov.uk/methodology/classificationsandstandards/ukstandardindustrialclassificationofeconomicactivities/uksic2026revisionprocess
Oliver, D., Solis, E., Lloyd, K., Heron, S., Lynn S., (2025) ‘Exploring a potential approach to understand and map the local level impacts and opportunities of a Just Transition to Net Zero’. Cardiff: Welsh Government, GSR report number 15/2025. 7 February, [online]. Available at: https://www.gov.wales/understanding-just-transition-approach
Poverty and Inequality Commission, (2023) ‘Learning from the Commission’s Experts by Experience Panel’, 22 December, [online]. Available at: https://povertyinequality.scot/publication/learning-from-the-commissions-experts-by-experience-panel/
Raymond, C. M., Stedman, R., Frantzeskaki, N., (2023) ‘The role of nature-based solutions and senses of place in enabling just city transitions,’ Environmental Science & Policy, 114, pp. 10-19. Available at: https://www.sciencedirect.com/science/article/pii/S1462901123000540
Rodhouse, T.S.G.H., Cuppen, E., Correljé, A., Pesch, U., (2024) ‘A new carrier for old assumptions? Imagined publics and their justice implications for hydrogen development in the Netherlands’, Technological Forecasting & Social Change, 204, pp. 1–13. Available at: https://papers.ssrn.com/sol3/papers.cfm?abstract_id=4044540
Roser, D., Seidel, C., (2016) ‘Climate Justice: An Introduction,’ Oxon, UK: Routledge. E-book available online at: https://doi.org/10.4324/9781315617961
Santos Ayllón, L. M., Jenkins, K. E. H., (2023) ‘Energy justice, Just Transitions and Scottish energy policy: A re-grounding of theory in policy practice,’ Energy Research & Social Science, 96(102922). Available at: https://www.sciencedirect.com/science/article/pii/S221462962200425X
Scottish Environment Protection Agency (SEPA) (n.d.) ‘Scottish Pollutant Release Inventory,’ [online]. Available at: https://beta.sepa.scot/topics/environmental-data-and-reporting/spri/
Scottish Environment Protection Agency (SEPA), (2025) ‘National Flood Risk Assessment 2025. Understanding Current and Future Flood Risk in a Changing Climate’, December, [online]. Available at: https://beta.sepa.scot/media/2kliy0j5/national-flood-risk-assessment-2025.pdf
Scottish Forestry, (2025) ‘Permissions for woodland creation,’ 22 February, [online]. Available at: https://www.forestry.gov.scot/do-i-need-consent-plant-woodlands
Scottish Government, (n.d.) ‘National Performance Framework’, [online]. Available at: [ARCHIVED CONTENT] National Performance Framework | National Performance Framework
Scottish Government, (2026a) ‘Scotland’s Climate Change Plan: 2026-2040. Annex 1 – Supporting Content’, 24 March, [online]. Available at: https://www.gov.scot/publications/scotlands-climate-change-plan-2026-2040-annexes/documents/
Scottish Government, (2026b) ‘Scotland’s Climate Change Plan: 2026-2040’, 24 March, [online]. Available at: https://www.gov.scot/publications/scotlands-climate-change-plan-2026-2040-annexes/documents/
Scottish Government, (2026c), ‘Just Transition Fund for the North East and Moray: applicant guidance 2026 to 2027’, 2 March, [online]. Available at: Commercial and public sector projects – Just Transition Fund for the North East and Moray: applicant guidance 2026 to 2027 – gov.scot
Scottish Government, (2026d) ‘A Circular Economy Strategy for Scotland – Appendix 2 – Circular Economy Indicators list including definitions and data sources’, 24 March, [online]. Available at: https://www.gov.scot/publications/circular-economy-strategy-scotland/documents/
Scottish Government, (2026e) ‘Scotland’s Climate Change Plan: 2026-2040 Annex 3 – Monitoring and Analytical Annex’, 24 March, [online]. Available at: https://www.gov.scot/publications/scotlands-climate-change-plan-2026-2040-annexes/documents/
Scottish Government, (2025a) ‘Just Transition: draft plan for transport in Scotland’, 24 February, [online]. Available at: https://www.gov.scot/publications/transition-draft-transition-plan-transport-scotland/documents/
Scottish Government, (2025b) ‘Supporting Scotland’s transition – land use and agriculture: consultation’, 6 August, [online]. Available at: https://www.gov.scot/publications/supporting-scotlands-transition-land-use-agriculture-consultation/documents/
Scottish Government, (2025c) ‘Grangemouth Industrial – just transition plan: supporting a fair transition for Scotland’s core manufacturing cluster,’ 18 June, [online]. Available at: https://www.gov.scot/publications/grangemouth-industrial-transition-plan-supporting-fair-transition-scotlands-core-manufacturing-cluster/documents/
Scottish Government (2025d) ‘Scotland’s Draft Climate Change Plan: 2026–2040,’ November, [online]. Available at: https://www.gov.scot/binaries/content/documents/govscot/publications/strategy-plan/2025/11/scotlands-climate-change-plan-2026-2040/documents/scotlands-draft-climate-change-plan-20262040/scotlands-draft-climate-change-plan-20262040/govscot%3Adocument/scotlands-draft-climate-change-plan-20262040.pdf
Scottish Government, (2025e) ‘The Environment Strategy for Scotland
Consultation Draft’, July, [online]. Available at: https://www.gov.scot/binaries/content/documents/govscot/publications/strategy-plan/2025/07/draft-environment-strategy/documents/environment-strategy-scotland-consultation-draft/environment-strategy-scotland-consultation-draft/govscot%3Adocument/environment-strategy-scotland-consultation-draft.pdf
Scottish Government (2025f) ‘FM: “Fair transition to net zero vital for Scotland’s economy”’ 29 October, [online]. Available at: https://www.gov.scot/news/fm-fair-transition-to-net-zero-vital-for-scotlands-economy/
Scottish Government (2025g) ‘Businesses in Scotland: 2025,’ 3 December, [online]. Available at: https://www.gov.scot/publications/businesses-in-scotland-2025/
Scottish Government (2025h) ‘Scotland’s Carbon Footprint 1998-2021,’ 8 April, [online]. Available at: https://www.gov.scot/publications/scotlands-carbon-footprint-1998-2021/pages/what-is-scotlands-carbon-footprint/
Scottish Government, (2025i) ‘Scotland’s Draft Climate Change Plan: 2026–2040 Annex 2 – Sectoral Annexes’, November, [online]. Available at: https://www.gov.scot/binaries/content/documents/govscot/publications/strategy-plan/2025/11/scotlands-climate-change-plan-2026-2040/documents/scotlands-draft-climate-change-plan-20262040-annex-2-sectoral-annexes/scotlands-draft-climate-change-plan-20262040-annex-2-sectoral-annexes/govscot%3Adocument/scotlands-draft-climate-change-plan-20262040-annex-2-sectoral-annexes.pdf
Scottish Government, (2024a) ‘Scottish National Adaptation Plan 2024-2029: Monitoring and Evaluation Framework’, September, [online]. Available at: SNAP3 Monitoring and Evaluation Framework
Scottish Government, (2024b) ‘Biodiversity strategy and delivery plan: governance, monitoring and evaluation’, 27 November, [online]. Available at: https://www.gov.scot/publications/biodiversity-strategy-delivery-plan-sbs-governance-monitoring-evaluation/
Scottish Government, (2024c) ‘Green Industrial Strategy’, 11 September, [online]. Available at: https://www.gov.scot/publications/green-industrial-strategy/documents/
Scottish Government, (2024d), ‘Scottish Government Urban Rural Classification 2022,’ 16 December, [online]. Available at: https://www.gov.scot/publications/scottish-government-urban-rural-classification-2022/pages/overview/
Scottish Government, (2023) ‘Draft Energy Strategy and Just Transition Plan – delivering a fair and secure zero carbon energy system for Scotland’, 10 January, [online]. Available at: https://www.gov.scot/publications/draft-energy-strategy-transition-plan/documents/
Scottish Government, (2022) ‘Scotland’s National Strategy for Economic Transformation’, 1 March, [online]. Available at: https://www.gov.scot/publications/scotlands-national-strategy-economic-transformation/documents/
Scottish Government, (2021a) ‘Just Transition – A Fairer, Greener Scotland: Scottish Government response’ 7 September, [online]. Available at: Just Transition – A Fairer, Greener Scotland: Scottish Government response – gov.scot
Scottish Government, (2021b) ‘Climate change – Net Zero Nation: public engagement strategy’, 16 September, [online]. https://www.gov.scot/publications/net-zero-nation-public-engagement-strategy-climate-change/
Scottish Government, (2020) ‘The Environment Strategy for Scotland: vision and outcomes’, 25 February, [online]. Available at: https://www.gov.scot/publications/environment-strategy-scotland-vision-outcomes/documents/
Scottish Government, (2016) ‘Fairer Scotland Action Plan’, 5 October, [online]. https://www.gov.scot/publications/fairer-scotland-action-plan/pages/6/
Scottish Index of Multiple Deprivation (SIMD) (2020) Scottish Index of multiple Deprivation, [online]. Available at: https://www.gov.scot/collections/scottish-index-of-multiple-deprivation-2020/
Scottish Parliament, (2019) ‘Climate Change (Emissions Reduction Targets) (Scotland) Act 2019’, [online]. Available at: https://www.legislation.gov.uk/asp/2019/15
Shapovalova, D., Potts, T., Bone, J., Bender, K. A., (2023) ‘Measuring Just Transition: Indicators and scenarios for a Just Transition in Aberdeen and Aberdeenshire,’ Just Transition Lab, University of Aberdeen, October, [online]. Available at: https://www.abdn.ac.uk/media/site/geosciences/documents/Report_Measuring_JT_Aberdeen_and_Aberdeenshire.pdf
Shejale, S., Xinyu Zhan, M., Sahakian, M., Aleksieva, R., Biresselioglu, M. E., Bogdanova, V., Cardone, B., Epp, J., Kirchler, B., Kollmann, A., Liste, L., Massullo, C., Schibel, K-L. (2025) Participation as a pathway to procedural justice: A review of energy initiatives across eight European countries,’ Energy Research & Social Science, 122 (103982).Available at: https://doi.org/10.1016/j.erss.2025.103982
Shen, W., Srivastava, S., Yang, L., Jain, K., & Schröder, P. (2020). Understanding the impacts of outdoor air pollution on social inequality: advancing a just transition framework. Local Environment, 25(1), pp. 1–17. Available at: https://doi.org/10.1080/13549839.2019.1687431
Simeone, L., Drabble, D., Morelli, N., de Götzen, A., (eds.), 2023 Strategic Thinking, Design and the Theory of Change. Edward Elgar Publishing. Accessed online.
Skills Development Scotland, (2021) ‘Climate Emergency Skills Action Plan 2020-2025’, [online]. Available at: https://www.skillsdevelopmentscotland.co.uk/media/w0ulewun/climate-emergency-skills-action-plan-2020-2025.pdf
Smith, K., (2011) ‘The Danish wind industry 1980–2010: Lessons for the British marine energy industry,’ Underwater Technology, 30(1). Available at: https://doi.org/10.3723/ut.30.027
Spanish Government (n.d.), ‘Plan estratégico de Actuación del Instituto para la Transición Justa, O.A. 2024-2026’, Ministry for the Ecological Transition and the Demographic Challenge, [online]. Available at: https://www.transicionjusta.gob.es/content/dam/itj/files-1/Documents/Plan%20de%20actuacion%20ITJ%202024-2026.pdf
Spanish Government, (2023), ‘Spain, 4 years towards a just energy transition,’ Ministry for the Ecological Transition and the Demographic Challenge, May, [online]. Available at: https://www.transicionjusta.gob.es/content/dam/itj/files-1/Documents/Publicaciones%20ES%20y%20EN/Spain_4%20years%20towards%20a%20just%20energy%20transition.pdf
Spanish Government, (2020) ‘Just Transition Strategy’, Ministry for the Ecological Transition and the Demographic Challenge, [online]. Available at: https://www.miteco.gob.es/content/dam/miteco/es/ministerio/planes-estrategias/transicion-justa/Just%20Transition%20Strategy_ENG.pdf
Stanley, T., Hirons, M., Turnbull, J., Lorimer, J., Mensah Kumeh, E., Hafferty, C., May Anderson, L., McDermott, C., (2025) ‘Just nature recovery: A framework for centring multispecies and multi-dimensional justice in land management’, environmental Science & Policy, 164(103992). Available at: Just nature recovery: A framework for centring multispecies and multi-dimensional justice in land management – ScienceDirect
Stilgoe, J., Owen, R., Macnaghten, P., (2013) ‘Developing a framework for responsible innovation,’ Research Policy, 42(9) pp. 1568-1580. Available at: https://doi.org/10.1016/j.respol.2013.05.008
Sun, L., Liu, X., Hu, Z., Zhang, J., Ducruet, C., Zhang, W., (2024) ‘Does just transition increase social and environmental risks? Evidence from global port cities development,’ Environmental Impact Assessment Review, 105(107370). Available at: https://www.sciencedirect.com/science/article/abs/pii/S0195925523003360
SYSTRA (2023a) ‘Proposed just transition baseline variables: built environment and construction sector,’ ClimateXChange, November, [online] Available at: https://www.climatexchange.org.uk/wp-content/uploads/2024/12/CXC-Proposed-just-transition-baseline-variables-built-environment-and-construction-sector-November-2023.pdf
SYSTRA (2023b) ‘Proposed just transition baseline variables: energy sector,’ ClimateXChange, November, [online] Available at: https://www.climatexchange.org.uk/wp-content/uploads/2024/12/CXC-Proposed-just-transition-baseline-variables-energy-sector-November-2023.pdf
SYSTRA (2023b) ‘Proposed just transition baseline variables: transport sector,’ ClimateXChange, November, [online] Available at: https://www.climatexchange.org.uk/wp-content/uploads/2024/12/CXC-Proposed-just-transition-baseline-variables-transport-sector-November-2023.pdf
Tafon, R., Saunders, F., Pikner, T., Gilek, M., (2023) ‘Multispecies blue justice and energy transition conflict: examining challenges and possibilities for synergy between low‑carbon energy and justice for humans and nonhuman nature,’ Maritime Studies, 22(45). Available at: https://doi.org/10.1007/s40152-023-00336-y
Tarfa, P., Bappa, B., Ogunleye, J., Igwebuike, S., Agbo, C., Otobo, O., Nwordu, M., Msheilla, H., (2024) ‘The Nigeria Just and Gender Inclusive Transition (JGIT) Monitoring, Reporting and Verification (MRV) Framework Report’, Initiative for Climate Action Transparency, June, [online]. Available at: https://climateactiontransparency.org/wp-content/uploads/2024/08/Deliverable-4b.-Final-JGIT-MRV-Report.docx.pdf
Transition Plan Taskforce (2024) ‘Putting People at the Heart of Transition Plans: key steps and metrics for issuers. An advisory paper from the TPT’s Just Transition Working Group,’ April, [online]. Available at: https://itpn.global/wp-content/uploads/2024/11/Just-Transition-1.pdf
Transport Scotland, (2024) ‘Monitoring and Evaluation Report 2024 – National Transport Strategy’, 19 December, [online]. Available at: https://www.transport.gov.scot/publication/monitoring-and-evaluation-report-2024-national-transport-strategy/
Transport Scotland, (2021) ‘Monitoring and Evaluation Strategy – August 2021 – National Transport Strategy’, 26 August, [online]. Available at: https://www.transport.gov.scot/publication/monitoring-and-evaluation-strategy-august-2021-national-transport-strategy/
Transport Scotland, (2022) ‘Monitoring and Evaluation 2019 Baseline Report – May 2022 – National Transport Strategy (NTS2)’, 8 June, [online]. Available at: https://www.transport.gov.scot/publication/monitoring-and-evaluation-2019-baseline-report-may-2022-national-transport-strategy-nts2/
Transport Scotland, (2020) ‘National Transport Strategy 2’, 5 February, [online]. Available at: https://www.transport.gov.scot/publication/national-transport-strategy-2/
Trueworthy, A., McCarrel, A., Wieliczkiewicz, J., Cellan, S., Peterson, W., Anderson, S., DuPont, B., Grear, M., (2024) ‘Who will be making wave energy? A community-driven design approach toward just and sustainable energy futures in Alaska’, Energy Research & Social Science. 115, pp.1–18. Available at: https://doi.org/10.1016/j.erss.2024.103615
Tschakert, P., Schlosberg, D., Celermajer, D., Rickards, L., Winter, C., Thaler, M., Stewart-Harawira, M., Verlie, B., (2020) ‘Multispecies justice: Climate-just futures with, for and beyond humans,’ WIREs Climate Change, 12(2). Available at: Multispecies justice: Climate‐just futures with, for and beyond humans – Tschakert – 2021 – WIREs Climate Change – Wiley Online Library
UK Government, (n.d.), ‘Renewable Energy Planning Database,’ 1 July, [online]. Available at: https://www.gov.uk/government/publications/renewable-energy-planning-database-monthly-extract
UK Government, (2026) ‘UK territorial greenhouse gas emissions statistics,’ 5 February, [online]. Available at: https://www.gov.uk/government/collections/uk-territorial-greenhouse-gas-emissions-statistics
United Nations, (n.d.) ‘The 17 Goals’, department of Economic and Social Affairs. Available at: THE 17 GOALS | Sustainable Development
Van Uffelen, N., Taebi, B., Pesch, U., (2024) ‘Revisiting the energy justice framework: Doing justice to normative uncertainties’, Renewable and Sustainable Energy Reviews, 189, Part A, 113974. Available at: https://www.sciencedirect.com/science/article/pii/S1364032123008328
van Vugt, J., de Ruiter, A., Henning, C., (2025), ‘Where to aim with multispecies climate justice? A critical realist account’, Environmental Politics. Available at: https://doi.org/10.1080/09644016.2025.2582121
Venture Taranaki (2020) Metrics and Evaluation. Transition Pathway Action Plan’, August, [online]. Available at: https://www.taranaki.co.nz/assets/Uploads/Like-No-Other/Metrics-TPAP-FINAL.pdf
Voar, (2024a) ‘A Just Transition for Shetland’, 24 September, [online]. Available at: https://www.justtransition.scot/wp-content/uploads/2024/09/Shetland-Community-Benefit-and-the-Energy-Transition-VOAR-Research-Accessible-Web-Version.pdf
Walsh, D., McCartney, G., Collins, c., Taulbut, M., Batty, G.D., (2016), ‘History, politics and vulnerability: explaining excess mortality in Scotland and Glasgow,’ Glasgow Centre for Population Health, May, [online]. Available at: https://www.gcph.co.uk/assets/000/000/367/Excess_mortality_final_report_with_appendices_original.pdf?1700036406
Welsh Government, (2022a), ‘Well-being of future generations: national indicators and milestones for Wales 2022 infographic’, [online]. Available at: https://www.gov.wales/sites/default/files/publications/2024-05/well-being-future-generations-national-indicators-2022-infographic.pdf
Welsh Government, (2022b), ‘Wellbeing of Wales: national indicators,’ 29 September, [online]. Available at: https://www.gov.wales/wellbeing-wales-national-indicators
World Benchmarking Alliance, (2025) Just Transition Methodology, February [online]. Available at: https://assets.worldbenchmarkingalliance.org/app/uploads/2025/02/Just-transition-methodology-2025_FINAL.pdf
World Wildlife Fund, (n.d.) ‘Territorial Just Transition Plan Scorecard Assessment’, World Wildlife Fund, [online]. Available at: https://www.wwf.eu/?9036866/Territorial-Just-Transition-Plan-Scorecard-Assessment
Appendices
The following tables detail (1) engagement with external (non-core Scottish Government) stakeholders through semi-structured and unstructured interviews and informal exchanges; (2) a list of workshop participants and (3) a descriptive list of areas across government that have engaged with and supported this work. Varying levels of detail on stakeholders reflect participant consents.
|
External stakeholders and public bodies |
Method |
|---|---|
|
NatureScot |
Semi-structured interview |
|
Poverty Alliance |
Semi-structured interview |
|
Scottish Trade Union Congress (STUC) |
Semi-structured interview |
|
Scottish Crofting Federation |
Semi-structured interview |
|
Community Land Scotland (shared project with Scottish Land Commission) |
Unstructured interview |
|
Just Transition Commission Secretariat |
Unstructured interview |
|
PhD researcher – qualitative framework development |
Unstructured interview |
|
Regional Inshore Fisheries Group |
Unstructured interview |
|
Sustainability impact consultant |
Unstructured interview |
|
Sustainability impact consultant |
Unstructured interview |
|
Scottish Climate Intelligence Service |
Meeting and email exchange |
|
Skills Development Scotland |
Meeting and email exchange |
|
Public Health Scotland |
Meetings and written feedback |
|
Academia – Just Transition M&E researchers |
Meeting |
|
IUCN UK Peatland Programme |
Email exchanges |
|
Scottish Environmental Protection Agency |
Email exchanges |
Table 1 (Appendix A): External stakeholder engagement list (by method and in alphabetical order)
|
Role |
Organisation (in alphabetical order) |
|---|---|
|
Environmental Projects Coordinator |
CEMVO Scotland |
|
ClimateXChange project lead |
ClimateXChange |
|
Culture/SHIFT programme manager |
Culture for Climate Scotland |
|
Director of Curriculum for STEM and Construction |
Forth Valley College |
|
Researcher |
Heriot-Watt University |
|
Just Transition Commissioner, Scotland Director for Business in the Community |
Just Transition Commission |
|
Secretary |
Just Transition Partnership |
|
Just Transition Communities Project Manager (Project & Practice Lead) |
NESCAN – Just Transition Communities Project |
|
Information Consultant, Climate Analyst Team |
Public Health Scotland |
|
Principal Information Analyst, Climate Analyst Team |
Public Health Scotland |
|
Strategy Lead, Just Transition Unit |
Scottish Government |
|
Head of Net Zero Economy and Carbon Markets |
Scottish Government |
|
Senior Manager, Sustainability, SSEN Transmission; and member, Climate Emergency Response Group |
SSEN Transmission; Climate Emergency Response Group |
|
Coordinator, Aberdeen Just Transitions Lab |
University of Aberdeen |
|
Operations Coordinator |
2050 Climate Group |
|
Organisation |
Workshop facilitator |
|
University of Edinburgh |
Research Fellow (Lara Santos Ayllón) |
|
University of Edinburgh |
Academic Project Lead (Kirsten Jenkins) |
|
Scottish Government (Climate Change Analysis Unit) |
Project representative (Emily Creamer) |
|
Scottish Government (Just Transition Unit) |
Project representative (Abi Whitefield-Stevens) |
Table 2 (Appendix A): Workshop participants (17 November 2025)
|
Scottish government focus areas |
|---|
|
Agricultural reform research, monitoring and evaluation |
|
City and Region Growth Deals |
|
Climate adaptation policy |
|
Climate adaptation research |
|
Community climate action |
|
Energy transition |
|
Fair Work Convention Secretariat |
|
Flood resistance policy |
|
Geospatial Analysis |
|
Heat research and analysis |
|
Industry Statistics |
|
Inshore fisheries |
|
Just Transition Unit |
|
Land use strategy |
|
Marine climate change and biodiversity policy |
|
National Performance Framework |
|
Natural capital markets policy |
|
Offshore wind policy – fisheries coexistence |
|
Peatland restoration delivery |
|
Poverty and deprivation |
|
Regional Partnerships |
|
Rural and Environment Science and Analytical Services (RESAS) – Environmental Analysis Unit |
|
Rural and Environment Science and Analytical Services (RESAS) – Rural communities research |
|
Scottish Forestry – woodland creation |
|
Transport Statistics |
Table 3 (Appendix A): Scottish Government areas (in alphabetical order)
The following table provides an overview of key Scottish Government JT policies and JT M&E publications by the JTC. It illustrates areas of overlap and difference in the use of M&E terminology and categorisation.
|
Key JT policy/ reports |
Owner |
Four themes |
Additional terminology/ categorisation used |
|---|---|---|---|
|
National Just Transition Planning Framework |
Scottish Government (2021) |
N/A |
Themes, outcomes |
|
Draft Energy Strategy and Just Transition Plan |
Scottish Government (2023) |
X |
Guiding principles, outcomes |
|
Draft Transport Just Transition Plan |
Scottish Government (2025) |
X |
Outcomes, bespoke stakeholder groups, action timeframes |
|
Draft Land Use and Agriculture Just Transition Plan |
Scottish Government (2025) |
X |
Outcomes, themes, objectives |
|
Grangemouth Industrial Just Transition Plan |
Scottish Government (2025) |
X |
Pillars, outcomes, levers |
|
Measuring and Evaluating Success in the Scottish Just Transition |
Drabble et al. (2024) (JTC) |
X |
Outcome clusters, proxy outcomes, ultimate aims, mechanisms, original outcomes |
|
Assessing the low carbon transition at Grangemouth: A case study for measuring fairness |
Jenkins et al. (2025) (JTC) |
X |
Outcome clusters, proxy outcomes, ultimate aims, mechanisms |
Table 1 (Appendix B): Overview of key JT policies and M&E framework terminology and categorisation approaches
This appendix provides a summary of each indicator, including target population, desired trend, data source and timeframe. It also provides a data quality assessment based on three key criteria: relevance, representativeness and data availability. These criteria were selected from SNAP3 (Scottish Government, 2024a) as the most relevant for this project. Each is categorised according to assessed indicator quality. They are colour coded red for low quality, amber for moderate quality and green for high quality. This is aligned with the approach in used in the SNAP3 M&E framework (2024a, p.35) and in the CCP (2026) (Scottish Government, 2026e). Table 1 below describes each quality assessment criterion and its rating. The table is amended from the CCP (2026).
|
Criterion |
Description |
Low |
Moderate |
High |
|---|---|---|---|---|
|
Relevance |
The indicator should relate clearly to the emissions source, climate resilience or just transition outcome it is designed to monitor |
Minimal or indirect relationship to emissions reductions, climate adaptation or just transition |
Some relationship to emissions reduction, climate adaptation or just transition but indirect or partial |
Clear and direct relationship to the emissions pathway, climate adaptation or just transition outcome |
|
Representativeness |
The indicator should be directly relevant to key dimensions of the just transition outcome it is designed to monitor |
The indicator doesn’t capture the key drivers of the expected emissions reduction, climate adaptation or just transition outcome |
Represents some important drivers but not the full picture |
Represents the key drivers of just transition, emissions change or climate adaptation |
|
Data availability |
Data should be regularly published, accessible and sufficiently robust |
Data unavailable, restricted, irregular or highly uncertain |
Data available but with limitations (lag, infrequent updates, quality caveats) |
Data regularly published, accessible, and statistically robust |
Table 1 (Appendix C): Criteria used to evaluate indicators (amended from the CCP (2026) (Scottish Government, 2026e).
Communities and Places
|
CP1: Proportion of people in Scotland reporting satisfaction with opportunities to influence (i) the Scottish Government’s approach to delivering net zero, and (ii) local policy and planning decisions relating to net zero Indicator information:
|
CP1: Indicator quality assessment
|
Criterion |
Rating |
Explanation |
|
Relevance |
High |
This indicator is rated high for relevance given it focuses directly on participation and policymaking in relation to net zero, which is key to a JT. |
|
Representativeness |
Moderate |
This indicator is rated moderate for representativeness given its direct relevance to JT concerns through a focus on participation and influence over net zero policymaking at national and local scales. Breakdown by demographic groups also reflects considerations of recognition and existing socio-economic inequities in relation to participation opportunities. It does not provide insight into the felt experiences of participation opportunities, and interpretations and experiences of influencing policy may vary across survey respondents. |
|
Data availability |
Moderate |
This indicator is rated moderate for data availability given that it depends on the annual commissioning of the Scottish Climate Survey. |
|
CP2: Proportion of people in Scotland reporting satisfaction with opportunities to influence net zero and climate adaptation developments happening in their local area. Indicator information:
|
CP2: Indicator quality assessment
|
Criterion |
Rating |
Explanation |
|
Relevance |
High |
This indicator is rated high for relevance given its direct focus on engagement and influence over net zero and climate adaptation developments. |
|
Representativeness |
Moderate |
This indicator is rated moderate for representativeness of JT concerns given its direct attention to issues of participation and influence over net zero and climate adaptation projects at local scales. Breakdown by demographic groups also reflects considerations of recognition and existing socio-economic inequities in relation to participation opportunities. It does not provide insight into the felt experiences of project engagement processes (e.g., consultations) and could underrepresent harder to reach populations, who are also often underrepresented in formal engagement processes. |
|
Data availability |
Moderate |
This indicator is rated moderate for data availability given that it depends on the annual commissioning of the Scottish Climate Survey. |
|
CP3: Number of community groups involved in climate action/sustainability activities, as recorded by the Climate Action Hubs (and case studies) Indicator information:
|
CP3: Indicator quality assessment
|
Criterion |
Rating |
Explanation |
|
Relevance |
High |
This indicator is rated high for relevance due to its focus on community-led climate action and sustainability initiatives, which related directly to JT outcomes. |
|
Representativeness |
Moderate |
This indicator is rated moderate for representativeness of JT concerns. Community-led and grassroots climate action more broadly are strongly associated to community empowerment and participation in the transition, both key dimensions of JT. Climate Action Hubs data is not representative of all community-led climate action across Scotland and may also include sustainability initiatives not directly related to net zero or climate adaptation. Engagement with the Climate Action Hub team can provide additional qualitative nuance, including insight into where community-led action is/ is not taking place and why, capturing considerations of spatial justice. Engagement with broader sectoral stakeholders can complement this indicator to provide a broader view of activity in Scotland. |
|
Data availability |
High |
This indicator is rated high for data availability given that membership data is already collected by the Climate Action Hubs. |
|
CP4: Geographical coverage of regional adaptation collaborations [once full coverage, updates on implementation] Indicator information:
|
CP4: Indicator quality assessment
|
Criterion |
Rating |
Explanation |
|
Relevance |
High |
This indicator is rated high for relevance due to its direct focus on climate adaptation and on partnership working for climate action. |
|
Representativeness |
Moderate |
This indicator is rated moderate for representativeness of JT concerns. Cross-institutional and cross-stakeholder partnership working has been identified as a key feature of JT. From an adaptation perspective, it captures a range of collaborations and their regional coverage. However, the data records Adaptation Scotland partnerships and may not capture all adaptation activity and collaborations within a region. |
|
Data availability |
Moderate |
This indicator is rated moderate for data availability given that data is collected directly from Adaptation Scotland. The data will not reflect all adaptation collaborations in Scotland. |
|
CP5: The proportion of people reporting that changes to their local place due to net zero infrastructure and/or land use change have maintained or improved the quality of their local area. Indicator information:
|
CP5: Indicator quality assessment
|
Criterion |
Rating |
Explanation |
|
Relevance |
High |
This indicator is rated high for relevance due to its direct focus on the impacts of net zero infrastructure and land use change. |
|
Representativeness |
Moderate |
This indicator is rated moderate for representativeness of JT concerns. It puts the focus on the local perceptions and implications of net zero developments to capture distributional issues of benefit and harm from net zero developments. The focus on ‘quality of their local area’ may be interpreted differently by respondents. It may also obscure issues relating to the processes by which developments happened. |
|
Data availability |
Moderate |
This indicator is rated moderate for data availability given that it depends on the annual commissioning of the Scottish Climate Survey. |
|
CP6: Area of community owned assets (in hectares) Indicator information:
|
CP6: Indicator quality assessment
|
Criterion |
Rating |
Explanation |
|
Relevance |
Moderate |
This indicator is rated moderate for relevance given that land ownership directly affects community participation in the transition. However, it does not directly focus on community ownership of assets relating to net zero or climate resilience. |
|
Representativeness |
Moderate |
This indicator is rated moderate for representativeness of JT concerns. Ownership and control over land enables direct access for communities to net zero opportunities, decision-making and benefits distribution. However, this indicator does not reflect the uses of community owned land nor the related impacts on stakeholders dependent on the land. |
|
Data availability |
High |
This indicator is rated high for data availability given that it is regularly collected by Scottish Government. |
|
CP7: Operational capacity of community and locally owned energy installations in Scotland. Include breakdown (i) by type of ownership (ii) by location and (iii) as a proportion of total renewable energy installed (that year/ overall). Indicator information:
|
CP7: Indicator quality assessment
|
Criterion |
Rating |
Explanation |
|
Relevance |
High |
This indicator is rated high for relevance given that the monetary and non-monetary benefits of community owned energy are well known and directly relate to JT outcomes and net zero. |
|
Representativeness |
Moderate |
This indicator is rated moderate for representativeness because it captures the megawatts of installed capacity but does not provide evidence of the benefit of this to communities. It does not reflect differences in who can and cannot become involved in community ownership initiatives and thus is not representative of socio-economic inequalities. Data breakdowns by type of ownership, by location and as a proportion of total renewable energy installed can provide a more nuanced understanding in this direction. Stakeholder engagement with representative organisations could provide qualitative insight in relation to involved groups and complement this data. |
|
Data availability |
Moderate |
Data are published on an annual basis as part of Energy Saving Trust ‘Community and Locally Owned Energy in Scotland’ report. The register is not compulsory so may not capture all projects. |
|
CP8: Average value of community benefits committed from renewable energy projects commissioned in the last 36 months, where a community or developer form is attached to a project. Indicator information:
|
CP8: Indicator quality assessment
|
Criterion |
Rating |
Explanation |
|
Relevance |
High |
This indicator is rated high for relevance given the focus on community benefits from renewable energy as a net zero development. |
|
Representativeness |
Moderate |
This indicator is rated moderate for representativeness of JT concerns. Community benefits payments are a recognised vehicle to distribute benefit locally and increase community wealth in response to implications of renewable energy developments (including, for example, landscape change, noise and economic opportunities). The indicator does not show the distribution of these benefits across Scotland nor within communities, nor how the funds are used. |
|
Data availability |
Moderate |
This indicator is rated moderate for data availability given that data is regularly collected by Local Energy Scotland. It is provided by developers, project owners and fund administrators on a voluntary basis, so the data may be incomplete. |
|
CP9: Engagement experiences of the fishing sector with offshore energy developments Indicator information:
|
CP9: Indicator quality assessment
|
Criterion |
Rating |
Explanation |
|
Relevance |
High |
This indicator is rated high for relevance given the expected impact of planned offshore energy developments (wind, tidal, wave) as part of the net zero transition. |
|
Representativeness |
Moderate |
This indicator is rated moderate for representativeness of JT concerns. Offshore energy developments create a recognised net zero pressure on the distribution of marine space. The fishing sector is facing cumulative pressures in part, because of the net zero transition. This indicator recommends qualitative engagement with sectoral stakeholders to understand transition dynamics between the offshore energy and fishing sector. This data will not be representative of experiences with every development underway in Scotland and may be highly variable. |
|
Data availability |
Low |
This indicator is rated low for data availability as this data is not currently collected. Stakeholder networks involving the Scottish Government through which to begin to collect this data are available. |
|
CP10: Distribution of marine space across activities, including % available for fishing Indicator information:
|
CP10: Indicator quality assessment
|
Criterion |
Rating |
Explanation |
|
Relevance |
High |
This indicator is rated high for relevance given the scale of potential offshore energy developments (wind, tidal, wave) as part of the net zero transition. |
|
Representativeness |
High |
This indicator is rated high for representativeness of JT concerns. Offshore energy developments are a clear net zero pressure on the use of marine space. The fishing sector is facing cumulative pressures, in part because of the net zero transition. Monitoring available marine space for fishing over time (and where possible, in relation to developing offshore energy projects and related installations e.g., subsea cables) can support distributional justice analyses across energy and fishing stakeholders and provide insight into transition dynamics. |
|
Data availability |
Low |
This indicator is rated low for data availability as this data is not currently collected in a monitorable format. The data exists and is regularly updated in an online map format by the Scottish Government Marine Directorate. |
|
CP11: Number of woodland creation projects registered with the Woodland Carbon Code (WCC) and peatland restoration projects registered with the Peatland Code (PC) owned by community groups and small landholdings; and as a % of total registered projects. Indicator information:
|
CP11: Indicator quality assessment
|
Criterion |
Rating |
Explanation |
|
Relevance |
High |
This indicator is rated high for relevance given the direct focus on natural capital projects developed for carbon offsetting for net zero. |
|
Representativeness |
Moderate |
This indicator is rated moderate for representativeness of JT concerns. Community and small landholding involvement in carbon offsetting projects reflects opportunities for smaller scale participation in carbon offsetting projects as a net zero opportunity. Delimiting ‘natural capital’ and carbon offsetting projects is challenging, and not all projects such projects will be registered with the WCC and PC. This indicator does not capture the impacts of these projects. |
|
Data availability |
Low |
This indicator is rated low for data availability as this data is not currently collected. Data exists on public WCC and PC registries. Specific community and small landholding data may be accessible through further analysis. |
|
CP12: Socio-economic benefits from woodland creation and peatland restoration Indicator information:
|
CP12: Indicator quality assessment
|
Criterion |
Rating |
Explanation |
|
Relevance |
High |
This indicator is rated high for relevance given the direct focus on the type and distribution of benefits from woodland creation and peatland restoration, both of which support net zero and climate resilience. |
|
Representativeness |
Moderate |
This indicator is rated moderate for representativeness of JT concerns. Woodland creation and peatland restoration will create diverse socio-economic benefits and their localised impacts across communities in Scotland directly affects distributional and procedural JT considerations. Defining and quantifying socio-economic benefits from natural capital projects (which are often not monetary benefits) is challenging. Qualitative data collection will support increasing understanding of these projects, their development processes and impacts. |
|
Data availability |
Low |
This indicator is rated low for data availability as this data is not currently collected. Potential stakeholders for qualitative data collection have been identified and have existing networks with the Scottish Government. |
People and Equity
Indicators PE1 and PE2 are covered by the quality assessment in Communities and Places and are not repeated below.
|
PE3: Percentage of dwellings in Fuel Poverty Indicator information:
|
PE3: Indicator quality assessment
|
Criterion |
Rating |
Explanation |
|
Relevance |
High |
This indicator is rated high for relevance given that fuel poverty is an existing, systemic injustice related to access and affordability of energy, a key sector in the transition to net zero. |
|
Representativeness |
Moderate |
This indicator is rated moderate for representativeness given the strong spatial dimension of fuel poverty in Scotland, where it is strongly characterised by its geographical distribution. Data by local authorities is only available every three years, however; and the indicator does not distinguish between fuel poverty and extreme fuel poverty, nor reflects the lived experiences of different households. |
|
Data availability |
High |
This indicator is rated high for data availability given that data is published annually as accredited official statistics. |
|
PE4: Housing with EPC C or above across housing/tenure types Indicator information:
|
PE4: Indicator quality assessment
|
Criterion |
Rating |
Explanation |
|
Relevance |
High |
This indicator is rated high for relevance given that increasing energy efficiency is a key vehicle for net zero, climate resilience, and addressing fuel poverty. |
|
Representativeness |
High |
This indicator is rated high for representativeness given that access to energy efficiency and retrofit solutions is often costly, challenging and is a key avenue to decrease poverty alongside emissions reductions. Inequalities of access to retrofit and efficiency solutions are spread across housing and tenure types, which will also be captured by this indicator. In Scotland, energy efficiency inequalities are also spatially distributed across geographies. |
|
Data availability |
High |
This indicator is rated high for data availability given this data is collected annually in the Scottish House Condition Survey. |
|
PE5: Percentage of people reporting that they can afford their individual transport costs Indicator information:
|
PE5: Indicator quality assessment
|
Criterion |
Rating |
Explanation |
|
Relevance |
High |
This indicator is rated high for relevance given that transport affordability is a key concern relating to the transition to net zero. |
|
Representativeness |
Moderate |
This indicator is rated moderate for representativeness given that it directly asks about issues of affordability and can monitor these across Scotland’s geographies (in which transport needs vary) and with attention to low levels of income. The indicator is based on a reported sense of affordability and could be impacted by various factors other than the net zero transition. Over time, however, as the transition to net zero unfolds, transport should not become unaffordable. |
|
Data availability |
High |
This indicator is rated high for data availability given this data is collected annually through the Scottish Household Survey. |
|
PE6: Number of people reporting they do not use public transport (buses) due to connectivity issues Indicator information:
|
PE6: Indicator quality assessment
|
Criterion |
Rating |
Explanation |
|
Relevance |
High |
This indicator is rated high for relevance given that transport connectivity is a key dimension of transport poverty which could be impacted by the net zero transition. Public transport is a key avenue for transport emissions reductions and is broadly more affordable transport, in particular by bus. |
|
Representativeness |
Moderate |
This indicator is rated moderate for representativeness given that it focuses directly on issues of connectivity. Connectivity is a challenging issue to capture due to its overlap with other considerations. This indicator is based on a combined analysis of data to the question of why respondents do not use public transport (SHS). The suggested analysis includes attention to the following responses: lack of service, too infrequent, takes too long, inconvenient, no direct route, unreliable. In addition, analysis should also include the response ‘use my own car’ overlayed with these issues. Geographical breakdowns reflect different transport needs across regions in Scotland. |
|
Data availability |
High |
This indicator is rated high for data availability given this data is collected annually in the Scottish Household Survey. |
|
PE7: (i) Proportion of adults within 5-minute walk of greenspace (ii) Extent of green-blue land cover in urban areas Indicator information:
|
PE: Indicator quality assessment
|
Criterion |
Rating |
Explanation |
|
Relevance |
Moderate |
This indicator is rated moderate for relevance given the role of greenspace in emissions reductions and increasing climate resilience, alongside the benefits from greenspace access for individuals. It is also important to monitor whether new net zero developments are reducing greenspace access. |
|
Representativeness |
Moderate |
This indicator is rated moderate for representativeness given that it does not reflect the quality, safety nor accessibility of greenspace. Increases in greenspace may not be reflected in responses based on the ‘5-minute walking distance’ perimeter. Greenspace access inequities would support JT analyses, but this is subject to data availability e.g., by SIMD percentile. |
|
Data availability |
High |
This indicator is rated high for data availability given this data is collected annually in the Scottish Household Survey and the Ordnance survey. The two data sources are used in SNAP3 for annual reporting. |
|
PE8: Proportion of people who agree that the transition to net zero and climate resilience will support a more positive future for young people and future generations in Scotland. Indicator information:
|
PE8: Indicator quality assessment
|
Criterion |
Rating |
Explanation |
|
Relevance |
High |
This indicator is rated high for relevance given that an expansive JT has a strong component of intergenerational justice, that is, protecting the planet today for younger people and the generations of the future. This is an underlying driver of the transition to net zero and climate resilience. |
|
Representativeness |
Moderate |
This indicator is rated moderate for representativeness given that respondents could have varying understandings of what the transition means, or what a ‘more positive future’ entails. |
|
Data availability |
Moderate |
This indicator is rated moderate for data availability given that it depends on the annual commissioning of the Scottish Climate Survey. |
|
PE9: Level of adaptation action being taken by people in Scotland Indicator information:
|
PE9: Indicator quality assessment
|
Criterion |
Rating |
Explanation |
|
Relevance |
High |
This indicator is rated high for relevance given it directly focuses on ability to engage in climate change adaptation. |
|
Representativeness |
Moderate |
This indicator is rated moderate for representativeness. The ability to adapt to a changing climate will be impacted by a range of factors, from systemic inequalities through to perceived risk and information and knowledge access. While this indicator captures self-reported data at an individual household level, it does not reflect institutional action to support climate resilience, for example, at local authority level. |
|
Data availability |
Moderate |
This indicator is rated moderate for data availability given that it depends on the annual commissioning of the Scottish Climate Survey. |
|
PE10: Hospitalisations by heat Indicator information:
|
PE10: Indicator quality assessment
|
Criterion |
Rating |
Explanation |
|
Relevance |
High |
This indicator is rated high for relevance given it directly focuses on the distribution of impacts from climate change. |
|
Representativeness |
Moderate |
This indicator is rated moderate for representativeness given that it captures a health concern relating to climate change impacts and by attention to affected populations such as older adults. The data is modelled and will not necessarily reflect the increasing adoption of adaptation measures. |
|
Data availability |
High |
This indicator is rated high for data availability given that the dataset is developed by Public Health Scotland with plans for annual publication and further development. |
|
PE11: Proportion of householders with prior flood claims who can receive quotes from 5 or more insurers Indicator information:
|
PE11: Indicator quality assessment
|
Criterion |
Rating |
Explanation |
|
Relevance |
High |
This indicator is rated high for relevance given it directly focuses on issues of accessing solutions for climate change resilience and adaptation. |
|
Representativeness |
Moderate |
This indicator is rated moderate for representativeness given that it reflects availability of flood insurance for readily impacted households, which has already been monitored at 100%. As flooding becomes more frequent in a changing climate, availability of flood insurance could be at risk of decreasing. The indicator does not reflect the affordability of this insurance, who can/cannot access it nor whether it is taken up. |
|
Data availability |
High |
This indicator is rated high for data availability for the data is collected annually from Flood-Re for SNAP3 M&E. |
|
PE12: Proportion of people living in a flood risk area who report an inability to implement flood risk measures Indicator information:
|
PE12: Indicator quality assessment
|
Criterion |
Rating |
Explanation |
|
Relevance |
High |
This indicator is rated high for relevance given it directly focuses on issues of accessing solutions for climate change resilience and adaptation. |
|
Representativeness |
Moderate |
This indicator is rated moderate for representativeness given that it focuses directly on affected populations by flood risk, and on adaptation capabilities. The implementation of flood resilience at a household level is challenging and very costly. This indicator only focuses on flood risk and does not capture broader risks of climate change and adaptation. |
|
Data availability |
Moderate |
This indicator is rated moderate for data availability given that it depends on the annual commissioning of the Scottish Climate Survey. |
|
PE13: Premature deaths due to exposure to fine particulate matter (PM2.5) (number of premature deaths) Indicator information:
|
PE13: Indicator quality assessment
|
Criterion |
Rating |
Explanation |
|
Relevance |
High |
This indicator is rated high for relevance given the expected positive implications of net zero for reductions in air pollution and the distributed impacts of current pollution across Scotland. |
|
Representativeness |
Moderate |
This indicator is rated moderate for representativeness of JT concerns. Reductions in harmful pollutants is a benefit across Scotland. Suggested geographical and demographic breakdowns draw attention to potential inequities in exposure to polluted environments and subsequent health impacts, which should improve in the transition to net zero. The extent to which this is an issue in Scotland is to be determined once data is collected. |
|
Data availability |
Low |
This indicator is rated low for data availability as this indicator does not currently exist. Advice from Public Health Scotland suggests feasibility of development. |
Jobs, Skills and Economic Opportunities
|
JSEO1: Employment (full-time equivalent) in the Low Carbon and Renewable Energy Economy (LCREE) in Scotland Indicator information:
|
JSEO1: Indicator quality assessment
|
Criterion |
Rating |
Explanation |
|
Relevance |
High |
This indicator is rated high for relevance given it is specifically focused on job creation in the net zero, low carbon economy. |
|
Representativeness |
Moderate |
This indicator is rated moderate for representativeness. The dataset cannot be broken down by geographies, demographic groups nor specific sectors. Capturing who can and cannot access low carbon jobs is thus an important gap in this indicator. The indicator also does not reflect the quality of these jobs. The LCREE data are survey-based estimates based on a sample, and results from sample surveys are always estimates and not precise figures. |
|
Data availability |
High |
This indicator is rated high for data availability given that it is annually published as official statistics by the Office for National Statistics (ONS). |
|
JSEO2: Total employment in Energy (including in renewables) Indicator information:
|
JSEO2: Indicator quality assessment
|
Criterion |
Rating |
Explanation |
|
Relevance |
High |
This indicator is rated high for relevance given the role of the energy sector in Scotland’s economy, and the significance of the energy sector in the move towards net zero. |
|
Representativeness |
Moderate |
This indicator is rated moderate for representativeness. Monitoring energy employment throughout the transition matters in the Scottish context given expected job losses in fossil fuel energy sectors alongside expected job creation in renewable energy. As a major sector driving activity in the net zero transition in Scotland, this justifies directed attention. If energy employment declines over time, there is reasonable scope to infer that the fossil fuel energy industry employment is not being replaced by growing renewable energy jobs. This indicator does not distinguish between types of energy sectors, occupation nor quality of jobs. It focuses solely on energy and hence on just one part of the net zero economy. |
|
Data availability |
High |
This indicator is rated high for data availability for the data is annually collected as official statistics by the Scottish Government. |
|
JSEO3: Employment in forestry and marginal employment changes from woodland creation Indicator information:
|
JSEO3: Indicator quality assessment
|
Criteria |
Rating |
Explanation |
|
Relevance |
High |
This indicator is rated high for relevance given the role of land use change activities in net zero and climate resilience. |
|
Representativeness |
Moderate |
This indicator is rated moderate for representativeness. As the transition unfolds, woodland creation is an economic and emissions reductions opportunity. This indicator captures changes in woodland creation employment, but this is only one of many forms of ‘natural capital’ employment. Not all woodland creation will be for the purposes of net zero or climate adaptation (but all woodland creation will impact emissions). |
|
Data availability |
High |
This indicator is rated high for data availability given that marginal employment changes are calculated annually by Scottish Forestry. In addition, Scottish Forestry also conduct ad hoc research providing further detail into employment impacts. |
|
JSEO4: Low Carbon and Renewable Energy Economy (LCREE) estimated direct and indirect turnover Indicator information:
|
JSEO4: Indicator quality assessment
|
Criteria |
Rating |
Explanation |
|
Relevance |
High |
This indicator is rated high for relevance given its attention to economic turnover in the net zero, low carbon economy. |
|
Representativeness |
Moderate |
This indicator is rated moderate for representativeness given that it is based on businesses self-reporting activity across a bespoke set of 17 sectors defined by the Office for National Statistics (ONS). LCREE estimates are survey-based and gather information from a sample of businesses rather than the whole population, so are subject to measurable sampling uncertainty. |
|
Data availability |
High |
This indicator is rated high for data availability given that it is annually published as official statistics by the Office for National Statistics (ONS). |
|
JSEO5: Businesses with 10+ employees with (i) a climate strategy (ii) biodiversity strategy (iii) publishing an annual sustainability report Indicator information:
|
JSEO5: Indicator quality assessment
|
Criteria |
Rating |
Explanation |
|
Relevance |
High |
This indicator is rated high for relevance given it provides information about business knowledge, planning and action towards climate change and climate adaptation in a transitioning economy. |
|
Representativeness |
Low |
This indicator is rated low for representativeness. It reflects self-reported commitments towards actions on climate change and biodiversity by businesses, which implies a level of awareness, responsiveness and adaptation by businesses to a changing climate and economy. The Business Insights and Conditions Survey does not include every sector and reports on businesses of 10+ employees. This excludes smaller businesses including sole traders, who make up the majority of businesses in the Scottish economy (in Businesses in Scotland, Scottish Government, 2025g). The data is self-reported and does not reflect actual adaptation or decarbonisation actions. |
|
Data availability |
High |
This indicator is rated high for data availability given that it is annually available through the Business Insights and Conditions Survey. |
|
JSEO6: Number of people in Modern Apprenticeships reporting that their apprenticeship is in a ‘net zero or green sector’ (i) 3 months and (ii) 15 months after finishing Indicator information:
|
JSEO6: Indicator quality assessment
|
Criteria |
Rating |
Explanation |
|
Relevance |
High |
This indicator is rated high for relevance given the direct focus on net zero or ‘green’ sectors in relation to skills development through apprenticeship training underway. |
|
Representativeness |
Low |
This indicator is rated low for representativeness. The indicator focus is directly relevant to JT concerns in the transition to net zero. However, apprenticeships are only one of many training and education pathways. The sample size will be too small for the Scottish Government to gain insight into skills development, training and retraining underway in Scotland as a whole. Still, a steady increasing trend of apprenticeships in green sectors, alongside monitoring decreasing inequalities across demographic groups, can be considered a positive trend overall. |
|
Data availability |
High |
This indicator is rated high for data availability because the data is collected on a rolling basis by Skills Development Scotland. |
|
JSEO7: Trade union membership density in Scotland Indicator information:
|
JSEO7: Indicator quality assessment
|
Criteria |
Rating |
Explanation |
|
Relevance |
High |
This indicator is rated high for relevance given the importance of worker representation and participation in decision-making throughout the transition to net zero and climate resilience. Trade union representation and access are core characteristics of the fair work economy, in line with Scottish Government commitments. |
|
Representativeness |
Low |
This indicator is rated low for representativeness given it focuses on trade union membership density in Scotland as a whole, and not in specific sectors relating to the net zero and climate resilience transition. In addition, trade union membership does not ensure worker participation in transition decision-making. Attention to trade union access would support a more nuanced view. |
|
Data availability |
High |
This indicator is rated high for data availability as this is annually collected as official statistics by the UK Government. |
|
JSEO8: Proportion (%) of employees earning less than the Real Living Wage Indicator information:
|
JSEO8: Indicator quality assessment
|
Criteria |
Rating |
Explanation |
|
Relevance |
High |
This indicator is rated high for relevance given the importance of quality and fair work jobs in the low carbon economy in Scotland. The real living wage is a key characteristic of a fair work economy, in line with Scottish Government commitments. |
|
Representativeness |
Moderate |
This indicator is rated moderate for representativeness given that it is not broken down by sectors and specifically, net zero and climate adaptation employment. However, it remains representative of a JT given the economy-wide implications of the transition in Scotland, across sectors. |
|
Data availability |
High |
This indicator is rated high for data availability given it is annually collected by the Office for National Statistics (ONS). |
|
JSEO9: The difference between male and female full-time hourly earnings in the transport sector (SIC H: Transportation and storage) Indicator information:
|
JSEO9: Indicator quality assessment
|
Criteria |
Rating |
Explanation |
|
Relevance |
High |
This indicator is rated high for relevance given the opportunity for increased pay equity in net zero and climate adaptation related sectors (as a key dimension of fair work), including transport. This indicator was identified in the Draft Transport JT Plan (2025). |
|
Representativeness |
Moderate |
This indicator is rated moderate for representativeness. It does not capture sub-sectoral categories of high emissions and low emissions transport, yet trends should highlight changes in the gender pay gap in transport overall. These can be contextualised within progress towards emissions reductions across sectors. |
|
Data availability |
High |
This indicator is rated high on data availability for it is annually collected by the Office for National Statistics (ONS). |
|
JSEO10: The difference between male and female full-time hourly earnings in the energy sector (SIC B: Mining and Quarrying; SIC D: Electricity, Gas, steam and air conditioning supply). Indicator information:
|
JSEO10: Indicator quality assessment
|
Criteria |
Rating |
Explanation |
|
Relevance |
High |
This indicator is rated high for relevance given the opportunity for increased pay equity in net zero and climate adaptation related sectors (a key dimension of fair work), including energy. |
|
Representativeness |
Moderate |
This indicator is rated moderate for representativeness given that current SIC code sectoral breakdowns for energy do not capture the full set of changing and new energy activities as a result of net zero. |
|
Data availability |
High |
This indicator is rated high for data availability for it is annually collected by the Office for National Statistics (ONS). |
|
JSEO11: The difference between male and female full-time hourly earnings in the construction sector. [SIC F: Construction] Indicator information:
|
JSEO11: Indicator quality assessment
|
Criteria |
Rating |
Explanation |
|
Relevance |
High |
This indicator is rated high for relevance given the opportunity for increased pay equity in net zero and climate adaptation related sectors (a key dimension of fair work), including construction. |
|
Representativeness |
High |
This indicator is rated high for representativeness given the expected activity in relation to buildings and construction as part of the transition to net zero and climate resilience. |
|
Data availability |
High |
This indicator is rated high for data availability given that it is annually collected by the Office for National Statistics (ONS). |
|
JSEO12: The difference between male and female full-time hourly earnings in the agriculture sector (SIC A: Agriculture, forestry and fishing) Indicator information:
|
JSEO12: Indicator quality assessment
|
Criteria |
Rating |
Explanation |
|
Relevance |
High |
This indicator is rated high for relevance given the opportunity for increased pay equity in net zero and climate adaptation related sectors (a key dimension of fair work), including in agriculture and land use. |
|
Representativeness |
Moderate |
This indicator is rated moderate for representativeness given that current Sectoral Industrial Classification (SIC) breakdown does not capture sub-sectoral categories of land use change relating to net zero and climate resilience activities. |
|
Data availability |
High |
This indicator is rated high on data availability for it is annually collected by the Office for National Statistics (ONS). |
|
JSEO13: (i) Number of renewable energy supply chain businesses in Scotland. (ii) Proxy: £ value of ScotWind projects committed to Scottish-based suppliers Indicator information:
|
JSEO13: Indicator quality assessment
|
Criteria |
Rating |
Explanation |
|
Relevance |
High |
This indicator is rated high for relevance given that the creation of renewable energy supply chain businesses in Scotland is a key opportunity for distributed benefit from the net zero transition. |
|
Representativeness |
Low |
This indicator is not currently available. The recommended proxy is rated low for representativeness. ScotWind offshore wind project supply chain commitments do not cover all supply chain activity in Scotland, do not represent all renewable energy activity Scotland, nor do they provide detail on business creation and growth. However, as an important energy development with recognised implications in Scotland, it serves as an interim proxy on whether economic opportunities from renewable energy are distributed across the Scottish economy. |
|
Data availability (proxy) |
Moderate |
The proxy indicator is rated moderate for data availability given that it is collected by Crown Estate Scotland through developer supply chain commitments. |
|
JSEO14: (i) Business resilience and ability to adapt to climate change and the transition (ii) Proxy (in the CCP, 2026): Proportion of small businesses in Scotland reporting the level of energy prices as an obstacle. Indicator information:
|
JSEO14: Indicator quality assessment
|
Criteria |
Rating |
Explanation |
|
Relevance |
High |
This indicator is rated high for relevance given the need to understand to what extent businesses in Scotland are resilient to climate change, and whether they are benefiting from or being negatively impacted by net zero. |
|
Representativeness |
Low |
This indicator is not available. The proxy indicator focused on small businesses reporting energy costs as an obstacle to their business is rated low for representativeness. A wide range of factors could be affecting energy prices and business success at different points in time, which makes it challenging to trace this back to the net zero transition itself. The potential impact on energy prices is just one of many ways in which small businesses may be affected by the net zero transition. |
|
Data availability (proxy) |
High |
The proxy indicator is rated high for data availability given that the data is annually collected in the Scotland Small Business Survey. |
|
JSEO15: Number of workers experiencing redundancy in high emitting industries in Scotland receiving support/ reporting that their employers are implementing transition plans for workers Indicator information:
|
JSEO15: Indicator quality assessment
|
Criteria |
Rating |
Explanation |
|
Relevance |
High |
This indicator is rated high for relevance given the implications of the transition to net zero for high emitting industries and their workforce. |
|
Representativeness |
High |
This indicator is rated high for representativeness, Managed, supported transitions for workers in high emitting industries is a core pillar of a JT, and the recommended survey should cover workers across high emitting sectors and in a range of occupations. |
|
Data availability |
Low |
This indicator is rated low for data availability because data is currently non-existent. |
|
JSEO16: High emitting industry worker participation in decisions affecting them Indicator information:
|
JSEO16: Indicator quality assessment
|
Criteria |
Rating |
Explanation |
|
Relevance |
High |
This indicator is rated high for relevance given the implications of the transition to net zero for high emitting industries and their workforce. |
|
Representativeness |
High |
This indicator is rated high for representativeness given that managed, supported and negotiated worker transitions driven by participatory processes are key to delivering a JT. The recommended survey should cover workers across high emitting sectors and in a range of occupations. |
|
Data availability |
Low |
This indicator is rated low for data availability because data is currently non-existent. |
|
JSEO17: Sense of uncertainty/ confidence in the transition amongst workers in high emitting industries Indicator information:
|
JSEO17: Indicator quality assessment
|
Criteria |
Rating |
Explanation |
|
Relevance |
High |
This indicator is rated high for relevance given the implications of the transition to net zero for high emitting industries and their workforce. |
|
Representativeness |
Moderate |
This indicator is rated moderate for representativeness. In a context of industrial change, including at times, site closure and redundancies, the sense of uncertainty and confidence in the transition should to some extent, reflect ongoing experiences with the transition and whether assurances and support are in place. |
|
Data availability |
Low |
This indicator is rated low for data availability because data is currently non-existent. |
Environment and Biodiversity
|
EB1: Emissions of the eight priority Air Quality pollutants (ammonia, carbon monoxide, nitrogen oxides, non-methane volatile organic compounds, particulate matter, sulphur dioxide and lead) for Scotland and by industrial sector Indicator information:
|
EB1: Indicator quality assessment
|
Dimension |
Rating |
Explanation |
|
Relevance |
Moderate |
This indicator is rated moderate for relevance given the expected impact of net zero actions on air pollutants and the implications this has for the future health of people and planet. |
|
Representativeness |
Moderate |
This indicator is rated moderate for representativeness given that air pollution has direct impacts on health across the population. The breakdown by industrial sector enables a degree of attention to where emissions are falling and which ones remain. However, the indicator does not show disproportionate impacts of air pollution on different groups or places, nor the distribution of responsibility for these emissions. Air quality in the UK is not just affected by emissions included in the National Atmospheric Emissions Inventory but also by secondary formation of air pollutants, emissions originating from outside the UK and geographical and meteorological factors. |
|
Data availability |
High |
This indicator is rated high for data availability given it is annually collected by the National Atmospheric Emissions Inventory. |
|
EB2: Improvements to water quality across types in Scotland Indicator information:
|
EB2: Indicator quality assessment
|
Dimension |
Rating |
Explanation |
|
Relevance |
High |
This indicator is rated high for relevance given that the transition to net zero should directly see decreases in water quality pollution from across industries (like fossil fuels and agriculture) but could also create risks to water sources (e.g., through wind farm installation). Annex 2 in the Draft CCP (Scottish Government, 2025i) also identified increased flood risk as posing risks to water quality. |
|
Representativeness |
Moderate |
This indicator is rated moderate for representativeness given that water quality in Scotland is key for healthy populations and ecosystems. However, the indicator does not capture where or by whom the risks and benefits of decreasing/increasing water quality are being felt because of net zero or climate adaptation interventions. |
|
Data availability |
High |
This indicator is rated high for data availability given it is annually collected by SEPA. |
|
EB3: Scotland’s carbon footprint expressed in million tonnes of carbon dioxide equivalent per year Indicator information:
|
EB3: Indicator quality assessment
|
Dimension |
Rating |
Explanation |
|
Relevance |
High |
This indicator is rated high for relevance given the role of embodied emissions in the move towards net zero and the focus of carbon footprint measurements on consumption emissions. Consumption emissions are those associated with the spending of Scottish residents on goods and services, wherever in the world these emissions arise, alongside emissions directly generated by Scottish households through private heating and motoring (Scottish Government, 2025j). This is different to reporting on the greenhouse gas emissions produced within a country’s territory (UK Government, 2026). |
|
Representativeness |
Moderate |
This indicator is rated moderate for representativeness given the implications of consumption, resource use and embodied emissions for a JT in relation to planetary boundaries. The indicator does not monitor the distribution of harm nor responsibility for Scotland’s carbon footprint. It also cannot reflect why the footprint is increasing/ falling. |
|
Data availability |
High |
This indicator is rated high for data availability given it is annually collected by the Scottish Government and trend data is available since 1998. |
|
EB4: Global biodiversity impact (Measures the effect of Scotland’s resource use on biodiversity domestically and abroad) Indicator information:
|
EB4: Indicator quality assessment
|
Dimension |
Rating |
Explanation |
|
Relevance |
Moderate |
This indicator is rated moderate for relevance given that the net zero transition will have indirect impacts on resource use. The biodiversity crisis is a key planetary boundary with implications for climate resilience more broadly.
|
|
Representativeness |
Moderate |
This indicator is rated moderate for representativeness given that the dynamics of resource use, emissions reductions and net zero are uncertain. |
|
Data availability |
Low |
This indicator is rated low for data availability. The indicator is taken from the Circular Economy Strategy (Scottish Government, 2026d). The Material Flow Accounts data is collected by Zero Waste Scotland, but data for this indicator currently unavailable. Frequency of data collection is currently unknown. |
|
EB5: Soil sealing Indicator information:
|
EB5: Indicator quality assessment
|
Dimension |
Rating |
Explanation |
|
Relevance |
Moderate |
This indicator is rated moderate for relevance given that the negative impacts of soil sealing on soil health can limit the potential benefits of healthy soils relating to water filtration and flood risk mitigation. Net zero developments like wind farms can have direct impacts on levels of soil sealing. |
|
Representativeness |
Moderate |
This indicator is rated moderate for representativeness given that the indicator does not show where or why soil is being sealed. The trade-offs between impacts on soil health for climate resilience versus the installation of a wind farm, for example, are uncertain. This indicator can be regarded alongside indicator EB6 on regeneration of vacant/derelict urban land. |
|
Data availability |
Moderate |
This indicator is rated moderate for data availability as data is collected by NatureScot from analysis of Ordnance Survey Mastermap data and NatureScot records of windfarm sites. There is historical data from 2009 to 2020, which was published in 2023. |
|
EB6: Regeneration of vacant / derelict urban land (% of which is regenerated through environmental restoration, for climate adaptation and by net zero initiatives) Indicator information:
|
EB6: Indicator quality assessment
|
Dimension |
Rating |
Explanation |
|
Relevance |
High |
This indicator is rated high for relevance given that environmental restoration of vacant and derelict land directly supports JT outcomes and has implications for climate resilience.
|
|
Representativeness |
Moderate |
This indicator is rated moderate for representativeness given that the currently available data maps known sites of derelict urban land alongside action being taken. Further analysis is needed to understand what type of site regeneration is underway (e.g., environmental) and whether this is supported by net zero projects. Qualitative case studies and engagement with energy developers on regeneration initiatives may be a useful source of detail on activity underway. |
|
Data availability |
Low |
This indicator is rated low for data availability. Although data is published by the Scottish Land Commission it is unclear whether it can be accessed and analysed to monitor this indicator. |
|
EB7: Number of hectares of newly protected land and marine features across Scotland Indicator information:
|
EB7: Indicator quality assessment
|
Dimension |
Rating |
Explanation |
|
Relevance |
High |
This indicator is rated high for relevance given the importance of environmental restoration for JT. Better protected land and marine areas will be more resilient to climate change impacts. |
|
Representativeness |
Moderate |
This indicator is rated moderate for representativeness given that measures of protection and restoration not covered by this dataset will not be reflected in the indicator. |
|
Data availability |
Moderate |
This indicator is rated moderate for data availability given that frequency of data updates is still to be decided (as assessed in the SNAP3 M&E framework, (Scottish Government, 2024a, p. 40). |
|
EB8: Carbon and social footprint of materials used for net zero developments in Scotland Interim proxy: Carbon Intensity of Materials: indicates whether a nation is consuming more sustainable alternatives, independent of trends in overall greenhouse gas impact. Indicator information:
|
EB8: Indicator quality assessment
|
Dimension |
Rating |
Explanation |
|
Relevance |
High |
This indicator is rated high for relevance given that net zero developments like renewable energy projects will have embodied, social and environmental impacts and emissions. These span from material extraction for technological and project development through to waste once projects are decommissioned.
|
|
Representativeness |
Low |
This indicator in unavailable. The proxy indicator is rated low for representativeness given that while it provides an overall picture of trends in the carbon footprint of materials used in Scotland, it cannot distinguish by sectors. |
|
Data availability (proxy) |
Low |
The proxy indicator is rated low for data availability. The indicator is taken from the Circular Economy Strategy (2026). The Material Flow Accounts data is collected by Zero Waste Scotland, but data for this indicator currently unavailable. Frequency of data collection is currently unknown. |
The following table illustrates the breakdown of the four outcomes into more granular focus areas. These were used as prompts during the workshop held on the 17 November 2025 and in semi-structured interviews, to stimulate discussion about possible indicators.
|
Theme and Outcome |
Potential focus areas for indicators, as directly relates to the process and outcome of net zero and climate adaptation: |
|
Communities and Places |
Locally and in relation to Scotland as a whole. |
|
People and Equity |
With particular attention to affected and disadvantaged households and places, from a financial and a spatial lens. |
|
Jobs, Skills and Economic Opportunities |
With particular attention to affected sectors and groups, alongside risks and opportunities for businesses and economic health more broadly. |
|
Environment and biodiversity |
|
Table 1 (Appendix D): Four JT outcomes and focus areas, prompts for discussion.
The four outcomes include indicators for which data is currently not available. These indicators represent key areas of JT concern. Stakeholder engagement and desk-based research have helped to identify possible avenues for further refinement and data collection. These indicators, their relevance for a JT in Scotland and possible avenues for data collection are expanded on below, categorised by outcome.
Communities and Places (indicators CP9-CP12)
CP9: Engagement experiences of the fishing sector with offshore energy developments
The fishing sector is experiencing cumulative pressures in part, because of the energy transition. This includes from marine surveying, subsea cable developments and the installation of offshore wind farms. Fishers face high levels of uncertainty regarding the cumulative impact of developments, both due to varying timelines for different projects and uncertainties around the long-term impacts of offshore energy production on the marine environment. The fishing sector is small in capacity and resource in comparison to large scale offshore wind developers, creating hierarchies of power and influence over decision-making. Often, the just-ness of engagement and decision-making processes depend on each individual developer’s approach. This project has not found quantitative data able to communicate this complexity. The recommendation is for the Scottish Government to monitor a qualitative indicator informed by iterative stakeholder engagement with key fisheries representatives (e.g. Regional Inshore Fisheries Group and others). Various forums involving marine stakeholders and the Scottish Government readily exist and could be a possible avenue for qualitative data collection.
CP10: Distribution of marine space across activities, including % available for fishing
Fishing stakeholders often refer to the experienced ‘spatial squeeze’ by the sector. This refers to the accumulating pressures of new blue economy activities, environmental protection and others and the overlap with – and shrinking of – traditional fishing grounds. Stakeholder insights suggested that potentially relevant indicators like ‘employment in fishing’ will be influenced by too many variables beyond the transition to net zero to be useful for JT M&E. However, monitoring available marine space for fishing over time should be able to increase understandings of ongoing spatial trade-offs in the marine environment, including in direct relation to fishing. The Scottish Government’s Marine Directorate publish an interactive website illustrating the distribution of marine space in Scotland. These visual maps are informed by backend data which could support trend analysis regarding % change in marine space available for fishing over time.
CP11-12: Land use change for net zero and climate resilience: ‘natural capital’ engagement processes, participation and distributed benefits
Research on the types of land use change activities and their implications as part of the transition to net zero and climate resilience illustrated the challenges of defining and monitoring these from a JT perspective. Stakeholders explained the difficulties in setting boundaries around the term ‘natural capital’ and what interventions do/ do not fall into the scope of net zero and climate adaptation efforts. Woodlands may be created for carbon offsetting purposes, for example, for social uses or for other economic productive uses like timber production or tourism; all of which could be considered ‘natural capital’. In addition, many of the benefits from natural capital are considered public goods. In this context, indicators CP11 and CP12 focus on issues of ownership and socio-economic benefits, based on insight from stakeholder discussions and identified avenues to trial data collection. Project ownership will largely be conditioned by land ownership. The benefits and costs of owning woodland creation or peatland restoration as a community will likely differ from those of community owned energy. This suggests the need for continued research in this area. Engagement key stakeholders such as Community Land Scotland and their Natural Capital Community Partnerships project will be important to better understand the implications of these projects from a JT perspective. This can enable qualitative data collection for monitoring alongside refinement of land use change JT indicators.
People and Equity (indicator PE13)
PE13: Premature deaths due to exposure to fine particulate matter (PM2.5)
This indicator draws attention to improved air quality and the health implications of existing pollution levels for Scotland, across different groups and in the most deprived areas. This indicator is available in England (Department of Health and Social Care, n.d.). It reflects distributional justice concerns associated with the unequal distribution of negative impacts from environmental pollution in the current, high carbon economy. This unequal distribution should be addressed throughout the transition to a low carbon one (Farrell, 2012; Shen et al. 2020; Sun et al. 2024). This includes attention both to the geographical distribution of premature deaths by air pollution, to different demographic groups and by levels of deprivation across Scotland. Drabble et al. (2024) included various indicators focused on the spatial distribution of pollution exposure (see p.26, p.28, p.42, p.46). Although this data is not published in this form at present, engagement with Public Health Scotland advised that the development of this indicator would be feasible.
Jobs, Skills and Economic Opportunities (indicators JSEO13 – JSEO17)
JSEO13: Number of renewable energy supply chain businesses in Scotland.
The development of a domestic renewable energy industry has been identified by the Scottish Government as a key economic opportunity from net zero for Scotland (e.g., in the Green Industrial Strategy, Scottish Government, 2024c). The growth of existing supply chain businesses in Scotland and development of new ones as renewable energy is installed would reflect a level of distributed benefit, in contrast with the UK experience with onshore wind in the 20th century (Smith, 2011; Brunt and Spooner, 1998). This indicator is not currently developed. Using UK SIC codes, the Scottish Government could first, identify sectors under which renewable energy supply chain activity would be categorised. It could then monitor business growth and business startups in these sectors, to assess whether there is a developing renewable energy supply chain.
Proxy: £ value of ScotWind projects committed to Scottish-based suppliers
The proxy indicator was identified with support from Scottish Government analysts. It is focused solely on ScotWind, the offshore wind leasing rounds led by Crown Estate Scotland. While offshore wind is not representative of the full renewable energy supply chain, the scale and breadth of expected offshore wind projects justify its use as a proxy (Crown Estate Scotland, n.d.). Developers bidding in ScotWind leasing rounds are required to detail their supply chain spend plans in Scotland. This is a suggested avenue for data collection.
JSEO14: Business resilience and ability to adapt to climate change and the transition
Businesses across Scotland will be affected by climate change and will need to adapt to these changes. They will also be affected by the transition to net zero and may benefit from or be harmed by related impacts. The evidence review alongside stakeholder engagement has highlighted an evidence gap regarding the vulnerabilities, risks and opportunities faced by different business types and scales in Scotland, in the context of climate change and the net zero transition. There are a variety of available, regularly updated data sources about businesses in Scotland (including: the Scottish Annual Business Statistics, Small Business Survey Scotland and Business Insights and Conditions in Scotland, amongst others). While some of these surveys ask businesses about climate change impacts or adaptation measures, this data is currently insufficient to convey business transition, vulnerability, risk and opportunity pathways from a JT perspective.
Proxy: Proportion of small businesses in Scotland reporting the level of energy prices as an obstacle
It is important for the Scottish Government to understand the ways in which energy prices are affecting business success. The proposed framework includes the JT indicator which was included in the CCP (2026) as a proxy. However, business energy costs may be affected by many variables, and is only one of a suite of dimensions reflecting business vulnerability and resilience to climate change and the transition. In addition, engagement with Scottish Government industry analysts suggested there are limited surveys for data collection on sole traders. Sole traders make up over 70% of Scottish businesses (in Businesses in Scotland, Scottish Government, 2025g). This suggests a clear opportunity for targeted data collection on the impacts and experiences of climate change and the transition across business types and scales.
JSEO15-17: Indicators relating to worker transitions
Evidence collected throughout this project has spotlighted the lack of data available/ accessible to understand ongoing industrial transitions and the processes, impacts and experiences of the workforce. Employment and skills development indicators included by Drabble et al. (2024) in their framework already highlighted this data gap, given that data could not be categorised e.g., by specific sectors. The framework proposed by this project includes indicators focused on support and participation experiences alongside a broader sense of uncertainty amongst high emitting industry workers. It recommends the development of a targeted survey alongside qualitative methods to understand what is happening in transitioning industrial sites on the ground. Stakeholders such as STUC recognised the challenges of reaching many workers, particularly those working offshore. Suggested methods include in person surveying in key sites of mobility, such as, for instance, Aberdeen Airport. All three indicators (JSEO15-17) can be supported with qualitative case study and experience data from key stakeholders such as STUC, who are involved in day-to-day experiences on the ground. This new data collection could be complemented with case study data from (i) workers accessing the Oil and Gas Transition Training Fund, (ii) workers experiencing redundancy in Grangemouth accessing skill support, and (iii) any other initiatives by Scottish Government to support managed transitions away from high emitting industries.
Environment and Biodiversity (indicator EB8)
EB8: Carbon and social footprint of materials used for net zero developments in Scotland
This indicator recognises that infrastructure developed for the purposes of net zero will also have social and environmental impacts. These impacts are spread throughout renewable energy technology and projects’ supply chains and lifecycles, from material extraction through to decommissioning and waste. This indicator targets responsible renewable energy developments and addresses procedural risks of greenwashing renewable energy production. Developers are increasingly conducting social and environmental lifecycle assessments as part of their project planning applications. The Scottish Government could explore the extent to which this data is accessible and collatable as a starting point for indicator data collection and monitoring. This data would allow for better understanding of net zero developments in Scotland at local and global scales, including the risks of offshored injustice (e.g., Healy et al. 2019).
This appendix details how this framework relates to existing JT indicators in the CCP (2026), the Grangemouth Industrial JT Plan and draft sectoral JT plans. Detailed attention is awarded to the JT indicators in the CCP (2026) given that it is the first Scottish Government publication to include a set of JT indicators for Scotland within statutory annual reporting.
Climate Change Plan (2026)
The CCP (2026) includes 12 JT indicators. This project developed in parallel to proposals for JT indicators in the Draft CCP (2025). However, this framework’s development process was separate. The proposed framework has parallels with, and at times departs from the JT indicators published in the CCP (2026). Table 1 below presents indicators in the CCP (2026) (Scottish Government, 2026e, p. 14) which are not included in the outcome indicator list in the proposed framework and provides a brief explanation as to why.
|
JT indicator in CCP |
Explanation |
|
Employment rate for people aged 16-64 in five local authorities with high socioeconomic dependence on oil and gas industries: (i) Aberdeen City; (ii) Aberdeenshire; (iii) Falkirk; (iv) Shetland Islands; and (v) Orkney Islands |
This is not in the full outcomes list in the JT M&E framework because it is part of the proposed hotspots approach. |
|
Proportion of households reporting that they are managing well financially in three local authorities with a high proportion of employment in oil and gas industries: (i) Aberdeen City, (ii) Aberdeenshire, and (iii) Falkirk |
This is not in the full outcomes list in the JT M&E framework because it is part of the proposed hotspots approach. |
|
Number of recipients of the Oil and Gas Transition Training Fund joint Scottish Government and UK Government initiative |
This indicator is removed from the proposed M&E framework. It is deemed too specific for a national JT M&E framework. It is more clearly policy-oriented than outcome focused. This indicator could support improved, case specific understanding of the transition in the northeast of Scotland, where the Transition Training Fund is being implemented. It could also support causal evaluations of place-based change alongside the articulation of mechanisms (not included in this report). |
Table 1 (Appendix E): JT indicators in the CCP (2026) not amongst the outcome indicators of this JT M&E framework.
Draft sectoral JT plans and the Grangemouth Industrial JT Plan
This project has delivered an M&E framework at a Scotland level and is thus less focused on granular assessment of the JT in the four net zero sectors identified by Scottish Government (energy, transport, agriculture and land use, buildings and construction). Similarly, the indicators in the Grangemouth Industrial JT Plan are directly relevant to the place and site-specific transition underway in the Grangemouth industrial cluster and will not apply to all transitions underway in Scotland as a whole.
The Jobs, Skills and Economic Opportunities outcome in the proposed framework includes fair work indicators. These focus on gender pay gap for energy, agriculture and land use, transport and buildings and construction. This selection was informed by indicators in the Draft Transport JT Plan (2025) and insight from the Fair Work Convention Secretariat. Additional sectoral breakdowns for other indicators in the Jobs, Skills and Economic Opportunities outcome (such as for trade union density/ access, or green jobs) are not possible with currently available data.
Some JT indicators relevant in the Grangemouth industrial cluster context (such as access to greenspace, attention to derelict sites or satisfaction with opportunities to influence decisions) are also reflected in indicators across the four outcomes in the proposed M&E framework. More broadly, draft sectoral JT plans, the Grangemouth Industrial JT Plan and their indicators were reviewed as evidence to inform this framework.
|
H |
Indicator (reported on per selected local authority) |
Desired trend (contextualised per hotspot) |
Data source |
Rationale |
|
H1 |
Employment rate for people aged 16-64 across Scotland |
Increasing |
Employment trends in hotspots are a key indicator of the workforce’s activity and mobility, both in places of industrial change/decline and in locations hosting large-scale net zero developments. | |
|
H2 |
Unemployment rate for people aged 16-64 across Scotland |
Decreasing |
Unemployment trends provide nuanced insight into changing employment patterns, often reflecting mobility challenges. Combined attention to employment and unemployment is inspired by Shapovalova et al. (2023). | |
|
H3 |
Number of people Not in Employment and Education or Training (16-19) |
Decreasing |
This indicator reflects a lack of engagement with available opportunities, by younger generations in sites of transition. An increasing trend draws attention to whether opportunities are available at all. It can highlight concerning transition dynamics in sites of industrial change and in contrast to pre-transition levels. | |
|
H4 |
Number of people in Modern Apprenticeships reporting that (i) their apprenticeship is in ‘green skills’/for the net zero economy’ during, 3-month and 15 months after finishing their apprenticeship and of these, (ii) number of people staying to work in their same Local authority. |
Increasing |
Although modern apprenticeships are just one of many education pathways, this indicator will reflect levels of training/retraining opportunities in ‘green skills’ in hotspot locations. | |
|
H5 |
Population change (with attention to in-out migration) |
Monitor |
Population changes capture multi-dimensional distributional burdens and opportunities in sites of transition over time. For example, this may include: depopulating areas due to industrial closure or large-scale industrialisation for energy production, or inward-migration due to employment creation as a result of transition interventions. | |
|
H6 |
Business activity/ survivability: Business birth and death rates |
Monitor, increasing survivability |
Scottish Government – Sub-Scotland Economic Statistics Database |
Levels of business birth and death are one way to monitor economic activity in a particular area. These data points can serve as an early signal of changing opportunities in a local economy, including highlighting risks of economic decline. |
|
H7 |
Sectoral economic dependence/diversification:
Contextualised within broader economic trends per local authority. |
Monitor |
Economic diversification was identified as an objective in the Scottish Government’s National Strategy for Economic Transformation (2022) and was identified by the JTC as a key strategic dimension of a JT (Just Transition Commission, 2024, p. 14). Sectoral clustering creates innovation and productivity benefits but also increases potential exposure to sector-specific shocks. This indicator supports monitoring of changing economic patterns in hotspots. However, ‘Economic diversification’ does not necessarily demonstrate either resilience or a JT. The Scottish Government should contextualise this indicator within broader economic trends per local area, and the insight from relevant teams and stakeholders. | |
|
H8 |
Proportion of households reporting that they are managing well financially |
Increasing |
This indicator provides annual data on felt financial wellbeing by households. It will be particularly relevant to monitor a sense of financial wellbeing on an annual basis in places experiencing industrial change. | |
|
H9 |
Median house price by Local Authority |
Monitor |
This indicator captures potential knock-on effects on house prices from changing land use in sites of transition. This may include the installation of energy infrastructure or natural capital projects. | |
|
H10 |
People reporting that they can afford their individual transport costs |
Increasing |
Through annual data, this indicator provides a frequent update on felt transport costs across households in sites of transition. In the case of net zero developments these are often rural and island areas with complex transport realities. | |
|
H11 |
Proportion of adults within 5-minute walk of greenspace |
Increasing |
This indicator monitors greenspace levels in places that will host net zero developments. This includes qualitative attention to reduced greenspace access from these developments (e.g., the Energy Transition Zone using part of St. Fitticks Park in Aberdeen. St Fitticks Park is in Torry, one of the more deprived areas of Aberdeen according to SIMD). | |
|
H12 |
Operational capacity of community and locally owned energy installations in Scotland. Include breakdown (i) by type of ownership (ii) by location and (iii) as a proportion of total renewable energy installed in local area. |
Increasing |
This indicator captures the multi-dimensional features of transitions given that sites of industrial change may also see community ownership developments. Hotspots of net zero transitions may see projects developing owned by a variety of different stakeholders. While community owned energy is identified as desirable from a JT perspective in Scotland, monitoring this in a hotspot context also enables qualitative attention to the benefits and potential harms of this type of ownership as well. | |
|
H13 |
Area of community- owned assets (in hectares) |
Increasing |
This indicator captures the multi-dimensional features of transitions given that sites of industrial change may also see community ownership developments. Community ownership of assets beyond energy also signals to opportunities to access transition opportunities beyond energy, alongside community wealth building and empowerment more broadly. | |
|
H14 |
Community benefits from energy (and for natural capital projects, once available) |
Increasing |
This indicator captures the multi-dimensional features of transitions. Sites of industrial change may also be hosting renewable energy developments making community benefit payments. In net zero development contexts this should increase alongside increasing renewable energy projects. This indicator will not, however, tell the Scottish Government the impact nor local acceptance of these benefits. Engagement with local stakeholders will provide nuanced insight through a JT lens. | |
|
H15 |
Number of hospitalisations due to alcohol use |
Decreasing |
This indicator is included as an early warning sign of deprivation in contexts of industrial change. It is taken directly from Shapovalova et al. (2023). | |
|
H16 |
Number of drug use hospitalisations |
Decreasing |
This indicator is included as an early warning sign of deprivation in contexts of industrial change. It is taken directly from Shapovalova et al. (2023). | |
|
H17 |
Worker participation in industrial change processes |
Increasing |
N/A |
Worker participation in industrial change processes is core to a JT, and hence directly relevant to hotspots of industrial change. Data is currently unavailable. Data collection through surveys and engagement with stakeholders like STUC is recommended. |
|
H18 |
Number of premature deaths by particulate matter (PM2.5) |
Decreasing |
N/A |
This indicator is included for both sites of industrial change and net zero developments. Decreasing emissions should decrease pollution in industrial sites, and inhabitants in these places may have also had higher historical exposure to pollutants. Increasing premature deaths by PM2.5 particulate matter in hotspots of net zero developments would be a clear warning sign of unexpected transition developments/ stagnant transitions. |
|
H19 |
Fuel poverty |
Decreasing |
Scottish House and Condition Survey By Local Authority – every 3 years |
This indicator monitors fuel poverty, which captures energy inequities affected by a complex array of factors. Fuel poverty could increase in areas experiencing industrial change while exacerbating felt injustices in locations hosting renewable energy production. Its inclusion also reflects the multi-dimensional aspect of transitions given that places potentially seeing negative consequences may simultaneously see e.g., falling levels of fuel poverty. |
|
H20 |
Proportion of people who agree that the transition to net zero and climate resilience will support a more positive future for young people and future generations in Scotland |
Increasing |
Scottish Climate Survey (proposed addition from Autumn 2026) By Local Authority – Every 3 years |
This indicator provides high level overview of perceptions of the transition by and for younger people in places directly witnessing transition impacts. This indicator is only available at local authority level every three years. |
|
H21 |
Proportion of people in Scotland reporting satisfaction with opportunities to influence (i) the Scottish Government’s approach to delivering net zero, and (ii) local policy and planning decisions relating to net zero |
Increasing |
Scottish Climate Survey (proposed addition from Autumn 2026) By Local Authority – Every 3 years |
This indicator captures the sense of influence over national and local policy relating to the transition. This is a key dimension of the JT for Scotland and directly relevant in places seeing targeted interventions and experiencing change. This indicator is only available at local authority level every three years. |
|
H22 |
Proportion of people in Scotland reporting satisfaction with opportunities to influence net zero and climate adaptation developments happening in their local area |
Increasing |
Scottish Climate Survey (proposed addition from Autumn 2026) By Local Authority – Every 3 years |
This indicator captures the sense of influence over net zero and climate adaptation projects in hotspots. This is a key dimension of the JT for Scotland and directly relevant in places seeing targeted interventions and experiencing change. It is directly relevant for net zero development hotspots and may also be relevant in hotspots of industrial change. This indicator is only available at local authority level every three years. |
|
H23 |
The proportion of people reporting that changes to their local place due to net zero infrastructure and/or land use change have maintained or improved the quality of their local area |
Increasing |
Scottish Climate Survey (proposed addition from Autumn 2026) By Local Authority – Every 3 years |
This indicator monitors mid-term experiences of change in sites of transition. It is directly relevant to net zero hotspots and may be relevant in industrial hotspots. It does not reflect the reasons for improved quality nor a breakdown by respondents. This indicator is only available at local authority level every three years. |
How to cite this publication:
Santos Ayllón, L. M., Jenkins, K. E. H., (2026) ‘Monitoring a Just Transition to a net zero and climate resilient Scotland’, ClimateXChange. DOI:
© The University of Edinburgh, 2026
Prepared by The University of Edinburgh on behalf of ClimateXChange, The University of Edinburgh. All rights reserved.
While every effort is made to ensure the information in this report is accurate as at the date of the report, no legal responsibility is accepted for any errors, omissions or misleading statements. The views expressed represent those of the author(s), and do not necessarily represent those of the host institutions or funders.
This work was supported by the Rural and Environment Science and Analytical Services Division of the Scottish Government (CoE – CXC).C
ClimateXChange
Edinburgh Climate Change Institute
High School Yards
Edinburgh EH1 1LZ
+44 (0) 131 651 4783
These themes were also referred to in the Draft CCP (2025), though they do not feature in the final CCP (2026). ↑
These four ‘themes’, now widely used across Scottish Government JT policy, are different in focus and definition to four ‘themes’ in the National JT Planning Framework (2021). The latter have not been returned to since. ↑
The National Performance Framework for Scotland is currently archived and under review. ↑
The draft Energy Strategy and JT Plan (2023) refers to the eight national JT outcomes in its Annex F to translate them into energy sector outcomes. ↑
The four themes are not referred to in the final CCP (2026). ↑
Some indicators such as ‘employment’, for example, were removed from the full outcome indicator list and integrated into the hotspots monitoring approach instead. ↑
With ‘net zero infrastructure and/or land use change’ this report refers to the installation of renewable energy production and related infrastructure (power stations, transmission lines), alongside projects of woodland creation and peatland restoration for net zero and adaptation purposes. ↑
JSEO indicators 9-12 focus on the gendered dimension of fair work in the four net zero sectors identified by the Scottish Government, following advice from the Fair Work Convention Secretariat and indicators in the Draft Transport JT Plan (2025). This framework prioritises gender pay gap as a measure of structural inequity. ↑
This caveat recognises that while the net zero transition will impact industries such as oil and gas, their declining activity in Scotland is also a result of various factors other than the response to climate change. These have been affecting these industries for some time (e.g., Shapovalova et al. 2023). ↑
Location quotient calculations were provided by the industry statistics area in Scottish Government, January 2026. ↑
The minimum threshold for installed capacity was 1MW until 2021, at which point it was lowered to 150kW. This means that projects below 1MW that were going through the planning system before 2021 may not be represented. ↑
For hotspots, trend three ‘economic trends in Scotland’ should also be complemented with economic trend data in the specific local authority monitored. ↑
Reducing emissions from Scotland’s tourism sector is a crucial part of reaching the Scottish Government’s target of net zero greenhouse gas (GHG) emissions by 2045.
Emissions from tourism cut across passenger transport, accommodation, food and drink, culture, retail and outdoor recreation, so reliable data is required. Current data, however, only reports over broad categories such as ‘transport’ or ‘buildings’ and does not isolate the contribution from visitor activity.
In this report, researchers explore how they can measure GHG emissions from Scotland’s tourism sector in a way that is credible, repeatable, and trackable over time. The primary aims of this research were:
- To identify a practical methodology for a reliable, national-level estimate of tourism-related GHG emissions.
- To examine the potential for separating results by factors such as geography, visitor or accommodation type to support place-based policy
- To ensure the chosen approach aligns with established GHG measurement practices and can be maintained through routine updates while balancing coverage, granularity, cost, and capacity.
Findings
- Scotland’s tourism sector has distinctive characteristics, including geography, rural tourism, transport emissions, seasonal workforce, and post-COVID behavioural changes.
- There is broad consensus on definitions of “tourism” across the literature, with studies organising indicators according to the United Nations World Tourism Organisation’s (UNWTO) Measuring the Sustainability of Tourism (MST) framework.
- Tourism Satellite Accounts (TSAs) – data sets providing economic analysis of a country’s tourism industry – are critical for defining the economic boundary of tourism, separating visitor-driven activity from resident activity, and enabling reporting.
- Four major methodology types for assessing GHG emissions in tourism are identified:
- Environmentally‑Extended Input-Output (EEIO) analysis is suitable for establishing a robust, repeatable national baseline.
- Life Cycle Assessments (LCA) provide detailed insights for operational decision-making.
- Hybrid models can combine the strengths of both approaches.
- Survey-based methods are useful for capturing regional behaviour and supplementing other models.
Recommendations
The report’s headline recommendation is to take a proportionate, staged pathway that matches effort to ambition. It suggests:
- Conducting a comprehensive audit of Scotland’s available data, including Input-Output tables, environmental accounts, and surveys such as the International Passenger Survey (IPS) and the Great Britain Tourism Survey (GBTS).
- Establishing an EEIO baseline as the analytical backbone, updated regularly using repeated survey data.
- Developing a Scotland-specific Tourism Satellite Account to enable greater precision, sector splits, and geographical disaggregation.
- Running LCA pilots for selected assets or services to provide operational insight and validate baseline assumptions.
Over time, these elements could be integrated into a hybrid framework under formal governance and quality assurance, reporting both production- and consumption-based perspectives. A staged, proportionate approach provides a clear, low-risk path to a credible baseline and repeatable evidence base, supporting policy and industry efforts to track and reduce tourism-related emissions.
Further recommendations
The report also outlines steps that should be taken in development of the methodlogy, regardless of the final methodology chosen:
- Adopt the IRTS definition of tourism and structure the GHG account within the UNWTO MST framework.
- Main active links with those that are further advanced, such as Denmark, to learn best practice.
- Build the methodology around a mix of data sources and keep data management central to project governance.
- The approach should be designed for regular repetition, and to secure the resources needed for scheduled updates.
For further information, please read the report.
If you require the report in an alternative format, such as a Word document, please contact info@climatexchange.org.uk or 0131 651 4783.
Community benefits are additional benefits offered by renewable energy developers to support communities. Examples include community benefit funds and in-kind benefits provided by developers such as investment in local infrastructure improvements or funding for education programmes. Community benefits currently operate on a voluntary basis in Scotland.
The Scottish Government has published Good Practice Principles for onshore and offshore energy in Scotland, which are currently under review. Within the context of that overarching review, the primary aims of this research were:
- To help identify any necessary adjustments to Scotland’s current voluntary community benefits approach for onshore and offshore to better support communities and industry as part of a just transition.
- To understand how different renewable energy technologies affect the provision of community benefits.
- To understand how mandating community benefits could work in practice for onshore renewable energy technologies.
The research incorporated an evidence review, qualitative interviews and the design and testing of a socio-economic analysis framework.
Findings
- No obvious adjustments need to be made to Scotland’s current community benefit approach.
- Financial aspects of a renewable energy project (costs, revenue and financial viability) are key factors impacting community benefit levels. Projects with higher amounts of revenue, and more robust and predictable financial returns are better positioned to offer significant community benefits.
- It is easier to offer community benefits for projects involving more established technologies like onshore wind, compared to newer technologies like hydrogen.
- The literature reviewed did not allow for a satisfactory comparative analysis of the in-practice impacts of mandatory versus voluntary approaches.
- Further development and more complete data is required to make a functional framework that could inform policy decisions on the appropriate levels of community benefit for different renewable energy technologies.
For further information, please read the report.
If you require the report in an alternative format, such as a Word document, please contact info@climatexchange.org.uk or 0131 651 4783.
Research completed: July 2025
DOI: http://dx.doi.org/10.7488/era/6396
Executive summary
Research background and aims
Community benefits are additional benefits offered by renewable energy developers to support communities. Examples include community benefit funds and in-kind benefits provided by developers such as investment in local infrastructure improvements or funding for education programmes. Community benefits currently operate on a voluntary basis in Scotland. The Scottish Government has published Good Practice Principles for onshore and offshore energy in Scotland, which are currently under review.
Within the context of that overarching review, the primary aims of this research were:
- To understand how different renewable energy technologies affect the provision of community benefits. This included developing and testing a socio-economic analysis framework to understand the factors that influence the nature and level of community benefits associated with different renewable energy technologies.
- To understand how mandating community benefits could work in practice for onshore renewable energy technologies.
- To help identify any necessary adjustments to Scotland’s current voluntary community benefits approach for onshore and offshore to better support communities and industry as part of a just transition.
The study methodology incorporated an evidence review, qualitative interviews, and the design and testing of a socio-economic analysis framework. This research focused on the factors influencing how different renewable energy technologies affect developers’ provision of community benefits, rather than on the experiences and perspectives of recipient communities. Interviews were therefore conducted with renewable energy developers.
The Scottish Government is gathering other non-industry perspectives on community benefits, including the views of community members, through a public consultation on the Good Practice Principles.
Understanding the ability of different technologies to offer community benefits
One of the ways this research explored how renewable energy technologies affected developers’ ability to offer community benefits was to develop and test a socio-economic analysis framework. This framework set out the parameters assumed to influence the level and nature of community benefits. An initial set of seven draft parameters were developed by the Scottish Government and the research team. Following an assessment of the feasibility of measurement and feedback from renewable energy developers, four parameters were recommended for further consideration (and which are subsequently referred to as “the framework”). These were:
- Technology maturity (i.e. more mature technologies, with well-established supply chains and business models, may better allow developers to build community benefit provision into their project plans compared to newer technologies).
- Market maturity (i.e. maturity may influence investor confidence, competition between developers, and certainty in supply chains which may in turn determine predictability of financial plans and therefore ability to deliver community benefits).
- Deployment and operating costs (i.e. the costs associated with developing and operating different renewable energy technologies may impact the financial capacity to provide community benefits).
- Revenue and profit (i.e. a project’s revenue and profit will impact on its overall financial viability which may impact on its ability to delivery community benefits).
This study identified significant challenges in developing a single framework to assess how different technologies affect developers’ provision of community benefit. For such a framework to work as a practical, decision-making tool, quantitative data on the economics of different renewable energy technology projects would be required. However, existing public data is sparse and of inadequate quality and many developers were unable or unwilling to share commercially sensitive data about their projects. A further limitation was that existing data (e.g. on the value of community benefits from individual renewable energy projects) is based on actual provision rather than an assessment of potential. Additionally, data available is largely historical and therefore challenging to use when anticipating new technologies and emerging economic and regulatory models.
However, it was clear from interviews with developers that the financial aspects of a renewable energy project (costs, revenue and financial viability) were key factors impacting community benefit levels. They noted that projects with higher amounts of revenue, and more robust and predictable financial returns are better positioned to offer significant community benefits. Conversely, if the financial viability of a development is low, then it is unlikely it can offer monetary community benefits without the project becoming non-viable. Developers noted that both technology maturity and market maturity can have an impact on a project’s financial viability and are therefore, indirectly, also linked to a project’s ability to deliver community benefits. However, this was based on qualitative interviews and was not possible to measure using quantitative data.
Developers also reported that it is easier to offer community benefits for projects involving more established technologies like onshore wind, compared to newer technologies, due to the latter’s comparatively lower profit margins. Less mature technologies (e.g., floating offshore wind, hydrogen) can have higher risks, higher delivery costs, less predictability in cost and performance, and lower investor confidence which can impact on their ability to offer benefits.
Although not necessarily directly impacting the level of benefit offered, developers identified community engagement as key factor for effective delivery. Developers emphasised the importance of levels of community engagement and capacity to effectively manage and deliver benefit funds. Interviewees highlighted the importance of community engagement, consultation and feedback in moulding community benefit initiatives, ensuring more meaningful and tailored contributions. This is difficult to quantify and would therefore be challenging to include in a socio-economic analysis framework.
How mandating community benefits could work in practice (for onshore renewable technologies)
The available literature does not enable a comparison of the real-world impacts of mandatory, as opposed to voluntary, provision of community benefits. Mandatory community benefits as part of renewable energy infrastructure development exist in Denmark and Ireland, specifically for wind projects. However, the literature reviewed does not allow for a satisfactory comparative analysis of the in-practice impacts of mandatory versus voluntary approaches.
Existing onshore developers felt that the following factors should be considered:
- clear guidance on what the financial expectation attached to mandating is to avoid any potential for confusion;
- allowing for the differences between individual onshore technologies to be taken into account;
- retaining a degree of flexibility, particularly in terms of allowing for community benefits to be designed around the needs of communities;
- avoiding overly burdensome processes. For example, in relation to restrictions on how communities should spend the money.
The power to mandate community benefits is reserved to the UK Government. In May 2025, the UK Government published a working paper seeking views on a mandatory community benefits scheme for low carbon energy and mechanisms for shared ownership of onshore renewables[1]. This includes the option to utilise existing powers to mandate offering shared ownership.
Any necessary adjustments to Scotland’s current voluntary community benefits approach for onshore and offshore
This research has not identified any obvious adjustments that need to be made to Scotland’s current community benefit approach.
The literature highlights that the Scottish Government is leading the way across the UK in highlighting the role of communities in the development of renewable projects. While there are examples in the literature of other approaches to community benefit provision outside of Scotland (e.g. in Ireland and Denmark), there is limited evidence directly comparing how different approaches have impacted the level of community benefits delivered. Therefore, there are no clear lessons from these international approaches suggesting a need to change the current approach in Scotland.
Guidance from the Scottish Government, in the form of Good Practice Principles and a recommended community benefit contribution of £5,000 per installed MW per year for onshore projects, was highlighted in interviews with developers as being a strength of the current process. They felt it provided a degree of predictability while also allowing for flexibility in application. However, for projects of emerging and/or non-generative technologies, developers noted that more targeted guidelines would be beneficial, noting that there is no established industry standard approach.
Conclusion and recommendations
The intention was that the framework examined in this study could inform policy decisions on the appropriate levels of community benefit for different renewable energy technologies. However, further development and more complete data is needed to be functional for this purpose. Collating the required data would need considerable resources and rely on information that developers perceive to be commercially sensitive. Considering data gaps, collection challenges, the difficulty in sourcing data specifically focused on future ability to offer benefits (rather than actual performance), further research and/or alternative approaches would be required. For these reasons, the approach explored here does not provide a robust enough evidence base to underpin a framework for use as a decision-making tool.
The report highlights existing measurement tools and guidance that can be used to understand where a project sits in relation to certain parameters, such as technology and market maturity. Further data collection work would be needed to make the most of these tools for robust socio-economic analysis. This would involve collecting relevant data for a large number of projects across metrics with established measurement tools. This would require a significant time and resource commitment and may not be a practical option.
To better understand how different renewable energy technologies affect developers’ provision of community benefits further research, beyond the financial indicators highlighted, would be needed. Considering the challenge of sourcing quantitative data on project economics, further qualitative research may be the most feasible option. Ideally this would be with a larger selection of developers across the full technology spectrum (including those that had not been able to deliver community benefits), direct engagement with communities, and wider stakeholder engagement (e.g. project investors, funders and other partners that have assisted in project development). This type of engagement would add to and build on the insights from developers gathered in this study.
Introduction
This report presents findings from research exploring opportunities for providing community benefits from renewable energy projects using different technologies in way that is fair and consistent. The research was carried out by Ipsos on behalf of ClimateXChange and the Scottish Government.
Background to the project
The Scottish Government has set ambitious targets for achieving net zero emissions by 2045, emphasising the importance of renewable energy technologies in this transition. The Climate Change Plan update (2020)[2] sets out Scotland’s ambition of a transformed energy system, which supports sustainable economic growth across all regions of Scotland.
Communities are at the heart of the energy transition in Scotland. Community benefits are additional benefits offered by renewable energy developers to support communities, offering them an opportunity to work with renewable energy businesses to secure long-term benefits. They provide an opportunity to share in the benefits of the energy resource and can have lasting social and economic impacts[3].
The Scottish Government published Good Practice Principles for the onshore[4] and offshore[5] energy sectors to outline how they can achieve a positive legacy for local communities. The approach and nature of community benefits operates on a voluntary basis in Scotland, with the guidelines allowing for flexibility in benefits arrangements offered by industry. Decisions on mandating community benefits are reserved to the UK Government. In May 2025, the UK Government published a Working Paper on community benefits and shared ownership for low carbon energy infrastructure, seeking views on whether mandating is the right approach and if so, to inform the design of future policy proposals.
Good Practice Principles have been widely adopted, but the approach to community benefits has not been wholly consistent across developments. In recognition of this, and of the rapidly changing sectoral and policy landscape, the Scottish Government is undertaking a review of the Good Practice Principles to ensure that guidance continues to help communities and developers get the best from community benefits.
This research sits within that overarching review. It was designed to help the Scottish Government understand more about different approaches to providing community benefits and to explore the opportunities for providing community benefits in future in a way that is fair and consistent for industry and communities. The findings from this research will help to inform a refresh of the Good Practice Principles.
Aims and objectives
The primary aims of this research were:
- To understand how different renewable energy technologies affect developers’ provision of community benefits. This included developing and testing a socio-economic analysis framework to understand the factors that influence the nature and level of community benefits associated with different renewable energy technologies.
- To understand how mandating community benefits could work in practice for onshore renewable energy technologies.
- To help identify any necessary adjustments to the Scottish Government’s current voluntary community benefits approach for onshore and offshore to better support communities and industry as part of a just transition.
The findings aimed to support policy development and further refinement of guidelines and frameworks to help ensure that community benefits are effectively and fairly integrated into Scotland’s net zero energy system and strategy.
Methodology
The research involved a mix of desk research, qualitative interviews with developers and data analysis, as outlined below (detailed methodology is in Appendix A):
- A desk-based evidence review that explored examples of community benefits from onshore and offshore renewable energy technologies in the UK and other countries. Literature sources reviewed included 12 peer reviewed academic papers, 20 reports, 2 guidance documents from grey literature (e.g., renewable energy developers, private consultancies) and 1 policy document. These were all published between 2011 and 2024, with 22 documents from the last 5 years.
- Initial scoping interviews with four industry representative bodies to understand their views on current community benefit approaches and to explore options for sourcing data that could support socio-economic analysis on community benefits.
- Design of a socio-economic analysis framework to help understand the factors which are likely to affect the level and nature of community benefits.
- In-depth interviews with 21 industry developers from a range of renewable energy technologies (see Appendix A). As the focus was on how different renewable energy technologies affect provision of community benefits, qualitative research with developers was carried out to help understand the views of those with direct experience of working with projects and benefits. Interviews helped to understand industry perceptions towards community benefits arrangements, collect feedback on the proposed analytical framework, and to understand availability of relevant data for socio-economic analysis.
- Assessment of the suitability of a framework to act as a tool for the Scottish Government to understand what type and level of community benefit may be suitable for different renewable energy technologies, based on data availability and feedback from interviews.
Definitions
Community benefits are defined in this research in line with the Scottish Government’s Good Practice Principles:
Community benefits are additional benefits, that are currently voluntary, which developers provide to the community. The Scottish Government does not currently have the power to legislate for community benefits, which lies with the UK Government. A community benefit fund is considered to be a fundamental component of a community benefit package, though other measures may be considered such as in-kind works, direct funding of projects, or any other voluntary site-specific benefits. Community benefits are not compensation for impacts on communities or other interests, including commercial interests, arising from renewable installations and they are not taken into account in a decision over whether a consent for a development is granted.
Community benefit in Scotland is distinct from shared ownership. Shared ownership provides community groups or members of a community the opportunity to make an investment in a commercially owned renewable energy project. This includes any structure which involves a community group as a financial partner benefitting over the lifetime of a renewable energy project. As shared ownership is not considered a form of community benefit in Scotland, it has not been included within this research.
In this report renewable energy technologies have been interpreted as the range of technologies outlined in the Scottish Government’s draft Energy Strategy and Just Transition Plan[6]. This includes onshore wind, offshore wind (both floating and fixed), solar, hydro, pumped hydro storage, battery energy storage system (BESS), hydrogen, and carbon capture, utilisation and storage (CCUS).
Limitations
This study was limited by data availability. Existing public data (for example on community benefit values, project costs and revenue) is sparse and of inadequate quality to effectively measure the parameters within a socio-economic analysis framework. Many developers were unable or unwilling to share commercially sensitive data about their projects. A further limitation was that existing data (e.g. on the value of community benefits from individual renewable energy projects) is based on actual provision rather than an assessment of project’s potential capability. Additionally, existing data are largely historical and therefore challenging to use when anticipating new technologies and emerging economic and regulatory models. Consequently, data gaps mean it was not possible to develop a fully functioning socio-economic analysis framework as part of this study.
A further limitation is that this research draws on the views of a relatively small sample of developers. These represent one group of perspectives on community benefits, albeit from different organisations, working with different technologies. Non-industry perspectives, including those of community members themselves, were not included in the remit of this study and would not be expected to fill the data gaps highlighted above.
Current community benefit arrangements
This chapter details the current arrangements for delivering community benefits, based on findings from the literature and from the qualitative interviews with renewable energy technology developers. At various points, examples of community benefit projects identified in the literature are shown to help illustrate the findings.
Key findings
- The literature highlights that the Scottish Government is leading the way across the UK in highlighting the role of communities in the development of renewable projects and in providing good practice guidelines.
- Community benefits from renewable energy projects in the UK mainly involve community benefit funds[7], but there are also examples of in-kind benefits such as investment in education and infrastructure programmes. Community benefit funds are not as extensively adopted outside of the UK.
- Onshore wind has more established community benefit practices than other onshore and offshore technologies. However, a key similarity is that all projects, regardless of technology, tended to adopt both community benefits funds and in-kind contributions.
- There is limited evidence directly comparing how different approaches in the UK and in other countries have impacted the level of community benefits delivered.
Guidelines for community benefits
According to the reviewed literature, the Scottish Government is leading the way across the UK in highlighting the role of communities in the development of renewable projects. The Good Practice Principles for Community Benefits from Onshore Renewable Energy Developments (updated in 2019) and the draft Good Practice Principles for Community Benefits from Offshore Renewable Energy Developments (2018) outline how the energy sector can achieve a positive, lasting legacy for local communities, and a range of successful community benefit projects have been implemented to date.[8] These guidelines have been widely adopted across the renewables industry, providing best practice for the sector.[9]
The voluntary guidelines suggest practices like conducting impact studies to identify affected communities, engaging in consultations, and tailoring benefits to local context and needs. These principles aim to ensure benefits are well-targeted and meet community expectations, which could be seen as markers of a well-designed scheme.[10]
Example 1.
Beatrice Offshore Windfarm’s Community Benefits Fund used the Scottish Government’s Good Practice Principles to guide the development of the fund. The Beatrice Community Benefits Fund also undertook innovative analysis of the potential wider impacts of the community benefits funding, using a Social Return on Investment methodology.[11] This illustrates the ability of the Good Practice Principles to be applied alongside other models and approaches.
In Scotland, the Scottish Government also established the Community Benefits Register,[12] managed by Local Energy Scotland. It can be viewed online and offers a form of third-party reporting and public recognition.[13] Best practice guidance also exists in England, Ireland, the Netherlands and Germany (see Table 2 in Appendix B).
Approaches used in the UK and elsewhere
The literature provided examples of different approaches to designing and implementing community benefits schemes. However, most examples are from onshore wind farms, with some examples given from offshore wind technologies. There is very little to no reference to other renewable technologies such as hydrogen, hydro, solar, wave, thermal, or BESS.
Community benefit mechanisms referred to in the literature included[14]:
- Financial contributions to a community benefit fund, to be used as directed by the community to invest in local initiatives[15];
- In-kind contributions to local infrastructure, facilities, or services[16];
- Grants, scholarships, or donations to support community initiatives[17];
- Electricity discounts or subsidies for local residents[18];
- Provision of environmental or recreational amenities.[19]
While these approaches share many similarities, there are some notable differences and ambiguities. These include varying interpretations of what constitutes the “local community” (especially for offshore projects)[20] and differing emphasis on the rationale for providing benefits (e.g., impact mitigation).
This section describes the different approaches to community benefits in more detail. Differences between the UK and other countries are noted, where available.
Community benefit funds
Community benefits from renewable energy projects in the UK are primarily delivered through community benefit funds. The UK onshore wind industry, in particular, has well established approaches for this.[21] Through this mechanism, developers voluntarily contribute a certain amount of funding to local communities. In some cases, the level of funding is linked to the amount of installed capacity of the project or the amount of energy produced. For example, in Scotland, it is the industry norm for onshore wind projects to typically deliver £5,000 per megawatt (MW) of installed capacity per year in alignment with the Good Practice Principles for Onshore Renewable Energy Developments.[22] However, the per MW model is not the only approach used and the total amount provided is based on the agreement between the developers and the community.
Example 2.
Crossdykes Wind Farm near Lockerbie, Scotland (developed by Muirhall Energy) offered an industry-leading £7,000 per MW per year for a community benefit fund, well above the industry standard of £5,000 per MW per year. The project provided an Initial Investment Fund of £100,000 to support community projects during the wind farm’s construction phase, showing a proactive effort to deliver early benefits.
Example 3.
Brechfa Forest West Wind Farm in Wales (owned by RWE Renewables), is an example of a community-administered community benefit fund which is expected to provide £11 million in community benefit funding, administered by the local enterprise agency and a volunteer panel of residents.[23]
Regarding offshore wind, the concept of community benefits in the UK is relatively newer and more flexible than for onshore, reflecting the evolving nature of the industry.[24] Some, predominantly near-shore English and Welsh wind farms (e.g. North Hoyle and Rhyll Flats off the North Wales coast) have followed the pattern of the onshore wind farms, with benefits pro rata to MW size, although at a much lower rate.[25] However, in many cases, and for some of the large North Sea distant offshore wind farms, the benefits packages have been more ad hoc and much smaller (pro rata) than for onshore projects.[26] Several challenges have been identified with providing community benefits funds for offshore wind projects, including defining the relevant community to be targeted.[27]
Example 4.
The Hornsea/Race Bank East Coast Community Fund, off the Norfolk coast, is managed independently by a specialist grant-making charity, GrantScape, on behalf of the developer Orsted. This enables an arms-length, transparent allocation process.[28]
According to a number of the literature sources, allocation and spending of community benefit funds are usually determined by developers, in collaboration with the local communities, often through local trusts or organisations. Developers often strive to tailor the benefits based on local priorities identified through community engagement.[29] Community benefit funds can take different forms, ranging from local funds – investments in communities nearest to developments to enhance services, assets and activities of residents – to regional funds – investment in transformational projects to provide socio-economic growth for wider communities.[30]
The evidence reviewed suggests that community benefit funds are not as extensively adopted outside of the UK. There are some instances of community benefit funds in Europe. Notably, in Denmark, from 2008-2018, the state-run “Green Scheme” mandated payments per kilowatt per hour of production to host communities. As of 2020, Danish developers must pay fixed amounts per MW installed into green funds for affected municipalities under the “Green Pool” scheme and make annual payments to neighbouring residents under the “VE-Bonus” scheme, with amounts determined by the Danish Energy Agency.[31] In Ireland, renewable energy auctions require developers to contribute €2 per MW hour to a community benefit fund, with defined spending allocations.[32]
Among the developers interviewed for this research, flexible community benefit funds were the most common approach being taken to community benefits in Scotland. The exact sum delivered through these funds varies project-by-project. Onshore wind developers said that they follow, and often exceed, the Good Practice Principles guidelines of £5,000 per MW per year. For other technologies, which developers said often have greater financial uncertainty and/or smaller margins than onshore wind, the levels of community benefit are less predictable. Developers said that the level of benefit is often closely linked to the project’s costs and financial returns, which varies.
“We typically work backwards from what we think the returns in the scheme are going to look like. And that’s very site specific, dependent on abnormal costs, grid costs, land rights costs…Depending on what that looks like, we’ll then generate a number to determine what we can reasonably offer local communities.” – BESS developer
In a number of cases, these funds are administered by Foundation Scotland, a charitable organisation that helps to support communities to set up, manage and distribute their funding. This has particularly been the case where local communities may lack the capacity to manage significant financial resources independently. Some projects also have established their own governance arrangements, involving boards constituted of local community members to determine the allocation of these funds.
Other community benefit mechanisms
Other examples of community benefits mechanisms that appeared in the literature include tax revenues or fiscal contributions from wind farm developers, which go directly into funding local infrastructure and community services. From the documents reviewed, this is common practice in Germany, Poland, Croatia, France and Italy. [33]
Example 5.
The Block Island offshore wind farm development in Rhode Island, USA, is an example of fiscal contributions being made to support local infrastructure. In this case, a formal Community Benefit Agreement was developed in which the wind farm company pays for improvements to town infrastructure where the cable comes ashore. This project was also highlighted in the literature as an example of community engagement resulting in locally appropriate community benefits and high levels of support for the development from the local community. As part of the public consultation on the project proposals, the developer, Deepwater Wind, collaborated with the town council to invite stakeholders and hired consultants from the local community to represent local interests. This helped establish trust and perceptions of fairness in the process.[34]
The literature also identified Australian examples of neighbourhood benefit programmes.[35] These programmes aim to address concerns around fairness that can arise when local residents receive no direct benefits from a renewable energy project which affects their experience of their place and community.[36] Examples of the types of benefits provided via these neighbourhood benefit programmes include support towards home energy efficiency measures, the installation of residential solar PV, and contributions to electricity bills for neighbours or neighbourhood community facilities (e.g. local hall, local fire-fighting facilities).
The reviewed literature suggests that the involvement of local authorities in the delivery of community benefits varies by country. In some European countries (including Denmark, Germany, France, Italy and Spain), the local municipality plays a significant role and often decides funding priorities of community benefits. In the UK and Ireland, local authorities generally decline involvement to avoid conflicts of interest in the planning process. However, Highland Council recently set out plans for a different approach to community benefit decision making and fund distribution and Shetland Council approved a new set of principles around community benefit.
Developers interviewed also described the types of in-kind benefits they offer communities. Examples included:
- Employment and education programmes. This includes providing funding towards training in green technologies, especially in areas that are reliant on traditional energy industries rather than renewable energy.
- Electricity discount schemes, with money coming off local residents’ bills.
- Investment in environmental and net zero initiatives, including activities designed to reduce carbon footprint and support biodiversity in communities, along with awareness-raising around these issues.
- Infrastructure improvements such as broadband access, roads and pathways, and community recreational facilities.
Impact of different approaches on the level of community benefits delivered
Based on the literature reviewed, there is limited evidence directly comparing how the different approaches in the UK and in other countries have impacted the level of community benefits delivered.
Among the documents reviewed, the only source that explicitly offers comparative analysis between approaches in the UK and European countries was the Department of Trade and Industry report conducted by the Centre for Sustainable Energy, which involved detailed case studies of major wind farms in the UK, Germany, Denmark, Ireland and Spain. The following points are drawn exclusively from this report:
- The overall levels of benefits accruing to communities from wind projects in Denmark, Spain and Germany tend to be higher than in the UK. However, it is important to note that in such countries, community benefits are mostly associated with shared ownership practices, and therefore economic and financial benefits are linked to those practices. Shared ownership is not included in the Scottish Government definition of community benefits and it is also worth noting that developments outside of the UK will have different policy contexts and market conditions to those in the UK, making it difficult to directly compare.
- While the authors do not find robust evidence that higher benefits directly lead to higher levels of support for developments, they suggest that they are likely an important factor in sustaining long-term acceptance of projects.
Lessons from community benefits projects
Common themes emerged from the literature and interviews around what constitutes good practice in community benefit:
- Early community engagement. Establishing trust, building relationships with local residents and identifying concerns and priorities early on can lead to smoother running of the project and help dispel fears of community members early on. [37]
- Ensuring community representation in the co-design and administration of community benefits[38] as this can help establish trust and lead to higher levels of sustained support for the project.[39]
- Providing broad and flexible community benefit. Literature and interviews highlighted the value of funds being used to support a wide range of community priorities like infrastructure, schools, housing, elderly care, environment, etc. that improve quality of life for residents. [40]
- Community capacity was noted by developers as a factor that can impact on their ability to deliver community benefits. Not all communities were seen to have the resources or expertise needed to administer funds efficiently. They noted that the existence of strong community councils or Community Development Officers to help generate ideas have helped contribute to successful community benefit funds.
- Ensuring transparency of communication and providing full information to communities through trusted messengers is seen in the literature as a crucial step in securing support from communities.[41]
- The reviewed literature also suggests that formalising benefit commitments and monitoring progress can promote accountability and sustainability over the long-term. It helps ensure developers deliver on promises made to communities.[42]
- There is also evidence that partnering and aligning with local government, NGOs and other companies allows projects to leverage additional resources and maximise the scale and impact of their community investments.[43]
Understanding how different renewable energy technologies affect the ability to offer community benefits
One of the ways this research explored how renewable energy technologies affect the level of community benefits offered by developers was to develop and test a socio-economic analysis framework. This framework set out the parameters assumed to influence the level and nature of community benefits provided. This chapter outlines the steps taken to develop and test a framework and the extent to which this tool could help to understand how different renewable energy technologies affect the level community benefits provided by developers.
Key findings
- Within the scope of this study, the available evidence did not support a single framework to robustly determine how different technologies affect the provision of community benefits. For such a framework to work as a practical, decision-making tool, quantitative data on the economics of different renewable energy technology projects would be required. However, existing public data is insufficient to effectively measure the parameters in the framework, and it was not possible within this study to gather the level of quantitative data that would be needed for robust socio-economic analysis.
- However, it was clear from the interviews with developers that the financial aspects of a renewable energy project (costs, revenue and financial viability) were key factors impacting community benefit levels.
- Developers’ feedback also highlighted that it is easier to offer community benefits for projects involving more established technologies like onshore wind, compared to other technologies (e.g. offshore wind, solar and battery storage) due to the latter’s comparatively low profit margins.
Original framework parameters
The initial parameters identified at the scoping phase of the project are outlined in Table 1. The following section sets out the feedback received from developers in response to this framework, and the extent to which these parameters are measurable within a framework.
Table 1 Initial list of identified parameters affecting provision of community benefits
|
Parameter |
Justification for inclusion |
|
Technology maturity |
More mature technologies like onshore wind and solar PV have well-established supply chains and business models, allowing for community benefit provision to be built in to project plans. The more mature technologies are also more reliable in terms of return on investment (ROI), than less mature technologies. Emerging technologies have less predictability in costs and revenues, affecting community benefit schemes and their provision. |
|
Market maturity |
The level of market maturity can determine the provision of community benefits by influencing investor confidence, increased competition between developers, robust supply chains and solidified regulatory frameworks. These all determine predictable project economics and financial plans, increasing the likelihood and scale of community benefits being provided. |
|
Project size/energy yield |
The energy yield of a project is a critical factor that can influence the revenue and, consequently, the level of community benefits provided. Smaller projects may have small absolute margins and so may be less able to provide the same level of community benefits as larger projects. |
|
Deployment and operating costs |
The costs associated with developing and operating different renewable energy technologies can impact the financial capacity to provide community benefits. If one technology has higher upfront costs or operating expenses, this might reduce the scope of benefits a developer can offer, as well as the timing of delivering these benefits. |
|
Revenue and profit |
The amount of revenue generated by a project, or the profits it generates, could also have an impact on a project’s ability to deliver community benefit and on the level and nature of community benefits that can be delivered. |
|
Land use, visual, environmental and social impacts |
Wind farms, especially onshore ones, can have a significant visual impact and may occupy large areas of land which can influence the local community’s perception, and the level of benefits expected. This may differ for offshore wind. It may also influence the type of community benefit provided (environmental, social, economic). In contrast, solar PV installations typically are less sensitive to visual impacts than wind turbines but could be associated with higher land use impacts. |
|
Wider economic impact of the project and its distribution |
The economic returns from projects may also influence the level of benefits provided through community benefit schemes. Projects which require a large workforce for ongoing maintenance and operation will provide economic benefits to the local area through jobs and investment which is multiplied through other sectors and amenities required by residents. It can be theorised that a developer’s contribution to the wider economy may reduce their overall willingness to community benefit commitments, though it is unlikely that this contribution would affect their ability to provide monetary commitments. |
Community benefit value
There is a lack of data on the level of community benefits offered by renewable energy projects. The Local Energy Scotland Community Benefits Register is currently the most comprehensive data source for capturing the community benefits monetary measures. However, this is not exhaustive and does not cover the full range of renewable energy technologies.
Further steps were therefore taken to identify additional and more up-to-date data for this research. Firstly, data was requested from developers taking part in interviews, but not all were willing or able to share this (either because they could not access the data, or due to commercial sensitivities). Secondly, online searching for publicly available information on monetary values of community benefits was carried out. While data for some projects is available publicly, this requires a significant time commitment to source since it is not held in a central source nor in a consistent format. Therefore, data gaps remained after taking these steps. For the framework to be robust, a more complete set of data on community benefit value is required.
Technology maturity
Technological maturity is a widely used metric for gauging a technology’s development and readiness for deployment.
Developers generally felt that this could have an impact on the viability of a project, and as a result affect the level of community benefits. Some agreed that, compared to mature technologies (e.g., onshore wind), technologies such as floating offshore wind, BESS and hydrogen can have higher risks, higher delivery costs, less predictability in cost and performance and lower investor confidence. However, some onshore wind developers argued that more mature technologies do not always have more secure financial models because recent cost increases in their supply chains have made viability harder to predict.
Technology maturity is suitable for quantitative measurement using the NASA Technology Readiness Level (TRL) scale (see Appendix E for details). To accurately assess a technology’s TRL, it is recommended that individual projects are approached directly for scoring, as they may employ different versions of the technology. If direct assessment is not possible, it would be possible to utilise the International Energy Agency’s ETP Clean Energy Technology Guide, which evaluates and provides comprehensive information on each technology’s current development stage across the energy system.
This parameter could be included in a socio-economic analysis framework, provided there was sufficient data available or one of the existing guides outlined above could be used.
Market maturity
Factors influencing market maturity include established supply chains, business models and supporting physical and regulatory infrastructure (ports for deployment of offshore wind, standards for solar farms, etc.).
Developers felt that emerging technologies and immature markets face difficulties determining an appropriate level of community benefits because of uncertainty around securing investment and finances. However, some onshore wind developers also noted that their more mature market can still experience challenges with supply chains, especially in relation to costs of deployment (e.g. turbine costs have increased).
Market maturity could be measured using existing tools. The Adoption Readiness Level (ARL) framework, developed by the U.S. Department of Energy, is a tool for assessing the commercialisation risks of new technologies. It helps identify potential roadblocks to market adoption, such as cost-competitiveness, regulatory landscape, public perception and infrastructure availability. It also helps evaluate market demand by identifying the target market, understanding customer needs, and assessing the competitive landscape.
The ideal approach to understanding this parameter would involve project-level assessments via direct engagement with project owners, using the scoring framework available online[44]. However, given the large number of projects, this endeavour would be challenging. The decision to pursue this should weigh the uncertainties about the parameter’s significance in determining community benefits, with the time commitment needed to collect this information.
This parameter would be suitable to include in a socio-economic analysis framework, but the ability to source the level of data required is challenging.
Project size or energy yield
This measure is quantifiable, based on the level of energy capacity installed for each project expressed in MW. This data is available on the Local Energy Scotland’s Community Benefit Register and the Renewable Energy Planning Database (REPD). To enable a comparison between different technologies, it is important to convert installed capacity to expected energy yield as each technology has different levels of efficiency.
Capacity and energy yield are both inputs in the estimation of gross revenue. Therefore, inclusion of these metrics as stand-alone parameters in the framework would be duplicative and would correlate very highly with any revenue estimations. For this reason, these metrics would not need to act as stand-alone parameters in an analysis framework but could be used as inputs to the revenue estimation.
Deployment and operating costs
The total costs of developing and operating a renewable energy project captures an important financial aspect assumed to influence the level of community benefit commitment.
Developers noted that the developmental and operating costs impact the financial capacity for a project to provide community benefit. As with revenue, obtaining precise cost figures would involve direct input from project owners. Again, due to commercial sensitivities and challenges in accessing this data, estimating total cost of production might need to rely on publicly available sources. This can be done for a selection of technologies using the Department for Energy Security and Net Zero’s Levelised Cost of Electricity (LCOE) estimates.[45] It is worth noting that not all REPD project technologies are included in this resource, and hence, some projects will require mapping to the closest matching technology category. Despite this challenge, a basic methodology for estimating LCOE from generation technologies is outlined in Appendix D.
When looking at non-generation projects, i.e. storage projects, it is important to reflect the differences to generation projects in the calculation of costs. An analogous version of the LCOE is the Levelised Cost of Storage (LCOS), which uses charging cost as fuel cost and uses the discharged electricity instead of generated electricity. Given the lack of access to the necessary data it is not possible to accurately estimate LCOS for storage projects.
Given that project costs provide a direct link to the financial aspects that are assumed to influence community benefits, it is recommended to include this parameter in a socio-economic analysis framework.
Revenue and profit
Developers agreed that the amount of revenue generated by a project has an impact on their ability to deliver community benefits and the level of community benefits that can be offered.
Ideally, obtaining precise revenue figures would involve direct input from project owners. However, due to commercial sensitivities and challenges in accessing data, estimating revenue might need to rely on publicly available sources. It is important to note that this approach is based on significant assumptions that might not hold true over time. Estimating future revenues is particularly challenging because it depends on projected electricity prices, which are notoriously difficult to predict with accuracy or extend into the future. Despite these challenges, a basic methodology for estimating revenues from generation technologies is outlined in Appendix D.
When it comes to non-generation projects, revenue estimation becomes even more complex and uncertain. These types of projects may involve diverse sources of income and variables, requiring a more nuanced approach to estimation. Battery storage projects generate revenue through a variety of mechanisms, often stacked together to maximise returns. Key revenue streams include arbitrage (buying electricity when prices are low and selling it back to the grid when prices are high), grid services (e.g. frequency regulation, voltage support), capacity market participation and ancillary services (e.g. black start capability). The lack of publicly available data for each of these revenue streams make it challenging to estimate revenue for non-generation projects.
Given that revenue estimation provides a direct link to the financial aspects that are assumed to influence community benefits, it is recommended that consideration is given to including this parameter in a socio-economic analysis framework.
Land use, visual and environmental impacts
There are several challenges associated with quantitatively measuring land use, visual, environmental and social impacts:
- Quantifying land use involves assessing the physical footprint of a project, which can vary significantly based on the type and scale of the renewable technology employed. Further challenges arise in comparing land use impacts across different technologies, such as wind farms versus solar arrays, as each may occupy land differently (e.g., spacing between wind turbines versus solar panel coverage). These differences between technologies were also noted by developers.
- Visual impact assessments are inherently subjective and can vary depending on individual perspectives and local landscape characteristics. Moreover, accurately quantifying visual impacts requires sophisticated modelling tools and surveys that consider factors like visibility range, landscape context, and viewer sensitivity.
- Comprehensive environmental impacts involve a multitude of factors, including potential effects on local wildlife, ecosystems, water resources, and biodiversity. Data collection for environmental impacts may be inconsistent and require long-term monitoring to capture seasonal or cumulative effects accurately.
- Social impacts can include effects on local communities, employment opportunities, and cultural shifts, which are difficult to measure quantitatively and may require qualitative research approaches. In addition, assessing social impacts often involves engaging with communities and stakeholders, which can introduce variability and complexity in data collection and interpretation.
- Each of these aspects often interacts with others, making it challenging to isolate and assess impacts individually without considering cumulative or synergistic effects. Variability in methodologies and data availability can also lead to inconsistent measurements and comparisons.
For these reasons, this parameter is not suitable for a socio-economic analysis framework.
Wider economic impact of the project and its distribution
Renewable energy projects, especially large-scale ones, often generate significant economic benefits. For example, they may create high-value jobs through operation and maintenance, enhance the local supply chain and attract inward investments. These contributions can lead to substantial regional development and improved economic resilience.
However, there are notable challenges in confining these benefits strictly to the local communities most directly impacted by the projects. Economic effects often extend beyond the immediate vicinity. Moreover, quantifying these impacts presents difficulties, often necessitating self-reported data from projects. Such data can be subject to bias and may not fully capture the comprehensive economic changes occurring in the region. These challenges were reflected in interviews with developers. They noted that projects can add a lot of value to an area through high-value jobs, contribution to the supply chain and driving inward investment. However, they noted that it would be difficult to define this parameter, since the economic impacts may not be contained to the specific community in question. Projects can also incur wider costs, such as seabed option fees and rental fees for offshore wind renewable energy developments and these funds can have a wider economic impact.
Additionally, this metric’s applicability varies with different project types. For instance, projects involving CCUS often repurpose existing infrastructure, without necessitating a new workforce. As a result, the direct local economic impacts of such projects might be limited, underscoring the need for careful consideration when using this metric to assess community benefit commitments.
Wider economic impact provides a valuable lens for understanding potential benefits. However, the challenges and variability associated with measuring and applying this parameter across project types should be carefully evaluated to ensure fair, accurate and consistent community benefit determinations. For these reasons, this parameter is not suitable for a socio-economic analysis framework.
Community involvement and capacity
During interviews, developers suggested that community involvement and capacity influence the ability to provide community benefits and should be considered as part of a framework. This parameter focuses on the role of communities in both shaping and managing the benefits derived from renewable energy projects. Interviewees highlighted that placing community needs at the core is essential for ensuring that the type and level of benefits align with local priorities. They emphasised the importance of community engagement, consultation, and feedback in moulding these initiatives, arguing that this involvement leads to more meaningful and tailored contributions.
Additionally, while not directly impacting a developer’s ability to offer community benefit, the capacity of communities to effectively manage and deliver agreed benefits was seen as important. Interviewees pointed out that variations in the size and organisation of community councils or other community groups can significantly impact their ability to administer benefits. Hence, recognising these differences allows developers to support and enhance the local capacity, fostering increased participation and benefit realisation from the projects.
However, there are several challenges to quantitatively measuring these aspects. Quantifying community engagement and feedback is subjective, as perceptions of effective engagement vary among stakeholders. Communities often have diverse and evolving needs, making standardisation difficult. Additionally, while the number of consultations can be counted, assessing their quality requires qualitative data, which is harder to quantify. Asking the community to accurately capture and record this data would put significant burden on individuals who quite often are volunteers in the community. Moreover, community needs can change over time, necessitating ongoing updates and flexible metrics.
Due to these challenges, it is not recommended to include this parameter as a stand-alone element in a socio-economic analysis framework.
Conclusion
Following the assessment outlined above, four parameters were deemed suitable to be considered in a socio-economic analysis framework. These were:
- Technology maturity
- Market maturity
- Deployment and operating costs
- Revenue and profit.
To demonstrate how a framework could be used in future, socio-economic analysis has been carried out based on a sample of data on renewable energy projects (see Appendix C). The parameters in scope of this analysis are restricted to those which have been deemed feasible to measure and for which a suitable method to measure them has been identified. This analysis is based on data available from the Community Benefits Register Database, supplemented with additional data sourced through desk research. Due to the data sources available, it only includes onshore wind, offshore wind and hydro technologies.
Key findings from that analysis are:
- Industry alignment and policy influence: While many onshore wind and hydro projects in Scotland are clustering around the recommended annual £5,000 per MW capacity for community benefits for onshore technologies, more than half of the onshore wind and hydro projects analysed in the available data set commit less than the recommended amount.
- Revenue-benefit correlation: A positive correlation exists between gross project revenue and total community benefit commitments, with larger projects providing bigger packages. However, this relationship weakens for high-revenue projects, suggesting a potential plateau effect.
- Costs and benefit packages: There is a positive correlation between total cost of production and total community benefit packages across all project sizes, suggesting that as total costs increase, so does the size of the overall commitment to community benefits. While this may appear contrary to the views of developers shown earlier (i.e. those who said that high costs can impact on financial viability and therefore their ability to offer community benefits) it should be noted that this data analysis is based only on projects already providing monetary benefits. It excludes those that had not yet provided any community benefits. It can therefore be assumed that the dataset excludes those projects that were deemed not financially viable enough to enable community benefit provision.
In interpreting these findings and considering next steps it is important to acknowledge the distinction between the willingness of projects (measured by actual provision) to provide community benefits and their ability to provide community benefits. The analysis above is based on actual provision of community benefits. It could be assumed that these commitments are indicative of both willingness and some inferred level of ability, but the data does not allow for an assessment of the capability of projects (and different technologies) to offer these benefits. The UK Government’s Contracts for Difference (CfD) scheme is the main support mechanism for renewable energy projects. It is important to acknowledge that although community benefit funds are not recognised costs in the CfD framework, they are often treated as part of a project’s overall cost base and priced in to CfD bids.
Robust analysis of the capability to provide community benefits would require detailed project-level data. To collate the data needed will require considerable resources and will also require renewable energy technology developers to share data they perceive as commercially sensitive, which may be unrealistic. This work has highlighted considerable data gaps, challenges collecting data in the future and difficulty in sourcing data specifically focused on future ability to offer community benefits rather than actual performance. Therefore, the approach explored here does not provide a robust enough evidence base to underpin a framework for use as a decision-making tool.
To better understand the capacity for projects to provide community benefits, it is suggested that further research and / or alternative approaches may be needed. This could take the form of qualitative research with a larger selection of projects across the full technology spectrum, to understand perceived barriers or enablers of moving from willingness to ability. This should offer insights into the practical challenges faced by projects. Longitudinal case studies may prove beneficial to understand how changes in policy, economic conditions or market incentives could have influenced both the willingness and perceived capacity to make these commitments.
Exploring mandatory community benefit arrangements
This chapter looks at current approaches to mandating found in the evidence review and the views of the industry on how mandating community benefits for onshore technologies could work in practice, based on qualitative research with developers.
Key findings
- Mandatory community benefits approaches exist in Denmark and Ireland, as part of renewable energy infrastructure development for wind projects. However, the literature reviewed does not allow for a satisfactory comparative analysis of the in-practice impacts of mandatory versus voluntary approaches.
- Existing onshore developers felt that the following factors would need to be considered for mandating to work in practice:
- clear guidance on the financial expectation attached to mandating
- accounting for differences between individual onshore technologies
- retaining a degree of flexibility, particularly in terms of the ability for community benefits to be designed around the needs of communities
- avoiding overly burdensome processes.
Current approaches to mandating community benefits
Mandatory community benefits as part of net zero energy infrastructure development exist in Denmark and Ireland, specifically for onshore and offshore wind projects. Other countries have mandated approaches for shared ownership, special taxes, energy subsidies, or monetary compensations, but not community benefits as defined here. This includes Germany, France, Taiwan, and the Philippines [46].
Denmark has a history of various mandates relating to community benefits. For example, until 2018, the “Green Scheme” required the Danish state to pay hosting communities a fixed amount per kWh of production from new turbines. This applied to offshore wind farms built outside the tender process and within 8km of shore.[47] More recently, as of June 2020, regulations require offshore wind developers to pay fixed amounts per MW installed into green funds for affected municipalities. The payment is DKK 115,000 per MW (around €15,500).[48] Additionally, in Ireland, renewable energy auctions mandate that developers contribute €2/MWh to a community benefit fund, with defined criteria for how the funds must be spent.[49]
Other mandated approaches similar to community benefits include special taxes imposed on developers, that are distributed to local authorities, and electricity subsidies for “host communities”. The former approach has been implemented in France and Germany. The French Maritime Wind Turbine Tax is imposed on offshore wind farms, and is allocated to local authorities to finance local projects, per a defined formula. Germany requires that tax revenue generated from offshore wind farms in the Exclusive Economic Zone is distributed to coastal states. Energy subsidies for host communities have been implemented in the Philippines and Taiwan. Since 2008, the Philippines has required that 80% of money generated from royalties, or government shares in renewable projects, must be used to subsidise the electricity costs of communities affected by these projects.[50] In Taiwan, the Electricity Assistance Fund (EAF) is distributed to communities affected by power plant projects (including, but not limited to renewable energy) according to a pre-defined formula. For example, in the case of offshore wind, 30% of EAF funds are provided to “local project fund pools” for the benefit of residents, community groups, and civil society organisations, and 70% is provided for councils and fishery associations.[51]
Although shared ownership is seen distinct from community benefits in Scotland, some other countries have mandated shared ownership or compensation payments. For example, in Denmark, the 2008 Renewable Energy Act mandated developers to offer at least 20% of shares in wind projects for sale to local households within 4.5km of a turbine.[52] Similarly, in Germany, several states have required that between 10% and 25% of wind farm shares be offered to local residents and municipalities. Mandated compensation payments to nearby residents and community funds have been implemented in Denmark and Ireland. Since 2020, Irish legislation obliges wind farm developments to provide an annual contribution to nearby households and communities.
While some of the literature reviewed implies that mandated approaches are more robust,[53] no clear evidence is provided of their outcomes and impact compared to voluntary approaches. The literature does not allow for a satisfactory comparative analysis of the in-practice impacts of mandatory versus voluntary approaches.
Developers’ perspectives on how mandating community benefits could work in practice
Industry stakeholders shared their views on the potential for mandating community benefits for onshore technologies. Mandating was explored in both the scoping interviews with representative bodies and in the main interviews with developers. Developers highlighted some key considerations that they felt should be borne in mind for how mandating could work in practice.
For mandatory community benefits to work in practice, developers felt that there would need to be clear guidelines on what the financial expectation is to avoid any potential for confusion. It was suggested that the community benefit value attached to any mandated approach should be realistic and determined in collaboration with industry to help clarify what the expectations are for developers and for communities.
To work in practice, it was felt that mandatory community benefits would need to take into account the differences between different technologies. For example, by having different levels of benefits that technologies are expected to contribute. Specifically, some interviewees highlighted the different operating contexts and economies (e.g. different capital costs) between some technologies. Further, it was suggested that hydrogen and CCUS should be treated differently because they are designed to complement renewable technologies by operating only when needed. Therefore, it was argued that it is difficult to tie community benefits to specific metrics for these.
“[If] it would be used to set an X amount per megawatt, [then] that would need to be split into different technologies because it’s not a clear cut case for all technologies. It has to show this is what it is for BESS, what is for wind, what is for solar. Because if you get that number wrong, you can make the scheme unviable or unattractive and therefore it will not come forward.” – BESS stakeholder
It was also felt that for mandating to be practical, the approach to community benefits should retain some degree of flexibility and the ability to be designed around the needs of individual communities. For example, one onshore and offshore wind developer said if mandating were to happen it should be around the amount of funding that should be provided and not how communities spend the money. This view echoes findings of a report by BiGGAR Economics (2023) that states that the current voluntary system has allowed communities and developers to be flexible in their arrangements, and has enabled the “formation of mature, collaborative relationships” between parties. [54]
Related to the point above, some developers felt that, in practice, mandates could mean a more bureaucratic process which could slow things down, in turn impacting developers’ ability to deliver benefits. Stakeholders made contrasts with the current system, which was perceived as “fairly simple” and “flexible”. Therefore, it was suggested that approaches to mandates should avoid overly burdensome processes and bureaucracy. For example, it was suggested that it should avoid having too many restrictions around timescales or conditions on how communities should spend the funding.
Another view from developers was mandating might impact on the existing relationships between developers and communities, as it could move away from a collaborative process to one where there is a firmer expectation around what developers are required to give. Therefore, the approach would need to consider the relationships between developers and communities. Developers particularly felt it important to avoid community benefits appearing like compensation. For example, it was felt that creating a mandated system through which a certain amount is paid made directly to homeowners could lead to the system feeling like a form of compensation.
“If it’s mandated, it absolutely can’t be attributed as compensation to the community. If money had to be paid to compensate people for the effects of a wind farm, then the wind farm shouldn’t be being built.” – Multi-technology stakeholder
Aside from practicalities, a key concern raised was that mandating community benefit provision could risk investor confidence. Some developers felt that mandatory community benefits would have an impact on financial viability of projects, which could make investors less confident to invest. It was suggested that they may choose to invest in projects in other countries that do not have a community benefit mandate or in which they feel the approach is more straightforward.
“The danger with [mandating] is that it creates investor concerns. There’s a lot of competing geographies around the world that want money for renewable energy projects…If one country becomes difficult or the risks are harder to understand, they’ll move that investment to another country where they understand it. And the UK, and especially Scotland, runs a real risk of upsetting investor confidence, which is already very delicate because of the situations with the grid at the moment.” – Solar PV stakeholder
As the scope of this research was focused on understanding how different renewable technologies influence the level of community benefits offered by developers, interviews were conducted with a sample of renewable energy developers. A wide range of other stakeholders will have views.
Adjustments needed to Scotland’s current voluntary community benefits approach
This chapter sets out the extent to which any adjustments are required to the current voluntary community benefits approach based on findings from the literature review, interviews with developers and the design and testing of a socio-economic analysis framework.
Key findings
- This research has not identified any obvious adjustments that need to be made to Scotland’s current community benefit approach. Developers felt that the current system could better acknowledge the different realities of different technologies, but they were not specific about what the best future approach should be.
- Developers felt that guidance from the Scottish Government, in the form of Good Practice Principles and a recommended level of community benefit for onshore projects was a strength of the current process. However, for projects of emerging and/or non-generative technologies, developers noted that more targeted guidelines would be beneficial, noting that there is no established industry standard approach.
- The intention was that the framework in this study could be used by Scottish Government to determine an appropriate expectation of the level and types of community benefit required for different renewable energy technologies. This work identified significant data gaps, challenges collecting data in the future, and the difficulty in sourcing data specifically focused on future ability to offer community benefits rather than actual performance. For these reasons, the framework explored here is not robust enough to use as a decision-making tool.
Lessons from literature and developers’ views
Based on the literature reviewed, there is limited evidence directly comparing how the different community benefit approaches in the UK and in other countries have impacted the level of community benefits delivered. Similarly, there is limited evidence to compare the impacts of mandated and voluntary approaches. International examples do not therefore provide any obvious lessons for the current approach in Scotland.
Onshore wind developers interviewed as part of this study were largely satisfied with the current arrangements. They felt that having a recommended standard (of £5,000 per MW per year for onshore) works well, helping them to predict what the cost associated with each project will be. Since it is a recommended, rather than compulsory standard, they also felt that it also allows for a degree of flexibility, meaning that the community benefit contribution can be responsive to both project and local community needs.
“That financial outlay [£5,000 per MW per year] is much more predictable in our models that we bake in during development…we actually really try to make sure that we can deliver it and protect it.” – Multi-technology developer
Developers of some less well-established technologies (e.g. hydrogen and pumped hydro storage) expressed a desire for clearer guidance from government on the appropriate levels of community benefit for these technologies. They suggested that new guidelines around levels of community benefit should take into consideration the differences in scale and impact between projects like pumped storage and hydrogen generation, which can be more expensive and less visible than wind projects. Those from non-generative technologies (e.g. BESS) felt that it is more difficult to determine the amount of community benefits (funds) that can be delivered from these projects because they have lower level of return (they do not yield energy) and serve a different function in the energy market than generation projects.
Developers also suggested that further structure and support for communities could help them to manage funds more effectively. They felt that community-led decision-making was vital for ensuring the funds meet local needs, but that this should be balanced with adequate administrative support to prevent the misuse or underutilisation of funds.
“There is also a misconception that communities are underspending this funding. Our analysis shows that if we invest and empower communities, then they are very capable of delivering impactful projects.” – Multi-technology developer
Lessons from testing a framework approach
As noted earlier, to effectively measure parameters identified in the proposed framework, project-level data would be required on costs, revenue, technology readiness levels and market maturity. Data on these metrics is not currently available and collecting this data would be a significant task.
Developers felt that certain parameters (see chapter 4) were considered suitable for a socio-economic analysis framework. However, their limited testing means that the framework would need more comprehensive data to fully model these parameters’ effects on community benefits. This is especially true for community benefit commitment data (£/MW/yr) which currently is only reported in the Community Benefits Register Database for onshore wind and hydro projects.
When discussing the idea of such a framework, developers noted that community benefits should not have a one-size-fits-all approach and should be reflective of specific circumstances of each technology and each project. Concerns were raised by some interviewees that a framework might lead to overly prescriptive approaches which could risk stifling development and deterring investment.
“Each [parameter] is relevant and I can see why they have been captured as things that would influence the value and viability of community benefits […] It all depends on an individual project basis, depends on what else is happening in terms of landscape and development.” – Multi-technology developer
Interviewees also questioned whether sufficient data would be available to support the framework and there was some concern about using historic data to understand future community benefit levels. A few interviewees also highlighted concerns about data sensitivity and need for any information to be carefully handled.
Considering the data gaps, challenges collecting data in the future, and the difficulty in sourcing data specifically focused on future ability to offer community benefits rather than actual performance, a single framework may not be the most appropriate approach.
Conclusions
This research looked at current and future approaches to community benefits to help inform decisions around future provision of community benefits in a way that is fair and consistent. This chapter draws conclusions around the three broad research aims:
- To understand how different renewable energy technologies affect the capacity of developers to provide community benefits, including developing and testing a socio-economic analysis framework.
- To understand how mandating community benefits could work in practice for onshore renewable energy technologies.
- To help identify any necessary adjustments to the Scottish Government’s current voluntary community benefits approach for onshore and offshore to better support communities and industry as part of a just transition.
Understanding how different renewable energy technologies affect community benefits
Within the scope of this study, the available evidence did not support a single framework to robustly determine how different technologies affect community benefits. For such a framework to work as a practical, decision-making tool, quantitative data on the economics of different renewable energy technology projects would be required. However, existing public data is sparse and of inadequate quality to effectively measure the parameters within a framework and many developers were unable or unwilling to share commercially sensitive data about their projects. A further limitation was that existing data (e.g. on the value of community benefits from individual renewable energy projects) is based on actual provision rather than an assessment of project’s potential ability. Additionally, data available is largely historical and challenging to use when anticipating new technologies and emerging economic and regulatory models.
However, from data that was available, it was clear that the financial aspects of a renewable energy project (costs, revenue and financial viability) were key factors impacting the developers’ offer of community benefits. Projects with higher amounts of revenue and more robust and predictable financial returns are better positioned to offer significant community benefits. Conversely, if the financial viability of a development is low, then it is unlikely developers can offer community benefits without the project becoming non-viable. Developers noted that both technology maturity and market maturity can have an impact on a project’s financial viability and are therefore, indirectly, also linked to a project’s suitability to deliver community benefits. As discussed above, while there are existing tools for measuring technology and market maturity, data gathering is challenging.
Developers’ feedback also highlighted that it is easier to offer community benefits for more established technologies like onshore wind, compared to other technologies (e.g. solar and battery storage) due to the latter’s comparatively low profit margins. Less mature technologies (e.g., floating offshore wind, hydrogen) can have higher risks, higher delivery costs, less predictability in cost and performance, and lower investor confidence which can impact on their ability to offer benefits.
While not directly impacting on the level of community benefits offered, developers noted the importance of community engagement and capacity to effectively manage and deliver benefit funds. Interviewees highlighted the importance of community engagement, consultation and feedback in moulding community benefit initiatives, ensuring more meaningful and tailored contributions. However, this is difficult to quantify and would therefore be challenging to include in a socio-economic analysis framework.
How mandating community benefits could work in practice (for onshore renewable technologies)
The literature reviewed does not allow for a satisfactory comparative analysis of the in-practice impacts of mandatory versus voluntary approaches. Mandatory community benefits approaches exist in Denmark and Ireland, as part of net zero energy infrastructure development for wind projects. While the literature provides examples of where this was happening outside of the UK, it was less clear on the extent to which mandating had an impact on the level and nature of community benefits when compared with voluntary approaches.
Developers felt that for mandating to work in practice, a number of factors would need to be taken into consideration. It was felt that any future mandating approach should allow for the differences between technologies to be accounted for by setting, for example, different recommended levels of community benefit fund value. For mandating to work in practice, it was also felt that flexibility was key, particularly in terms of how communities could make use of the funding provided. Practicalities aside, there was some concern that mandating could potentially pose a risk to projects, by placing a financial burden on some projects (particularly those with smaller financial returns such as solar and BESS technologies) which could pose a risk to investors.
Any necessary adjustments to Scotland’s current voluntary community benefits framework for onshore and offshore
This research has not identified any obvious adjustments that need to be made to Scotland’s current community benefit approach.
Guidance from the Scottish Government, in the form of best practice principles and a recommended level of community benefit for onshore projects was highlighted in interviews with developers as being a strength of the current process. However, developers’ feedback suggests the current system needs to better acknowledge the different realities of different technologies. Developers of emerging and non-generative technologies suggested that more targeted guidelines for these newer technologies would be beneficial, noting that there is no established industry standard approach. However, while they suggested some areas for consideration, they were not specific about what the best future approach should be.
The intention was that the framework in this study could be used by the Scottish Government to determine an appropriate expectation of the level and types of community benefit required for different renewable energy technologies. The parameters that were considered suitable for the framework could provide a useful understanding of the factors that influence ability to offer community benefits. However, this would be dependent on data gaps being addressed. Ideally, it would have up-to-date data on community benefit value covering the full range of renewable energy technologies, with at least 50 projects for each technology.
This study has identified data gaps, challenges collecting data in the future and the difficulty in sourcing data specifically focused on future ability to offer community benefits rather than actual performance. The approach explored here does not provide a robust enough evidence base to underpin a framework for use as a decision-making tool.
Recommendations and next steps
The report highlights existing measurement tools and guidance that can be used to understand where a project sits in relation to certain parameters, such as technology and market maturity. To make the most of these tools, further data collection work would be needed before they could be used for robust socio-economic analysis. This would involve collecting relevant data for a representative sample of projects across the metrics that have already established measurement tools. This would require a significant time and resource commitment and may not, therefore, be a practical option.
To better understand the factors influencing the level of community benefit, beyond the financial indicators highlighted in this study, further research would be needed. Considering the challenge of sourcing quantitative data on project economics, further qualitative research may be the most feasible option. Ideally this would be with a larger selection of developers across the full technology spectrum (including those that had not been able to deliver community benefits), direct engagement with communities, and wider stakeholder engagement (e.g. project investors, funders and other partners that have assisted in project development). This type of engagement would add to and build on the insights gathered from developers in this study.
Glossary / abbreviations table
|
Acronym/Abbreviation |
Definition |
|
ARL |
Adoption Readiness Level |
|
BESS |
Battery energy storage system |
|
BWE |
German Wind Energy Association |
|
CCUS |
Carbon capture utilisation and storage |
|
EAF |
Electricity Assistance Fund |
|
ESG |
Environmental, Social, and Governance |
|
GW |
Gigawatt |
|
IEA ETP guide |
International Energy Agency’s Energy Technology Perspectives guide |
|
LCLO |
Local Community Liaison Officer |
|
LCOE |
Levelised Cost of Electricity |
|
LCOS |
Levelised Cost of Storage |
|
MW |
Megawatt |
|
NASA |
National Aeronautics and Space Administration of the United States |
|
REPD |
Renewable Energy Project Database |
|
SROI |
Social Return on Investment |
|
TRL |
Technology Readiness Level |
References
Anchustegui, I. H. (2021). Distributive justice, community benefits and renewable energy: The case of offshore wind projects.
Arsenova, M., & Wlokas, H. L. (2019). Local Benefit Sharing in Large-Scale Wind and Solar Projects. IFC.
Arsenova, M., Skyt, P., & Qadeer, A. (2024). The Strategic Value of Community Benefits in Offshore Wind Development. IFC.
BiGGAR Economics. (2023). Baseline report on Community benefit and shared revenue from onshore wind projects to communities in the south of Scotland.
BiGGAR Economics. (2024). Developing a new model to maximise local economic benefits from development in Moray and Highland. Report to Moray Council and Highland Council.
BiGGAR Economics. (2024). Impact Assessment of the Rosehall and Achany Wind Farm Community Benefit Funds.
Centre for Sustainable Energy (CSE), & Garrad Hassan. (2005). Community Benefits from Wind Power: A Study of UK Practice and Comparison with Leading European Countries.
Chen, H., Esram, N. W., Johnson, A., Harmon, D., Phelan, P., & Fraser, A. (2024). Aligning Community Benefits with Decarbonization Goals: Lessons Learned from Development of Community Benefit Plans for IRA Funds. American Council for an Energy-Efficient Economy.
Cowell, R., Bristow G., Munday, M. (2011) Acceptance, acceptability and environmental justice: the role of community benefits in wind energy development, Journal of Environmental Planning and Management.
Department for Energy Security and Net Zero (2023) Electricity Generation Costs (2023)
Additional LCOE estimates for generation technologies & Key data and assumptions for generation technologies. Available online: https://assets.publishing.service.gov.uk/media/6555cb6d046ed4000d8b99bb/annex-a-additional-estimates-and-key-assumptions.xlsx
Devine-Wright, P., Devine-Wright, H., & Cowell, R. (2015). What do we know about overcoming barriers to siting energy infrastructure in local areas?
Ejdemo, T., Söderholm, P. (2015). Wind power, regional development and benefit-sharing: The case of Northern Sweden., Renewable and Sustainable Energy Reviews.
Égré, D., Roquet, V., & Durocher, C. (2007). Monetary benefit sharing from dams: A few examples of financial partnerships with Indigenous communities in Québec (Canada).
Energy UK. 2024). Energy in Action: Community benefits from local infrastructure.
Glasson, J. (2020). Community Benefits and UK Offshore Wind Farms: Evolving Convergence in a Divergent Practice.
Klain, S.C., Satterfield, T., MacDonald, S., Battista, N., Chan, K.M.A. (2017). Will communities “open-up” to offshore wind? Lessons learned from New England islands in the United States.
Kerr, S. (2018). Community benefits schemes – Fair shares or token gestures?
Kerr, S., Johnson, K., & Weir, S. (2017). Understanding community benefit payments from renewable energy development. International Centre for Island Technology, Heriot Watt University.
Lane, T., & Hicks, J. (2019). A Guide to benefit sharing options for renewable energy projects. Akin Consulting; Community Power Agency.
le Maitre, J. (2024). Price or public participation? Community benefits for onshore wind in Ireland, Denmark, Germany and the United Kingdom.
Local Energy Scotland (n.d.). Annual community benefits from Scotland’s renewables reach £30 million. Local Energy Scotland website. Link: https://localenergy.scot/annual-community-benefits-from-scotlands-renewables-reach-30-million/
Manitius. (2023). Community Benefits Programs & Clean Energy.
Munday, M., Bristow, G., & Cowell, R. (2011). Wind farms in rural areas: How far do community benefits from wind farms represent a local economic development opportunity?
NESCAN Hub. (2025). NESCAN Hub Website, accessed 25 March 2025, Link: https://www.nescan.org/resources/benefitting-communities-can-new-renewable-energy-projects-help-communities
San Martin, O., Morales, E., Antas, J., Seumas, S., & Wallace, J. (2022). The winds of change: The role of community engagement and benefit-sharing in wind farm developments. Statkraft.
Scottish Government (2018). Scottish Government Good Practice Principles for Community Benefits from Offshore Renewable Energy Developments.
Scottish Government. (2019). Scottish Government Good Practice Principles for Community Benefits from Onshore Renewable Energy Developments (updated).
Scottish Government (2020). Securing a green recovery on a path to net zero: climate change plan 2018–2032 – update. Published online: https://www.gov.scot/publications/securing-green-recovery-path-net-zero-update-climate-change-plan-20182032/
Scottish Government. (2022). Onshore wind: Scottish government policy statement.
Scottish Government. (2023). Draft Energy Strategy and Just Transition Plan – delivering a fair and secure zero carbon energy system for Scotland.
Scottish Government (2024) Community benefits from net zero energy developments: consultation. December 2024. https://www.gov.scot/publications/community-benefits-net-zero-energy-developments-consultation/pages/2/
Shetland Islands Council (2025) Community Benefit in Shetland. Committee Document. Available online: https://coins.shetland.gov.uk/viewDoc.asp?c=e%97%9Dg%8Fj%80%89
Skills Development Scotland (2023). CESAP Pathfinder – Work Package 1: An Evidence Based Approach to Supporting the Transition to Net Zero. November 2023. Available online: https://www.skillsdevelopmentscotland.co.uk/media/5hcorb5t/cesap-pathfinder-wp1-report.pdf
Solar Energy UK. (2024). Community Engagement Good Practice Guidance: Solar Energy UK.
SSE. (2024). Community Investment Review 2023/24.
Sumaria, P., & Maltby, P. (2022). Delivering local benefit from offshore renewables. Regen.
The Highland Council (2024). Social Value Charter set to unlock renewables investment. The Highland Council website. Available online: https://www.highland.gov.uk/news/article/16125/social_value_charter_set_to_unlock_renewables_investment
Toledano, P., Albin-Lackey, C., Andres, M. D., & Brauch, M. D. (2023). Community Benefit Sharing and Renewable Energy and Green Hydrogen Projects: Policy Guidance for Governments. Columbia Center on Sustainable Investment.
US Department of Energy (2024) Adoption Readiness Assessment. Available online: https://www.energy.gov/sites/default/files/2025-01/ARL%20Assessment%201-11-25.pdf
Van den Berg, K., & Tempels, B. (2022). The role of community benefits in community acceptance of multifunctional solar farms in the Netherlands.
Van der Waal, E. C. (2020). Local impact of community renewable energy: A case study of an Orcadian community-led wind scheme.
Walker, C. (2013). Towards Greater Acceptance of Wind Energy: A Review of Community Benefits Models.
Welsh Government (2022) Guidance for developers, local communities & decision-makers: Local and shared ownership of energy projects in Wales.
Wind Europe. (n.d.). Compendium of wind success.
Appendices
Appendix A – Methodology
Evidence review
Aims and objectives
The aims of the evidence review were to:
- Explore best practice on community benefits in the UK and internationally in relation to renewable energy technologies.
- Explore how community benefit schemes operate and examine their funding arrangements in the UK and internationally.
- Provide examples of where community benefits have been mandated and what impact this has had on industry, communities and the delivery of renewable energy technologies.
- Inform the socio-economic analysis in terms of identifying key parameters and contexts that impact the propensity to supply community benefits at varying scales.
- Identify data sources for the socio-economic analysis.
Defining the research questions
To ensure the evidence review is useful in summarising best practises and informing the socio-economic analysis the following research questions were defined:
- Research Question 1 – What is the best practice on community benefits from onshore and offshore renewable energy technologies internationally?
- Research Question 2 – How does the UK differ from international counterparts on the processes on the provision of community benefits? How does this impact the level of community benefits?
- Research Question 3 – Which (if any) countries mandate community benefits as part of net zero energy infrastructure construction? What impact has this had on the provision of community benefits? What impact has this had on communities and the delivery of net zero energy policies?
- Additional Scoping – What data is available on the levels of community benefits, and their corresponding technologies/market maturities/technology maturity and other hypothesised parameters which influence the provision of community benefits?
Scope of the literature search
The literature search included the identification of relevant sources from:
- Existing research into/evaluations of community benefit schemes
- Academic literature
- Grey literature
- Policy documents
- Media publications
The search for literature was primarily done through using Google and Google Scholar but also used sources such as JSTOR, Scopus, and organisational websites where necessary. Whilst we did not take a strict view on the geographical scope of our search, we favoured countries which are contextually similar to the UK (European countries, US, Australia) as it is likely these findings will be more relevant to the UK.
We explored literature relevant to onshore and offshore renewable energy technologies. This included, but was not limited to, wind, solar, hydro, wave, thermal, pumped hydro storage, bioenergy, battery storage, hydrogen, Negative Emission Technologies (NETs) and transmission infrastructure. The ability to look at these internationally was dependent on the context and energy mix of the countries in question. It was decided that it would also be useful to assess levels of community benefits for technologies which may be emerging in the UK but are more established elsewhere, bringing in the Three Horizons approach featured in the proposal.
Search Terms
Some initial search terms for covering the aforementioned specifications and research questions were developed and are presented in the table below:
|
Search Term (Google/Google Scholar) |
Relevance/comments |
|
“[insert technology] community benefits best practice [international/UK/insert country]” |
All technologies and internationally. This will support answering RQ1 and part of RQ2 by allowing for a comparison between countries. |
|
“[insert technology] community benefits monitoring [international/UK/insert country]” |
All technologies and internationally. This will support answering RQ1 and part of RQ2 by allowing for a comparison between countries. |
|
“[insert technology] community benefits evaluation [international/UK/insert country]” |
All technologies and internationally. This will support answering RQ1 and part of RQ2 by allowing for a comparison between countries. |
|
“[insert technology] community benefits lessons [international/UK/insert country]” |
All technologies and internationally. This will support answering RQ1 and part of RQ2 by allowing for a comparison between countries. |
|
“[insert technology] community benefits impacts [international/UK/insert country]” |
All technologies and internationally. This will support answering RQ1 and part of RQ2 by allowing for a comparison between countries. |
|
“[insert technology] community benefits funding arrangements [international/UK/insert country]” |
All technologies and internationally. This will allow us to understand the structure of community benefit funds, supporting RQ1 and RQ2 |
|
“[insert technology] community benefits management arrangements [international/UK/insert country]” |
All technologies and internationally. This will allow us to understand the structure of community benefit funds, supporting RQ1 and RQ2 |
|
“[insert technology] mandate/mandated/mandating community benefits [international/UK/insert country]”” |
All technologies and internationally. This will provide an answer to RQ3, where we can begin to assess the impact of mandating community benefits and what this looks like in practise |
|
“[insert technology] community benefits press release” |
This search supports the scoping of what is feasible for the socio-economic analysis. At this stage, a high-level search will be conducted, with more in depth web scraping for data (if possible) to be completed as part of the socio-economic analysis. |
Prioritisation approach
A long list of 86 sources were initially identified which were then prioritised using the prioritisation criteria set out below:
- Based on existing evidence: Does the document focus on existing practice/examples of renewable projects/developments?
- Focus on community benefits: Is the main focus of the document around the provision of community benefits (as opposed to for e.g. broader discussions of social acceptability of renewable energy developments OR community engagement)?
- Policy guidance: Does the document include policy recommendations/best practice guidance/reflections on lessons learned?
- Geographical scope: Does the geographical scope of the document include Europe, the UK or US?
- Peer reviewed / grey literature: Peer reviewed sources were prioritised over grey literature sources.
Additional considerations:
- Ensuring the inclusion of evidence on a wide spread of renewable technologies.
- Ensuring the inclusion of evidence from both voluntary and mandatory community benefits schemes.
- Ensuring the inclusion of evidence from a wide spread of types of community benefits.
Additional sources were added to the short-list of literature as suggested by Scottish Government and stakeholders in the scoping interviews. A total of 35 sources were reviewed in-depth. The final list of literature sources reviewed included 12 peer reviewed academic papers, 20 reports, 2 guidance documents from grey literature (e.g., renewable energy developers, private consultancies) and 1 policy document. The publication years of the reviewed documents ranges from 2011 to 2024, with 22 documents from the last 5 years.
Evidence extraction
The prioritised literature sources were then reviewed and findings relevant to the research questions were extracted into an excel sheet. Ipsos Facto, a Large Language Model, was used to assist with identifying and summarising relevant data.
Scoping interviews
In parallel to the evidence, we conducted four in-depth scoping interviews with industry bodies, trade associations, and members of developer groups to enhance the findings from the evidence review.
The aim of these interviews was twofold:
- to understand their views on different types of community benefits and their perceptions of current / best practice arrangements related to community benefits;
- to explore options for sourcing data from the industry, including the types of information they think businesses will / will not be prepared to share with us.
Learnings from the scoping interviews were used specifically to inform the design of the subsequent stakeholder engagement and framework development.
Developer interviews
In-depth interviews were conducted with 21 industry developers. Interviewees covered a range of technologies including onshore wind (7), offshore wind (7), solar PV (5), battery storage (6), grid stability (1), hydro (3), pumped hydro storage (3), hydrogen (6 including 2 green hydrogen) and carbon capture, utilisation and storage (2). Among interviewees, 11 were mostly multi-technologies developers and 10 were single-technology developers.
The objectives of the interviews were threefold:
- To gather qualitative data on the types of community benefits they have delivered/plan to deliver, views on current arrangement for community benefits and potential different approaches (including mandating for onshore), and what factors have contributed to the provision/ success of their community benefits (i.e. to help inform what parameters are most important in informing potential future community benefits). This will help contextualise the socio-economic analysis and the findings in the report.
- To gather quantitative data that we will then use in our analysis, using the parameters set out in the framework (these will be developed further based on CXC/SG feedback). This will include information such as the cost of developing the project(s), value of community benefits, proportion of those values in comparison with turnover/profit, employment impacts etc.
- To help reframe/revise the socio-economic analysis framework as required, based on their views on what parameters/variables are important
- Ahead of the interview, stakeholders were also requested to complete a ‘Data request sheet’ that aimed to gather data for the socio-economic analysis (see below).
Framework development
The development of the framework to assess the influence of various parameters on community benefits involved a systematic approach following stakeholder interviews. Each initial parameter underwent a comprehensive evaluation to determine the feasibility of its measurement and potential impact on community benefit commitments.
- Assessment of measurement challenges. Initially, each parameter was scrutinised to identify any inherent challenges or limitations in its measurement. This involved examining the complexity, availability of data, and any factors that could hinder accurate quantification.
- Identification of pre-existing measures. For parameters where it was determined that measurement challenges were minimal or non-existent, existing methodologies and measures were sought. This step involved a thorough review of established metrics and tools already in use.
- Development of proxy measures. In cases where no established measures were applicable, proxy measures were devised. This involved identifying the closest available data that could serve as a stand-in to approximate the parameter’s influence on community benefits. These proxies were selected based on their relevance and potential to offer meaningful insights.
Throughout this process, each parameter’s potential to influence community benefits was evaluated. This iterative methodology ensured a robust and nuanced framework, capable of effectively guiding future assessments and decisions concerning community benefit commitments.
Socio-economic analysis
To illustrate the application of the framework, a socio-economic analysis was conducted using a sample dataset of renewable energy projects. This analysis examined the relationship between the parameters detailed in Section 5 and the levels of community benefits, employing the methodologies outlined in the framework.
The analysis focuses on parameters deemed feasible to measure with available methods, specifically revenue and costs, along with technology type. Technology type was used as a proxy for technology maturity, given the current uniformity of maturity levels within each technology. The analysis relied on data from the Community Benefits Register Database, supplemented by additional information obtained through desk research.
For this analysis, the scope included onshore wind, offshore wind, and hydro technologies. These were chosen based on their data availability and relevance to the parameters evaluated.
Appendix B Examples of community benefit-sharing initiatives
Table 2 Examples of community benefit-sharing initiatives and related guidance for renewable technologies in selected European countries (from O San Martin et al. (2022)
|
Country |
Guidance document |
Scope of initiative |
|
Scotland |
Scottish Government: Onshore Wind Policy Statement (2017); Scottish Government: Good Practice Principles for Community Benefits from Onshore Renewable Energy Developments (2019 Update); and Good Practice Principles for Community Benefits from Offshore Renewable Energy Developments (2018) |
Wind farm operators currently utilise both community funding options and shared ownership, both are seen as good practices and responsive to the local community’s specific wishes. |
|
England |
Community Benefits from Onshore Wind Developments: Best Practice Guidance for England (2021) |
Both a community benefit fund and community shared ownership are recommended. Noted that many developers are providing funds significantly below the recommended amount. |
|
Ireland |
Code of Practice for Wind Energy Development in Ireland Guidelines for Community Engagement; and Best Practice Guidelines for the Irish Wind Energy Industry (2012) ORESS 1 Community Benefit Fund – Rulebook for Generators and Fund Administrators (2023) |
Irish wind farm operators currently offer both community funding options and shared ownership; both are seen as good practices. |
|
Netherlands |
Dutch Wind Energy Association (NWEA): Code of Conduct for Acceptance & Participation of Onshore Wind Energy (2016) |
Both a community benefit fund and community shared ownership are acceptable, but shared ownership is generally preferred and expected by local communities. |
|
Germany |
German Wind Energy Association (BWE): “Collectively Winning – Local Wind Energy”: Framework Paper for the topics added value, public participation, and acceptance (2018); “Citizen-owned Wind Energy” – Energy from the region for the region (2013) |
Best practice in Germany heavily tends towards community stakes/shared ownership in wind farms as the main model of how communities benefit. In contrast, the community funding model is less well-received in Germany. |
Appendix C Socio-economic analysis results
To demonstrate how the framework could be used in future, socio-economic analysis was carried out based on a sample of data from net zero energy projects. This analysis explores the relationship between the parameters outlined in chapter 4 and the levels of community benefits, using the methods outlined in the framework.
The parameters in scope of this analysis are restricted to those which have been deemed feasible to measure and for which a suitable method to measure them has been identified These include revenue and costs, as well as technology type (which serves as a proxy for technology maturity, as maturity levels do not vary within technologies currently). It should be noted that this analysis is based on data available from the Community Benefits Register Database, supplemented with additional data sourced through desk research. Due to the data sources available, it only includes onshore wind, offshore wind and hydro technologies.
The subsequent analysis in this chapter presents the relationships between the measurable parameters for which data is available and the level of community benefits.
Key findings
- Industry alignment and policy influence. Many onshore wind and hydro projects in Scotland are clustering around the recommended annual £5,000 per MW capacity for community benefits for onshore technologies. However, a significant number of onshore wind and hydro projects (more than half of those analysed in the available dataset) commit less than the recommended amount.
- Revenue-benefit correlation. A positive correlation exists between gross project revenue and total community benefit commitments, with larger projects providing bigger packages. However, this relationship weakens for high-revenue projects, suggesting a potential plateau effect.
- Costs and benefit packages. There is a positive correlation between total costs and total community benefit packages. For projects costing less than £25 million, when comparing onshore wind and hydropower projects of the same energy capacity and with equivalent community benefit budgets (£5,000 per MW annually), onshore wind offers greater community benefits per pound spent on energy production.
Analysis of community benefit commitments
Many onshore wind and hydro projects in Scotland are aligning with the recommended community benefits package of £5,000 per MW capacity. The clustering of commitments around the recommended amount suggests that policy guidelines are influencing industry behaviour, but full compliance among onshore projects has not yet been achieved. This is observed in Figure 1 by the number of projects committing less than the recommended amount. Of the 282 onshore wind and hydro projects analysed, 177 were committing less than the recommend amount.
There exists a small but notable group of projects that have committed to providing community benefits from onshore renewable energy developments above the recommended £5,000 per MW capacity. These projects may be setting new benchmarks for corporate social responsibility. The strong concentration around the £5,000 figure could indicate an opportunity for standardising community benefit packages across the industry, potentially simplifying expectations for both developers and communities.
Figure 1 Distribution of Annual Community Benefit Commitments per MW – Onshore Projects
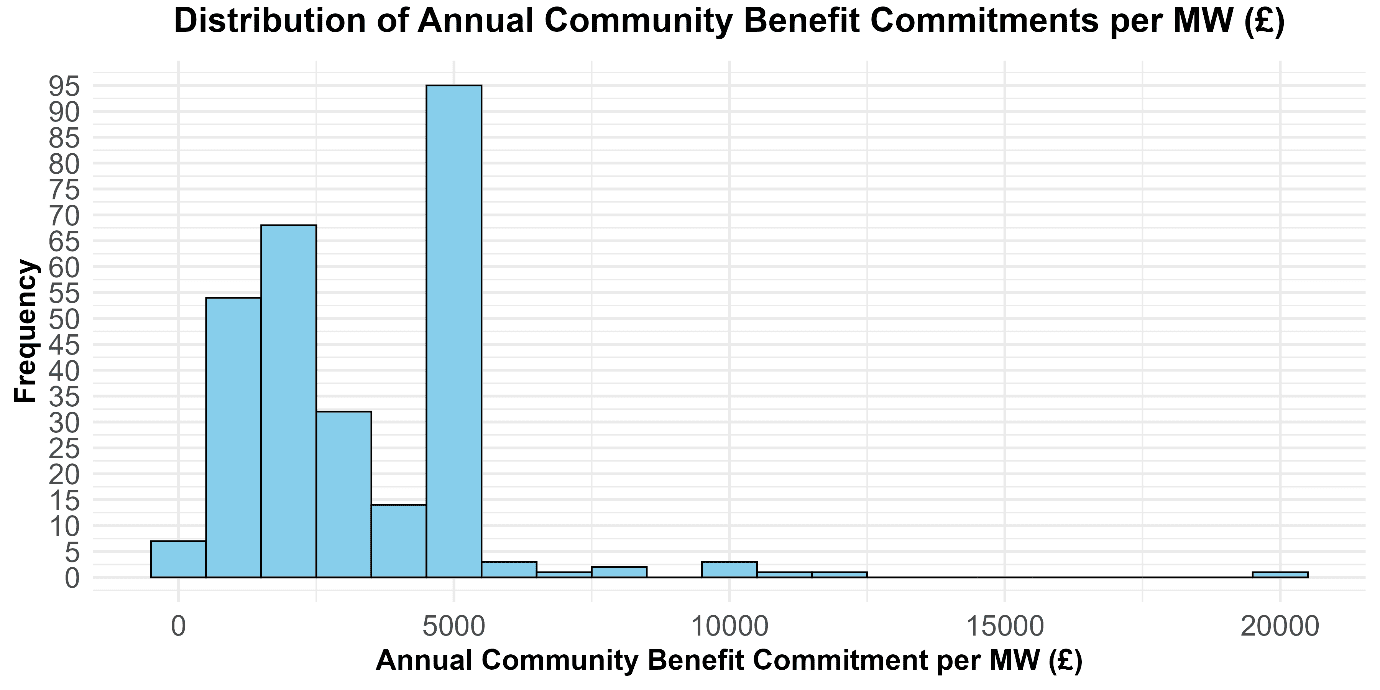
Source: Community Benefits Register Database
Figure 2 below illustrates where most of the data points are concentrated and the variation in the data. There are distinct patterns in community benefit commitments across the two different onshore renewable technologies shown. Figure 2 shows that hydro projects commitments range between £456 and £5,000 per MW per year, while onshore wind commitments range between £60-£20,000 (the upper end of this range is not visible in Figure 2 below as this distorted the shape and scales of the figure).
There is a concentration of commitments around the £5,000 figure for both hydro and onshore wind which aligns with the recommended amount (as demonstrated by the width of the violin plot), indicating a level of industry-wide acceptance of this guideline for land-based projects.
Figure 2 Distribution of Annual Community Benefit Commitments per MW by Onshore Technology
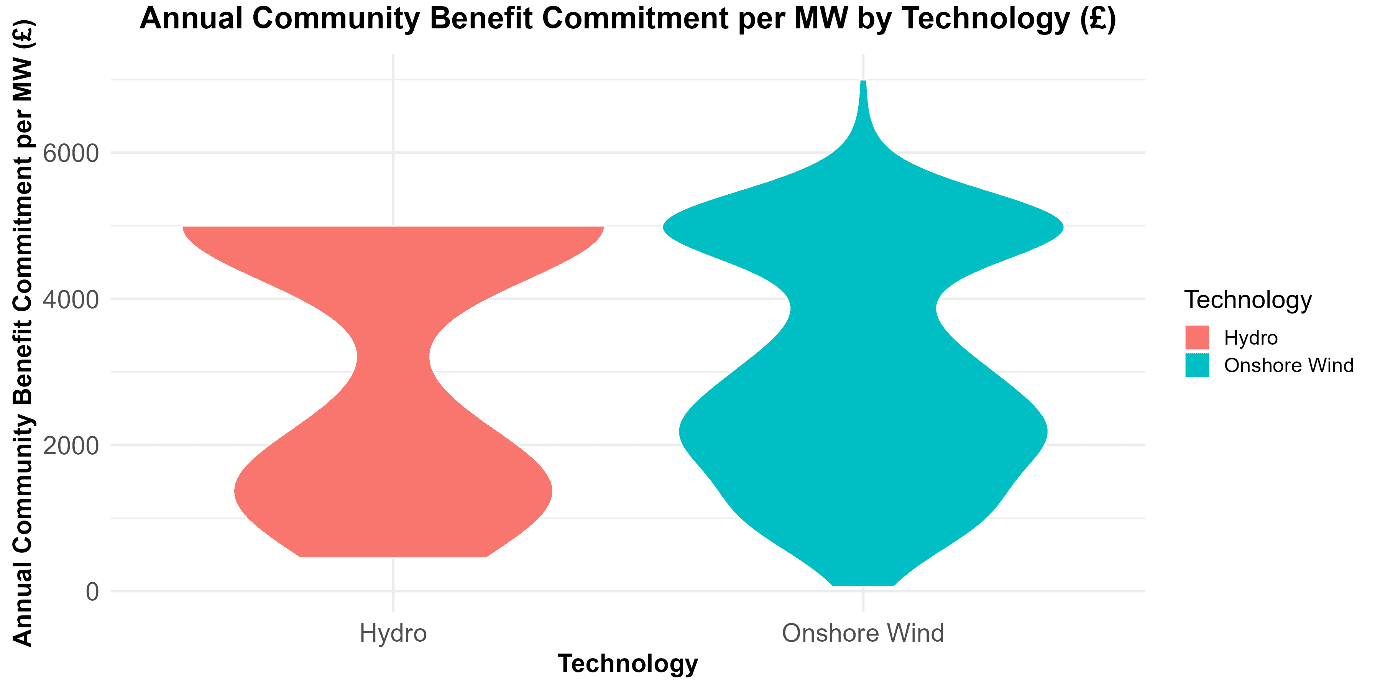
Source: Community Benefits Register Database
Figure 3 below shows the distribution of community benefit commitments among offshore projects. It should be noted that there was very low coverage of offshore wind projects captured in the register, and hence efforts were made to manually collect benefits data through desk-based research. This may have resulted in some discrepancies in actual provision versus what projects would have reported through the register. Figure 3 shows offshore wind projects notably committing lower amounts compared to onshore wind and hydro projects, with a range between c.£20-£2,000 per MW per year. It is acknowledged here that this analysis is based on 21 projects out of a possible 47 operational offshore wind projects in the UK[55] and therefore figures should be treated with caution.
Figure 3 Distribution of Annual Community Benefit Commitments per MW – Offshore Projects
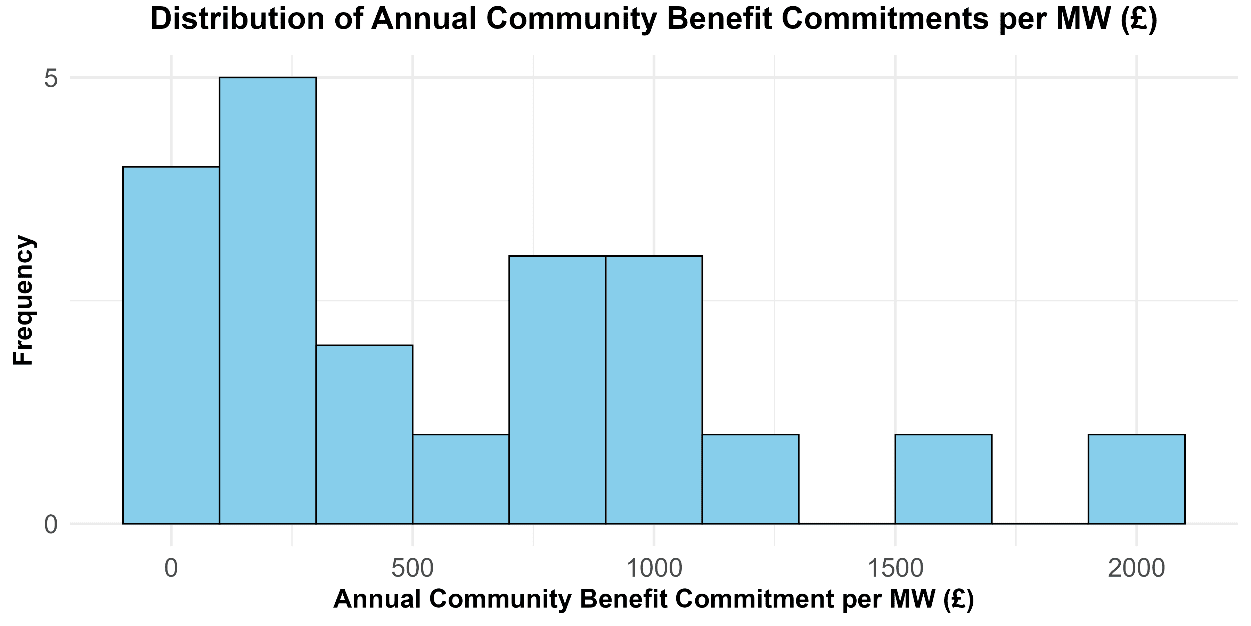
Source: desk research
There are several reasons why offshore wind projects might be committing lower amounts than their onshore counterparts. Most importantly, onshore renewable energy projects in Scotland are encouraged to offer community benefits, typically around £5,000 per megawatt of installed capacity annually. This is a voluntary guideline, not a requirement, specifically for onshore projects, and does not apply to offshore projects. Beyond this, offshore wind farms, being located further from communities, might be perceived as having less direct impact on local populations, potentially justifying lower community benefit packages. The offshore wind sector in Scotland is also at an earlier stage of development compared to onshore technologies, with community benefit standards still being defined. This technological and market immaturity means standards for community benefits are still evolving within this sector. In contrast, onshore wind technologies are more established and benefit from years of development and market experience. The advanced state of onshore wind technology may allow for greater efficiency and cost reduction, enabling more substantial community support relative to their offshore counterparts. Moreover, the scale of offshore wind projects may mean that while there are lower per-MW commitments, the overall total community benefits package may still be substantial.
Analysis of community benefit parameters and their impact
Revenue and profit
Figure 4 below illustrates the relationship between estimated gross revenue and total community benefit commitments over the project lifetime. The relationship is split and visualised by revenue levels due to the variation in the strength of the relationship as revenue changes. Blue dots represent projects that have committed £5,000 per MW per year, while red dots represent any figure other than the recommended £5,000 per MW. There is a clear positive correlation between gross project revenue and total community benefit commitments across all renewable energy projects in Scotland. This suggests that as projects become more financially substantial, they tend to provide larger community benefit packages. As project size increases in revenue terms, there is a widening range of community benefit amounts. This indicates that larger projects have more diverse approaches to community support. The relationship between gross revenue and community benefits appears to weaken for larger revenue projects. This suggests a potential plateau effect where community benefit increases do not keep pace proportionally with revenue growth beyond a certain point.
Small (under £35m gross revenue) and medium-sized (£25-250m gross revenue) projects frequently demonstrate commitment to the recommended £5,000 per MW amount, suggesting strong guideline adherence among projects of these scales. Across these sized projects, there are few instances of commitments exceeding the recommended amount relative to their revenue, suggesting a general reluctance to exceed standard guidelines.
Figure 4 Community Benefits Package by Gross Revenue Bucket (Under £25M, £25M-£250M and £250M+ Gross Revenue)
Source: See appendix F (Recommended data sources)
Deployment and Operating Costs
Figure 5 below shows the relationship between estimated total cost of production, expressed as the average cost of producing one unit of energy (LCOE – £/MWh) multiplied by total expected production over the project lifetime, and total community benefit commitments over the project lifetime. As above, the relationship is split and visualised by total cost of production levels due to the variation in the strength of the relationship as total cost changes. There is a positive correlation between total cost of production and total community benefit packages across all project sizes, suggesting that as total costs increase, as does the size of the overall commitment to community benefits. The correlation between total cost and total community benefit are relatively strong (Pearson correlation coefficient[56] = 0.56) at lower total cost levels (under £25M total cost). This increases to 0.62 for mid-sized projects (£25-250M total cost). However above £250M total costs, there is no correlation (Pearson correlation coefficient=-0.002), indicating that total cost plays less of a role in determining community benefits at large cost levels.
While this may appear contrary to the views of developers shown earlier (i.e. those who said that high costs can impact on financial viability and therefore their ability to offer community benefits) it should be noted that this data analysis is based only on projects that were already providing monetary community benefits. It excludes those that had not provided any benefits. It can therefore be assumed that the dataset excludes those projects that were deemed not financially viable enough to enable community benefit provision.
This analysis goes further to explore whether there are any differences by technology class within onshore projects only (offshore projects have been removed at this stage as the recommended £5,000/MW applies only to onshore technologies). In order to do so, it is important to control for project size (as measured by MW capacity), so as not to produce spurious results. Figure 6 illustrates how many pounds (£) are allocated to community benefits for every pound (£) spent producing energy, categorised by the project’s size in capacity (MW). Blue dots represent projects that have committed less than the recommended £5,000 per MW per year, while green dots represent projects that have committed more than the recommended amount and red dots represent project that have committed the recommended £5,000 per MW. For projects with total production costs under £25 million, when comparing hydro and onshore wind projects of the same capacity that both allocate £5,000 per MW annually to community benefits, onshore wind projects are actually providing more community benefits per pound (£) spent on energy production than hydro projects.
Figure 5 Community Benefits Package by Total Cost of Production Bucket (Under £25M, £25M-£250M and £250M+ Total Cost)
Source: See appendix F (Recommended data sources)
Figure 6 Community Benefits Package by Total Cost of Production Bucket (Under £25M, £25M-£250M and £250M+ Total Cost)
Source: See appendix F (Recommended data sources)
Appendix D Methodologies for estimating revenue and costs
Project Revenue
Simplified Annual Revenue Estimation – Generation Projects
The fundamental formula for estimating annual revenue is as follows:
Estimated Revenue = Expected Generation (MWh) * Electricity Price (£/MWh), where
Expected Generation (MWh) = Capacity (MW) * Capacity Factor* Hours in a year
Breaking down these components:
- Installed Capacity (MW): This represents the maximum power output of the project under ideal conditions. This data is readily available from the Renewable Energy Planning Database (REPD).
- Capacity Factor: This represents the actual output of a project as a percentage of its maximum potential output over a specific period. Historical capacity factors for certain technologies (onshore wind, offshore wind, hydro, landfill gas, and sewage sludge digestion) in Scotland can be found in the Energy Trends: UK Renewables publications[57].
- Addressing Missing Capacity Factors: For technologies where Scotland-specific capacity factors are unavailable (e.g., solar PV, tidal, wave, biomass), several approaches can be used:
- UK-wide Proxies: Use UK average capacity factors as a starting point, acknowledging this as a limitation and potential source of error.
- Technology-Specific Adjustments: Adjust UK proxies based on technology and location characteristics. For example, solar PV capacity factors are influenced by latitude and solar irradiance. Tools like PVGIS can provide location-specific solar irradiance data to refine estimates (this approach is out of scope for the analysis in this study).
- Addressing Missing Capacity Factors: For technologies where Scotland-specific capacity factors are unavailable (e.g., solar PV, tidal, wave, biomass), several approaches can be used:
- Average Annual Electricity Price (£/MWh): This represents the average price received for each MWh of electricity generated over a year. Given the difficulty of obtaining project-specific PPA data, the wholesale market price serves as a practical proxy.
- Wholesale Price Data Sources: While real-time wholesale price data requires plugging into Elexon’s BMRS API, a simplified approach for this framework should entail using Ofgem’s published weekly wholesale day-ahead price data[58] to calculate annual averages. These are GB-wide averages, and hence regional variations should be recognised as a limitation.
- Simplified CfD Approach (for CfD-supported projects): For projects under a Contract for Difference (CfD) the strike price is a guaranteed price. This figure is a conservative estimate of returns, as actual revenue could be higher if market prices exceed the strike price. CfD data is available from the Low Carbon Contracts Company (LCCC).
Estimating Future Revenue (also applicable for projects not yet operational) – Generation Projects
For revenue in future years, or for projects under development or construction, estimating future revenue requires additional considerations:
- Project Lifetime Assumption: Specify a reasonable assumed operational lifetime for the technology (e.g., 25 years for offshore wind, 20-25 years for solar PV). This assumption directly impacts total revenue calculations.
- Future Capacity Factor Estimation: Project future capacity factors based on recent trends and technological advancements. If historical capacity factor data for the specific technology in Scotland (or a similar region) is available, this trend should be analysed over the past years.[59] This trend should be extrapolated outward to estimate future capacity factors. For less established technologies with limited historical data, the technology’s maturity should be considered. Rapidly evolving technologies may see more significant performance improvements expected while more mature technologies might expect to see more stable future performance anticipated. For example, floating offshore wind might be expected to see larger capacity factor gains in the coming years compared to a more established technology like onshore wind.
- Future Electricity Price Estimation: Given the volatility of electricity markets, projecting future prices is challenging. For projects supported by a Contract for Difference (CfD), the strike price offers a guaranteed future revenue stream and can be used as a conservative estimate. For non-CfD projects, where future revenue is directly exposed to market price fluctuations, a simplified approach involves using the average annual CfD strike price for the corresponding technology in each future year. However, it’s essential to acknowledge that:
- CfD strike prices are influenced by auction dynamics and may not perfectly represent the market value of electricity from non-CfD projects.
- Not all technologies are represented in CfD auctions.
- Using CfD strike prices as proxies across all non-CfD projects might result in a somewhat conservative revenue estimate, as market prices could exceed the strike price in some years.
Prices beyond the latest future year reported in the CfD auction reports are set at the price in the latest year for the respective technology. For example, if CfD auction strike prices are set for the year 2027, the strike price in all future years will be set at the prices in 2027 for that technology. It is acknowledged these prices are unrealistic, however, they serve as the most appropriate benchmark against which to extrapolate.
- Discounting Future Cash Flows: To compare projects and scenarios, discount future revenue streams to their present value using an appropriate discount rate that reflects project risk. We propose using the technology-specific discount rate of 10% used by DESNZ in their Levelised Cost of Electricity (LCOE) methodology documents.
Total Cost of Production Calculation
Total Cost of Production Calculation – Generation Projects
Estimating the total lifetime cost of production across the range of projects in scope requires a consistent and transparent method to apply cost assumptions across different generation technologies. To support this, we use benchmark Levelised Cost of Electricity (LCOE) estimates published by DESNZ.
DESNZ’s LCOE values represent the average lifetime cost (£/MWh) of generating electricity for each technology type. These figures include all relevant capital, operational, fuel, and decommissioning costs, spread over the expected lifetime electricity output of a project. As such, LCOE is a useful and well-recognised benchmark for comparing the cost-effectiveness of electricity generation technologies in the UK.
Importantly, we are not re-estimating or recalculating LCOE. Instead, we are using DESNZ’s published LCOE values as input parameters in our framework to estimate total cost of production across different project configurations. Specifically, we apply the LCOE estimates to the expected energy output of each project to calculate a total cost figure. This calculation can be expressed as:
Total Cost of Production (£) = LCOE (£/MWh) x (Installed Capacity (MW) x Load Factor x Annual Operating Hours x Project Lifetime (years))
This approach allows us to derive a consistent estimate of total production cost, using technology-specific LCOE values as cost rates, scaled by the expected energy output of each project over its lifetime.
The process for estimating total cost of production is as follows:
- Technology categorisation: Categorise REPD projects to align with the technology categories used in the UK Government’s LCOE estimates file. This may involve mapping project types to the closest matching category in the government data.
- Energy Output Calculation: Estimate the annual energy output (MWh) for each project based on its capacity and typical capacity factors for the relevant technology.
- Total calculation: Using the scaled cost components and estimated energy output, we will calculate the total cost for each project using the formula. It’s important to note that the UK Government’s LCOE estimates are provided for projects with commissioning dates in 2025, 2030, 2035, and 2040. Therefore, our total cost calculations will need to be based on the estimate that most closely matches each project’s expected commissioning date. We will assign each project to the nearest available estimate year based on its planned commissioning date.
- Inflation-adjustment: Furthermore, all costs in the UK Government’s estimates are reported in 2021 prices. To ensure consistency and accurate comparisons across projects with varying commissioning dates, we adjust these figures to a common base year using HM Treasury GDP deflators. These temporal adjustments will help ensure that our total cost calculations accurately reflect the economic conditions and technological advancements expected at the time of each project’s commissioning, within the constraints of the available data.
Appendix E Socio-economic scoring mechanisms
Table 3 NASA Technology Readiness Levels
|
TRL |
TRL Summary |
|
1 |
Basic principles have been observed and/or formulated: Lowest level of technology readiness. Scientific research begins to be translated into applied research and development (R&D). Examples might include paper studies of a technology’s basic properties. |
|
2 |
Developing hypothesis and experimental designs: Invention begins. Once basic principles are observed, practical applications can be invented. Applications are speculative, and there may be no proof or detailed analysis to support the assumptions. Examples are limited to analytic studies. |
|
3 |
Specifying and developing an experimental Proof of Concept (PoC): Active R&D is initiated. This includes analytical studies and laboratory studies to physically validate the analytical predictions of separate elements of the technology. Examples include components that are not yet integrated or representative. |
|
4 |
PoC demonstrated in test site/initial evaluation of costs and efficiency produced: Basic technological components are integrated to establish that they will work together. This is relatively “low fidelity” compared with the eventual system. Examples include integration of “ad hoc” hardware in the laboratory. |
|
5 |
Technology/process validated in relevant environment: Fidelity of breadboard technology increases significantly. The basic technological components are integrated with reasonably realistic supporting elements so they can be tested in a simulated environment. Examples include “high-fidelity” laboratory integration of components. |
|
6 |
Technology/process validated in operational environment: Representative model or prototype system, which is well beyond that of TRL 5, is tested in a relevant environment. Represents a major step up in a technology’s demonstrated readiness. Examples include testing a prototype in a high-fidelity laboratory environment or in a simulated operational environment. |
|
7 |
System complete and qualified: Prototype near or at planned operational system. Represents a major step up from TRL 6 by requiring demonstration of an actual system prototype in an operational environment (e.g., in an aircraft, in a vehicle, or in space). |
|
8 |
Product/technology in manufacture/process being implemented: Technology has been proven to work in its final form and under expected conditions. In almost all cases, this TRL represents the end of true system development. Examples include developmental test and evaluation (DT&E) of the system in its intended weapon system to determine if it meets design specifications. |
|
9 |
Product/service on commercial release/process deployed: Actual application of the technology in its final form and under mission conditions, such as those encountered in operational test and evaluation (OT&E). Examples include using the system under operational mission conditions. |
|
10 |
Dead end and reached. |
Table 4 IEA Technology Guide Technology Maturity Scale
|
Technology Readiness Level |
Description |
|
11 |
Proof of stability reached |
|
10 |
Integration needed at scale |
|
9 |
Commercial operation in relevant environment |
|
8 |
First of a kind commercial |
|
7 |
Pre-commercial demonstration |
|
6 |
Full prototype at scale |
|
5 |
Large prototype |
|
4 |
Early prototype |
|
3 |
Concept needs validation |
|
2 |
Application formulated |
|
1 |
Initial idea |
Table 5 Market Maturity Scale
|
Score |
Reasoning |
|
5 |
Fully Mature Market: A fully mature market is characterized by high levels of competition, well-established regulatory and policy frameworks, and a global supply chain. The technology is fully integrated into the energy system, and investment is based on market forces rather than policy incentives. The market operates efficiently with clear pricing signals. Hydropower, especially conventional dam-based installations, has a fully mature market with a global presence and long history of integration into energy systems. |
|
4 |
Established Market: Established markets have a stable and supportive regulatory environment, a robust and competitive supply chain, and a broad base of stakeholders. Investment is seen as lower risk, and financing models are well understood. There is strong competition, and the technology is a significant part of the energy mix. Onshore wind and solar PV have both reached this level of market maturity, with widespread adoption and a solid market presence. |
|
3 |
Growing Market: At this stage, markets are experiencing noticeable growth in demand and investment. The regulatory environment is becoming more supportive, with clearer policies and standards. The supply chain is expanding, and costs start to decrease as economies of scale are realized. There is a healthy level of competition with several established players. Fixed-bottom offshore wind is at this stage, with a growing number of projects and increasing investor confidence. |
|
2 |
Emerging Market: Markets at this stage have begun to establish some regulatory frameworks and attract early adopters. The supply chain is forming but may not be fully reliable or cost-effective. There is a growing interest from investors, but financing often depends on policy incentives. Competition is limited, but there are signs of market growth. Floating offshore wind, which is beginning to see commercial interest and investment, but lacks the extensive market presence of fixed-bottom offshore wind, would fall into this category. |
|
1 |
Nascent Market: The market at this stage is in its infancy. There are few, if any, regulatory standards or guidelines, and the supply chain is undeveloped. Investment is highly speculative, and there are very few players in the market. The technology may still be reliant on grants or government support with no established commercial financing models. |
Appendix F Recommended data sources
The following below provides a summary of the key data sources currently available to measure framework parameters. However, these are not complete and additional work is required to fill gaps.
|
Parameter |
Measurement item |
Recommended data source |
|
Community Benefit |
Community benefits monetary value (£) |
Community Benefit Register Database. Since the database does not cover all technologies, this would need to be supplement with data from individual developers, either through requesting this directly or sourcing it from company reports (where available). |
|
Technical maturity |
Technology maturity scoring |
NASA TRL Scale IEA ETP Clean Energy Technology Guide. While the database is comprehensive in its technology classification, there is likely to be some mis-classification of REPD projects to specific IEA ETP technologies. Ideally, project TRLs should be sourced directly from project owners. |
|
Project revenue |
Installed capacity |
Community Benefit Register Database and REPD |
|
Capacity factor |
Energy Trends: UK Renewables publications. Historical capacity factors are only available for certain technologies. Newer technologies are therefore not captured and will need to be sourced directly from projects. | |
|
Electricity price |
Elexon Ofgem wholesale day-ahead price | |
|
CfD strike price |
Low Carbon Contracts Company | |
|
Capital and operating costs |
Technology categorisation |
UK Government’s LCOE estimates. This data source captures LCOE for a selection of common technologies. More niche/newer technologies are not captured within this data source and therefore should be collected directly through projects. |
|
Energy output |
REPD Energy Trends: UK Renewables publications |
How to cite this publication:
Mulholland, C., Jones, R., Tapie, N. and Stow, C. ‘Renewable energy technologies and community benefits’, ClimateXChange. http://dx.doi.org/10.7488/era/6396
© The University of Edinburgh, 2025
Prepared by Ipsos on behalf of ClimateXChange, The University of Edinburgh. All rights reserved.
While every effort is made to ensure the information in this report is accurate as at the date of the report, no legal responsibility is accepted for any errors, omissions or misleading statements. The views expressed represent those of the author(s), and do not necessarily represent those of the host institutions or funders.
This work was supported by the Rural and Environment Science and Analytical Services Division of the Scottish Government (CoE – CXC).
ClimateXChange
Edinburgh Climate Change Institute
High School Yards
Edinburgh EH1 1LZ
+44 (0) 131 651 4783
If you require the report in an alternative format such as a Word document, please contact info@climatexchange.org.uk or 0131 651 4783.
See Community benefits and shared ownership for low carbon energy infrastructure: working paper (accessible webpage) – GOV.UK ↑
Scottish Government (2020) ↑
Scottish Government (2024) ↑
Scottish Government (2019) ↑
Scottish Government (2023) ↑
Community benefit funds typically mean that developers will voluntarily contribute a certain amount of funding to local communities. In some cases, the level of funding is linked to the amount of installed capacity of the project or the amount of energy produced. ↑
Kerr et al (2017), Anchustegui (2021), Kerr & Weir (2018), O San Martin et al (2022), Scottish Government (2022), Scottish Government (2019), Scottish Government (2018) ↑
O San Martin et al (2022) ↑
Anchustegui (2021) ↑
Glasson (2020) ↑
https://localenergy.scot/community-benefits-register/ ↑
Kerr et al (2017) ↑
In the reviewed literature, shared ownership was a common practice in countries outside the UK, notably in Germany and Denmark. However, this is not outlined here as shared ownership is not part of the Scottish Government’s definition of community benefits. ↑
le Maitre, 2024; Toledano, et al., 2023; O San Martin, et al., 2022; ↑
Anchustegui, 2021 ↑
Lansbury Hall, 2020; Regen, 2022; Lane, et al., 2019; ↑
Energy UK, 2024 ↑
Centre for Sustainable Energy (CSE), 2005; Walker, 2023; Glasson, 2020; Chen, 2024 ↑
Regen, 2022 ↑
van den Berg & Tempels (2022); Glasson (2020) ↑
Kerr & Weir (2018), Scottish Government (2022) ↑
le Maitre (2024) ↑
Glasson (2020) ↑
Rudolph et al. (2014) ↑
Rudolph et al. (2014) ↑
Glasson (2020) ↑
Glasson (2020) ↑
Glasson (2020) ↑
SSE Renewables (2024) ↑
Regen (2022) ↑
Le Maitre et al. (2024) ↑
Wind Europe (n.d.); San Martin (2022); Arsenova et al. (2024); Anchustegui (2021) ↑
Klain et al. (2017) ↑
Lane & Hicks (2019) ↑
Lane & Hicks (2019) ↑
Chen et al. (2024); Klain et al. (2017); Rudolph et al. (2014) ↑
Glasson (2020), Manitius (2023), Arsenova & Wlokas (2019), BiGGAR Economics (2024a), BiGGAR Economics (2024b), Toledano et al. (2023) ↑
Klain et al. (2017) ↑
Wind Europe (n.d.) ↑
Chen et al. (2024), Klain et al. (2017) ↑
Arsenova & Wlokas (2019) ↑
Arsenova & Wlokas (2019) ↑
US Department of Energy (2024) ↑
Department for Energy Security and Net Zero (2023) ↑
Anchustegui, 2021; Kerr, 2017; le Maitre, 2024; Rudolph, et al., 2014; Toledano, et al., 2023; Arsenova,et al., 2019 ↑
Herrera (2021) ↑
Herrera (2021) ↑
le Maitre (2024) ↑
Toledano, et al. ↑
Arsenova, et al., 2024 ↑
Kerr et al (2017); le Maitre (2024) ↑
le Maitre (2024) ↑
BiGGAR Economics (2023) ↑
Four operational offshore wind projects were in Scotland, two in Wales and fifteen in England. ↑
The Pearson correlation coefficient measures how strongly two variables are linearly related, ranging from -1 (perfect negative correlation) to 1 (perfect positive correlation), with 0 indicating no linear relationship. ↑
https://www.gov.uk/government/statistics/energy-trends-section-6-renewables ↑
https://www.ofgem.gov.uk/energy-data-and-research/data-portal/wholesale-market-indicators Wholesale market indicators | Ofgem ↑
It is recommended to aim for a minimum of 5 years of historical data. This provides a reasonable basis for identifying trends and patterns, while also smoothing out short-term fluctuations or anomalies. ↑
As part of its commitment to achieving net zero by 2045, the Scottish Government has ambitions for Scotland to become a major exporter of low-carbon hydrogen and hydrogen derivatives and products (HDPs).
Hydrogen can be produced using electrolysis, a process which involves splitting water into hydrogen and oxygen. When this process is performed using only renewable sources of electricity, the hydrogen produced is known as green hydrogen.
This study explores Scotland’s capabilities of producing green hydrogen and developing the HDP sector, identifying opportunities and barriers it may face in scaling it up. It also aims to understand the role different regions of Scotland can play in enabling the growth of these sectors.
Findings
Scotland’s abundant access to renewable energy, geographic proximity to the EU, skilled workforce and a favourable external policy landscape are major strengths that can enable growth in the hydrogen and HDP sectors. However, there are potential weaknesses and barriers too. Producing renewable electricity, a major cost source for producing green hydrogen, is currently relatively expensive in Scotland, with prices around 70% higher than the average of EU and G7 countries.
Supply chain capabilities and addressable market demand
Following a systematic comparison of the supply chain capabilities of 14 potential hydrogen hubs identified by the Scottish Government, Aberdeen ranked the highest in many metrics, followed by Cromarty and Ayrshire.
The report also assessed the addressable market demand for HDPs. Roughly 97% of all HDP demand comes from the aviation and maritime sectors and Grangemouth was estimated to have the biggest market demand for both.
Co-locating demand and supply will enable the early scaling of Scotland’s hydrogen and HDP sectors as national network infrastructure is developed. Analysis of both supply and demand found that with the presence of a large chemicals industry and a major airport, Grangemouth outperforms all other hubs. Despite relative strengths in supply chain capability, Aberdeen is not the optimal region for co-locating supply with demand opportunities.
Policy gaps
Analysis of the policy landscape in the UK, the EU and Scotland suggests a number of potential approaches to help develop the hydrogen and HDP sectors. Scotland’s abundant access to renewable energy, strong workforce capabilities and demand potential can facilitate vibrant hydrogen and HDP sectors. However, Scotland will need to address issues such as:
- the high cost of electricity generation;
- a more sophisticated planning regime that considers both site demand and supply in order to optimise co-location strategies.
Working with the UK and foreign governments to capitalise on export opportunities will allow Scotland to expand its potential market size.
Cross-hub development
Although Aberdeen and Grangemouth stand out as having relative strengths in relation to supply chain capabilities and market demand, there are strengths and capabilities across the other potential hubs. Cromarty and Ayrshire offer strong supply chain capabilities. Glasgow and Fife present significant demand opportunities. The Western Isles and Argyll and Islands may require targeted support to enhance their supply chain capabilities, while the Scottish Borders may need support in developing greater regulatory experience.
This diversity points to the importance of a cross-hub approach, in addition to co-locating demand with supply. By balancing cross-hub collaboration with localised development, Scotland can maximise the potential of its hydrogen economy, driving the sector’s long-term growth and resilience.
For further information, please read the report.
If you require the report in an alternative format, such as a Word document, please contact info@climatexchange.org.uk or 0131 651 4783.
Research completed: April 2025
DOI: http://dx.doi.org/10.7488/era/6397
Executive summary
Aims
The Scottish Government is committed to achieving net zero emissions by 2045, five years ahead of the UK’s target. Scotland also aims to become a major exporter of low carbon hydrogen derivatives and products (HDPs) and has access to the abundant renewable energy necessary for their production. Hydrogen derivatives are chemicals produced from hydrogen that can more easily be stored and transported and then converted back to hydrogen for later use. Examples include ammonia and methanol. Hydrogen products, such as sustainable aviation fuels (SAFs), do not need a further conversion process and are used for a range of applications.
Hydrogen can be produced using electrolysis, a process which involves splitting water into hydrogen and oxygen. When this process is performed using only renewable sources of electricity, the hydrogen produced can be deemed as green hydrogen.
As green hydrogen supply is crucial for the development of HDP production, this study explores Scotland’s strengths and weaknesses in developing both the green hydrogen and HDP sectors. Throughout this study, the term “hydrogen and HDP sector” is used to include green hydrogen and HDPs produced using that green hydrogen.
This study analyses Scotland’s supply chain capabilities in producing HDPs and identifies opportunities and barriers it may face in scaling up the hydrogen and HDP sectors. It also aims to understand the role different regions of Scotland can play in enabling the growth of these sectors.
Findings
Scotland’s abundant access to renewable energy, geographic proximity to the EU, skilled workforce and a favourable external policy landscape are major strengths that can enable growth in the hydrogen and HDP sectors. However, there are potential weaknesses and barriers too. Producing renewable electricity, a major cost source for producing green hydrogen, is currently relatively expensive in Scotland, with prices around 70% higher than the average of EU and G7 countries.
Supply chain capabilities
The Scottish Government’s Hydrogen Action Plan identified 14 hydrogen hubs. This report systematically compared the supply chain capabilities of each for producing HDPs. Hubs were assessed on:
- Availability of feedstock (i.e., production source material)
- Economic factors from co-located industries
- Workforce and skills
- Infrastructure,
- Local policy and planning support, and
- Co-location with innovation institutions
For comparison, the Duisburg region of Germany was assessed against the same metrics, as a potential competitor to Scottish hubs.
Aberdeen ranked the highest in many metrics, followed by Cromarty and Ayrshire. The Duisburg hub also scored highly on several metrics. The aim was not to find a single best hub. Aberdeen’s high score suggests that it is currently relatively well-developed against the supply chain metrics, it does not suggest that this is the sole hub suitable for developing Scotland’s hydrogen and HDP sectors.
Addressable market demand
The report estimated the addressable market demand for HDPs in each hub. The HDPs considered were ammonia and e-methanol for the maritime sector, ammonia-based fertiliser for the agriculture sector, e-methanol feedstock for the chemical sector, and SAF for aviation.
The addressable demand for all HDPs in all the sectors is around 35 TWh. Roughly 97% of this comes from just the aviation and maritime sectors. Grangemouth is estimated to have the biggest market for HDPs in both sectors.
Co-locating demand and supply
Co-locating demand and supply will enable the early scaling of Scotland’s hydrogen and HDP sectors as national network infrastructure is developed. Aberdeen and Grangemouth both stand out as key hubs for the development of Scotland’s HDP economy. Analysis of supply and demand found that with the presence of a large chemicals industry and a major airport, Grangemouth outperforms all other hubs.
Despite relative strengths in supply chain capability, Aberdeen is not the optimal region for co-locating supply with demand opportunities because the maximum demand potential is higher in Grangemouth.
There are significant hazards associated with HDPs bringing associated regulatory requirements. Analysis of current Control of Major Accidents and Hazards (COMAH) site locations provides insight into the infrastructure and the expertise needed to handle HDPs safely. Fife, Glasgow, Moray and Grangemouth hubs have the most COMAH sites, bringing relatively strong experience in this regulatory environment.
Policy gaps
Analysis of the policy landscape in the UK, the EU and Scotland suggests a number of potential approaches to help develop the hydrogen and HDP sectors. Scotland’s abundant access to renewable energy, strong workforce capabilities and demand potential can facilitate a vibrant hydrogen and HDP sectors. However, Scotland will need to address issues such as:
- the high cost of electricity generation;
- a more sophisticated planning regime that considers both site demand and supply in order to optimise co-location strategies.
Working with the UK and foreign governments to capitalise on export opportunities will allow Scotland to expand its potential market size.
Conclusions
Hub development requires both a cross-hub approach and strategic co-location of regional supply and demand. Individual hubs should not be considered in isolation. Particular hubs score relatively highly but this does not preclude a very significant role for other hubs within the overall hydrogen and HDP sectors.
Aberdeen and Grangemouth stand out as having relative strengths in relation to co-location of supply chain capabilities with demand. Cromarty and Ayrshire offer strong supply chain capabilities. Glasgow and Fife present significant demand opportunities. The Western Isles and Argyll and Islands may require targeted support to enhance their supply chain capabilities. The Scottish Borders may need support in developing greater regulatory experience.
By balancing cross-hub collaboration with localised development, Scotland can maximise the potential of its hydrogen economy, driving the sector’s long-term growth and resilience.
Glossary / Abbreviations
Abbreviations
|
COMAH |
Control of Major Accident Hazards |
|
FEED |
Front-End Engineering Design |
|
FTE |
Full-Time Equivalent |
|
GHS |
Globally Harmonized System of Classification and Labelling of Chemicals |
|
GSMR |
Gas Safety (Management) Regulations 1996 |
|
GVA |
Gross Value Added |
|
HPBM |
Hydrogen Production Business Model |
|
HSBM |
Hydrogen Storage Business Model |
|
HSE |
Health and Safety Executive |
|
HTBM |
Hydrogen Transport Business Model |
|
IMO |
International Maritime Organization |
|
IPCEI |
Important Projects of Common European Interest |
|
IRENA |
International Renewable Energy Agency |
|
LOHC |
Liquid Organic Hydrogen Carrier |
|
MCH |
Methylcyclohexane |
|
MoU |
Memorandum of Understanding |
|
NSIP |
Nationally Significant Infrastructure Project |
|
NSTA |
North Sea Transition Authority |
|
NZHF |
Net Zero Hydrogen Fund |
|
REPD |
Renewable Energy Planning Database |
|
RFNBO |
Renewable fuels of non-biological origin |
|
SAF |
Sustainable Aviation Fuel |
|
SEPA |
Scottish Environment Protection Agency |
|
SIC |
Standard Industrial Classification |
Glossary of units
|
gCO₂e/MJ |
Grams of CO₂ equivalent per megajoule |
|
J |
Joule |
|
kg CO₂-eq/kg |
Kilograms of CO₂ equivalent per kilogram |
|
Wh |
Watt-hour |
|
m |
Metre |
|
% |
Percentage |
|
t |
Tonne |
|
W |
Watt |
Introduction
Scotland has set an ambitious target to reach net zero by 2045. To be able to achieve its targets, Scotland will have to rapidly decarbonise its economy. The Scottish Government is exploring options to use hydrogen to decarbonise certain sectors and to develop current HDP capabilities in support of climate goals. Scotland ultimately aims to produce 5 GW of low-carbon hydrogen by 2030 and 25 GW by 2045. In addition to reaching its net zero goals, the Scottish Government also aims to utilise these resources to capitalise on export and other economic opportunities. Green hydrogen is expected to be the dominant low carbon production method in Scotland. This study focuses solely on HDPs produced from green hydrogen, which are referred to as “HDPs” throughout this report.
In this study we aim to explore Scotland’s supply chain capabilities. To situate the need for this research, we conducted a review of existing literature (see Appendix A: Current state of play). Our review of the literature analyses the strengths that Scotland possesses to scale up its hydrogen and HDP sectors. It also details some of the biggest barriers that Scotland is likely to face. The review then focusses briefly on specific HDPs and their potential role in enabling Scotland’s transition to net zero.
We also analyse Scotland’s strengths and weaknesses in developing its capabilities. We focus on assessing the opportunities and challenges associated with exporting HDPs to the rest of the UK and the EU. Moreover, we aim to understand the role that different regions of Scotland can play in enabling the development of HDP production. We have identified 14 regional hydrogen hubs in Scotland from the Scottish Government’s Hydrogen Action Plan (2022), shown in Table 1. In addition to the Scottish hubs, the study also considers the Ruhr region of Germany as an alternative hub. Scotland is expected to export a significant amount of its green hydrogen produce to the EU. Therefore, the Ruhr region of Germany was considered as a potential alternative source of green hydrogen for the EU.
For each metric, we rank the hubs to analyse their relative strengths, before combining these rankings into a final capability score for each hub in Section 3.8. In this manner, we provide a balanced and quantitative assessment of the relative supply chain capabilities of Scotland’s hydrogen hubs. It is important to note that the purpose of this analysis is not to find the absolute “best” hydrogen hub in Scotland. By ranking the hubs in each metric, we have assessed their relative strengths and weaknesses.
In an international market, Scotland’s hubs will be competing with various other green hydrogen and HDP production areas. As Scotland aims to export to Europe, in particular Germany, it will have to compete with local European production (Scottish Government, 2024). Germany’s Ruhr region aspires to be the first model hydrogen region to accelerate the hydrogen sector in Europe (Hydrogen Metropole Ruhr, 2023). Hydrogen is already playing a role in developing HDP production in the region (Metropole Ruhr Business, 2025). One example is the Greenlyte’s project in Marl which is producing e-methanol from CO2 and green hydrogen. In August 2025, this project secured a 7-figure e-methanol offtake agreement with Germany-based MB Energy, indicating substantial market interest for HDPs produced in the Ruhr region (Greenlyte, 2025). Given Ruhr’s strong ambitions, to evaluate Scotland’s competitiveness at the international level, we will compare the Scottish hubs with the hydrogen hub of Duisburg, situated in the Ruhr region.
In subsequent chapters, we analyse the supply chain capabilities of each hub in Scotland, addressable demand for various HDPs in different sectors, and the regulatory environment related to safety. The final chapter focusses on the wider policy landscape, analysing gaps and providing recommendations to policymakers.
Table 1: List of Scottish hubs and their corresponding local authorities.
|
Hub |
Corresponding local authorities |
|
Aberdeen |
Aberdeenshire and Aberdeen City |
|
Argyll and Islands |
Argyll and Bute |
|
Ayrshire |
East Ayrshire, North Ayrshire, and South Ayrshire |
|
Cromarty |
Highlands |
|
Moray |
Moray |
|
Dumfries and Galloway |
Dumfries and Galloway |
|
Dundee |
Dundee and Angus |
|
Fife |
Fife |
|
Glasgow |
East Dunbartonshire, East Renfrewshire, Glasgow City, North Lanarkshire, Renfrewshire, South Lanarkshire and West Dunbartonshire |
|
Grangemouth |
Clackmannanshire, Falkirk and Stirling |
|
Orkney |
Orkney Islands |
|
Scottish Borders |
Scottish Borders |
|
Shetland |
Shetland Islands |
|
Western Isles |
Western Isles |
Supply chain capabilities of Scotland’s hydrogen hubs
In this chapter, we investigate the relative supply chain capabilities of Scotland’s hydrogen hubs to produce HDPs. We have selected six capability groups for evaluation (shown in Table 2). These groups are broadly based on the six key advantages for hydrogen production identified in the Scottish Government’s Hydrogen Action Plan (2024). Certain capability groups, such as pipeline infrastructure, are highly dependent on future developments at a national and international level. The results from analysing all these capability groups will allow us to assess each hub’s intrinsic and long-term supply chain strengths that will enable the fast growth of the hydrogen and HDP sectors.
We have then broken down these groups further into assessment metrics in order to accurately evaluate the capability groups against available data. This analysis produces detailed hub differentiation to support actionable conclusions for policymakers. Table 2 shows each capability group and their associated metrics. Further information on metric methodology, sources and data is found in Appendix B.
Table 2: Capability groups and assessment metrics for evaluating the supply chain capabilities.
|
Capability group |
Assessment metric |
|
Feedstock and inputs |
Maximum potential renewable power generation |
|
Water availability | |
|
Economic output from relevant co-located industries |
Gross Value Added of the energy sector |
|
Workforce and skills |
Full time equivalent workers in energy and engineering |
|
Future workforce requirements | |
|
Infrastructure |
Large-scale storage capacity |
|
Pipeline network infrastructure | |
|
Ports | |
|
Local policy and planning support |
Processing time for industrial planning applications |
|
Success rate of industrial planning applications | |
|
Co-location with innovation institutions |
Innovation institutions with facilities for pilot-scale testing |
Feedstock and inputs
Renewable electricity and water are the two fundamental feedstocks for green hydrogen production. The availability of both can be seen to vary, by region. This is in contrast to the supply of nitrogen for e-ammonia or carbon dioxide for e-methanol, where both feedstocks are derived from air, via direct air capture and can therefore be assumed to be equally available to all hubs.
Maximum potential renewable power generation
Scotland’s abundant renewable energy resources are key to its net zero transition. In particular, the Scottish Government has identified Scotland’s extensive offshore wind resource as a considerable opportunity for green hydrogen production (Scottish Government, 2020). Under a business-as-usual scenario, installed offshore wind capacity is expected to rise from 3.4 GW in 2025 to 27 GW in 2045 (Scottish Government, 2020). Green Hydrogen production can support this growth by helping to overcome Scotland’s grid constraints.
The co-location of renewable energy generation and HDP production takes advantage of existing infrastructure, reduced electricity transmission costs and improved project economics. An example of co-location is Scottish Power’s planned 20 MW Whitelee Green Hydrogen Project near Glasgow (Scottish Power, 2024). The facility will be co-located with a 70 MW combined Solar and Battery Energy Storage Scheme. Adjacent is the 539 MW Whitelee Windfarm and substation.
We have analysed the maximum potential renewable power generation for each hub, based on the total current, planned and announced installed capacity of solar and wind power projects (DESNEZ, 2024; Offshore Wind Scotland, 2024). We scaled the resulting capacities by the appropriate load factor to determine the maximum potential renewable power generation (see Appendix B for load factors). For offshore wind, we assigned each project to the hub associated with its current or forecasted onshore landing point.
Figure 1: Maximum potential renewable power generation split by current and future (planned and announced) projects.
The order of hubs by maximum potential renewable power generation is shown in Figure 1. As shown from left to right, Aberdeen is ranked first and Duisburg, Germany is ranked last.
We can take several key insights from Figure 1:
- Access to future wind projects, particularly offshore wind, broadly determines which hubs have the most renewable power capability. Aberdeen, ranked first, accounts for around 50% of planned and announced offshore wind capacity among the Scottish hubs.
- Hubs with large future offshore wind projects – such as the announced ScotWind projects – lead the rankings (Offshore Wind Scotland, 2024). These hubs include Aberdeen, Cromarty and Moray.
- Grangemouth, with no current or future offshore wind capacity, ranks lowest among the Scottish hubs.
- As a densely populated hub, with no offshore wind, Duisburg ranks lowest overall.
Water availability
Sustainable water management is vital to balancing our water demand with environmental and ecological needs. Therefore, it is important to identify the water supply for hydrogen production early in the development process to ensure sufficient availability.
The electrolysis process requires large volumes of treated water, which is split to form hydrogen and oxygen. Reviewing the commercial electrolyser technologies, an estimated 10 litres of water is required per kilogram of green hydrogen produced (Ramboll, 2022). Water for green hydrogen production can be obtained from several sources, shown in Table 3:
Table 3: Sources of water for green hydrogen production (Ramboll, 2022).
|
Type of water |
Definition for the purpose of this study |
|
Effluent |
Treated effluent from Scottish Water’s Wastewater Treatment Works |
|
Surface water |
Freshwater abstracted from rivers, lochs and reservoirs |
|
Groundwater |
Freshwater abstracted from bedrock |
|
Potable water |
Drinking water |
|
Sea water |
Saltwater which is abstracted and desalinated |
Where possible a local water supply should be used for green hydrogen production, due to the cost of transporting water over long distances (Ramboll, 2022). Ramboll proposes that effluent should be the first water source considered as it does not compete with other sectors such as agriculture. Surface water, groundwater and potable water may be sourced from the mains water supply dependant on capacity and infrastructure availability. However, the use of potable water should be avoided where possible (Ramboll, 2022). While desalination has not been established for water supply in Scotland, the use of seawater may be an interesting option for the future hub development, particularly for island hubs which have less connectivity to mains infrastructure. However, for this analysis, we have focused on Scotland’s current water infrastructure capabilities from mains water supply and regional Scottish Water Wastewater Treatment Works.
In 2022, Ramboll, on behalf of SGN, investigated the water availability for green hydrogen production across Scotland (Ramboll, 2022). Drawing on Ramboll’s work, Table 4 shows the maximum green hydrogen production potential, based on water availability and the forecasted installed green hydrogen production capacity in 2045. We used these figures to assess water availability for the forecasted installed capacity in 2045. For Duisburg, we applied the same assumptions used for the Scottish hubs (Ramboll, 2022, pp. 26-27).
Table 4: Water availability ranking by hub
|
Hub |
Forecasted installed green hydrogen capacity in 2045 (GW) |
Maximum potential installed green hydrogen production based on water availability (GW) |
Water availability ranking |
|---|---|---|---|
|
Glasgow |
2.50 |
239.2 |
1 |
|
Grangemouth |
2.00 |
145.9 |
2 |
|
Dundee |
0.25 |
73.0 |
3 |
|
Fife |
0.25 |
67.8 |
4 |
|
Cromarty |
5.00 |
61.2 |
5 |
|
Ayrshire |
0.50 |
47.5 |
6 |
|
Aberdeen |
0.50 |
44.5 |
7 |
|
Dumfries and Galloway |
0.50 |
26.7 |
8 |
|
Moray |
2.00 |
26.6 |
9 |
|
Scottish Borders |
0.00 |
22.9 |
10 |
|
Duisburg |
1.00 |
14.0 |
11 |
|
Argyll and Islands |
0.13 |
11.4 |
12 |
|
Western Isles |
0.12 |
9.1 |
13 |
|
Orkney |
0.05 |
1.5 |
14 |
|
Shetland |
6.30 |
2.0 |
15 |
The relative water availability for hubs is shown in Table 4, from which we can take several key insights:
- Overall, water availability is unlikely to limit the deployment of forecasted green hydrogen installed capacity. However, future water abstraction may be limited by regulatory changes, land use restrictions, and competing demand.
- Shetland is ranked in last place as it is the only hub where forecasted green hydrogen production requires more water than is currently deliverable. This issue could be mitigated if desalination infrastructure is made available.
- Populous areas are more favourable for expanding green hydrogen production capacity based on water availability. These areas have greater effluent wastewater availability, which does not compete directly with other use cases. For example, Glasgow could potentially produce up to 203 GW of green hydrogen from effluent water. Orkney, in comparison, could only produce up to 0.03 GW.
- The island hubs (Western Isles, Orkney and Shetland) rank lowest. This is due to their limited freshwater supply and small population.
Economic output from relevant co-located industries
Gross Value Added of the energy sector
To evaluate the economic output from relevant co-located industries, we have compared the gross value added (GVA) of the energy sector in each hub. A high GVA signals that a region has a strong existing industrial base, infrastructure and workforce for the energy sector. This makes GVA a useful indicator of the investment attractiveness of establishing local hydrogen and HDP sectors.
Using the Scottish Government’s Industry Statistics, we have calculated the approximate gross value added of the energy industry for each hub in 2022 (Scottish Government, 2024). The definition of energy sector is based on Standard Industrial Classification (SIC) Codes 2007 and is outlined further in Appendix B. Generally, these SIC codes cover the following industries:
- Fossil fuel extraction and mining
- Manufacturing of petroleum products and other organic chemicals
- Energy supply e.g. electricity
- Water processing and supply
- Waste treatment and disposal
- Engineering and environmental consultancy
Figure 2: Estimated balanced GVA of the energy sector (2022).
The order of hubs by energy sector GVA is shown in Figure 2 from left to right. Aberdeen’s energy sector has the highest GVA at £25.9 billion in 2022; the Western Isles has the lowest, with a GVA of £16.8 million. Aberdeen, as the primary base of operations for the UK’s offshore oil and gas industry, is by far the major contributor to Scotland’s energy sector GVA (Port of Aberdeen, 2025).
For Duisburg, we conducted a separate analysis to allow comparison on a like-for-like basis using available data. Considering the Production Sector, as defined by SIC Codes 2007, Duisburg is ranked second after Aberdeen with a GVA of £4.15 billion (Länder, 2024; Office for National Statistics, 2024).
Workforce and skills
For this capability group, we have assessed the current workforce and the future workforce metrics for each hub. The expanding hydrogen and HDP sectors will demand a skilled and educated workforce. Scotland’s existing energy and engineering professionals are best positioned to make this transition, although not all will do so. To account for this unknown, we have evaluated future workforce requirements as well as the current transferable workforce.
Full time equivalent workers in energy and engineering
We have analysed the number of full-time equivalent (FTE) workers in these sectors (Skills Development Scotland, 2024). This will provide us with an indication of the relative workforce availability between the hubs.
Figure 3: Number of FTE workers in the energy and engineering sectors by hub
Figure 3 shows that Aberdeen has the most workers in energy and engineering with 71,100 FTEs; the Western Isles ranks lowest with only 400 FTEs. We can take several key insights from Figure 3:
- Aberdeen and Glasgow are the hubs with the largest transferable workforce. Among all the hubs, Aberdeen and Glasgow contain 70% of all FTE workers in energy and engineering.
- Skilled workforce availability may be a challenge for island hubs. There are only 1600 FTEs in energy and engineering across Shetland, Orkney and the Western Isles combined.
Future workforce requirements
We evaluated the hubs in terms of their future workforce requirements, analysing estimated demand for Scottish workers in the energy and engineering sectors. Labour forecasts can be divided into two categories: replacement demand and expansion demand. For this study, we have only considered expansion demand[1].
Positive expansion demand represents increasing labour demand due to sector growth. Negative expansion demand suggests shrinking sectors, demanding less labour. The time period considered for this analysis was 2027-2034.
Hubs with higher expansion demand will see more competitive labour market conditions. Growing hydrogen and HDP sectors in such hubs can be expected to increase labour competition further. Hubs with negative expansion demand are expected to have less competitive labour market conditions in the future. Growing the HDP sector in such hubs will not exacerbate competition for skilled workers, as the number of jobs is likely to exceed the number of available workers.
Figure 4: Estimated expansion labour demand in energy and engineering sectors.
Figure 4 shows Aberdeen with the lowest expansion demand of -4,600 people. This means the engineering and energy sectors in Aberdeen will require 4,600 fewer workers in the period 2027-2034 compared to today. Glasgow, Fife, Ayrshire and Grangemouth follow with expansion demands between around -1,500 (Glasgow) and -700 (Grangemouth). These hubs are likely to have the least competitive labour market conditions in the future, implying less competition for workers in the growing hydrogen and HDP sectors. As Figure 4 shows, none of the hubs is forecast to have positive expansion demand: more additional workers are not expected to be needed in any hub. The labour market environment for engineering and energy jobs, within each of the hubs, appears to be favourable for growing Scotland’s hydrogen and HDP sectors.
It is worth reiterating that replacement demand has not been considered in this analysis. Therefore, it is important to understand that this analysis does not provide a full image of the future labour market for the hubs in these two sectors.
Infrastructure
Regional infrastructure is key for facilitating the storage, distribution and trade of green hydrogen to supply HDP production. In A Trading Nation – Realising Scotland’s Hydrogen Potential – A Plan for Exports, the Scottish Government identified ports, pipelines and large-scale storage as the three connectivity pillars required to enable the hydrogen and HDP sector’s growth (2024). Here, we investigate each hub’s relative strengths.
Large-scale storage capacity
Large-scale storage will be required to scale up hydrogen production and balance supply and demand. This scale of storage will likely be provided by underground geological storage, rather than aboveground storage which is constrained by land availability. There are several types of geological storage, which are described in Table 5.
Table 5: Types of geological storage for hydrogen and their technology readiness levels (ClimateXChange, 2023).
|
Geological storage technology |
Description |
Technology readiness level (1 = lowest, 9 = highest) |
|---|---|---|
|
Salt caverns |
Most mature hydrogen storage technology, formed of an underground cavity in a rock salt layer. |
9 |
|
Saline aquifers |
Deep, porous rock formations filled with salty water. Previously used for commercial town gas (50% hydrogen) storage. |
2-3 |
|
Depleted oil and gas fields |
Former fields can be repurposed for storage. This technology already provides the majority of global gas storage capacity. |
3-4 |
There are currently no projects to develop commercial geological hydrogen storage in Scotland. Moreover, apart from salt caverns, these technologies are still immature. So, we have assessed the technical geological storage capacity for each hub. For this, we have used available estimates from scientific literature. We assigned storage capacities to each hub based on their location or, if offshore, their likely terminal. The locations and total technical capacity for each storage technology is shown in Table 6.
Table 6: Technical capacity and locations for geological storage types in Scotland.
|
Type of storage |
Locations in Scotland |
Technical capacity in Scotland (TWh) |
|---|---|---|
|
Onshore salt caverns |
|
0 TWh (ClimateXChange, 2023) |
|
Offshore salt caverns |
|
Unknown |
|
Saline aquifers |
|
2048 TWh of offshore storage capacity (Safidi, et al., 2021). |
|
Depleted oil and gas fields |
|
1115 TWh maximum potential capacity including producing fields (Peecock, et al., 2022) |
We scored the hubs based on their total geological storage capacity for hydrogen. We then adjusted these scores to account for the possibility of developing offshore salt caverns and planned pipeline connections to English salt caverns.
Figure 5: Large-scale storage capacity by hub.
Figure 5 shows the relative strength of hubs in terms of geological storage capacity. As shown from left to right, Aberdeen is ranked highest, and the Western Isles is ranked lowest. We can take several key insights from our analysis and the rankings in Figure 5:
- The most attractive hubs – Aberdeen, Moray, Shetland – are those with terminals for potential offshore geological storage infrastructure.
- There is a vast opportunity, particularly in Aberdeen, for repurposing depleted oil and gas fields as production tails off. This would extend the fields’ economic value and build on Scotland’s oil and gas expertise.
- With the construction of a national hydrogen pipeline infrastructure, connected hubs with a lack of geological storage may be able to pipe hydrogen to other storage facilities.
- Duisburg is advantaged by the fact that nearby hydrogen storage projects are under development (e.g. the RWE Gas Storage West project in Epe) (Hornby, 2023). These projects will be connected to Duisburg by the approved German core hydrogen network.
Pipeline network infrastructure
Scotland is actively pursuing several large-scale hydrogen pipeline projects to maximise the potential of our hydrogen and HDP sector (Scottish Government, 2024). Several key projects include the National Gas Project Union and an offshore pipeline from Scotland to Germany:
- National Gas Project Union will repurpose sections of the UK National Transmission System to carry 100% hydrogen (National Gas, 2025). These transmission pipelines will stretch from St Fergus in Aberdeenshire, down Scotland’s east coast and throughout the UK.
- The H2 Caledonia project plans to construct new hydrogen transmission pipeline to support the creation of Scotland’s hydrogen ecosystem (SGN, 2023). This project combines pre-FEED projects in Scotland’s Central Belt, Fife’s East coast and the Aberdeen Vision study.
- The Scottish Government is in Phase 2 of a project which is considering the development of an offshore pipeline from northeast Scotland to Germany. This would connect Scotland to the European Hydrogen Backbone pipelines (2024).
To score each hub’s potential pipeline infrastructure, we used the following scale from 1-6:
- There is no pipeline infrastructure suitable for hydrogen and no proposed or planned new hydrogen pipelines.
- There are existing gas pipelines which can be repurposed. There are no planned new hydrogen pipelines but there may be some projects proposed.
- There is a small-scale (e.g. distribution/spur pipelines) hydrogen pipeline project at any phase of development.
- There is a large-scale (e.g. trunkline pipelines) hydrogen pipeline project at any phase of development.
- The hub is a potential international export or import site for hydrogen and HDPs. However, the planned pipeline infrastructure is insufficient and/or the site is not well-established for international trade.
- The hub is a potential international export or import site for hydrogen and HDPs. There is sufficient planned pipeline infrastructure, and the site is well-established for international trade.
Figure 6: Hydrogen pipeline network infrastructure by hub.
Figure 6 shows the final hub scores for hydrogen pipeline infrastructure. As shown from left to right, Aberdeen is ranked highest, and the Argyll and Islands is ranked lowest.
We can take several key insights from our analysis and the hub rankings in Figure 6:
- In Scotland, Aberdeen, Cromarty, Orkney and Shetland are all hubs which could support export activity. They are all being considered as export locations for the Scotland to Germany pipeline project (Net Zero Technology Centre, 2023).
- Aberdeen and Duisburg rank highest with a score of 6/6.
- In the Aberdeen hub, St Fergus Gas Terminal is recognised as a well-established export route. St Fergus will be connected to the rest of the UK by the Project Union Hydrogen backbone pipeline project.
- With the largest inland container port in the world, Duisburg is planning to be a major import hub for hydrogen and HDPs (Gasunie, 2023). The approved 9,040 km German hydrogen core network should connect Duisburg sufficiently (Bundesnetzagentur, 2024).
- Hubs on the east coast of Scotland will benefit most from national and international trading opportunities. This is due to their relative proximity to mainland Europe and their planned connection to the Project Union and H2 Caledonia pipelines.
Ports
Access to ports is crucial for hydrogen hubs for several reasons:
- To engage in the trading and export of hydrogen (as a liquid, gas or LOHC) and HDPs by ship.
- To capitalise on the growing demand for HDPs to be used as shipping fuels, such as ammonia and e-methanol.
We have investigated which hubs are most suitable for meeting maritime shipping fuel demand and for trading hydrogen and HDPs by ship. To evaluate the scale of each hub’s maritime industry, we first scored the hubs based on the total freight traffic through their ports. This analysis was based on the Department for Transport’s Port Freight Statistics Publication (Maritime Statistics, 2024). We adjusted these initial scores based on several criteria, including:
- Does the hub have a port with existing or planned infrastructure for the storage, production or maritime fuelling of hydrogen/HDPs?
- Does the hub have a port with dimensions suitable for a typical small carrier vessel for transporting gas or ammonia? The Scottish Government defines these dimensions as a 100m length, 25m beam and a 12m draft (2020, p. 63).
- Does the hub have a port which is suitable for hydrogen/HDP exports to mainland Europe, as considered by the Scottish Government? Or, for Duisburg, is the hub a key port for hydrogen imports into Europe?
Figure 7: Port suitability for the hydrogen sector (higher score = more suitable).
Figure 7 shows the final hub scores and ranking for ports. As shown from left to right, Duisburg is ranked highest, and the Scottish Borders is ranked lowest. Several key insights can be made based on our analysis:
- Duisburg ranks highest with regards to port suitability for the hydrogen and HDP sector. As the largest inland container port in the world, Duisburg has by far the largest potential maritime fuel demand (Duisburger Hafen HG, 2025).
- Considering all of Scotland’s ports, Forth Ports in Grangemouth and Fife have the most freight traffic at around 19 million tonnes in 2023. Although, this figure only represents around half of Duisburg’s total freight traffic.
- The Scottish Government considers that the Aberdeen, Fife, Grangemouth, Shetland, Cromarty and Orkney hubs are most attractive for exports to Europe (2020). These hubs also have existing or planned port infrastructure for hydrogen.
- Without port redevelopment, most hubs do not have ports with suitable dimensions for the trade of ammonia by a typical carrier vessel. Those that do include Cromarty, Shetland, Aberdeen and Orkney.
- The Scottish Borders ranks lowest as it has no major or minor freight traffic in the region, and it scored negatively for all additional criteria.
Local policy and planning support
In Scotland, most industrial planning applications must be approved at the local council level. Local policy and planning support are crucial in sanctioning the construction of hydrogen hubs in Scotland. Streamlined planning processes and supportive local policy will help expedite the development of a robust infrastructure network. To investigate this capability group, we evaluated the industrial planning process duration and success rate for each hub. Hubs with shorter processing times and higher success rates for planning applications indicate that they are more supportive of industry and can support new infrastructure more efficiently.
Processing time for industrial planning applications
To assess hub processing time for industrial planning applications, we have taken an average of the relevant council areas. For Duisburg, the average processing time for construction permits in Germany is used (World Bank, 2024).
Figure 8: Average industrial planning process duration
Figure 8 shows the average number of weeks taken to process an industrial planning application in each hub. Ayrshire and Aberdeen are ranked highest with an average of 6.7 weeks of processing time, while Duisburg has an average 18-week processing time. Several insights can be taken from this analysis:
- Among the Scottish hubs, the range in average processing time is 10.9 weeks. The range of number of weeks taken is from 6.7 weeks to 18 weeks. This indicates disparity in local planning efficiency.
- On average, Scottish hubs process planning applications seven weeks faster than German industrial planning applications.
Success rate of industrial planning applications
To calculate the hub success rate for industrial planning applications, we have taken an average of the relevant council areas (Planning Application Statistics, 2024). No data was found for Duisburg, Argyll and Islands, Dumfries and Galloway, Moray, Orkney, Shetland or the Western Isles.
Figure 9: Hubs by average success rate of industrial planning applications.
Figure 9 shows the average success rate of industrial planning applications in each hub. The Scottish Borders is ranked highest with an average of 88%, while Ayrshire ranks lowest with an average of 50%.
When considering the average success rate and processing times for industrial planning applications together, Aberdeen is the most favourable hub for local planning and policy support. However, these two metrics do not always go hand-in-hand. While Ayrshire has the shortest processing duration for planning applications, these applications are also the least successful on average.
Co-location with innovation institutions
Innovation institutions with facilities for pilot-scale testing
Formed by Scottish Enterprise, the Scottish Hydrogen Innovation Network (SHINe) aims to support Scotland’s hydrogen and HDP sectors and accelerate innovation. SHINe innovation institutes can streamline access to the necessary infrastructure and expertise required to develop a successful hydrogen and HDP sectors. To assess this metric, we ranked the hubs by the number of SHINe institutions present. Innovation institutions include a range of projects like pilot-scale manufacturing capabilities of hydrogen related components, green hydrogen production, research centres, etc (Table 7). For Duisburg, we have assessed the number of comparable innovation institutions in the area (Scottish Enterprise, 2025).
Table 7: Innovation institutions and their capability for pilot-scale manufacturing by hub. Hub ranking is shown descending from the top (highest) to bottom (lowest) of the table.
|
Rank |
Hub |
Innovation institutions |
Pilot-scale manufacturing |
|
1 |
Duisburg |
NH3toH2 |
Yes |
|
H2BF |
Yes | ||
|
ELECKTRA II |
Yes | ||
|
1 |
Aberdeen |
Energy Transition Zero |
Yes |
|
HyOne |
Yes | ||
|
Net Zero Technology Centre |
Yes | ||
|
2 |
Glasgow |
Glasgow Hydrogen Innovation Centre |
Yes |
|
Energy Technology Partnership |
Yes | ||
|
Power Networks Demonstration Centre |
No | ||
|
3 |
Dundee |
Michelin Scotland Innovation Parc |
Yes |
|
3 |
Orkney |
European Marine Energy Centre |
Yes |
|
4 |
Cromarty |
Powerhouse |
No |
|
5 |
All other hubs |
There are no SHINe innovation institutions. |
No |
From Table 7, we can take away several key insights:
- Aberdeen and Duisburg have the highest number of innovation institutions with pilot-scale manufacturing capabilities.
- SHINe innovation institutions are mostly concentrated in Scotland’s major cities – Aberdeen, Glasgow, Dundee and Edinburgh. One exception, with pilot-scale manufacturing capabilities, is the European Marine Energy Centre in Orkney.
- The majority of hubs have no local SHINe innovation institutions.
Financial aspects
While not included in the scope of this project, we recognise that financial aspects can impact hydrogen hub supply chain development. According to the UK Government, the UK’s industrial electricity prices were 25.85 pence per kWh in 2023 including taxes (Energy Prices Statistics Team, 2024). This price is 70% higher than the average of the EU and G7 countries. As electricity costs account for some 70% of the total cost of green hydrogen, these high prices could hamper grid-connected project economics (Renewable UK & Hydrogen UK, 2025). Regional hubs with higher electricity prices could be impacted more. Notably, North Scotland has some of the highest electricity distribution costs in the UK (Gallizzi, 2025). Additionally, rural hubs may experience greater transportation costs to procure goods, services, and labour. For island-based hubs, reliance on a rotational workforce from the mainland could further impact their competitiveness by driving up labour costs.
Overall supply chain capabilities
To assess overall supply chain capabilities, we have calculated a total score for each hub from the metrics discussed above. Each metric has been assigned a specific weight, based on their importance to producing HDPs and the confidence in the quality of available data. Table 8 shows the final weightings we applied to each metric. For each hub, we scaled each metric by the relevant weighting. We then summed the resulting metric scores to give a final score out of 100. The overall hub ranking for supply chain capability is shown in Figure 10.
It is important to note that the purpose of this analysis is not to find the absolute “best” hydrogen hub in Scotland. By ranking the hubs in each metric, we have assessed their relative strengths and weaknesses. This detailed analysis provides the nuance required to understand each hub’s overall supply chain capabilities. The metric weightings selected provide an expert-based view on the supply chain capabilities of each hub. However, as shown by sensitivity analysis (detailed in Appendix B), hub rankings can vary when metric weightings are altered. The conclusions drawn from the final hub scores detailed below should be viewed in this context.
Table 8: Metric weightings for final hub scoring.
|
Priority ranking |
Group weighting |
Capability group |
Metric |
Metric weighting |
|---|---|---|---|---|
|
1 |
25% |
Feedstock and inputs |
Maximum potential renewable power generation |
15% |
|
Water scarcity |
10% | |||
|
2 |
23% |
Workforce and skills |
Full time equivalent workers in energy and engineering |
13% |
|
Future workforce requirements |
10% | |||
|
3 |
22% |
Infrastructure |
Large-scale storage capacity |
3% |
|
Pipeline network infrastructure |
7% | |||
|
Ports |
12% | |||
|
4 |
15% |
Local policy and planning support |
Processing time for industrial planning applications |
12% |
|
Success rate of industrial planning applications |
3% | |||
|
5 |
10% |
Economic productivity of the energy sector |
Gross Value Added of the energy sector |
10% |
|
6 |
5% |
Co-location with innovation |
Innovation institutions with facilities for pilot-scale testing |
5% |
Figure 10: Final scores for hub supply chain capability.
From Figure 10, our analysis suggests that the Aberdeen hub has the greatest relative supply chain capability (90/100), while Argyll and Islands has the lowest (27/100). There are several conclusions that we can take from these final scores:
- Aberdeen stands out as being particularly capable to support the hydrogen and HDP sector. The hub ranked highest for 7 metrics out of 11, including:
- Maximum renewable power generation
- GVA of the energy industry
- Full-time equivalent workers in energy and engineering
- Large-scale storage capacity
- Pipeline network infrastructure
- Processing time for industrial planning applications
- Innovation institutions with facilities for pilot-scale testing
- Cromarty and Glasgow are also identified as attractive hubs.
- The Cromarty hub benefits from excellent access to offshore wind developments, a strong current workforce and major port infrastructure at Cromarty Firth with identified export opportunities.
- The Glasgow hub benefits from a particularly strong workforce capability and plentiful access to effluent water as well as support from innovation institutions and major port infrastructure from the Clydeport network.
- While specific strengths vary between hubs, the majority of Scotland’s hydrogen hubs can be broadly grouped by overall supply chain capability.
- Cromarty, Glasgow, Fife, Grangemouth and Ayrshire fall into an “upper category” with scores ranging only three points (58-61).
- Dundee, Moray, Dumfries and Galloway, Shetland Orkney and the Scottish Borders broadly fall into the “lower category” with scores ranging from 40-47.
- The Aberdeen hydrogen hub offers a promising opportunity to compete with local Duisburg supply in the Ruhr region. However, considering their similarly high scores, any of the Scottish hubs in the “upper category” may also be considered to be well placed. As the Ruhr area aims to be a model hydrogen region, this result indicates Scotland’s potential competitiveness in the European market.
- On the other hand, Western Isles and Argyll & Islands have promising renewable power generation potential. Development of green hydrogen production may therefore help address grid curtailment issues and address local, isolated demand. However, their supply chain capabilities are hindered by a lower workforce capability and fewer connections to suitable ports, large-scale storage and pipelines.
Overall, Scotland’s hydrogen hubs are relatively well balanced in their supply chain capabilities and have the potential to contribute significantly to both the national and international hydrogen market. The Aberdeen and Cromarty hubs particularly excel, while the Western Isles and Argyll and Islands may face resource limitations. By enhancing the strengths of higher-scoring hubs while addressing others’ limitations, Scotland will ultimately improve its competitive position in the global market.
HDP demand in Scotland’s hydrogen hubs
The Scottish Government’s Hydrogen Action Plan identifies that low-cost green hydrogen production is key to the net-zero transition (2022). To minimise the additional cost of transportation and other supporting infrastructure, the Scottish Government plans to encourage the “aggregation of cross-sectoral demand and co-location of the whole hydrogen value chain”. Thus, the efficiency of co-locating supply with high local demand will support the rapid scaling of Scotland’s hydrogen and HDP sectors. This rationale underpins the hydrogen hub model.
In this chapter, we analyse and estimate the addressable market or demand for each HDP in each hub. This analysis will initially provide a view on which hubs are most suited to supporting the development of local HDP demand in Scotland (Section 4.1.5). In Chapter 5, we bring together our supply chain capability and demand analysis to identify co-location opportunities for HDPs.
We assess the hubs based on current demand opportunities, which will initially support rapid market scaling. Therefore, we define HDP demand as the addressable market that HDPs could supply in a complete fuel-switching scenario. This enables us to differentiate hubs and provide a relative view on HDP demand opportunities. We assess four key sectors which could support the aggregation of cross-sectoral HDP demand within Scotland’s hydrogen hubs:
- Ammonia and e-methanol fuel for the maritime sector.
- Ammonia-based fertilisers for the agriculture sector.
- E-methanol feedstock for the chemical sector.
- SAF for the aviation sector.
To differentiate HDP demand by end use, our analysis considers HDPs used for direct consumption, excluding HDPs used as a hydrogen carrier (e.g. LOHCs).
Please refer to Appendix C for further information on this section’s methodology, sources and raw data.
HDP fuel for maritime shipping
In 2021, UK shipping used over seven million tonnes of fossil marine fuel oils, accounting for 18% of UK transport emissions (Transport & Environment, 2023). As the global regulatory body for shipping, the International Maritime Organisation (IMO) has set a 2050 net zero target for international shipping (IMO, 2023). In conjunction with Scotland’s net zero target, this means that the Scottish maritime industry will seek to replace fossil-based shipping fuels. The UK shipping industry can be decarbonised with HDPs, such as ammonia and e-methanol.
To evaluate the addressable market for these HDPs, we have analysed the current shipping fuel demand for each hub. There are uncertainties on which HDP shipping fuel – ammonia or e-methanol – will predominately address the market. Therefore, we have based our calculation on total energy demand in TWh.
Based on the UK’s 2021 marine fuel consumption, we calculated the annual energy demand for shipping. We then assigned this demand proportionally to each hub according to its total shipping traffic (Maritime Statistics, 2024).
Figure 11: Ranking of hubs by HDP shipping fuel demand.
Figure 11 shows the addressable market for HDP shipping fuel in each hub. Fife and Grangemouth rank highest with 3.5 TWh of demand, while the Scottish Borders ranks lowest with no current demand. From Figure 11 and our analysis, there are several key insights to address:
- Forth ports in Fife and Grangemouth is likely to be the largest addressable market for HDP maritime fuels, followed by the Clydeport network in Glasgow and Ayrshire.
- Forth ports and the Inverness and Cromarty Firth port network are Green Freeports (Inverness & Cromarty Firth Green Freeport, 2025; Forth Ports, 2025). These ports have varied tax and custom rules which could incentivise the development of HDPs for maritime fuel.
- While we have covered shipping demand, there may be other smaller sources of maritime demand for HDP fuels that were out of scope for this project. These sources include fishing vessels, ferries, service vessels and tugs.
Ammonia-based fertilisers for agriculture
The International Energy Agency estimates that around 70% of ammonia produced is used to make nitrogen-based fertilisers (2021). Ammonia production, by the Haber-Bosch process, is fossil-fuel based and highly energy intensive. The process accounts for 2% of the world’s total final energy consumption and 1.3% of carbon dioxide emissions from the energy system (International Energy Agency, 2021). As a sustainable alternative, green ammonia is gaining attention to decarbonise fertiliser production.
We have estimated green ammonia’s addressable market for fertilisers in each hub. First, we estimated total nitrogen-based fertiliser demand in Scotland for cropland and grassland. For this, we used average fertiliser application rates from UK Government data (UK Government, 2023). We also assumed that the nitrogen-based fertilisers were urea and ammonium nitrate, applied in equal proportions. From this assumption, we estimated the ammonia required to produce these fertilisers. Finally, we allocated this ammonia demand across the hubs based on their share of agricultural GVA in Scotland.
It is important to note here that we have only considered nitrogen-based fertiliser in our analysis, and not any other type of fertilisers. Therefore, our demand analysis only represents a subset of demand for fertilisers and not the total demand for fertilisers in Scotland.
Figure 12: Ranking of hubs by demand for green ammonia fertilisers. The ranking is shown from left (highest rank) to right (lowest rank).
Figure 12 shows green ammonia’s addressable market for fertilisers in each hub. Aberdeen ranks highest with 0.14 TWh of demand – around 31% of Scotland’s total demand. Moray and the island hubs rank lowest. Green ammonia’s addressable market will likely be greater on Scotland’s east coast where there is more agriculture.
E-methanol feedstock for chemical production
The International Renewable Energy Agency (IRENA) estimates that around 98 million tonnes of methanol is produced globally each year (IRENA and Methanol Institute, 2021). It is mostly used as a feedstock – a starting material – to produce formaldehyde, acetic acid and plastics. Currently, we produce most methanol from fossil fuels – such as synthetic gas (syngas). Methanol emissions represent around 10% of the chemical sector’s carbon dioxide emissions, and addressing these will be key for decarbonising the sector. E-methanol, produced with green hydrogen and captured carbon dioxide, could address methanol’s current market.
In Scotland, we assume that Grangemouth Chemical Science Park is the only large-scale user of methanol as a chemical feedstock. It is one of only four major chemical parks in the UK, and the only one in Scotland (Scottish Development International, 2023). With the closure of the refinery, Grangemouth’s industrial future is uncertain. However, INEOS’s Olefins and Polymers business will continue running as usual (INEOS, 2024). Their two onsite ethane cracker plants have the capacity to produce 1 million tonnes of ethylene per year (Endeavor Business Media, 2016). Fossil-based hydrogen and methane are produced as a by-product from an ethane cracker and can be used as syngas (Brooks, 2013).
To evaluate the maximum potential addressable market, we assume that this syngas is used to produce methanol. From this, we estimate that e-methanol could address a maximum demand of 100,000 tonnes per year (0.56 TWh).
SAF for aviation
The UK SAF mandate determines the share of SAF in total UK jet fuel demand (UK Government, 2024). It sets key SAF targets of 2% by 2025, 10% by 2030 and 22% by 2040. In securing demand, this mandate incentivises SAF production and supply across the UK.
To evaluate the addressable market for SAF, we analysed the current aviation fuel demand for each hub. To achieve this, we assigned the UK’s aviation fuel consumption in 2022 proportionally to each hub according to its total aircraft movement. To capture Edinburgh airport’s fuel demand, we have assigned it to the nearby Grangemouth hub.
Figure 13: Ranking of hubs by aviation fuel demand.
Figure 13 shows the addressable market for SAF in each hub. The airports in each island hub are shown combined: Shetland includes Lerwick (Tingwall), Scatsta and Sumburgh; Orkney includes Kirkwall and Wick John O’Groats; Western Isles includes Barra, Benbecula and Stornoway; Argyll and Bute includes Cambeltown, Islay and Tiree.
Grangemouth ranks highest with 5 TWh of demand, while hubs with no airports rank lowest. Regionally, about a third of SAF demand would arise from Edinburgh Airport and around a quarter from Glasgow Airport and Glasgow Prestwick. From Figure 13, we can see that locating SAF production around Scotland’s major airports would maximise co-location synergies. Progress has already begun in this area:
- In 2021, Edinburgh Airport signed a Memorandum of Understanding with Ørsted (Edinburgh Airport, 2021). The partnership recognises the importance of HDPs to accelerate the shift to sustainable air travel.
- In 2022, AGS Airports which own and operate Aberdeen and Glasgow airports, signed an agreement with ZeroAvia (Glasgow Airport, 2022). This partnership is exploring the development of hydrogen fuel infrastructure for zero-emission flights.
- In 2024, the Glasgow Airport Hydrogen Innovation Hub consortium delivered a feasibility study for a hydrogen hub at the airport (Glasgow Airport, 2024).
Overall HDP demand opportunities
The maritime and aviation sectors will be the main sources of HDP demand as Scotland scales its hydrogen and HDP sectors. These sectors account for 97% of the roughly 35 TWh addressable market analysed in this report. Due to this scale, our analysis suggests that hubs with major ports and airports would be best suited to develop HDP demand opportunities. In this regard, the hubs that stand out are Grangemouth (with 9.1 TWh of demand opportunity), Glasgow (with 6.1 TWh) and Aberdeen (with 4.4 TWh). Grangemouth’s advantage arises from several factors:
- An established and experienced chemical industry.
- Developed port infrastructure within the major Forth Ports network.
- Proximity to major airports, like Edinburgh Airport.
The Scottish Borders notably have the lowest demand opportunity overall. It is disadvantaged by the lack of shipping, aircraft traffic and chemical industry as well as a relatively small agricultural sector.
The potential demand opportunity for HDPs is greatest for SAF with a total addressable market of approximately 18 TWh. In comparison, e-methanol and green ammonia have a combined total of around 17 TWh.
Overall, our demand analysis has identified that focus should be placed on developing major offtake opportunities from the maritime and aviation sectors. This focus would best facilitate the large-scale and rapid scaling of the Scotland’s domestic HDP market. As the Scottish Government identified in the Hydrogen Action Plan, aggregating multiple end-use applications for production streams would improve the economic benefit of Scotland’s hydrogen hubs. Therefore, while SAF does have the greatest demand opportunity, it is worth noting that green ammonia and e-methanol have more diverse end uses and so would be better suited for demand aggregation. As such, each HDP has a distinct potential role in accelerating Scotland’s hydrogen and HDP sectors.
Co-location of HDP supply chain capabilities and demand opportunities
The Scottish Government recognises that co-location of supply and demand will help develop a sustainable domestic hydrogen and HDP sectors (2022). This development is required to establish Scotland in the wider global market (2022). In this chapter, we bring together our insights from the supply chain capabilities in Chapter 0 and the demand analysis in Chapter 4. This enables us to identify co-location opportunities for HDPs within Scotland’s hydrogen hubs.
Figure 14 summarises the co-location opportunity in each hub. The x-axis shows the overall supply chain capability score; the y-axis and bubble size show the aggregated demand opportunity. The top right quadrant broadly indicates which hubs may be best suited for co-location.
Figure 14: Overall co-location analysis showing the relative supply chain capability on the x-axis and the demand opportunity on the y-axis and as the relative bubble size.
From Figure 14, it is interesting to note that the top hydrogen hub for supply chain capability is not the one with the greatest demand opportunity. Aberdeen has the greatest supply chain capability score (93/100) while, with Edinburgh Airport and Forth Ports, Grangemouth has the greatest HDP demand opportunity (9.1 TWh). This supports the idea that these analyses should not be looked at in isolation. Rather, differing hub strengths can favour the development of different sections of the HDP economy.
Looking at the top right quadrant, we note that Aberdeen, Glasgow and Grangemouth are most aligned to facilitate the development of a regional, co-located HDP economy. In general, the hubs identified as strongest in supply chain capability – including Grangemouth, Aberdeen, Glasgow, Fife and Cromarty – are also those with greater demand opportunity.
We identify the Western Isles and Argyll and Islands as hubs which may need further support to develop their supply chain capabilities. On the other hand, the Scottish Borders and Moray may need to identify other, smaller offtake sectors to capitalise on co-location efficiencies.
The balancing of supply and demand opportunities will require careful consideration, particularly in the early stages of Scotland’s hydrogen and HDP sector development. Favouring supply opportunities could increase the cost and logistical complexity of transportation and storage to address more distant demand. Conversely, locating supply based on demand opportunities could limit the capacity and the economics of supply.
Overall, the diversity of Scotland’s hydrogen hub strengths points to the importance of a cross-hub approach, in addition to co-locating demand with supply. Hubs with greater connectivity to pipeline and port infrastructure, such as Aberdeen, will be more able to take advantage of this approach. As suitable pipeline and port infrastructure develops, supply and demand opportunities will be unlocked that are not possible by co-location. For example, piped green hydrogen from Fife could support HDP production in the adjacent Grangemouth hubs. For hubs with lower connectivity, such as the Western Isles, further development of suitable infrastructure is required to access cross-hub opportunities. Overall, the growth of HDP production will require both cross-hub and co-located approaches. Balancing these will help maximise each hub’s potential and, ultimately, that of the hydrogen sector itself.
Regulatory considerations for the HDP sector
Each HDP has different health, safety and planning requirements due to differing chemical properties. These requirements are stipulated by UK regulations. Higher hazard HDPs may face more severe limitations in how, where, and in what quantities they can be handled, for example for production or storage. This section explores the UK regulatory environment and its potential impact on the development of the HDP economy in Scotland.
Hazards associated with HDPs
Table 9 shows the physical, health and environmental hazards of hydrogen and HDPs. These hazards were identified from the standardised safety data sheet for each substance. The LOHC that we analysed was methylcyclohexane (MCH), the most common LOHC. The rating from 1-4 indicates the highest hazard severity category for each hazard type. According to the Globally Harmonised System classifications, a Category 1 hazard is the most severe while a Category 4 hazard is the least severe (United Nations, 2019).
Table 9: Hazards of hydrogen and HDPs from 1 (most severe) to 4 (least severe).
|
Substance |
Physical hazard |
Health hazard |
Environmental hazard |
|---|---|---|---|
|
Hydrogen |
1 |
4 |
4 |
|
Ammonia |
2 |
1 |
1 |
|
E-methanol |
2 |
1 |
4 |
|
LOHC (MCH) |
2 |
1 |
2 |
|
SAF |
3 |
1 |
2 |
From Table 9, we can see that ammonia is the most hazardous substance overall. Handlers must monitor it closely to mitigate its Category 1 health hazard and environmental hazards. LOHCs, E-methanol and SAF are less hazardous overall, although all also have Category 1 health hazards. This means that handling these HDPs is generally less inhibitive than for ammonia. As a feedstock, hydrogen’s severe flammability and explosion hazards should also be considered carefully for any HDP production development.
Review of key UK regulations affecting HDP handling
Due to these physical, health and environmental hazards, HDP production is strictly controlled by UK regulations and regulatory authorities. With the exception of LOHCs, HDPs like ammonia, methanol and aviation fuel are already produced and handled on a large-scale globally. Therefore, there are relatively few new regulatory issues concerning these HDPs. We have reviewed several key regulations that site handling HDPs must adhere to. These are detailed in Table 10.
Table 10: Key regulations and regulatory bodies and their implications for HDP production.
|
Regulation/Regulatory Body |
Implications for a HDP production site |
|---|---|
|
The Control of Major Accident Hazards (COMAH) Regulations |
|
|
UK registration, evaluation, authorisation and restriction (UK REACH) of chemicals |
|
|
Town and Country Planning (Environmental Impact Assessment) (Scotland) Regulations 2017 |
|
|
Health and Safety Executive (HSE) and Scottish Environment Protection Agency (SEPA) |
|
It is important to note that, under COMAH, each HDP is subject to different regulatory requirements based on their hazards, classified by the Globally Harmonized System (GHS). Based on the COMAH Lower Tier threshold quantity for each HDP, we have broadly ranked the HDPs by the regulatory stringency required to manage its hazards.
Table 11: Rank of HDPs by their COMAH Lower Tier threshold. The associated energy content of LOHC assumes the theoretical hydrogen storage content of MCH (6.22 wt%). Energy content of the HDPs was sourced from (Ozkan, et al., 2024).
|
HDP |
Lower Tier threshold (tonnes) |
Energy content (MJ/kg) |
Associated energy content (TJ) |
Rank (1 = most stringent, 4 = least stringent) |
|---|---|---|---|---|
|
LOHC (MCH) |
50 |
120 (for H2) |
0.4 |
1 |
|
Ammonia |
50 |
18.8 |
0.9 |
2 |
|
E-Methanol |
500 |
19.9 |
10.0 |
3 |
|
SAF |
2500 |
45.7 |
114.3 |
4 |
From Table 11, we can see that LOHC and ammonia are the most stringently regulated by COMAH with the same Lower Tier threshold of 50 tonnes. However, as an energy carrier of hydrogen, LOHC handling is more limited by the threshold. The associated energy content of LOHC is 0.5×10¹² J lower than that of ammonia. In comparison, e-methanol and SAF are less stringently regulated by COMAH. By energy content, a Lower Tier COMAH site would be able to handle 25x more e-methanol or over 250x more SAF than LOHC. Therefore, based on the stringency of COMAH regulations, the simplest HDP to handle is SAF, followed by e-methanol, ammonia and LOHC.
Hub-level regulatory capabilities
Considering the hazards associated with hydrogen and HDPs, hubs with more regulatory experience are likely to be better suited to handling these substances safely. For HDP production, existing COMAH sites may be expanded or new COMAH sites developed. As a broad measure of current and relative regulatory experience at a hub level, we will evaluate the number and tier level of COMAH sites present in each hub. The presence of COMAH sites, with their existing infrastructure and workforce, indicates that a hub may be more capable at handling hazardous HDPs safely according to regulation. Identifying these sites can also provide insights into potential offtakers as well as production, storage and distribution sites for HDPs.
Figure 15: Number of Upper Tier COMAH sites present in each hub.
We have assessed the number of registered COMAH sites in each hub as of June 2023 (Health and Safety Executive, 2023). There are two tiers of COMAH site: a Lower Tier and an Upper Tier. Upper Tier sites are more stringently regulated since they handle greater quantities of hazardous substances. Figure 15 shows the number of Upper Tier COMAH sites in each hub. Grangemouth has the most (16), including the Grangemouth Terminal and INEOS chemical sites. This indicates that the Grangemouth hub, and its associated workforce, may have the most regulatory experience for the large-scale handling of hazardous chemicals. The terminal, for instance, already facilitates the supply of Scotland’s aviation fuel (Forth Ports , 2025).
Key COMAH Upper Tier sites include:
- The St. Fergus Gas Terminal in the Aberdeen hub. This site receives, processes and compresses North Sea gas for the National Transmission System as well as stores and distributes other chemicals and fuels (North Sea Midstream Partners, 2025).
- The Clydebank Terminal operated by Exolum in the Glasgow hub. This site has a storage capacity of 56,257 m3 and a jetty to receive and storage liquid products, including fuels (Exolum, 2025).
- Moray’s sites are predominately distilleries which are engaged offtakers for the hydrogen sector. In March 2025, Storegga submitted a planning application to Moray Council to construct a 25 tonne per day green hydrogen facility to decarbonise local distilleries (Storegga, 2025). The UK Government has also found LOHCs to be a viable option for supplying hydrogen to distilleries, and could be explored further for the decarbonisation of Scotland’s distilleries (BEIS, 2021).
These hubs are likely to have a lower safety risk for handling HDPs. This is due to their existing regulatory experience and infrastructure. These insights are supported by the fact that the number of COMAH sites in each hub generally aligns with its overall supply chain capability score: the “upper” and “lower” hub groupings are broadly preserved. In comparison, the Scottish Borders has only one Lower Tier COMAH site, a fuel storage and distribution site operated by Flogas Britain. This relatively limited experience could indicate that there is greater need for local workforce training, community engagement and risk communication and investment into infrastructure to support the safe development of a local HDP sector.
Overall, this broad hub-level analysis has provided an indication of hubs’ regulatory capabilities. While out of scope for this project, individual assessment of existing and potential COMAH sites would add value to the analysis. This would provide greater detail into the specific capabilities of each hub to handle, produce and distribute HDPs safely, in accordance with regulations.
Policy gap analysis
In the previous chapters, we identified the strengths and barriers for Scotland to scale up its HDP market. To maximise opportunities a favourable and clear policy landscape is needed. This landscape must consider policy at a devolved, national and regional level. This will ensure that Scotland’s HDP related policies work with UK and EU specific policies in a harmonious manner.
To that end, we analysed relevant policies in the UK, Scotland or the EU. We considered policies in the following categories:
- Subsidies and obligations
- Supply chain/infrastructure development
- Technical and safety regulations
- Licensing
- Planning and consenting
Scottish policy gaps
Here we describe the main policy gaps, and the resultant risks, faced by the Scottish HDP industry. The Scottish Government has already taken some positive steps. However, plugging some gaps will significantly improve the standing of the industry.
Supply chain incentives/development for HDPs
The Scottish Government recently published plans to realise export opportunities for green hydrogen (International Trade and Investment Directorate, 2024). Although this a very important step in furthering the interest of Scottish exports to nearby regions, there are still some gaps remaining. The government’s plan identifies the various investment opportunities and barriers. However, there is a need for more clarity on how the Scottish Government will collaborate with the UK Government or build relationships with international export partners. Timely publication of such plans will provide investors with more certainty.
Clarity in planning and consenting
The Scottish Government has made substantial progress in improving the planning regime for hydrogen projects. The government is committed to preparing and training its planning authorities to expedite hydrogen planning applications. Additionally, it also aims to provide planning authorities with access to specialist expertise and staff upskilling. The government aims to do this this by introducing the planning hub. As a first step towards achieving their goal of improving the planning regime, the Scottish government conducted stakeholder engagement (Improvement Service, 2025), which attempted to understand concerns of both the planning authorities and industry.
The Improvement Services report focussed on five areas: understanding of hydrogen within planning applications, regulatory regime, more clarity on planning process, impact and risk of hydrogen manufacturing, and spatial factors. Some of the key concerns raised by the planning authorities were about lack of clarity on roles when multiple bodies are involved in a planning/consenting process. Additionally, resource constraints faced by the authorities and lack of awareness about hydrogen applications are some of the other concerns raised. For industry, some of the major points raised concerned uncertainty regarding water availability and Hydrogen Allocation Round (HAR) timelines. Industry also proposed conducting wider public engagement to spread awareness about how hydrogen can safely play a role in Scotland’s net zero transition.
All this effort has been crucial in shining some light on the challenges faced by industries and policymakers. To fully capitalise on this initiative, the government should now focus on implementing the findings and recommendations from their engagement.
UK policy gaps
The UK government has implemented many policies that have boosted green hydrogen development in the national economy. Our analysis concludes that the success of such policies should be replicated to similarly develop the HDP space.
Lack of HDP considering in subsidies and obligations
The Hydrogen Storage Business Model (HSBM) does not currently include HDPs in its scope.
There are a number of benefits to including HDPs in HSBM. It would increase the avenues available for storing hydrogen. It would also allow for small scale storage of hydrogen in the form of hydrogen derivatives (HSBM currently focusses on large-scale hydrogen storage). Additionally, inclusion of HDPs in scope may mitigate some of the challenges associated with storing hydrogen, such as safety concerns. For example, as ammonia contains hydrogen, including it in HSBM could act as an alternative way of storing hydrogen.
Supply chain incentives for industry and innovation
We identified a policy gap in relation to encouraging links between industrial clusters, which are well suited to producing HDPs. Chapter 4 showed how there are multiple hubs which are optimal for producing HDPs. Collaboration between the different clusters in these hubs would allow for sharing knowledge and potentially products as well.
There also needs to be a focus on conducting trial and demonstration projects. Many hydrogen projects will use innovative technology which will need to be proven and demonstrated in real-life settings. Trials will go a long way in assessing whether investing in such technologies is worthwhile.
Updating technical and safety regulations
Regulations regarding hydrogen need to be updated in the UK. Onshore hydrogen projects are regulated under the Gas Act 1986 and Planning Act 2008, and hydrogen is generally referred to as a ‘gas’. The Gas Safety Management Regulation (GSMR) prohibits injecting more than 0.1% of hydrogen into gas networks. Although there are discussions ongoing to exempt hydrogen from this rule, there needs to be more clarity here (Pinsent Masons, 2023). Repurposing the gas network to enable hydrogen transport is essential to grow the HDP sector. Green hydrogen is an important input for HDPs. Hence, a developed transport system will remove supply bottlenecks for HDP producers.
Clarity in offshore licensing
The industry seeks more clarity on the timeline and details of future offshore hydrogen regime. These projects will be critical in developing HDP production.
Delays in planning and consenting
Green hydrogen and HDP projects require various regulatory approvals, environmental permits, etc. Many investments are subject to approval of such plans. Delays associated with the planning and consenting regime may extend the lead time of green hydrogen projects. Streamlining the regime will mitigate some of these issues.
International policy gaps
Lack of clarity on emissions factors
There is an urgent need to standardise the emission factors for many fuels, such as ammonia or methanol. Sectors that use such fuels will need a standard emission factor as it eases carbon accounting and adhering to different regulations.
Lack of a standard framework for low-carbon hydrogen
There is a misalignment between low-carbon hydrogen standards in different countries. To foster international trade, a uniform definition of low-carbon hydrogen is needed.
Recommendations
Chapter 7 outlines relevant current policies that can enable development of the hydrogen and HDP sectors in Scotland. While introducing such policies is a significant step towards building the hydrogen space in the UK, some gaps remain. In addition, there is policy action required at an international level. Addressing these issues will significantly improve the prospects of Scotland’s hydrogen and HDP sectors.
A summary of our recommendations is as follows:
- The Hydrogen Sector Export Plan showcases the Scottish Government’s commitment to building hydrogen export capabilities. However, there is a need for more information on how the Scottish and the UK governments will work together with potential trade partners.
- Scottish Government should continue the progress on building a hydrogen planning regime. This will build on the introduction of the planning hub and the subsequent stakeholder engagement. This momentum should be continued by addressing the main findings of the Improvement Services report.
- The UK Government should include HDPs in the scope of subsidies like HSBM. HDP projects face similar risks as hydrogen projects. Therefore, providing similar subsidies to HDPs projects will mitigate risks and provide more certainty.
- Due to many hydrogen projects using innovative technology, there is a need for increasing the number of trials and demonstration projects.
- Another important issue is the potential misalignment of many standards and definitions. For instance, different governments should collaborate and decide on a common definition for low-carbon hydrogen. These misalignments will hinder growth opportunities as they increase the risk for potential traders.
There needs to be a more detailed plan for prioritising hub development. Our analysis highlighted the strengths and weaknesses of each hub. These results should be used to organise collaboration between production and demand hubs. Additionally, as shown in the co-location analysis, the ideal production hubs aren’t necessarily the same as the key demand hubs. Sorting this misalignment might require government intervention and support.
Conclusions
In our examination of Scotland’s industrial capabilities to produce hydrogen derivatives and products, we looked at supply chain capabilities, demand opportunities, regulatory and policy analysis.
Our assessment of co-location of supply chain capabilities with demand suggests Aberdeen and Grangemouth stand out as key hubs for the development of HDP production. Additionally, Cromarty and Ayrshire offer strong supply chain capabilities and Glasgow and Fife present significant demand opportunities. Meanwhile, the Western Isles and Argyll and Islands may require targeted support to enhance their supply chain capabilities. The Scottish Borders may need support in developing greater regulatory experience to facilitate HDP development.
Many of the Scottish hubs scored highly on the metric of renewable power generation capacity. This is evidence of Scotland’s biggest strength: access to renewable energy. Regions like Aberdeen, Cromarty, Moray, Shetland and Western Isles were the highest scores. Regarding local policy and planning support, Aberdeen, Ayrshire and Scottish Borders were among the top performers.
Given the nascency of HDP production, a favourable policy environment is needed to ensure rapid adoption of these fuels. In Scotland a more nuanced planning regime would help to support the growth of HDP adoption. Scotland would benefit from a planning regime that accounts for its specific geographic factors.
At the UK level, HDPs should be included in the scope of policies like HSBM. Health and safety regulations should be updated to account for the increasing role of hydrogen and HDPs in the economy of the future.
Our analysis shows that for Scotland to meet its aims of becoming a major exporter of HDPs, it will need a holistic approach to evaluating the strengths of Scotland’s potential hydrogen hubs.
Overall, by balancing cross-hub collaboration with localised development, Scotland can maximise the potential of HDP production from green hydrogen, driving the sector’s long-term growth and resilience.
References
Statistische Ämter des Bundes und der Länder, 2025. Wassereinsatz und ungenutztes Wasser – Jahressumme – regionale Tiefe: Kreise und krfr. Städte, Wiesbaden: Statistische Ämter des Bundes und der Länder.
Aberdeen City Council, n.d. Skills and qualifications gap analysis, s.l.: s.n.
BEIS, 2021. BEIS Green Distilleries Competition, London: BEIS.
Brooks, R., 2013. Modeling the North American market for natural gas liquids. Ancorage, International Association for Energy Economics.
Bundesnetzagentur, 2024. Hydrogen core network. [Online]
Available at: https://www.bundesnetzagentur.de/EN/Areas/Energy/HydrogenCoreNetwork/start.html
[Accessed 25 February 2025].
Cerniauskas, S. et al., 2021. Wissenschaftliche Begleitstudie der Wasserstoff Roadmap Nordrhein-Westfalen, Jülich: Forschungszentrums Jülich.
ClimateXChange, 2023. Cost reduction pathways of green hydrogen production in Scotland – total costs and international comparisons, s.l.: ClimateXChange.
ClimateXChange, 2023. Hydrogen as a storage medium in Scotland, Edinburgh: ClimateXChange.
ClimateXChange, 2024. Economic Opportunities in Scotland’s Net Zero and Climate Adaptation Economy, s.l.: s.n.
Department for Energy Security & Net Zero, 2024. THE CONTRACTS FOR DIFFERENCE (STANDARD TERMS) REGULATIONS 2014 CFD STANDARD TERMS NOTICE FOR THE SIXTH ALLOCATION ROUND, London: Department for Energy Security & Net Zero.
Department for Energy Security and Net Zero, 2024. THE CONTRACTS FOR DIFFERENCE (STANDARD TERMS) REGULATIONS 2014 CFD STANDARD TERMS NOTICE FOR THE SIXTH ALLOCATION ROUND, London: Department for Energy Security and Net Zero.
DESNEZ, 2024. Regional Renewable Statistics, London: DESNEZ.
DESNEZ, 2024. Renewable Energy Planning Database (REPD): October 2024 (quarter 3), London: DESNEZ.
Duisburger Hafen HG, 2025. duisport: Facts and figures. [Online]
Available at: https://www.duisport.de/hafeninformation/?lang=en
[Accessed 26 February 2025].
Duisport, 2022. Energy transition in the Port of Duisburg – Duisburg Gateway Terminal (DGT): Official starting signal for the enerPort II project. [Online]
Available at: https://www.duisport.de/energy-transition-in-the-port-of-duisburg-duisburg-gateway-terminal-dgt-official-starting-signal-for-the-enerport-ii-project/?lang=en
[Accessed 3 March 2025].
Edinburgh Airport, 2021. Airport partners with Ørsted to bring sustainable air travel to the UK. [Online]
Available at: https://corporate.edinburghairport.com/media-centre/news-releases/airport-partners-with-orsted-to-bring-sustainable-air-travel-to-the-uk
[Accessed 26 February 2025].
Edlmann, K. et al., 2024. UK Hydrogen Storage Database. [Online]
Available at: https://geosciences.ed.ac.uk/research/institutes-centres/institutes/earth-planetary-science/edinburgh-earth-resources/research-activities/geoenergy/uk-hydrogen-storage-database
[Accessed 24 February 2025].
Endeavor Business Media, 2016. Ineos plans restart of mothballed ethylene unit at Grangemouth. [Online]
Available at: https://www.ogj.com/refining-processing/article/17249237/ineos-plans-restart-of-mothballed-ethylene-unit-at-grangemouth
[Accessed 6 March 2025].
Energy Prices Statistics Team, 2024. Energy Prices International Comparisons, London: Energy Prices Statistics Team.
Exolum, 2025. Where we operate. [Online]
Available at: https://exolum.com/en/where-we-operate/
[Accessed 27 March 2025].
Forth Ports , 2025. Forth Ports Grangemouth. [Online]
Available at: https://www.forthports.co.uk/our-ports/grangemouth/
[Accessed 5 March 2025].
Forth Ports, 2025. Forth Green Freeport. [Online]
Available at: https://forthgreenfreeport.com/
[Accessed 26 February 2025].
Gallizzi, B., 2025. Comparing energy prices by region. [Online]
Available at: https://www.uswitch.com/gas-electricity/guides/regional-energy-prices/
[Accessed 5 March 2025].
Gasunie, 2023. Energiebedrijven en netbeheerders willen versnelling waterstofcorridor tussen Nederland en Duitsland. [Online]
Available at: https://www.gasunie.nl/nieuws/energiebedrijven-en-netbeheerders-willen-versnelling-waterstofcorridor-tussen-nederland-en-duitsland
[Accessed 24 February 2025].
German Environment Agency, 2016. Power-to-Liquids Potentials and Perspectives for the Future Supply of Renewable Aviation Fuel, s.l.: s.n.
Glasgow Airport, 2022. ZeroAvia & AGS Airports Team Up to Bring Zero-Emission Flights to Scotland. [Online]
Available at: https://www.glasgowairport.com/media-centre/2022/zeroavia-ags-airports-team-up-to-bring-zero-emission-flights-to-scotland/
[Accessed 26 February 2025].
Glasgow Airport, 2024. Glasgow Airport hydrogen hub to support zero-emission flight by 2027. [Online]
Available at: https://www.glasgowairport.com/media-centre/2024/glasgow-airport-hydrogen-hub-to-support-zero-emission-flight-by-2027/
[Accessed 26 February 2025].
Global Energy Monitor, 2025. Global Energy Monitor. [Online]
Available at: https://globalenergymonitor.org/projects/global-wind-power-tracker/tracker-map/
[Accessed 22 February 2025].
Greenlyte, 2025. Greenlyte and MB Energy forge strategic landmark agreement for synthetic methanol. [Online]
Available at: https://www.greenlyte.tech/milestones/greenlyte-and-mb-energy-forge-strategic-landmark-agreement-for-synthetic-methanol-2
[Accessed 20 August 2025].
Health and Safety Executive, 2023. COMAH UPPER and LOWER Tier Establishment List June 2023, Merseyside: Health and Safety Executive.
HMRC, 2022. December 2022 average exchange rates, London: HMRC.
Hornby, G., 2023. RWE submits planning approval for hydrogen storage facility in northeast Germany. [Online]
Available at: https://www.icis.com/explore/resources/news/2023/02/22/10857606/rwe-submits-planning-approval-for-hydrogen-storage-facility-in-northeast-germany/
[Accessed 24 February 2025].
Hydrogen Metropole Ruhr, 2023. Germany’s Hydrogen Model Region, Essen: Regionalverband Ruhr.
IMO, 2023. 2023 IMO STRATEGY ON REDUCTION OF GHG EMISSIONS FROM SHIPS, London: IMO.
Improvement Service, 2025. Insights Report: Planning for Hydrogen, s.l.: s.n.
INEOS Group, 2025. Sites. [Online]
Available at: https://www.ineos.com/businesses/ineos-olefins-polymers-europe/sites/
[Accessed 26 February 2025].
INEOS, 2024. “Business as usual” for INEOS businesses at Grangemouth. [Online]
Available at: https://www.ineos.com/news/ineos-group/business-as-usual-for-ineos-businesses-at-grangemouth/
[Accessed 4 March 2025].
Information und Technik Nordrhein-Westfalen, 2024. Güterumschlag von Binnengüterschiffen in ausgewählten Häfen Nordrhein-Westfalens, Düsseldorf: Information und Technik Nordrhein-Westfalen.
International Energy Agency, 2021. Ammonia Technology Roadmap, Paris: International Energy Agency.
International Trade and Investment Directorate, 2024. A Trading Nation – Realising Scotland’s Hydrogen Potential: plan for exports, s.l.: s.n.
Inverness & Cromarty Firth Green Freeport, 2025. Inverness & Cromarty Firth Green Freeport. [Online]
Available at: https://greenfreeport.scot/
[Accessed 26 February 2025].
IRENA and Methanol Institute, 2021. Innovation Outlook : Renewable Methanol, Abu Dhabi: International Renewable Energy Agency.
Länder, V. G. d., 2024. Bruttoinlandsprodukt, Bruttowertschöpfung in den kreisfreien Städten und Landkreisen der Bundesrepublik Deutschland 1992 und 1994 bis 2022, Stuttgart: Volkswirtschaftliche Gesamtrechnungen der Länder.
Maritime Statistics, 2024. All UK major and minor port freight tonnage traffic, by port and year (filter by direction), from 1965, London: Department for Transport.
Metropole Ruhr Business, 2025. Hydrogen. [Online]
Available at: https://www.business.ruhr/en/focus/hydrogen.html
[Accessed 20 August 2025].
Morton, H., Mitchell, J., Wilson, J. & Csernik-Tihn, S., 2025. Review of Demand for Hydrogen Derivatives and Products in Scotland and Internationally, s.l.: s.n.
National Gas, 2025. Project Union. [Online]
Available at: https://www.nationalgas.com/future-energy/hydrogen/project-union
[Accessed 25 February 2025].
Net Zero Technology Centre, 2023. Hydrogen Backbone Link: Connecting Scotland to Europe, Aberdeen: Net Zero Technology Centre.
North Sea Midstream Partners, 2025. St Fergus Gas Terminal. [Online]
Available at: https://www.nsmp-limited.com/our-assets/st-fergus-gas-terminal/
[Accessed 27 March 2025].
Office for National Statistics, 2024. Regional gross value added (balanced) by industry: local authorities by International Territorial Level (ITL) 1 region: TLM Scotland, Newport: Office for National Statistics.
Offshore Wind Scotland, 2024. ScotWind leasing round. [Online]
Available at: https://www.offshorewindscotland.org.uk/the-offshore-wind-market-in-scotland/scotwind-leasing-round/
[Accessed 21 February 2024].
OneOcean Group Ltd, 2023. World Port Information Online. [Online]
Available at: https://www.findaport.com/
[Accessed 3 March 2025].
Optimat and Scottish Enterprise, 2023. Decarbonisation of Scottish Maritime Transport, s.l.: s.n.
Ozkan, M. et al., 2024. Forging a sustainable sky: Unveiling the pillars of aviation e-fuel production for carbon emission circularity. iSience, 27(3), pp. 2589-0042.
Peecock, A. et al., 2022. Mapping hydrogen storage capacities of UK offshore hydrocarbon fields and exploring potential synergies with offshore wind. Geological Society, 528(1), pp. 171-187.
Pinsent Masons, 2023. UK hydrogen safety law: the developing framework, s.l.: s.n.
Planning Application Statistics, 2024. Planning Application Statistics, s.l.: s.n.
Port of Aberdeen, 2025. Oil and Gas. [Online]
Available at: https://www.portofaberdeen.co.uk/sectors-served/oil-gas#your-preferred-oil-gas-port
[Accessed 4 March 2025].
Port of Aberdeen, 2025. Why choose Port of Aberdeen?. [Online]
Available at: https://www.portofaberdeen.co.uk/about-us/why-choose-port-of-aberdeen
[Accessed 3 March 2025].
Ramboll, 2022. FEASIBILITY STUDY INTO WATER REQUIREMENT FOR HYDROGEN PRODUCTION, Crawley: SGN.
Renewable UK & Hydrogen UK, 2025. Splitting the difference, London: Renewable UK & Hydrogen UK.
Safidi, J. et al., 2021. A quantitative assessment of the hydrogen storage capacity of the UK continental shelf. International journal of hydrogen energy, 46(12), pp. 8629-8639.
Schunck, S., 2021. New initiative for Ruhr area as a pioneer region of the hydrogen economy. [Online]
Available at: https://www.rwe.com/en/press/rwe-ag/2021-09-02-new-initiative-for-ruhr-area-as-a-pioneer-region-of-the-hydrogen-economy/
[Accessed 25 February 2025].
Scottish Development International, 2023. Grangemouth Chemical Science Park. [Online]
Available at: https://www.sdi.co.uk/business-in-scotland/locations-for-your-business/commercial-properties-and-land/grangemouth-chemical-science-park#:~:text=Grangemouth%20is%20located%20in%20Scotland%E2%80%99s%20central%20belt%2C%20just,industrial%20heritage%20and%20h
[Accessed 26 February 2025].
Scottish Enterprise and Optimat, 2023. Synthetic/Sustainable Aviation Fuel Mapping, s.l.: Scottish Enterprise.
Scottish Enterprise, 2024. Economic Impact Scenarios for Scotland’s Energy Transition, s.l.: Scottish Enterprise.
Scottish Enterprise, 2025. SHINe Capability Directory. [Online]
Available at: https://www.scottish-enterprise.com/shine/shine-resources/shine-capability-directory
Scottish Enterprise, n.d. Appendix A Site Factsheets, Glasgow: Scottish Enterprise.
Scottish Government, 2020. Scottish hydrogen: assessment report, Edinburgh: Scottish Government.
Scottish Government, 2020. Scottish Offshore Wind to Green Hydrogen Opportunity Assessment, Edinburgh: Scottish Government.
Scottish Government, 2022. Hydrogen Action Plan, Edinburgh: Scottish Government.
Scottish Government, 2024. A Trading Nation: Realising Scotland’s Hydrogen Potential – A Plan for Exports, Edinburgh: Scottish Government.
Scottish Government, 2024. Business and Innovation Statistics, Edinburgh: Scottish Government.
Scottish Government, 2024. Local authority area statistics database, Edinburgh: Scottish Government.
Scottish Power, 2022. Scot2Ger: Development of a Green Hydrogen Supply Chain from Scotland to Germany, s.l.: s.n.
Scottish Power, 2024. Whitelee Solar / Hydrogen / BESS. [Online]
Available at: https://www.scottishpowerrenewables.com/pages/whitelee_solar_hydrogen_bess_.aspx
[Accessed 24 February 2025].
SGN, 2021. Sharing our pathway to 100% hydrogen with SHFCA. [Online]
Available at: https://www.sgn.co.uk/news/sharing-our-pathway-100-hydrogen-shfca
[Accessed 28 February 2025].
SGN, 2023. Project to repurpose natural gas pipelines to hydrogen gets green light from Ofgem. [Online]
Available at: https://www.sgn.co.uk/news/project-repurpose-natural-gas-pipelines-hydrogen-gets-green-light-ofgem
[Accessed 28 February 2025].
SGN, 2023. SGN and NGT accelerate hydrogen plans for Scotland and southern England. [Online]
Available at: https://sgn.co.uk/news/sgn-and-ngt-accelerate-hydrogen-plans-scotland-and-southern-england
[Accessed 27 March 2025].
SHIPNEXT BV, 2025. SHIPNEXT. [Online]
Available at: https://shipnext.com/
[Accessed 28 February 2025].
Skills Development Scotland, 2024. Data Matrix. [Online]
Available at: https://www.skillsdevelopmentscotland.co.uk/what-we-do/skills-planning/data-matrix?_gl=1*1gxt0uc*_up*MQ..*_ga*OTA2MTc5NTQ3LjE3Mzc1NDYxMzI.*_ga_2CRJE0HKFQ*MTczNzU0NjEyOS4xLjEuMTczNzU0NjE2NS4wLjAuMA..
Storegga, 2025. https://storegga.earth/speyside-hydrogen-news/storegga-submits-planning-application-for-green-hydrogen-site-to-decarbonise-moray-distilleries. [Online]
Available at: https://storegga.earth/speyside-hydrogen-news/storegga-submits-planning-application-for-green-hydrogen-site-to-decarbonise-moray-distilleries
[Accessed 27 March 2025].
Timsina, R., Thapa, R. K., Moldestad, B. M. & Eikeland, M. S., 2021. Methanol synthesis from syngas: a process simulation. s.l., SIMS EUROSIM 2021.
Tix, M., 2024. Port of Duisburg wants green hydrogen from Brazil. [Online]
Available at: https://www.energate-messenger.com/news/249932/port-of-duisburg-wants-green-hydrogen-from-brazil
[Accessed 3 March 2025].
Transport & Environment, 2023. Implications of an e-fuel mandate for UK shipping, London: Transport & Environment.
U.S. Department of Energy, 2025. DOE Technical Targets for Onboard Hydrogen Storage for Light-Duty Vehicles. [Online]
Available at: https://www.energy.gov/eere/fuelcells/doe-technical-targets-onboard-hydrogen-storage-light-duty-vehicles
[Accessed 24 February 2025].
UK Government, 2015. The Control of Major Accident Hazards Regulations 2015. [Online]
Available at: https://www.legislation.gov.uk/uksi/2015/483/contents
[Accessed 4 March 2025].
UK Government, 2023. British survey of fertiliser practice dataset, s.l.: s.n.
UK Government, 2024. Renewable Transport Fuel Obligations (Sustainable Aviation Fuel) Order 2024, London: UK Government.
UKPORTS, 2025. A-Z Port Listings. [Online]
Available at: https://uk-ports.org/ukports-a-to-z-listing/
[Accessed 3 March 2025].
United Nations, 2019. Globally Harmonised System of Classification and Labelling of Chemicals (GHS), New York and Geneva: United Nations.
Volkswirtschaftliche Gesamtrechnungen der Länder, 2024. Bruttoinlandsprodukt, Bruttowertschöpfung in den kreisfreien Städten und Landkreisen der Bundesrepublik Deutschland 1992 und 1994 bis 2022. Stuttgart: Volkswirtschaftliche Gesamtrechnungen der Länder.
Wirtschaftsbetriebe Duisburg, 2025. Kanalisation und Kläranlagen. [Online]
Available at: https://www.wb-duisburg.de/Privat/Privat_Stadtentwaesserung/Kanalisation-und-Klaeranlagen.php
[Accessed 1 March 2025].
Wirtschaftsbetriebe Duisburg, n.d. Kalanisation und Kläranlagen. [Online]
Available at: https://www.wb-duisburg.de/Privat/Privat_Stadtentwaesserung/Kanalisation-und-Klaeranlagen.php
[Accessed 24 February 2025].
World Bank, 2024. Ease of Doing Business Index, s.l.: s.n.
Appendices
To understand the role that Scotland can play in the hydrogen and HDP sectors of the future, a thorough review of literature was undertaken. The current state of the hydrogen and HDP sectors in Scotland will very much dictate its future prospects. For the purposes of this study, the literature review focussed on many factors associated with the production and export of hydrogen by Scotland. The review allowed us to identify certain common themes related to Scotland’s ambition for net zero and revealed hydrogen’s role in achieving those goals.
We explored the potential key drivers and enablers of the hydrogen and HDP sectors. Then, we analysed barriers Scotland is likely to face in growing its hydrogen supply chain capabilities. Apart from studying strengths and weaknesses specific to Scotland, we also analysed factors specifically relevant to the HDPs in scope of our study.
Scotland specific factors
Most of the literature reviewed concludes that Scotland is very well-placed to be able to produce green hydrogen in the future. There are many factors that work in Scotland’s favour. First and foremost, Scotland’s access to abundant levels of renewable energy, especially offshore wind, is a major strength (ClimateXChange, 2023). Production of green hydrogen will require renewable electricity as the major component. Scotland’s wind resources make it very suitable for producing green hydrogen.
Another major key driver for Scotland’s hydrogen and HDP sectors is the ambitious policies in the EU. These policies are likely to spur hydrogen demand in the next few decades. According to the RePowerEU Strategy, the EU aims to import 10 million tonnes of hydrogen by the year 2030. This provides Scotland with a significant opportunity to be a major exporter of low-carbon hydrogen to the EU (Scottish Government, 2022). Since the Russia-Ukraine conflict, the EU also aims to stop importing natural gas and rely on its domestic capabilities (Scottish Power, 2022). This will also likely further the usage and demand for hydrogen in the continent.
Scotland is also likely to benefit significantly from its geographical proximity to the EU. Hence, Scotland may transport hydrogen and HDPs to the EU at costs lower than faraway regions like North America, the Middle East or Asia (ClimateXChange, 2023).
In addition, there are other factors working in Scotland’s favour. For example, Scotland has a vast oil and gas industry with a highly skilled workforce. These skills can be transferred to the hydrogen and HDP sectors (Scottish Enterprise, 2024).
On the other hand, the literature reviewed also highlighted areas which need further development and focus to enable green hydrogen production. One of the biggest weaknesses identified in the literature is the high costs associated with electricity generation. Electricity cost is one of the biggest components of green hydrogen production. Currently, cost of electricity generation is much higher in Scotland compared to other competitor regions like the USA or the Middle East (ClimateXChange, 2023). This makes green hydrogen production in Scotland more expensive than regions like the US or the Middle East. This could reduce Scotland’s competitive edge to export to the EU.
Past studies also point out the lack of electrolyser manufacturing capabilities in Scotland as a potential bottleneck (ClimateXChange, 2024). Another major challenge faced by Scotland is regarding transporting and storing hydrogen or HDPs (Optimat and Scottish Enterprise, 2023). Scotland lacks a dedicated pipeline infrastructure that could be used to transport hydrogen to the EU. However, many studies point out the possibility to repurpose existing gas pipelines and use them for hydrogen transport. Scotland also lacks onshore deposits for salt caverns. However, this can be mitigated by the existence of depleted gas fields and lined rock caverns (ClimateXChange, 2024).
Some of the studies also mention the lack of projected demand for hydrogen in Scotland as a potential issue. Scotland is not expected to demand very high levels of hydrogen, meaning hydrogen supply capabilities will be built to service external demand. Increasing demand will be contingent on the policies that will be enacted in the future.
Similarly, studies have pointed out the need for more clarity from the government on possible policy actions (Scottish Enterprise and Optimat, 2023). The sector will also benefit from a coordinated response to tackle supply chain issues and more visibility into existing opportunities. Databases similar to the Offshore Energy UK’s Supply Chain Visibility Tool and the North Sea Transition Authority’s (NSTA) Energy Pathfinder will increase awareness and information regarding opportunities and enable potential investors to make informed decisions (Aberdeen City Council, n.d.).
The lack of clarity and uncertainty regarding future policy making explain why hydrogen demand projections by different studies vary significantly. Latest demand projections for Scotland for hydrogen expect demand to be in the range of 0.6-2.7 TWh for 2030 and 2.7-24.7 TWh for 2050 (Morton, et al., 2025). Some studies project the economic impact of exporting hydrogen products to the EU. According to the ambitious scenario of the Hydrogen Action Plan, 2022 report, exporting hydrogen to the EU could create roughly a total of 300,000 jobs in Scotland by 2045. It could also add roughly £25 billion every year to the Scottish economy by 2045 (Scottish Government, 2022).
The findings from these studies show that Scotland has inherent strengths that can be harnessed to build and grow strong hydrogen and HDP sectors. Scotland’s access to renewable energy and the skills possessed by existing workforce puts it in a very robust position. However, building supply chain capabilities in Scotland will also come with its own challenges. The biggest challenge faced by Scotland is the high cost of generating renewable electricity. Lack of storage and transport infrastructure is also a big issue. Many studies have pointed out the need for government support to mitigate such challenges.
HDPs specific literature review
The literature review conducted also focussed specifically on the current state of HDPs production in Scotland and the UK. In some cases, it makes more economic sense to use a hydrogen product than hydrogen itself to achieve decarbonisation. This is specifically true for two hard-to-abate sectors: aviation and shipping. Two of the most mentioned hydrogen products in our literature review were sustainable aviation fuels (SAFs) and ammonia.
SAFs are expected to play a major role in decarbonising aviation. Currently, very little SAF is supplied to Scottish airports. Nevertheless, in the long-term, SAFs will be key to replacing high-carbon jet fuels. According to the SAF Mandate, roughly 2% of the UK’s jet fuel demand in 2025 will be from SAFs. The share of SAFs in final jet fuel demand will increase to 10% by 2030 and to 22% by 2040. The global SAF demand is expected to reach 22.7-32.8 million tonnes by 2030 (Scottish Enterprise and Optimat, 2023).
In addition to SAFs, using hydrogen directly as a fuel is also a solution that can be deployed to decarbonise aviation. Direct use of hydrogen in aviation is not expected to be used as much as SAFs (Scottish Enterprise and Optimat, 2023). This is partly because of hydrogen not being a drop-in fuel, whereas SAFs are. Drop-in fuels are fuels that can be used in an airplane without making any modifications to the engine. This increases cost for air carriers to use it as an alternative to high-carbon fuels currently used. Another major concern is the safety issues that using hydrogen will pose. In addition, due to hydrogen being a lighter fuel, its volumetric density is lower. This means that a lot more hydrogen will be required to operate an airplane, increasing storage requirements and also increasing the weight of the plane. However, even if hydrogen is not used as a fuel itself, it will still play a big role in decarbonising aviation as it is an important input in the production of many SAFs. One such example is Power-to-Liquid (PtL) fuel. PtL fuels are formed by combining carbon and hydrogen together. Renewable electricity is used to remove carbon from CO2 and H from water, making the whole process zero-carbon. The PtL technology is also at a mature technological readiness level (German Environment Agency, 2016).
Similar to SAFs in aviation, low-carbon fuels will play an important role in decarbonising shipping. The hydrogen products mentioned in literature as potentials fuels to decarbonize marine transport are ammonia and methanol. The biggest concern regarding these products is the relatively weak supply chain capabilities in Scotland when compared to the EU. An example of this is the weak shipbuilding supply chain and fewer active commercial shipbuilders of scale. Scotland is unlikely to be able to meet the demand for these fuels for even a small number of cargo vessels (Optimat and Scottish Enterprise, 2023). Security factors could be another possible concern with ammonia. Ammonia is a very toxic fuel, which should only be handled by qualified personnel. Despite their importance in decarbonising certain sectors, the current production of these products is limited. Therefore, more focus needs to be placed on increasing their supply.
Need for further research
Many studies have focussed extensively on analysing both demand- and supply-side factors of Scotland’s hydrogen and HDP sectors. However, our research found that there is not enough information about different geographical hubs in Scotland and the role they can play. The lack of individual focus on different hubs has motivated this study.
Maximum potential renewable power generation
The maximum potential renewable power generation is defined as the total current, planned and announced installed capacity of solar PV and wind power projects in each hub region. Data was provided by council authority, so data was aggregated according to the defined council authority groupings for each hub. 2023 installed capacities were obtained from the DESNEZ Regional Renewable Statistics (2024). To obtain current capacity, this data was supplemented by projects that came online in 2024, as reported by the DESNEZ Renewable Energy Planning Database (REPD) and desk-based research (2024). Offshore wind projects were assigned to hubs based on their onshore landing points. The resulting current capacities were scaled by the 2023 average load factor for Scotland, appropriate to each technology (DESNEZ, 2024).
The REPD was also used to calculate planned installed capacity. From this database, development statuses encompassed under “planned” included:
- “Under Construction”.
- “Awaiting Construction”.
- “No Application Required”.
- “Application Submitted”.
- “Revised”.
For announced installed capacity, we included the 27.6 GW of ScotWind leasing round projects (Offshore Wind Scotland, 2024). The likely onshore landing point (and so corresponding hub) was identified from individual project websites. If this information was not available, the closest hub was allocated the offshore capacity. We included additional announced wind and solar projects from the Global Energy Monitor tracker (2025). To scale the resulting planned and announced capacities, we used load factors reported by DESNZ for UK new build projects (for delivery years 2026-2029) (2024).
To obtain the maximum potential renewable energy power generation for each hub, we then summed the current, planned and announced solar PV and wind power generation. We ranked the hubs from 1 (least generation) to 15 (highest), as shown in Table 13.
Table 12: Summary of data used for the calculation of maximum potential renewable power generation.
|
Data category |
Unit |
Value/Data used |
Source |
Confidence rating |
|---|---|---|---|---|
|
Installed capacity – 2024 |
MW |
Installed capacity of solar PV and wind projects by council authority |
(DESNEZ, 2024) (DESNEZ, 2024) |
3 |
|
Installed capacity – planned |
MW |
Planned installed capacity of solar PV and wind projects. |
(DESNEZ, 2024) |
3 |
|
Installed capacity – announced |
MW |
Capacity of announced solar PV and wind projects |
(Offshore Wind Scotland, 2024) (Global Energy Monitor, 2025) |
2 |
|
Current load factors for Scotland |
% |
PV: 9.5% Onshore wind: 23.6% Offshore wind: 29.5% |
(DESNEZ, 2024) |
3 |
|
Load factors for UK new build projects |
% |
PV: 10.8% Onshore wind: 44.8% Offshore wind: 62.3% |
(Department for Energy Security & Net Zero, 2024) |
2 |
Table 13: maximum potential renewable power generation by hub.
|
Hub |
Current maximum potential renewable power generation (GW) |
Planned/announced maximum potential renewable power generation (GW) |
Rank (1 = lowest to 15 = highest) |
|---|---|---|---|
|
Aberdeen |
0.18 |
10.87 |
15 |
|
Argyll and Islands |
0.10 |
1.50 |
8 |
|
Ayrshire |
0.34 |
0.75 |
7 |
|
Cromarty |
0.49 |
2.83 |
14 |
|
Duisburg |
0.01 |
0.00 |
1 |
|
Dumfries and Galloway |
0.27 |
1.41 |
9 |
|
Dundee |
0.01 |
0.40 |
4 |
|
Fife |
0.03 |
0.34 |
3 |
|
Glasgow |
0.44 |
0.41 |
5 |
|
Grangemouth |
0.06 |
0.05 |
2 |
|
Moray |
0.57 |
2.08 |
13 |
|
Orkney |
0.01 |
1.95 |
10 |
|
Scottish Borders |
0.15 |
0.78 |
6 |
|
Shetland |
0.11 |
2.07 |
12 |
|
Western Isles |
0.01 |
2.05 |
11 |
Water availability
In 2022, Ramboll, on behalf of SGN, investigated water availability for green hydrogen production across Scotland (Ramboll, 2022). This estimated hubs’ maximum green hydrogen production potential based on current water availability and forecasted hydrogen production capacity for 2045.
Water availability was defined as the total volume of effluent water and fresh water, including groundwater, surface water and potable water. Sea water was excluded from the analysis as its availability is effectively unlimited and it is accessible to all Scottish hubs. To evaluate potential water availability, we took the difference between Ramboll’s forecasted green hydrogen production capacity and the maximum production potential for each hub.
To ensure a fair comparison, we used the same methodology and assumptions for Duisburg as for the Scottish hubs. Ramboll outlines this approach on pages 26–27 of their report
(2022). According to the Jülich research centre, Duisburg could have a maximum installed hydrogen capacity of 1 GW by 2050 (Cerniauskas, et al., 2021, p. 79). Since no specific data was available for 2045, we assumed that the installed capacity would be the same as in 2050.
The total water availability for hydrogen production in Duisburg is approximately 18,697,000 cubic metres. This includes:
- 2,697,000 cubic metres of non-used fresh water ( Statistische Ämter des Bundes und der Länder, 2025).
- 16,000,000 cubic metres of effluent water from central waste treatment plants (Wirtschaftsbetriebe Duisburg, 2025).
Based on Ramboll’s assumptions, green hydrogen production requires 10 kg water per kg hydrogen. Additionally, we should account for a 20% water loss. Using 2,697,000 cubic metres of fresh water, the maximum hydrogen production potential is approximately 1.5 million tonnes. This result was converted to kilowatt-hours (kWh) using the lower heating value for hydrogen (33.3 kWh). We estimated that Duisburg’s maximum hydrogen production potential is 14 GW using the following equation:
The assumptions for this calculation are detailed in Table 14. Finally, we calculated Duisburg’s water availability by taking the difference between its forecasted hydrogen production capacity and its maximum production potential.
The final rankings from 1 to 15 (with 1 representing the hub with the least water availability) are shown in Table 15.
Table 14: Summary of data used for the calculation of water scarcity.
|
Data category |
Unit |
Value/Data used |
Source |
Confidence rating |
|---|---|---|---|---|
|
Forecasted green hydrogen capacity in Scotland |
GW |
|
(Ramboll, 2022, p. 3) |
2 |
|
Surface water availability in Scotland |
GW |
|
(Ramboll, 2022, pp. 3, 34) |
2 |
|
Groundwater availability in Scotland |
GW |
|
(Ramboll, 2022, pp. 3, 35) |
2 |
|
Effluent water availability in Scotland |
GW |
|
(Ramboll, 2022, pp. 3, 37) |
2 |
|
Forecasted green hydrogen capacity in Duisburg |
GW |
Estimated installed green hydrogen capacity in 2050. Based on Figure 73 of the source report. |
(Cerniauskas, et al., 2021, p. 79) |
2 |
|
Electricity to hydrogen conversion efficiency |
% |
69% |
(Ramboll, 2022, p. 20) |
2 |
|
Annual operating hours |
hrs |
7350 |
(Ramboll, 2022, p. 20) |
2 |
|
Average operating load |
% |
70% |
(Ramboll, 2022, p. 20) |
2 |
|
Lower heating value of hydrogen |
kWh |
33.3 |
(U.S. Department of Energy, 2025) |
3 |
|
Water loss allowance |
% |
20 |
(Ramboll, 2022, p. 27) |
2 |
|
Freshwater availability in Duisburg |
Cubic metres |
Non-public fresh water discharged unused/water given to third parties in 2019. |
( Statistische Ämter des Bundes und der Länder, 2025) |
3 |
|
Effluent water availability in Duisburg |
Cubic metres |
Total annual wastewater treated in the three municipal wastewater treatment plants. |
(Wirtschaftsbetriebe Duisburg, n.d.) |
3 |
Table 15: Raw data and rank for water availability by hub.
|
Hub |
Forecasted green hydrogen capacity in 2045 (GW) |
Maximum green hydrogen potential based on total water availability (GW) |
Rank (15 = most available to 1 = least available) |
|---|---|---|---|
|
Aberdeen |
0.50 |
44.5 |
9 |
|
Argyll and Islands |
0.13 |
11.4 |
4 |
|
Ayrshire |
0.50 |
47.5 |
10 |
|
Cromarty |
5.00 |
61.2 |
11 |
|
Duisburg |
1.00 |
14.0 |
5 |
|
Dumfries and Galloway |
0.50 |
26.7 |
8 |
|
Dundee |
0.25 |
73.0 |
13 |
|
Fife |
0.25 |
67.8 |
12 |
|
Glasgow |
2.50 |
239.2 |
15 |
|
Grangemouth |
2.00 |
145.9 |
14 |
|
Moray |
2.00 |
26.6 |
7 |
|
Orkney |
0.05 |
1.5 |
2 |
|
Scottish Borders |
0.00 |
22.9 |
6 |
|
Shetland |
6.30 |
2.0 |
1 |
|
Western Isles |
0.12 |
9.1 |
3 |
Gross Value Added of the energy sector
The Office of National Statistics (ONS) supplied data on the gross value added of the energy and the production sectors (2024). The ONS defined the production sector as SIC07 A-E. For the energy sector (including renewables), the ONS included the following SIC codes:
- SIC 05: Mining of coal and lignite
- SIC 06: Extraction of crude petroleum and natural gas
- SIC 09: Mining support service activities
- SIC 19: Manufacture of coke and refined petroleum products
- SIC 20.14: Manufacture of other organic based chemicals
- SIC 35: Electricity, gas, steam and air conditioning supply
- SIC 36: Water collection, treatment and supply
- SIC 38.22: Treatment and disposal of hazardous waste
- SIC 71.12/2 Engineering related scientific and technical consulting activities
- SIC 74.90/1 Environmental consulting activities
The GVA data by council area was aggregated to provide a hub-level view. Table 16 provides the data for GVA for each hub in the energy and the production sectors.
Table 16: Raw data and rank for GVA of the energy sector by hub.
|
Hub |
Energy sector GVA (2022; £millions) |
Production sector GVA (2022, £millions) |
Rank (15 = highest to 1 = lowest) |
|---|---|---|---|
|
Aberdeen |
25878.9 |
4480 |
15 |
|
Argyll and Islands |
162.1 |
422 |
7 |
|
Ayrshire |
185.3 |
1762 |
9 |
|
Cromarty |
342.8 |
1426 |
10 |
|
Duisburg |
— |
4147 |
13 |
|
Dumfries and Galloway |
167.8 |
980 |
8 |
|
Dundee |
146.9 |
1322 |
6 |
|
Fife |
351.4 |
2232 |
11 |
|
Glasgow |
2910.0 |
7447 |
14 |
|
Grangemouth |
512.1 |
1522 |
12 |
|
Moray |
78.7 |
875 |
4 |
|
Orkney |
69.4 |
130 |
3 |
|
Scottish Borders |
43.7 |
547 |
2 |
|
Shetland |
119.4 |
184 |
5 |
|
Western Isles |
16.8 |
83 |
1 |
Table 17: Summary of data used for the calculation of GVA of the energy sector.
|
Data category |
Unit |
Value/Data used |
Source |
Confidence rating |
|---|---|---|---|---|
|
Energy sector GVA in Scotland |
£million |
|
(Scottish Government, 2024) |
3 |
|
Production sector GVA in Scotland |
£million |
Regional GVA (balanced) by local authority for the Production Sector in 2022. |
(Office for National Statistics, 2024) |
3 |
|
Production sector GVA in Duisburg |
€million |
Duisburg GVA at basic prices for the Production Sector in 2022. |
(Volkswirtschaftliche Gesamtrechnungen der Länder, 2024) |
3 |
|
Euro to pound conversion rate |
£ |
12-month average for 2022: £0.8489 |
(HMRC, 2022) |
3 |
Full time equivalent workers
The data for the current size of workforce in different hubs was taken from Skills Development Scotland. The data was broken down into 32 local authorities. We took the current workforce figures for the Energy and Engineering sectors. The numbers from relevant local authorities were then added to derive the final number for each of our hubs. Table 18 shows the current workforce stats for each hub.
Table 18: Size of workforce in the engineering and energy sectors of Scotland.
|
Hub |
Energy |
Engineering |
Total |
|---|---|---|---|
|
Aberdeen |
42900 |
28200 |
71100 |
|
Argyll and Islands |
800 |
800 |
1600 |
|
Ayrshire |
2400 |
8200 |
10600 |
|
Cromarty |
4900 |
3000 |
7900 |
|
Dumfries and Galloway |
1000 |
1600 |
2600 |
|
Dundee |
1300 |
5100 |
6400 |
|
Fife |
1400 |
10300 |
11700 |
|
Glasgow |
16400 |
39300 |
55700 |
|
Grangemouth |
2500 |
4400 |
6900 |
|
Moray |
600 |
1500 |
2100 |
|
Orkney |
300 |
200 |
500 |
|
Scottish Borders |
400 |
2000 |
2400 |
|
Shetland |
300 |
400 |
700 |
|
Western Isles |
200 |
200 |
400 |
Future workforce requirement
The data for the future workforce requirement was taken from Skills Development Scotland’s database. This data was also disaggregated into 32 local authorities. The figures for all relevant local authorities were added to calculate final figures for our hubs. Table 19 shows the final estimates for future expansion demand.
Table 19: Estimated future expansion demand for each hub in Scotland.
|
Hub |
Total Expansion Demand |
|---|---|
|
Aberdeen |
-4600 |
|
Argyll and Islands |
0 |
|
Ayrshire |
-900 |
|
Cromarty |
-100 |
|
Dumfries and Galloway |
-200 |
|
Dundee |
-500 |
|
Fife |
-1300 |
|
Glasgow |
-1500 |
|
Grangemouth |
-700 |
|
Moray |
-100 |
|
Orkney |
0 |
|
Scottish Borders |
-200 |
|
Shetland |
0 |
|
Western Isles |
0 |
Large-scale storage capacity
Currently, there are no commercial geological hydrogen storage projects in Scotland. So, we have assessed the technical geological storage capacity for each hub. For this, we have used estimates from scientific literature. The sources for each storage technology are detailed in Table 21. We assigned the storage capacities to each hub based on the site’s location or, if offshore, their likely terminal.
We normalised the total large-scale storage capacity for each hub to provide a score from 1-10 (highest capacity). We adjusted the scores of the following hubs by +0.25. This adjustment accounted for the possibility of developing offshore salt caverns and the planned Project Union pipeline that could connect hubs to English salt caverns.
- Aberdeen
- Dumfries and Galloway
- Dundee
- Fife
- Glasgow
- Grangemouth
- Moray
- Orkney
- Scottish Borders
The adjustment helped differentiate low-scoring hubs while maintaining the ranking integrity of those with confirmed storage capacity. Finally, we ranked the hubs from 1-15, where 15 represents the hub with the highest capacity (Table 20).
For Duisburg, we were unable to assess its specific technical storage capacity from scientific literature. However, compared to Scotland, Germany has hydrogen storage projects in the planning phase (Hornby, 2023). Due to the approved German core pipeline network, Duisburg will be connected to these projects. Therefore, due to higher confidence in hydrogen storage availability, we qualitatively assigned Duisburg a score of 3/10. This places Duisburg second to Aberdeen in the final ranking.
Table 20: Large-scale storage capacity by hub.
|
Hub |
Hydrogen storage capacity (TWh) by technology |
Rank (1-15) | |||
|---|---|---|---|---|---|
|
Onshore salt caverns |
Saline aquifers |
Offshore oil/gas |
Total | ||
|
Aberdeen |
0 |
1849 |
1082 |
2931 |
15 |
|
Argyll and Islands |
0 |
0 |
0 |
0 |
1 |
|
Ayrshire |
0 |
0 |
0 |
0 |
1 |
|
Cromarty |
0 |
0 |
0 |
0 |
1 |
|
Duisburg |
0 |
0 |
0 |
0 |
14 |
|
Dumfries and Galloway |
0 |
0 |
0 |
0 |
5 |
|
Dundee |
0 |
0 |
0 |
0 |
5 |
|
Fife |
0 |
0 |
0 |
0 |
5 |
|
Glasgow |
0 |
0 |
0 |
0 |
5 |
|
Grangemouth |
0 |
0 |
0 |
0 |
5 |
|
Moray |
0 |
118 |
0 |
118 |
13 |
|
Orkney |
0 |
0 |
0 |
0 |
5 |
|
Scottish Borders |
0 |
0 |
0 |
0 |
5 |
|
Shetland |
0 |
82 |
32 |
114 |
12 |
|
Western Isles |
0 |
0 |
0 |
0 |
1 |
Table 21: Summary of data used for the calculation of large-scale storage capacity.
|
Data category |
Unit |
Value/Data used |
Source |
Confidence rating |
|
Hydrogen storage capacity – onshore salt caverns |
TWh |
0 TWh |
(ClimateXChange, 2023) |
3 |
|
Hydrogen storage capacity – saline aquifers |
TWh |
Location and technical working hydrogen gas capacity by site |
(Safidi, et al., 2021) |
2 |
|
Hydrogen storage capacity – offshore oil/gas fields |
TWh |
Location and technical working hydrogen gas capacity by field |
(Peecock, et al., 2022) |
2 |
|
Offshore salt cavern locations |
N/A |
– |
(Edlmann, et al., 2024) |
3 |
|
Potential hydrogen pipeline locations |
N/A |
– |
(Edlmann, et al., 2024) |
3 |
|
Planned hydrogen storage in Ruhr area |
N/A |
– |
(Hornby, 2023) |
3 |
Pipeline network infrastructure
To score each hub’s potential pipeline infrastructure, we used the following scale from 1-6:
- There is no pipeline infrastructure suitable for hydrogen and no proposed or planned new hydrogen pipelines.
- There are existing gas pipelines which can be repurposed. There are no planned new hydrogen pipelines but there may be some proposed.
- There is a small-scale (e.g. distribution/spur pipelines) hydrogen pipeline project at any phase of development.
- There is a large-scale (e.g. trunkline pipelines) hydrogen pipeline project at any phase of development.
- The hub is a potential international export or import site for hydrogen and HDPs. However, planned pipeline infrastructure is insufficient and/or the site is not well-established for international trade.
- The hub is a potential international export or import site for hydrogen and HDPs. There is sufficient planned pipeline infrastructure, and the site is well-established for international trade.
We have detailed the justification and sources for each hub’s rating in Table 22. Using these ratings, the hubs were ranked from 1 to 15 (Table 23). 15 represents the hub with the most suitable pipeline network infrastructure.
Table 22: Scoring method for pipeline network infrastructure.
|
Hub |
Rating (1-6) |
Justification |
Source |
|---|---|---|---|
|
Aberdeen |
6 |
|
(Net Zero Technology Centre, 2023) |
|
Argyll and Islands |
2 |
|
(Net Zero Technology Centre, 2023) |
|
Ayrshire |
3 |
|
(Scottish Enterprise, n.d.; SGN, 2021), |
|
Cromarty |
5 |
|
(Net Zero Technology Centre, 2023; Scottish Enterprise, n.d.) |
|
Duisburg |
6 |
|
(Bundesnetzagentur, 2024; Gasunie, 2023) |
|
Dumfries and Galloway |
4 |
|
(Net Zero Technology Centre, 2023; Scottish Enterprise, n.d.) |
|
Dundee |
4 |
|
(SGN, 2021) |
|
Fife |
4 |
|
(SGN, 2021) |
|
Glasgow |
3 |
|
(SGN, 2021; Scottish Enterprise, n.d.) |
|
Grangemouth |
4 |
|
(SGN, 2021; SGN, 2023) |
|
Moray |
3 |
|
(SGN, 2021; Scottish Government, 2020) |
|
Orkney |
5 |
|
(SGN, 2021; Net Zero Technology Centre, 2023) |
Table 23: Hub ranking for pipeline network infrastructure.
|
Hub |
Rank (1 = least suitable to 15 = most suitable) |
|---|---|
|
Aberdeen |
14 |
|
Argyll and Islands |
1 |
|
Ayrshire |
2 |
|
Cromarty |
11 |
|
Duisburg |
14 |
|
Dumfries and Galloway |
6 |
|
Dundee |
6 |
|
Fife |
6 |
|
Glasgow |
2 |
|
Grangemouth |
6 |
|
Moray |
2 |
|
Orkney |
11 |
|
Scottish Borders |
6 |
|
Shetland |
11 |
|
Western Isles |
2 |
Ports
We have investigated which hubs are most suitable for meeting maritime shipping fuel demand and for trading hydrogen and HDPs by ship. To evaluate the scale of each hub’s maritime industry, we ranked the hubs based on their total port freight traffic in 2023. This analysis was based on the Department for Transport’s Port Freight Statistics Publication (Maritime Statistics, 2024). The Port0101 dataset breaks down freight traffic by port and council authority. Traffic included domestic and international freight traffic in both directions and we included all ports – major and minor. For Duisburg, we used State Office for Information and Technology NWR data for freight traffic in both directions for 2023 (2024).
We adjusted these initial ranked scores based on several criteria, shown in Table 24. For the port dimensions criterion, if online information was conflicting, we selected the greatest dimension for further scoring. This multi-factor scoring method reflects the diverse functions that ports serve. Based on these final scores, we ranked the hubs from 1 to 15 (Table 25). 15 represents the hub with the most suitable port infrastructure.
Table 24: Score adjustment criteria for scoring port metric.
|
# |
Criteria |
Score adjustment | |
|---|---|---|---|
|
If YES |
If NO | ||
|
1 |
Does the hub have a port with existing or planned infrastructure for the storage, production or maritime fuelling of hydrogen/HDPs? |
+2 |
–2 |
|
2 |
Does the hub have a port with dimensions suitable for a typical small carrier vessel for transporting gas or ammonia? The Scottish Government defines these dimensions as a 100m length, 25m beam and a 12m draft (2020, p. 63). |
+2 |
–2 |
|
3 |
Does the hub have a port which is considered suitable for hydrogen exports or imports by the government? |
+3 |
–2 |
Table 25: Summary of data used for scoring the port metric.
|
Data category |
Unit |
Value/Data used |
Source |
Confidence rating |
|---|---|---|---|---|
|
Port freight traffic – Scotland |
Thousand tonnes |
2023 freight traffic, both directions |
(Maritime Statistics, 2024) |
3 |
|
Port freight traffic – Duisburg |
Thousand tonnes |
2023 freight traffic, both directions |
(Information und Technik Nordrhein-Westfalen, 2024) |
3 |
|
Port dimensions |
metres |
Where available – the port’s maximum length, beam and draft |
(SHIPNEXT BV, 2025; OneOcean Group Ltd, 2023; Port of Aberdeen, 2025; UKPORTS, 2025) |
3 |
|
Hydrogen/HDP infrastructure – Duisburg |
– |
– |
(Duisport, 2022) |
3 |
|
Hydrogen/HDP infrastructure – Scotland |
– |
– |
(Scottish Government, 2020) |
3 |
|
Import hub – Duisburg |
– |
– |
(Tix, 2024) |
3 |
|
Export hubs – Scotland |
– |
– |
(Scottish Government, 2020) |
3 |
Table 26: Raw data, analysis and rank for ports by hub.
|
Hub |
Port freight traffic (thousand tonnes, 2023) |
Criteria 1 (YES = ☒) |
Criteria 2 (YES = ☒) |
Criteria 3 (YES = ☒) |
Rank (1 = least suitable to 15 = most suitable) |
|---|---|---|---|---|---|
|
Duisburg |
41333 |
☒ |
☐ |
☒ |
15 |
|
Cromarty |
7376 |
☒ |
☒ |
☒ |
13 |
|
Fife |
18681 |
☒ |
☐ |
☒ |
13 |
|
Grangemouth |
18521 |
☒ |
☐ |
☒ |
12 |
|
Shetland |
5975 |
☒ |
☒ |
☒ |
11 |
|
Aberdeen |
4395 |
☒ |
☒ |
☒ |
10 |
|
Orkney |
1689 |
☒ |
☒ |
☒ |
9 |
|
Ayrshire |
8923 |
☐ |
☒ |
☐ |
8 |
|
Glasgow |
8594 |
☐ |
☐ |
☐ |
7 |
|
Dumfries and Galloway |
6511 |
☐ |
☐ |
☐ |
6 |
|
Western Isles |
204 |
☒ |
☐ |
☐ |
5 |
|
Moray |
108 |
☒ |
☐ |
☐ |
4 |
|
Dundee |
996 |
☐ |
☐ |
☐ |
3 |
|
Argyll and Islands |
46 |
☐ |
☐ |
☐ |
2 |
|
Scottish Borders |
0 |
☐ |
☐ |
☐ |
1 |
Local policy and planning support
The data for the local policy and planning support metrics were taken from Scottish government’s Planning Application Statistics database. The data was broken down into 24 local planning authorities. The data was taken from the relevant local authorities and averaged for all our hubs.
It was found that for the average success rate of applications, there was no data for 6 hubs. Table 27 shows the average success rate and average planning duration for each Scottish hub and Duisburg.
Table 27: Average success rate and duration for planning applications
|
Hub |
Average success rate of planning applications |
Average duration of planning applications (weeks) |
|---|---|---|
|
Aberdeen |
87% |
6.7 |
|
Argyll and Islands |
No Data |
17.6 |
|
Ayrshire |
50% |
6.7 |
|
Cromarty |
80% |
15.3 |
|
Duisburg, Germany |
No Data |
18 |
|
Dumfries and Galloway |
No Data |
13.2 |
|
Dundee |
79% |
11.7 |
|
Fife |
53% |
10.3 |
|
Glasgow |
70% |
14.6 |
|
Grangemouth |
80% |
9 |
|
Moray |
No Data |
7.2 |
|
Orkney |
No Data |
10.6 |
|
Scottish Borders |
88% |
8.2 |
|
Shetland |
No Data |
10.6 |
|
Western Isles |
No Data |
13.9 |
Sensitivity analysis
For main report, we weighted capability groups according to the working group’s priorities and adjusted these weightings based on data confidence. We normalised each metric ranking from 1-15 into a 1-10 scale. Then, according to the defined weightings, we scaled the metric score for each hub to provide a total score out of 100.
Here, we analyse the sensitivity of this priority scoring by considering two alternative scenarios:
- The balanced scenario – all metrics are weighted equally at 9.1%.
- The absolute scenario – Rather than scoring hubs relatively according to metric rankings, we used the absolute data for each metric. For example, for GVA of the energy sector, we normalised the absolute GVA values to give a score from 1-10. The same weightings are used as in the priority scenario.
Table 28: Hub rankings from priority, balanced and absolute scenario.
|
Rank (15 = highest score to 1 = lowest score) |
Hub scoring method | ||
|---|---|---|---|
|
Priority scenario |
Balanced scenario |
Absolute scenario | |
|
15 |
Aberdeen |
Aberdeen |
Aberdeen |
|
1 |
Argyll and Islands |
Argyll and Islands |
Argyll and Islands |
|
9 |
Ayrshire |
Ayrshire |
Ayrshire |
|
13 |
Cromarty |
Glasgow |
Cromarty |
|
14 |
Duisburg |
Duisburg |
Duisburg |
|
6 |
Dumfries and Galloway |
Moray |
Dumfries and Galloway |
|
8 |
Dundee |
Dundee |
Dundee |
|
11 |
Fife |
Grangemouth |
Fife |
|
12 |
Glasgow |
Cromarty |
Glasgow |
|
10 |
Grangemouth |
Fife |
Grangemouth |
|
7 |
Moray |
Shetland |
Moray |
|
4 |
Orkney |
Orkney |
Orkney |
|
3 |
Scottish Borders |
Dumfries and Galloway |
Scottish Borders |
|
5 |
Shetland |
Scottish Borders |
Shetland |
|
2 |
Western Isles |
Western Isles |
Western Isles |
Table 28 shows the final ranking for supply chain capability according to all three scenarios. Several key insights can be taken from our sensitivity analysis:
- We can see that the hubs at the ranking extremes remain the same. Aberdeen remains the top hub for supply chain capability, while the Western Isles and Argyll and Islands are the bottom hubs.
- The hubs between these extremes vary according to the scenario. However, the general “upper” (Cromarty, Glasgow, Fife, Grangemouth, Ayrshire) and “lower” (Dundee, Moray, Dumfries and Galloway, Shetland, Orkney and Scottish Borders) groupings identified in the priority scenario are consistent in the balanced and absolute scenarios.
Demand mapping – e-methanol and ammonia for maritime
It is estimated that the UK used roughly 7 million tonnes of fossil marine fuels in the year 2021 (Transport & Environment, 2023). We used the EU Commission’s assumption of 40.5 MJ/kg as the energy content of marine fuel. Using this, we derived the addressable market for the whole of UK. Assuming that the fuel usage by Scottish ports will have the same share, we estimated the addressable market for Scotland’s maritime sector. Using data from the Department for Transport, we calculated the share of freight activity of each hub’s ports in the UK (Maritime Statistics, 2024).
Due to the uncertainties associated with estimating demand for individual HDPs in this sector, our analysis is technologically agnostic. We have not tried to estimate individual demand for each HDP. This analysis only estimated the addressable demand for all HDPs in the maritime sector of Scotland.
Table 29: Estimated shipping fuel demand by hub
|
Hub |
Shipping fuel demand (TWh) |
|---|---|
|
Aberdeen |
0.8 |
|
Argyll and Islands |
0.0 |
|
Ayrshire |
1.6 |
|
Cromarty |
1.4 |
|
Dumfries and Galloway |
1.0 |
|
Dundee |
0.2 |
|
Fife |
3.5 |
|
Glasgow |
1.5 |
|
Grangemouth |
3.5 |
|
Moray |
0.0 |
|
Orkney |
0.5 |
|
Scottish Borders |
0.0 |
|
Shetland |
1.2 |
|
Western Isles |
0.0 |
Demand mapping – e-methanol for chemicals
In Scotland, we assume that Grangemouth Chemical Science Park is the only large-scale user of methanol as a chemical feedstock. We based this analysis on the estimated syngas produced from two onsite ethane crackers which supply INEOS’ polymer plants (INEOS Group, 2025). The ethane crackers have a production capacity of around 1 million tonnes of ethylene per year (Endeavor Business Media, 2016). From this value, we have reverse calculated the yield of syngas (hydrogen and methane from the crackers). Assuming an 80% yield of ethylene product, 1.25 million tonnes of ethane feedstock is required (Brooks, 2013). From literature, we can expect an estimated 13% yield of syngas (Brooks, 2013). This means 160,000 tonnes of syngas is produced from 1.25 million tonnes of ethane. In the production of petrochemicals, syngas is converted to methanol. Assuming 8600 hours/year of operation and a 62% yield, we can expect to produce around 100,000 tonnes of methanol (Timsina, et al., 2021). We then multiplied this result by the lower calorific value of methanol (19.9 MJ/kg) and the conversion factor of 2.78×10⁻¹⁰to give the energy demand in TWh.
Demand mapping – SAF for aviation
We estimated the addressable market for SAFs in the Scotland by estimating the potential demand for jet fuel in each public airport in Scotland. Due to lack of data on jet fuel consumption in each airport, we took some assumptions to calculate potential demand. It is estimated that the UK used 11 million tonnes of jet fuel in the year 2022. This figure is for all the airports in the UK. So, to determine jet fuel demand for Scotland, we calculated the percentage of aircraft activity in each airport against the total UK aircraft activity. It was then assumed that the proprtion of jet fuel used in an airport will be the same as their share in total aircaft activity.
The table below show the proportion of aircraft movement in each hub and airport.
Table 30: Estimated jet fuel demand in all Scottish airports.
|
Hub |
Airport |
Potential SAF Demand (TWh) |
Total hub potential demand (TWh) |
|---|---|---|---|
|
Aberdeen |
Aberdeen |
3.49 |
3.49 |
|
Argyll and Bute |
Campbeltown |
0.07 |
0.26 |
|
Argyll and Bute |
Islay |
0.12 |
0.26 |
|
Argyll and Bute |
Tiree |
0.07 |
0.26 |
|
Cromarty |
Inverness |
1.20 |
1.20 |
|
Dundee |
Dundee |
1.66 |
1.66 |
|
Glasgow |
Glasgow |
3.51 |
4.45 |
|
Glasgow |
Glasgow Prestwick |
0.94 |
4.45 |
|
Grangemouth |
Edinburgh |
5.03 |
5.03 |
|
Orkney |
Kirkwall |
0.54 |
0.70 |
|
Orkney |
Wick John O’ Groats |
0.16 |
0.70 |
|
Shetland |
Lerwick (Tingwall) |
0.06 |
0.93 |
|
Shetland |
Scatsta |
0.19 |
0.93 |
|
Shetland |
Sumburgh |
0.68 |
0.93 |
|
Western Isles |
Barra |
0.05 |
0.55 |
|
Western Isles |
Benbecula |
0.13 |
0.55 |
|
Western Isles |
Stornoway |
0.37 |
0.55 |
Demand mapping – ammonia for fertilisers
To estimate ammonia demand from fertilisers, we first estimated the total demand for nitrogen based fertilsers in Scotland. For our analysis, we assumed that nitrogen-based fertilisers consist of just urea and ammonium nitrate fertilisers. The fertiliser use estimation was done for both cropland and grassland. The average nitrogen based fertiliser application rate was taken from the UK government’s Fertiliser Use Database. The average application rate for nitorgen fertiliser in Scottish croplands is 120 kg/ha. And the average application rate for grassland is 83 kg/ha.
This average application rate was then multiplied by the total estimated crop and grass lands in Scotland. We then estimated the nitrogen content in these two fertilisers. After getting the nitrogen content in them, we estimated the demand for ammonia.
Once the final figure for ammonia was derived, we divided the total use of ammonia for all our hubs. This was done by assuming that each hub’s share of use of ammonia will be the same as their share of total GVA in agriculture. The table below shows our demand estimates for ammonia in each Scottish hub.
Table 31: Estimated ammonia demand from fertilisers in Scotland
|
Hub |
Ammonia fertiliser demand (thousand tonnes) |
Ammonia fertiliser demand (TWh) |
|---|---|---|
|
Aberdeen |
27.1 |
0.140 |
|
Argyll and Islands |
2.5 |
0.013 |
|
Ayrshire |
4.2 |
0.022 |
|
Cromarty |
7.4 |
0.038 |
|
Dumfries and Galloway |
4.2 |
0.021 |
|
Dundee |
2.5 |
0.013 |
|
Fife |
4.8 |
0.025 |
|
Glasgow |
24.5 |
0.126 |
|
Grangemouth |
3.0 |
0.015 |
|
Moray |
1.2 |
0.006 |
|
Orkney |
0.9 |
0.005 |
|
Scottish Borders |
2.8 |
0.014 |
|
Shetland |
1.4 |
0.007 |
|
Western Isles |
0.0 |
0.000 |
Table 32: Further information about all the policies and regulations we researched.
|
Region |
Policy name |
Description |
|---|---|---|
|
European Union |
Net Zero Target |
The European Union aims to meet net zero emissions by 2050. |
|
European Union |
Hydrogen Strategy |
The hydrogen strategy for a climate-neutral Europe was adopted in July 2020. |
|
European Union |
RePowerEU |
The European Commission implemented the REPowerEU Plan to phase out reliance on Russian fossil fuel imports following the invasion of Ukraine. |
|
European Union |
REDIII Targets |
Transport: RED III fuel suppliers must achieve a 14.5% reduction in GHG emissions associated with their fuels or achieve at least 29% renewables share in the fuel supply. In addition, at least 5.5% of the fuel mix must be composed of advanced biofuels and RFNBOs (combined binding target). Industry: The EUs CBAM Regulation (10th May 2023) will be transitioned in during the period of 2023-2026 and then full force from 2026 onwards. The EU’s Fit for 55 proposals include a 50% renewable share for hydrogen used in industry. RED III – Industry must procure at least 42% of its hydrogen from renewable fuels of non-biological origin (RFNBOS) by 2030, though countries that can achieve a fossil-free hydrogen mix of at least 77% by 2030 can see that target reduced by 20%. |
|
European Union |
H2Global |
H2Global is live (1st auction closed 2023) and formed through H2 purchase and sale agreements through a central body. Managed windows for funding applications through 10-year hydrogen purchase agreements, competition-based procurement process. As of 06/23, H2Global and the Hydrogen Investment Bank have been linked. Working on a European auction open to all EU countries. |
|
European Union |
Hydrogen Bank |
Acts through an auction system, fixed price payment per kg. Fixed premium per kg hydrogen produced for a maximum of 10 years of operation. Auctions launched under the Innovation Fund in the autumn of 2023. |
|
European Union |
Innovation Fund |
The innovation fund hydrogen focussed from Nov 2022. Acts through a competitive bidding process – max bid 4 Euro per kg* – and via waves of calls for proposals. |
|
European Union |
IPCEI |
Important Project of Common European Interest (IPCEI) are live and provided in waves of grant funding. A requirement for projects must be for them to show they are financially viable without subsidies. |
|
European Union |
AFIR |
AFIR passed March 2023, detailing one HRS to be deployed every 200km along Ten-T core. |
|
European Union |
Fitfor55 |
Fit for 55: 2.6% target for renewable fuels of non-biological origin (RFNBO) in transport by 2030 |
|
European Union |
EU ETS |
The EU Emission Trading Scheme is a “cap and trade” system that limits the amount of greenhouse gases which can be emitted within the EU. |
|
European Union |
EU MoUs |
The EU has signed MoUs with Japan, Egypt, Mauritania (and others) around hydrogen including export/imports. |
|
European Union |
RED Low Carbon Hydrogen Standard |
3.38 kg CO2-eq/kg hydrogen (28 gCO2e per MJ) (70% lower compared to emissions from fossil fuels). Two delegated acts under Renewable Energy Directive published by the Commission in Feb-23 – (i) principle of additionality, (ii) methodology for calculating GGG emissions. Rules to apply to imports. |
|
United Kingdom |
Net Zero Target |
Net zero by 2050. 78% emission reduction by 2035. Mandated in law. Net Zero power system by 2030. |
|
United Kingdom |
UK Hydrogen Strategy |
Production target of 10 GW by 2030, with at least 6 GW of this coming from green production. |
|
United Kingdom |
HPBM |
Hydrogen Production Business Model – a CFD funding mechanism bridging the difference between producing low-carbon hydrogen gas and the price of natural gas. Funding provided through allocation rounds. |
|
United Kingdom |
Hydrogen Transport Business Model (HTBM) |
This is a policy for hydrogen transport projects that are expecting to connect to hydrogen network in the future. The policy aims to mitigate risks for hydrogen network developers. This is done by guaranteeing a fixed rate of return to the developers. |
|
United Kingdom |
Hydrogen Storage Business Model (HSBM) |
Similar to HTBM, this policy aims to incentivise large scale hydrogen storage. |
|
United Kingdom |
Net Zero Hydrogen Fund (NZHF) |
The NZHF provides support for a range of different costs such as development or capital expenditures. |
|
United Kingdom |
Health and Safety Executive (HSE) |
HSE will play a role in determining the safety case for hydrogen in heating. More information from HSE will reduce the uncertainty with hydrogen’s role in decarbonising heat. |
|
United Kingdom |
ADR Regulation |
ADR regulation lays down specific regulations for transport of “dangerous goods”. This regulation includes in its scope both hydrogen and various HDPs that meet the criteria of being dangerous. |
|
United Kingdom |
Gas Safety Management Regulation (GSMR) |
GSMR prohibits injecting more than 0.1% hydrogen into the networks. This will need to be updated to expand the role of hydrogen blending into existing pipelines. |
|
United Kingdom |
Control of Major Accident Hazard (COMAH) |
This applies to many of hydrogen derivatives and products due to their safety concerns. |
|
United Kingdom |
LCHS |
The UK Low Carbon Hydrogen Standard sets a carbon intensity threshold for hydrogen production of 20 gCO2e/MJ (2.4 kg CO2-eq/kg hydrogen). If the hydrogen produced meets this standard, it can be deemed low-carbon and is eligible for government subsidy. |
|
United Kingdom |
UK ETS |
The UK’s own ETS scheme since leaving the EU. |
|
United Kingdom |
SAF Mandate |
The UK has formed a SAF mandate stipulating set targets for percentage shares of SAF, and specific production pathways (such as PtL). Headline figure is that 10% of UK aviation fuel will be SAF by 2030. |
|
United Kingdom |
RTFO |
The Renewable Transport Fuels Obligation |
|
Germany |
Net Zero Target |
Net zero by 2045. Emissions shall move to net negative after 2050. Germany has set the preliminary targets of cutting emissions by at least 65 percent by 2030 compared to 1990 levels, and 88 percent by 2040 Mandated in law. |
|
Germany |
National Hydrogen Strategy |
The German hydrogen national strategy was released in 2020 before being an update was released in 2023. |
|
Germany |
H2 Global |
H2 Global – value €4 billion. Initial auction of 900mn euros launched in Dec 2022 for H2 derivatives. Government plans to make a further 3.5 billion euros available for new bidding rounds with durations up to 2036. |
|
Germany |
Carbon Tax |
CO2 tax (introduced in 2023) for Avgas and Jet A-1. |
|
Germany |
Hydrogen Mobility Targets |
Targets include fuel cell trucks, 20 HRS’s and passenger cars, fuel cell buses for public transportation, and the operation of the first inland ship operating on hydrogen by 2025. |
|
Germany |
National MOUs |
Several MoUs signed surrounding imports of hydrogen and ammonia into the country – Mauritania MoU could equate to 8 million tonnes/year. |
|
The Netherlands |
Net Zero Target |
Net zero by 2050. 55% CO2 reduction by 2030. In law. |
|
The Netherlands |
National Hydrogen Strategy |
The Netherlands hydrogen strategy was released in 2020. |
|
The Netherlands |
National Climate Agreement |
The national climate agreement contains set targets for fuel cell HDVs, passenger cars and hydrogen refuelling stations. |
|
The Netherlands |
Carbon Levy |
In 2021, introduced carbon levy for industry – complementary to EU ETS – road mapped to 2030 currently. |
|
The Netherlands |
Guarantees of Origin Scheme |
Green hydrogen Guarantees of Origin operational from Oct-22, following a Bill (May-22) and trial (summer-22). |
|
The Netherlands |
H2Global |
300mn euro specific funding from H2Global, including funding for ammonia. |
|
The Netherlands |
National MoUs |
In 2020, the US and the Netherlands signed a statement of intent to collaborate on hydrogen. The Minister of Energy of Chile and the State Secretary for Economic Affairs and Climate Policy signed a joint statement on collaboration in the field of green hydrogen import and export (July 2021). The UAE Ministry of Energy and Infrastructure and the Dutch Ministry for Foreign Trade and Development Cooperation have signed a Memorandum of Understanding on hydrogen energy. As part of their Joint Economic Committee, the UAE and the Netherlands have been in discussions to identify common interests and create a partnership for decarbonisation of the energy sector and increasing the use of clean hydrogen (March 2022). |
|
Belgium |
Net Zero Target |
Net Zero by 2050, 55% emissions reductions target in place for 2030. |
|
Belgium |
National Hydrogen Strategy |
Hydrogen strategy enacted firstly in 2021, with an update in 2022. Both strategies focussed on positioning Belgium as an import and transit location for low-carbon molecules into Europe. The country will remain dependent on energy imports in various forms to cover its domestic demand, estimating between 2 and 6 TWh of renewable hydrogen (or derivatives) in 2030 and between 100 and 165 TWh in 2050 |
|
Belgium |
Energy Transition Fund |
The Energy Transition Fund will fund until 2025, providing 20-30 million euros in support. The federal government has also earmarked 60 million euros (including 50 million euros from the national recovery and resilience plan) to invest and support projects to scale up innovative, low-carbon technologies. |
|
Belgium |
Hydrogen Act |
The Hydrogen Act establishes a regulatory framework for the transport of hydrogen via pipelines. The act intends to foster the growth of the Belgian hydrogen market and the required hydrogen transport infrastructure. |
How to cite this publication:
Yip, E., Nagpal, D., Wilson, J., Morton, H. (2025) Scotland’s capabilities in producing hydrogen products and derivatives ‘, ClimateXChange. DOI: http://dx.doi.org/10.7488/era/6397
© The University of Edinburgh, 2025
Prepared by Talan on behalf of ClimateXChange, The University of Edinburgh. All rights reserved.
While every effort is made to ensure the information in this report is accurate as at the date of the report, no legal responsibility is accepted for any errors, omissions or misleading statements. The views expressed represent those of the author(s), and do not necessarily represent those of the host institutions or funders.
This work was supported by the Rural and Environment Science and Analytical Services Division of the Scottish Government (CoE – CXC).
ClimateXChange
Edinburgh Climate Change Institute
High School Yards
Edinburgh EH1 1LZ
+44 (0) 131 651 4783
There are two types of estimated demand: replacement and expansion. Replacement demand refers to workers that will be needed to replace the current workforce. Expansion demand represents demand that will arise due to the growth in an industry. ↑
The Scottish Landfill Tax (SLfT), introduced in April 2015, was designed to discourage landfill disposal and encourage prevention, reuse, recycling and energy recovery.
The tax has two rates. The lower rate of SLfT was designed to provide a low-cost disposal route for inert, low-risk materials, such as rocks and soils. A higher standard rate targeted more polluting materials to support environmental goals. In early 2024, lower-rate materials exceeded standard-rate materials for the first time.
This research provides an initial evidence base to assess the effectiveness of the lower rate and explore whether changes could better support a low-carbon, circular economy. It examines the most common lower-rate materials, their environmental impacts, the feasibility of diversion and options for policy reform.
The researchers conducted quantitative and qualitative data analysis, a literature review and stakeholder engagement.
Findings
Three materials accounted for 77% of all waste landfilled at the lower rate in 2023–24, by weight:
- mechanically-treated fines (small particles from treatment of general construction and demolition waste, municipal recyclate etc)
- soils and stones from construction waste
- mechanically-treated mineral fines (small particles from treatment of naturally-occurring materials such as rocks and soils, silt, clay, sand and stones, found in quarry, construction and demolition waste etc)
Mechanically-treated fines make up the greatest quantities of all lower-rate materials, despite being intended as a residual output from material recovery processes. Trends raise concerns regarding misclassification.
Environmental impact analysis, based on the quantities landfilled in Scotland, showed that these three materials also have the highest impacts across indicators such as air pollution, water use and resource scarcity.
This study suggests the lower-rate SLfT may be only partially aligned with Scotland’s current circular economy, waste prevention and climate goals. While it has supported some diversion of inert waste from landfill, it may also be driving unintended behaviours and limiting investment in recovery.
Both fiscal and non-fiscal actions may be needed to address these challenges. The upcoming Scottish Aggregates Tax and wider circular economy policy agenda offer opportunities to align SLfT more closely with long-term environmental objectives.
For further details, please read the report.
If you require the report in an alternative format, such as a Word document, please contact info@climatexchange.org.uk or 0131 651 4783.
Podcast and blog
Susan Evans and Richard Claxton give an overview of the project and findings in episode 17 of our podcast: Evidence for climate policy in Scotland
A blog post summarising the podcast interview is also available on our website: Project snapshot: Reviewing the landfill tax
Image credit: WOKANDAPIX from Pixabay
Research completed May 2025
DOI: http://dx.doi.org/10.7488/era/6063
Executive summary
The Scottish Landfill Tax (SLfT), introduced in April 2015, was designed to discourage landfill disposal and encourage prevention, reuse, recycling, and energy recovery.
The tax has two rates. The lower rate of SLfT was designed to provide a low-cost disposal route for inert, low-risk materials, such as rocks and soils. A higher standard rate targeted more polluting materials to support environmental goals.
In early 2024, lower-rate materials exceeded standard-rate materials for the first time. Along with shifts in policy priorities and a widening gap between the lower and standard tax rates, this raises questions about whether the lower rate remains aligned with the Scottish Government’s environmental objectives.
Aims
This research provides an initial evidence base to assess the effectiveness of the lower rate and explore whether changes could better support a low-carbon, circular economy. It examines the most common lower-rate materials, their environmental impacts, the feasibility of diversion and options for policy reform.
We conducted quantitative and qualitative data analysis, a literature review and stakeholder engagement.
Findings
Priority materials
We found that three materials accounted for 77% of all waste landfilled at the lower rate in 2023–24, by weight:
- mechanically-treated fines (small particles from treatment of general construction and demolition waste, municipal recyclate etc.)
- soils and stones from construction waste
- mechanically-treated mineral fines (small particles from treatment of naturally-occurring materials such as rocks and soils, silt, clay, sand and stones, found in quarry, construction and demolition waste etc)
Mechanically-treated fines make up the greatest quantities of all lower-rate materials, despite being intended as a residual output from material recovery processes. Trends raise concerns regarding misclassification and (from our interviews) of intentional production.
Environmental impact analysis, based on the quantities landfilled in Scotland, showed that these three materials also have the highest impacts across indicators such as air pollution, water use and resource scarcity.
The classification of lower-rate materials is complex. The European Waste Catalogue (EWC) codes used by industry do not directly align with SLfT qualifying categories. Moreover, some codes encompass a range of material compositions depending on their source. Mechanically-treated fines are diverse in composition, originating from various construction waste materials. Soils and stones from construction waste, though better defined, also pose classification and compliance challenges. Mechanically-treated mineral fines tend to be more uniform.
Waste prevention and landfill diversion options
Soils and stones are often reused on-site or in restoration, though off-site reuse is constrained by regulation, logistics, and project timing. Options for recovering and re-using mechanically-treated fines are limited, due to contamination and variable composition. The recovery of mechanically-treated mineral fines is easier than the recovery of non-mineral fines but the cost and technical barriers make the use of virgin materials a simpler option.
Upstream measures in the construction sector may have more impact than attempts to recover and re-use waste. Such measures might include improving waste source segregation, designing for reuse and avoiding demolition. While such interventions are technically viable, they are limited in practice by weak incentives, inconsistent standards, and market barriers.
Policy assessment
The SLfT interacts with several fiscal and non-fiscal policies, both existing and on the horizon. These include the upcoming ban on biodegradable municipal waste to landfill; Scottish Aggregates Tax and Digital Waste Tracking, both expected in 2026 (DEFRA, 2023). Based on the assessment of diversion options for the priority materials, we highlighted various fiscal and non-fiscal policy options for future consideration.
Conclusions
This study suggests the lower-rate SLfT may be only partially aligned with Scotland’s current circular economy, waste prevention and climate goals. While it has supported some diversion of inert waste from landfill, it may also be driving unintended behaviours and limiting investment in recovery. Both fiscal and non-fiscal actions may be needed to address these challenges. The upcoming Scottish Aggregates Tax and wider circular economy policy agenda offer opportunities to align SLfT more closely with long-term environmental objectives.
Key areas for further exploration could include:
- Raising the lower SLfT rate to incentivise application of the waste hierarchy.
- Assigning a new SLfT rate to mechanically-treated fines, to address misclassification and recognise its relatively high environmental impacts.
- Strengthening enforcement and guidance on material classification to reduce compliance risks.
- Build on existing cross-border regulatory and enforcement cooperation to address ongoing challenges such as waste tourism and the evolution of the landfill tax.
This research is relevant to the Scottish Government, Revenue Scotland, SEPA, and others involved in the design or enforcement of fiscal and waste management policy, as well as stakeholders in the construction, demolition and waste processing sectors.
Glossary / Abbreviations table
|
AGL |
The Aggregates Levy, a UK tax on the use of virgin rock, sand, and gravel for commercial purposes such as building roads and houses; to be replaced in Scotland by the Scottish Aggregates Tax from 1 April 2026 |
|
BMW |
Biodegradable municipal waste |
|
CCL |
The Climate Change Levy, a UK tax to encourage reduction in gas emissions and greater efficiency of energy use. |
|
CPF |
Carbon Price Floor, a UK policy which imposes a tax on fossil fuels to incentivise investment in low-carbon power generation |
|
C&D |
Construction and demolition |
|
C&D fines |
Collective term used in this report for mechanically-treated fines (19 12 12) and mechanically-treated mineral fines (19 12 09) due to similar end-of-pipe diversion options and barriers |
|
EPR |
Extended producer responsibility, the responsibility of a producer for the environmentally sound management of a product until the end of its life |
|
EWC code |
European Waste Catalogue code, used in Scotland and across the UK for classifying waste, and sometimes referred to as the ‘list of wastes’ |
|
GHG |
Greenhouse gas |
|
LCA |
Lifecycle analysis, a process of evaluating the effects that a product has on the environment throughout its production, use and disposal |
|
LOI |
Loss on ignition testing, introduced by HM Revenue and Customs in 2015, is used to determine the organic content of waste fines, helping prevent misclassification for landfill tax purposes: fines with less than 10% LOI qualify for a lower tax rate |
|
RS |
Revenue Scotland |
|
SAT |
Scottish Aggregates Tax, due to replace the UK AGL from 1 April 2026 |
|
SEPA |
Scottish Environment Protection Agency |
|
SLfT |
Scottish Landfill Tax |
|
SWEFT |
Scottish Waste Environmental Footprint Tool, developed by Zero Waste Scotland, quantifies the environmental impact of household waste on a whole lifecycle basis |
|
WAC |
Waste acceptance criteria test is used to assess how waste will behave once landfilled, primarily by analysing leachate to determine suitability for disposal. |
|
WTN |
Waste transfer note, a document that details the transfer of waste from one person or organisation to another |
Introduction
Research context and aims
The Scottish Landfill Tax (SLfT) was introduced in April 2015, following the devolution of landfill taxation under the Scotland Act 2012. It replaced the UK Landfill Tax in Scotland and was designed to discourage landfill disposal and encourage adherence to the waste hierarchy. This hierarchy prioritises prevention, reuse, recycling, and energy recovery over landfill.
The tax is collected and administered by Revenue Scotland and has two rates. The standard rate, which covers materials more likely to pollute the environment or generate greenhouse gas (GHG) emissions, will be £126.15 per tonne in 2025-26. The lower rate is £4.05 per tonne as of April 2025 (Revenue Scotland, 2024b). The lower rate applies to materials considered to have low GHG emissions, limited pollution risks, and no hazardous properties when landfilled. For instance, ceramics, glass, soil and stones, and various mixtures of inert materials. Both rates were raised incrementally each year from 2015-16 to 2024-25, and increased by around 24% in April 2025-26 (Revenue Scotland, 2024a).
However, there is a large, widening gap between the rates, and the criteria and conditions for setting them have remained unchanged since 2016. This prompts questions about whether the lower rate continues to align with Scotland’s evolving environmental priorities. It also offers opportunities for policy development, which this research explores. The timing of this study is particularly relevant: a UK Government consultation on landfill tax reform is underway at the time of the publication of this study, concluding in July 2025 (HM Treasury and HMRC, 2025). Moreover, in 2024, the Welsh Government implemented an increase to its lower rate. These developments signal a wider shift in approach across the UK, and this research aims to inform future decision-making in Scotland as part of that wave of change.
Tonnages of landfilled waste have steadily declined over the past decade, but standard rate materials have dropped fastest. In early 2024, the quantity of lower rate materials exceeded that of standard rate materials for the first time. Figure 1 shows the gap between standard rate material (in orange) and lower rate material (in teal) has narrowed in the last 5 years. The widening gap between the lower and higher tax rates has also increased concerns about whether this is driving waste misclassification and crime. It is hard to determine a clear trend related to the landfilling of lower rate material in the years since 2020.

Figure 1: Tonnes of taxable waste declared by quarter in Scotland (source: Revenue Scotland)
The upcoming ban on landfilling biodegradable municipal waste, effective from the end of 2025, is expected to accelerate this trend (Scottish Government, 2022). It is therefore timely to focus in on lower rate materials to assess if SLfT is still serving its purpose. The Scottish Government has committed to explore whether changes may be needed to this or related policy levers, to support progress towards a low-carbon, circular economy (Scottish Government, 2024a).
The SLfT intended to support Scotland’s environmental objectives, which include
- Reducing the volume of waste sent to landfill.
- Lowering GHG emissions.
- Minimising pollution risks in landfill environments.
- Promoting the application of the waste hierarchy.
Scotland’s waste and resources policies have evolved since the landfill tax was introduced. They are now strongly oriented towards the objectives set out in the Circular Economy (Scotland) Act 2024 and the Circular Economy and Waste Route Map to 2030 (Scottish Government, 2024a). These provide a framework for increasing resource efficiency and reducing reliance on landfill. Specific information on these can be found in Appendix A.
The Route Map commits to developing a residual waste plan to 2045 and reviewing materials currently landfilled to identify alternative management routes by 2027. The SLfT legislation allows for additional lower rates to be created in support of future policy (Scottish Government, 2022).
Scotland’s net zero targets and biodiversity strategy were introduced in light of the twin climate and biodiversity crises. They have reinforced the need for waste and resources policies that support decarbonisation across all sectors. Most environmental impacts associated with resource use take place before materials are disposed of. A circular economy, with an emphasis on resource efficiency and waste prevention, is therefore essential for meeting Scotland’s environmental objectives. SLfT should be evaluated in this context, considering not only tonnages landfilled but the whole-life environmental impacts of materials.
Project objective, aims and research questions
The overarching objective of this research is to evaluate the effectiveness of the lower rate of SLfT in supporting Scotland’s environmental policy objectives. These policy objectives include reducing the volume of waste sent to landfill, lowering GHG emissions, minimising pollution risks, and encouraging materials to move up the waste hierarchy.
This research supports policy development by assessing whether the lower rate of SLfT remains effective in advancing Scotland’s environmental objectives. It also examines whether adjustments to the tax or related policy levers could accelerate progress towards these objectives. Specifically, this study aims to:
- evaluate the effectiveness of the lower rate in supporting Scotland’s environmental goals;
- identify the lower-rate materials that have the greatest environmental impact;
- explore waste prevention and diversion options for lower-rate materials and their feasibility;
- assess key barriers to reducing reliance on lower-rate landfill disposal;
- examine how the SLfT interacts with other fiscal and non-fiscal waste and environmental management policies and identify areas for future research and policy interventions.
To achieve these aims, the following research questions are addressed:
- Which materials landfilled at the lower rate rank the highest in terms of quantity and negative environmental impacts?
- What diversion options and alternative treatments exist for these materials, and how feasible are they in light of technical, market, and policy barriers?
- What are the key barriers to reducing the volume of materials landfilled at the lower rate, and how can they be addressed?
- How does the SLfT intersect with other fiscal and non-fiscal waste management and environmental policies, and what options exist to strengthen policy?
This report provides an initial evidence base for discussions on potential changes to the lower rate of SLfT. It does not present a cost-benefit analysis of policy options. It highlights the highest-impact materials and presents opportunities to divert from landfill, noting key barriers.
These findings aim to contribute to ongoing policy discussions and future research,
in support of Scotland’s transition to a low-carbon, circular economy.
Methodology
This study was conducted from December 2024 to March 2025 by Resource Futures and Aether, in collaboration with a steering group comprising the ClimateXChange research lead and representatives of the Scottish Government, SEPA and Revenue Scotland. It followed a three-stage approach (see Figure 2).
We designed the methodology to provide an initial evidence base to progress policy development. Robust data analysis was used to identify key materials and focus future research. Key materials were determined based on impact.

Figure 2: Research approach
We used quantitative and qualitative data analysis, a literature review, and stakeholder engagement to support this approach. Table 1 below summarises each research stage and corresponding data collection methods. These are further detailed in Appendices B and C.
Table 1: Data collection methods by research stage
|
Data collection methods |
Research stage | ||
|---|---|---|---|
|
Prioritisation of materials |
Review of diversion and prevention options |
Policy assessment | |
|
Weight-based EWC code analysis |
X | ||
|
Environmental impacts analysis |
X | ||
|
Desk-based research |
X |
X | |
|
Stakeholder engagement |
X |
X |
X |
In the first stage, we assessed tonnage and environmental impacts data on materials landfilled at the lower rate. This enabled us to prioritise the top three material streams.
We analysed tonnage data by EWC code, or groups of codes where necessary. This relied on data obtained from SEPA and Revenue Scotland. To assess environmental impacts, we used the Scottish Waste Environmental Footprint Tool (SWEFT). This covers a range of environmental indicators, including GHG emissions, resource depletion, and pollution potential (Zero Waste Scotland, 2024). We refined our understanding of the top material streams, through engagement with waste management operators, industry experts, policymakers, and the project steering group.
In the second stage, we examined opportunities to move lower-rate materials up the waste hierarchy. A high-level literature review identified prevention, reuse, recycling, and recovery options, assessing their technical feasibility. Stakeholder interviews provided further insights into potential diversion options and barriers to these.
In the final stage, we reviewed how the lower rate of SLfT interacts with related policies. We used desk-based research to review other relevant measures and draw comparisons with landfill taxation in other jurisdictions. Engagement with policymakers and regulators provided insights into how the tax operates in practice. We identified areas where further research is needed to address gaps or unintended consequences.
For the stakeholder engagement, we conducted eight in-depth, semi-structured interviews, and gathered additional insights via email, in January to March 2025. Further details of the methodology, including the stakeholder engagement, can be found in Appendix C.
Quantitative data review to determine priority materials
This section sets out how we identified the three highest-impact material streams taxed at the lower rate, which are assessed in more detail in Sections 5 and 6.
We first give a summary of the process for preparing and classifying waste for landfill in Scotland (Section 4.1). We then present findings by weight based on Revenue Scotland and SEPA data (Section 4.3) then on the weighted environmental impact of materials (Section 4.4). This forms the basis for prioritising lower-rate materials summarised in Section 4.5.
Introduction to classifying and preparing waste for landfill in Scotland
For waste to be landfilled in Scotland, waste producing businesses must follow a structured process to ensure compliance with environmental regulations. This process involves multiple parties, including waste producers, skip operators, transfer station operators, landfill operators, and regulators such as SEPA and Revenue Scotland.
Key steps in preparing waste for landfill include:
- Waste identification – determining the type of waste based on its source, composition, and potential hazards.
- Waste characterisation – including chemical analysis and testing (where required) to assess hazardous properties and biodegradability.
- Waste classification – the waste is assigned a European Waste Catalogue (EWC) code by the waste producer. EWC codes must be included on waste transfer notes (for non-hazardous waste) and hazardous waste consignment notes. These documents accompany waste during its movement and disposal and are checked by waste carriers, site operators, and regulators.
- Pre-treatment and landfill acceptance requirements – including necessary treatment to reduce environmental impact, compliance with landfill permit conditions, and landfill waste acceptance criteria (WAC) testing, where required.
- Documentation and record-keeping – maintenance of records, results and transfer documentation to ensure legal compliance.
Two key documents to support businesses in meeting these obligations are:
- Waste Classification Technical Guidance (WM3) (SEPA et al, 2015): The guidance, co-produced by SEPA, Natural Resources Wales, Northern Ireland Environment Agency, and Environment Agency, provides comprehensive instructions on identifying whether waste possesses hazardous properties.
- Criteria and Procedures for the Acceptance of Waste at Landfills (Scotland) Direction 2005 (Scottish Government, 2012a): The document gives criteria and procedures for waste acceptance at landfills, ensuring compliance with environmental standards. WAC are described in the accompanying ‘Schedule’ to this Direction.
SEPA holds responsibility for governance of compliance and therefore holds national level data on the transfer and treatment of waste into, within, and out of landfills in Scotland. As regulator of the SLfT, Revenue Scotland holds parallel data obtained through tax returns. The anonymised data from Revenue Scotland, alongside SEPA’s, underpins the analysis presented in the following section.
While many elements of the landfill preparation process are legal requirements, some practices – such as separating certain materials for recovery – are strongly encouraged by regulators or industry bodies due to viable diversion routes or market demand. These distinctions are important context for the findings presented later in this report.
Overview of waste data analysis
This section presents a summary of analysis performed on waste tonnages data provided by SEPA, and SLfT returns data from Revenue Scotland which was anonymised for the purposes of this study. The data provided by SEPA and Revenue Scotland are categorised by EWC code (European Commission, 2000). These data insights can be used to help progress policy development.
EWC codes are a list of waste descriptions used in all UK nations and EU member states. However, as explained in detail in Section 5.3, EWC codes do not directly correlate to SLfT rates. EWC codes must be used on waste transfer notes and hazardous waste consignment notes. The submission of waste transfer notes also comes with ‘operator descriptions’ to further explain the EWC code categorisation. There are around 650 individual codes split across 20 ‘chapters’. The chapter typically defines the industry or source of waste; however, some definitions are more material- or process-based. Despite the large library of codes, some remain broad in scope. This means that use of the EWC codes within a dataset does not automatically achieve transparency or traceability in terms of material definitions.
For this report, descriptors have been adopted for each EWC code, or group of codes, present within the lower-rate tonnages data provided by Revenue Scotland. These are outlined in Table below.
Table 2: EWC codes within the lower tax rate in Scotland
|
EWC code/ group of codes[1] |
Descriptor |
|
19 12 12 |
Mechanically-treated fines |
|
17 05 04 |
Soil and stones from C&D waste |
|
19 12 09 |
Mechanically-treated mineral fines |
|
19 03 05, 19 05 99, 19 12 05, 19 13 06, 20 01 02, 20 01 99, 20 03 01, 20 03 03, 20 03 99[2] |
Mixed household waste and outputs of waste treatment |
|
19 01 12 |
Incinerator bottom ash and slag |
|
19 01 02, 19 01 11, 19 01 14, 19 01 16, 19 02 09, 19 02 99 |
Niche materials from incineration, pyrolysis or chemical waste treatment |
|
17 01 07 |
Mixed minerals (concrete, bricks, tiles, ceramics) from C&D waste |
|
01 04 08, 01 04 09, 01 04 10, 01 05 07, 02 01 03 |
Niche materials mainly from mining and quarrying |
|
17 01 02, 17 01 03, 17 02 02, 17 05 06, 17 06 04, 17 09 04 |
Niche materials from C&D waste |
|
06 01 99, 07 01 12, 07 07 12, 10 01 01, 10 01 17, 10 02 01, 10 03 05, 10 11 03 |
Niche materials from chemical and thermal processes |
|
20 02 02 |
Soil and stones from municipal waste (gardens, parks, recreation) |
|
12 01 07, 12 01 17, 15 01 07, 16 01 20, 16 03 04, 16 11 02 |
Mixed niche materials, including from end-of-life vehicles |
|
17 01 01 |
Concrete |
We ranked the data from Revenue Scotland on lower-rate waste to landfill by weight. Data from SEPA for each matching EWC code, or group of codes, was then used to identify the amount of each material landfilled at lower rate as a proportion of the total landfilled. This allowed for prioritisation based on overall tonnage of lower rate material. Further information on steps for data cleansing and review is provided in Appendix B.
Results show the largest quantities landfilled in Scotland by material (at both lower and standard rate), in the financial year 2023 to 2024, were soil and stones, mechanically-treated fines and mechanically-treated mineral fines.
It is important to note that the data presented does not account for exemptions, meaning the reported tonnages are likely an underestimate of the actual quantities of waste generated. Exemptions are highlighted later in the report throughout Sections 6 and 7.
Figure 3 below highlights how the ranking changes when considering only materials landfilled at lower rate (in teal) with results for standard rate material also shown (in orange). The top three materials by weight are:
- 19 12 12: Mechanically-treated fines (fine particles left over from mechanical waste processing)
- 17 05 04: Soil and stones (non-hazardous soils and stones from C&D waste)
- 19 12 09: Mechanically-treated mineral fines (fine particles of minerals, e.g. sand and stones, left over from mechanical waste processing)
- These three materials make up 77% of the material landfilled at lower rate in 2023-24. The analysis shows that most mechanically-treated fines and mechanically-treated mineral fines are landfilled at the lower rate. In comparison, only a small portion of soil and stones is landfilled at the lower rate.

Figure 3: Tonnage of waste to landfill at standard and lower tax rates by EWC code, 2023-2024.
Analysis of waste quantities and composition data
We identified short-term trends for each material. We also reviewed operator descriptions in the SEPA data to better understand the materials and their origins. Summaries are presented for the three material groups landfilled in the greatest quantities at the lower rate of tax. These are presented in order with the highest tonnage first.
Mechanically-treated fines: EWC 19 12 12
This non-hazardous material group contains fine particle rejects from mechanical waste processing, including sorting, crushing, pelletising and compacting, as well as a minority share of anaerobic digestion residue. A more detailed description is provided in Section 5.1.
Approximately 60% of mechanically-treated fines were landfilled at the lower rate of tax in 2023-24. As shown through SEPA and Revenue Scotland data in Figure 4 below, the overall quantity landfilled has decreased over the most recent three-year period. However, the quantity landfilled at lower rate (in teal) has increased, while the quantity landfilled at standard rate (in orange) has decreased.
For context, the quantity landfilled under the lower rate was consistently under 200,000 tonnes before 2020. This increased sharply to a peak in 2022-23, before declining slightly again in 2023-24, but remaining well over pre-2020 levels.

Figure 4: Tonnage of waste to landfill at standard and lower tax rates for the three priority materials from 2021 to 2024.
Soils and stones from construction waste: EWC 17 05 04
The soils and stones EWC code group is for non-hazardous materials and results from construction and demolition waste. It is restricted to topsoil, peat, subsoil and stones only. Therefore, soil waste classification testing must take place to determine if soils are non-hazardous or inert (qualifying for the lower rate), or hazardous (standard rate). More information is provided in Section 5.2.
Approximately 21% of soils and stones was landfilled at the lower rate in 2023-24. Figure 4 shows that both the total quantity landfilled (ie the combined teal and orange bars), and the quantity landfilled at lower rate (in teal), have decreased from a 2021-22 peak. As a result, the portion of this waste group landfilled at the lower rate has remained stable over the most recent three years.
Based on the operator descriptions submitted with the waste transfer notes, this EWC material group contained just over 12,000 tonnes (2.2%) of ‘contaminated’ soil in 2023-24. It should be noted that contaminated is not equivalent to ‘hazardous’. Descriptions of this EWC code attached to records of larger waste quantities simply state “contaminated soil” with no further specificity. Descriptions accompanying some of the smaller quantities of lower-rate waste have mention of contamination by Japanese knotweed.
In addition, around 10,000 tonnes (1.8%) was recorded as having traces of asbestos in 2023-24, almost entirely from one waste record. This was much higher than any records mentioning traces of asbestos for previous years.
These findings highlight uncertainty around the application of WAC testing to this code. Soil and stones containing hazardous substances may potentially have been misclassified under the non-hazardous code 17 05 04, instead of its hazardous counterpart, 17 05 03. From stakeholder interviews, it is understood that misclassification is likely to contribute to the large quantity of soil and stones being disposed of under this material group.
Mechanically-treated mineral fines: EWC 19 12 09
This material group is classified as fines from naturally occurring rocks and soils, silt, clay, sand and stones. It is non-hazardous. A more detailed description is available in Section 5.1.
76% of this material group was landfilled at the lower rate of tax in 2023-24, which was similar to the portion in 2022-23. Looking further back, the quantity landfilled at lower rate peaked at just over 120,000 tonnes in 2019-20, before a significant decline in the following two COVID years. Quantities landfilled at the lower rate have bounced back slightly but not to pre-COVID levels.
As shown in Figure 4 above, this material group is landfilled in proportionally greater quantities under the lower rate (in teal) than the standard rate (in orange).
Baseline environmental impact of materials
We used Zero Waste Scotland’s SWEFT data to provide a high-level assessment of how the materials landfilled at lower rate may impact the environment. This enabled us to check whether any lower-tonnage material groups warranted further attention due to their disproportionately higher environmental impacts.
The tonnages for 2023-24 were multiplied by lifecycle-based SWEFT factors. Lifecycle-based SWEFT factors consider the entire environmental impact of a material, from extraction to disposal, which helps assess its true ecological footprint. This produced a weighted impact for each material group against each of SWEFT’s six environmental indicators. Further information on methods and assumptions in application of SWEFT is provided in Appendix B.
Because SWEFT factors covers a range of environmental impacts, they cannot be aggregated into a single, comparable “score”. To visualise and compare relative impacts, we used a spider diagram (see Figure 5), which presents the results for the top six material groups landfilled at lower rate in Scotland during 2023-4.
Figure 5 below shows that the top three material groups by tonnage also have the greatest environmental impacts. These materials – mechanically-treated fines, soil and stones, and mechanically-treated mineral fines – are shown in the colours teal, dark orange and black respectively .
Mechanically-treated fines are estimated to have the largest weighted impacts on air pollution, mineral resource scarcity, water consumption and land use. Soil and stones, and mechanically-treated mineral fines, have the next-highest impacts for the same indicators.
One mixed material group (shown in light orange) scores highest on GHG emissions and biodiversity. However, this group, was found to be almost entirely made up of drill cuttings in 2023/24 based on operator descriptions within the SEPA data. As a result, we chose to describe this as a niche material (see Table 2). This results in a high environmental impact but with high uncertainty.
No other material groups were flagged as priorities for further research based on this high-level analysis of environmental impacts. As such, the three lower-rate material groups landfilled in highest quantities were prioritised for further research.

Figure 5: SWEFT tool results presented by material and relative environmental impact (only top six scoring material groups are shown)
Priority materials and supporting interview data
From the analysis of tonnage landfilled and environmental impact assessment, three material groups were prioritised: soils and stones, mechanically-treated fines, and mechanically-treated mineral fines. These materials accounted for 77% of lower-rate landfilled waste in 2023-24 and had some of the highest environmental impacts, particularly on air pollution, resource scarcity, and land use.
Grouped codes of niche materials were excluded due to data limitations: (i) they consist of multiple waste types with varying, and unknown, compositions and quantities, and (ii) the lack of specificity meant the assessment of environmental indicators relied more on generalised assumptions.
Focusing on the three dominant materials enabled targeted research into impactful interventions to reduce landfill and improve resource recovery. This selection was also verified through analysis of interviewee responses. For example:
- Mechanically treated fines, mechanically-treated mineral fines and soils and stones were confirmed as the main materials: “They are the majority of materials in the lower rate.” (Commercial remediation company interview); “A lot of the lower rate material will essentially be fines.” (C&D waste management processor)
- Most high-quality materials are already reused in construction: “The only reason construction companies take things off sites now is because they can’t use it.” (C&D skip operator)
- Mechanically-treated fines come from transfer stations and skip waste: “Mechanical fines come from transfer stations and sorting of skips waste. Skip operators generate the majority of the fines in the Scottish market.” (Commercial remediation company)
- Mechanical-treated fines create challenges for waste management: “Mechanically-treated fines are the top waste we question whether the rate is right.” (SEPA interview) and “we tend to stay away from mechanically-treated fines, because the administration and risk of misclassification sits with us.” (Commercial landfill operator)
Complexities in the categorisation of priority materials
Determining when a material qualifies for the lower rate is not straightforward. This is due to the complex properties of the lower-rate materials, the sources of these materials and the different classification systems used in policy. To aid in understanding, this section outlines what the three priority material streams comprise, the sources of these materials and their link to categorisations in Scottish policy.
Mechanical fines: EWC 19 12 12 and 19 12 09
Two of the priority materials, mechanically-treated fines and mechanically-treated mineral fines, belong to the same EWC chapter 19 12. This chapter refers to waste from the mechanical treatment of waste, for example sorting, crushing, compacting or pelletising (Dsposal, n.d.). These are commonly referred to as trommel fines, or mechanical fines (typically 10-40mm).
Fines that qualify for the lower rate under both waste codes largely come from construction and demolition (C&D) waste and, therefore, share similar diversion options and barriers which are discussed in Section 6. The term ‘mechanical fines’ is used hereafter as shorthand when these two categories of fines are discussed together.
The key distinction between the codes is their composition:
- Mechanically treated mineral fines (EWC 19 12 09): Primarily from excavation and mechanical treatment of quarry waste, C&D waste, and aggregate recycling (WRAP and Environment Agency, 2013). Composition is relatively uniform.
- Mechanically treated fines (EWC 19 12 12): Includes fines from mixed C&D waste, municipal recyclate, and residual waste. Fines qualifying for the lower rate are primarily from mixed C&D waste due to higher inert content (Di Maria et al., 2013; Vincent et al., 2022). Composition is far more varied.
The interview findings and other data suggest that mechanical fines – whether classified under EWC 19 12 09 or 19 12 12 – are commonly produced at transfer stations and through the mechanical sorting of skip waste, particularly when handling C&D material. Composition is mostly crushed bricks, tiles, concrete, and ceramics – similar to mineral fines (the same as mechanically-treated mineral fines). However, the code can also include additional inert materials, including fines from the mechanical treatment to recycle furnace slags, bottom ash, and plasterboard to recover gypsum[3] (Environment Agency, 2023a; Environment Agency, 2023b).
To summarise, both types of mechanical fines may contain a small amount of contamination and non-qualifying material, but can still be eligible for the lower rate if they meet the conditions set out in Article 4 of the 2016 Order. To qualify, fines must either consist entirely of qualifying material or contain only a minimal amount of non-qualifying material, must not be artificially mixed or hazardous under WM3, and must pass the Loss on Ignition (LOI) test with a result of 10% or less (Revenue Scotland, n.d.). Otherwise, they are subject to the standard rate.
Some waste producers intentionally misclassify mechanical fines to avoid the higher rate of tax, using blending techniques to bring LOI values down (Ali, 2023; SEPA, C&D waste management processor interview, commercial landfill operator interview). Many small- to medium-sized skip operators handle this waste, making enforcement difficult (waste industry association and commercial remediation company interview).
Soils and stones from construction waste: EWC 17 05 04
The EWC code 17 05 04 refers to non-hazardous soils and stones from C&D waste (including excavated material from contaminated sites) (Dsposal, n.d.; Environmental Standards Scotland, 2024; Katsumi, 2015; Commercial remediation company interview; C&D waste management processor interview). In Scotland, this material becomes waste after removal from a site. It can be used for work on site without being classified as waste.
Soils and stones require multiple tests. They must be classified as hazardous or non-hazardous following the WM3 classification. When subjected to testing it is likely for other materials to be found, which could make the soil active (non-inert), such as grass. Unless the contaminating materials are in small amounts and pass the soil LOI test, the whole load will be charged the standard rate. Non-hazardous soil and stone can only be disposed of in inert landfill sites and charged the lower rate if a WAC test confirms this is appropriate. A WAC test will determine the leaching ability of any contaminants in the soil.
Misalignment in waste code and policy guidance
This section compares EWC code definitions (Dsposal, n.d.), Revenue Scotland guidance (Revenue Scotland, n.d.), and SEPA guidance (SEPA, 2015) for the three priority materials.
The Scottish Landfill Tax (Qualifying Material) Order 2016 determines which materials qualify for the lower tax rate. There are seven groups of materials which qualify for the lower rate. However, these seven qualifying material groups and EWC codes do not align. This allows material to be classed as standard or lower rate under a single EWC code, as seen in the analysis of waste quantities (Section 4.3). Such misalignment is common in other jurisdictions in the UK and beyond with the widespread use of EWC codes and varying landfill policies.
Table 3 below presents a systematic review of the EWC codes for the priority three materials against other categorisations in Scottish policy. This provides a more specific, detailed understanding of these material streams.
Soils and stones (EWC 17 05 04) are the most straightforward to categorise, aligning clearly with Group 1 (Rocks and soils) and with no additional SEPA definitions or overlaps.
In contrast, mechanically treated fines (EWC 19 12 12) are the most complex to classify. As discussed in Section 5.1, this code can encompass materials across all seven qualifying groups, depending on source and composition, making consistent classification more challenging and reliant on testing and operator descriptions.
Table : Alignment of priority EWC codes with SLfT and SEPA definitions
|
Priority material |
Mechanically treated mineral fines |
Mechanically treated fines |
Soil and stones |
|
EWC code |
EWC 19 12 09 |
EWC 19 12 12 |
EWC 17 05 04 |
|
EWC chapter |
EWC 19 12: the mechanical treatment of waste, for example sorting, crushing, compacting or pelletising (Dsposal, n.d). |
EWC 19 12: the mechanical treatment of waste, for example sorting, crushing, compacting or pelletising (Dsposal, n.d). |
EWC 17 05: soil (including excavated soil from contaminated sites), stones and dredging spoil. |
|
The Scottish Landfill Tax (Qualifying Material) Order 2016 groups |
Group 1: Rocks and soils. Group 3: Minerals. |
Group 1: Rocks and soils. Group 2: Ceramic and concrete materials. Group 3: Minerals. Group 4: Fines from the mechanical treatment to recycle furnace slags. Group 5: Fines from the mechanical treatment to recycle bottom ash. Group 6: Low activity inorganic compounds. Group 7: Fines from the mechanical treatment of plasterboard to recover gypsum. |
Group 1: Rocks and soils. |
|
SEPA definitions (SEPA, 2015) |
Fines from processing naturally occurring rocks and soils (e.g. group 1). Fines from processing wholly inert bricks, tiles and concrete (e.g. group 3). |
Fines from processing municipal recyclate or residual waste. Fines from the processing of mixed C&D waste. |
No further definitions given. |
Waste prevention and landfill diversion options
In this section, we outline findings on the end-of-pipe and upstream diversion options for the three priority materials described in Section 5: mechanically-treated fines, mechanically-treated mineral fines, and soils and stones. A preliminary feasibility assessment of these technologies is also presented.
‘End-of-pipe’ diversion options involve reprocessing materials that have already been classified as waste, to divert them from landfill. ‘Upstream’ diversion options entail keeping materials at their highest value and reducing waste generation. For mechanical fines, this means preventing C&D waste from being mechanically treated (for example, keeping bricks as bricks). For soil and stones, it involves direct reuse.
We use the term ‘mechanical fines’ where the diversion options relate to both mechanically-treated fines and mechanically-treated mineral fines.
Mechanical fines: End-of-pipe diversion
This section outlines the diversion options and associated barriers for mechanical fines.
As some common challenges were identified, Section 6.1.1 first identifies overarching barriers relevant to all the diversion options. These barriers provide essential context for Sections 6.1.2 to 6.1.5.
Overarching barriers
Due to their complex and variable composition and technical processing requirements, mechanical fines are difficult, risky and costly to recover. According to a waste management company representative interviewed, currently only large- and medium-sized regional players are able to recover a proportion of mechanically-treated fines.
- Material complexity (technical barrier): Mechanical fines contain mixed materials, sometimes requiring washing to remove contaminants (Burdier et al., 2022). Differing physical and chemical properties, including composition and size, affect the feasibility of end-of-pipe recovery (Hernandez Garcia et al., 2024). This is further impacted by Scotland’s wet climate, which reduces the effectiveness of dry screening technologies (as highlighted in research conducted by Ricardo for ClimateXChange, due to be published in summer 2025). Composition testing to match materials to diversion options is expensive. Virgin materials are often easier and cheaper to use.
- Contamination (health and safety barrier): Heavy metals in some mechanical fines pose health and safety risks, limiting recovery (Oujana & Sanchez, 2018). Washing removes some contaminants (Vincent et al., 2022), but can create toxic wastewater and solid waste requiring further treatment (Cottrell, Ali and Etienne, 2024). The circularity benefits should be weighed against the resources and power needed to wash and process fines.
- Processing infrastructure (operational barrier): Washing plants remove silt and clay to produce clean aggregate. However, washing systems are expensive and often require bespoke designs so they do not clog processing systems, reducing efficiency (Vincent et al., 2022; C&D waste management processor interview). Stakeholders cite uncertain policies and tax implications as barriers to investment (C&D waste management processor, C&D skip operator and SEPA interviews).
- LOI testing (health and safety and regulatory barrier): LOI determines whether fines qualify for the lower rate tax or if they can be reused (interviews with C&D waste management processor and Commercial landfill operatorSUEZ). One interviewee reported that use of LOI tests to achieve end-of-waste status for mechanical fines was not permitted by SEPA due to its uncertain composition:
“We tried for a couple of years to get end-of-waste status on this material because some of the material, it does look really good and it would serve a purpose in further aspects of construction. But they’re very adamant that it’s a big no, because of the testing and because this material doesn’t come from a single source. You can’t test it as a single source, so it’s a bit of an unknown.” (C&D waste management)
- Liability (enforcement barrier): The current liability structure is a barrier to diversion, as it places the risk of misclassification on landfill operators rather than waste producers. This reduces producers’ incentive to ensure accurate classification or pursue upstream diversion. With no direct repercussions, producers can intentionally or unintentionally misclassify mechanical fines as lower-rate material (see Section 5.3).
The following sections detail end-of-pipe diversion options for mechanical fines, noting more specific barriers to mechanically-treated mineral and mechanically-treated fines where relevant.
Landfill/quarry cover, engineering and restoration
Inert mechanical fines are used for engineering and landscaping, such as quarries and pavement base layers, or for daily landfill cover. There is demand in Scotland for such uses, particularly due to a shortage of soils and stones (commercial landfill operator interview). While this can support diversion from landfill, it can waste nutrient-rich fines that might be better suited for agricultural use (Renella, 2021).
Recycled aggregate
Mechanically-treated mineral fines can be stored on site for six months and reused as aggregate without a waste licence under the Waste Management Licensing (Scotland) Regulations 2011 (schedule 1, paragraph 19). Mechanically-treated fines do not qualify for this exemption, however, and SEPA does not include them as waste suitable for the manufacture of recycled aggregate (SEPA, 2013).
Recycled aggregates (from crushed bricks, ceramics, and concrete) are used in roads, railways, and non-structural concrete production. Their carbon footprint can be lower than virgin aggregates when transport distances are short (ClimateXChange and Ricardo, 2025).
Reducing the environmental impact of concrete through recovery of inert fines has received a lot of research interest. For example, in 2023, 934 publications about reuse of clay waste (e.g. brick powder) in cement mixtures were published (Hernández García, Monteiro and Lopera, 2024). Studies suggest the material could replace 10-20% of virgin sand in non-structural concrete (Mansoor, Hama, Hamdullah, 2024; Ali, 2023; Zhao, et al., 2020). Despite the diversion potential for fines, innovations have not been scaled up commercially as virgin aggregates are favoured (European Commission, 2023).
Barriers:
- Recycled aggregates have different properties to natural aggregates and suit only low to moderate strength concrete (European Commission, 2023; Ali, 2023; Transport Scotland et al., 2020; commercial landfill operator interview; Ferriz-Papi and Thomas, 2020).
- Fine material can be inappropriate for some filling activities. For example, fines can be too smooth for use in layers for road-based applications (Burdier et al., 2022). It could be beneficial to consider other diversion options that suit these physical properties, such as reuse in paint to improve grip, rather than invest in technologies to change them.
- Quality and supply of fines are inconsistent (European Commission, 2023).
- Despite a high concentration of wash plants in Scotland (C&D waste management processor interview), mechanical fines require further space and infrastructure investment to be diverted to precast or ready-mixed concrete plants (European Commission, 2023).
- Wet fines from wash plants require more cement in concrete mixtures, increasing resource use and cost (commercial remediation company interview). Raw material and energy savings from using recycled aggregate need to be balanced against these impacts.
- The lack of market uptake of recycled aggregates is likely due to a lack of know-how by concrete producers and trained personnel for recycled aggregates production (ClimateXChange and Ricardo, 2025; European Commission, 2023; Hernández García, Monteiro and Lopera, 2024).
Land treatment and agricultural soil improvement
Inert mechanical fines can improve land, for example, by stabilising soil through land remediation or as a fertiliser for agriculture (Manning and Vetterlein, 2004; Burlakov, et al., 2021; Ali, 2023). This could be a positive diversion option for mechanically-treated mineral fines that are less useful for construction purposes (Renella, 2021).
Mechanically-treated fines can help replenish nutrients to the soil and reduce reliance on commercial fertilisers (Braga et al., 2019; Szmidt and Ferguson, 2004; Campe, Kittrede and Klinger, 2012). By mixing these fines with organic materials, they can create a soil-like material for plants to grow in. Some fine particles, like clay, silt or ash, help keep the organic matter stable (Haynes, Zhou and Weng, 2021; Renella, 2021).
Mechanically-treated fines contain a mixture of these materials. However, the UK Government restricts the use of soil substitutes made from mechanically-treated fines as opposed to mechanically-treated mineral fines (Environment Agency, 2023b). This can only be done under specific permits, such as for landfill restoration schemes, and when ecological improvement is also demonstrable.
In Scotland, under the Waste Management Licensing (Scotland) Regulations 2011 (schedule 1, paragraph 9), exemptions allow the use of mechanically-treated mineral fines on land for agriculture and ecological improvement. Waste companies in Scotland sometimes use mineral fines from skips to create compost for local agriculture (C&D skip operator interview). SEPA, who registers such activities, has reported that this exemption often results in farmers being paid to accept such waste to reduce landfill disposal costs (SEPA interview). However, it is uncertain how much is used for genuine purposes, and how much is diverted to avoid paying tax (C&D waste management processor interview).
Barriers:
- Silt and clay fines, which are beneficial for soils, are generally landfilled and this is because of high contamination of heavy metals or presence of organic materials (Renella, 2021).
- Nutrient content varies, limiting predictability of composition and related cost savings for farmers. For example, recycled mechanical fines with high nutrient content can reduce costs by 25%, whereas those with low nutrient content may increase costs by 9% (Braga et al., 2019).
- Potential conflicts with regulation on fertilisers. For example, UK government restricts the use of soil substitutes made from mechanically-treated fines (Environment Agency, 2023b) and new EU regulations may exclude some fines from fertiliser use (Renella, 2021).
Gypsum fines recycling
Gypsum fines (within EWC 19 12 12) can be recovered from plasterboard and used to make new plasterboards, cement, blocks and bricks (commercial landfill operator interview; Suárez, Roca and Gasso, 2016). Gypsum can also be used to improve soil in land remediation, particularly in areas with alkalinity or heavy metal contamination. SEPA advises that this is acceptable for treating land that has been flooded by seawater (SEPA, n.d).
Waste owners are encouraged to separate gypsum from other waste for recovery, as there are feasible diversion options and “because there’s a good recycling market for gypsum” (waste industry association interview). However, according to a commercial landfill operator, the composition of mechanically-treated fines “tends to be quite high in plasterboard and gypsum, which then means that we struggle to control the gas and the odours”. Gypsum can only be disposed of in landfills where no biodegradable waste is accepted as it has hazardous properties, releasing gas and odour, when mixed with biodegradable waste (commercial landfill operator interview).
When the ban on biodegradable waste to landfill is introduced at the end of 2025, it will potentially make the lower-rate landfill of mechanically-treated waste containing gypsum easier. Additional incentives for diversion to counter this could be necessary.
Barriers:
- Recycled gypsum has high market demand, but the lower rate categorisation encourages landfill over recycling (waste industry association interview, commercial remediation company interview, commercial landfill operator interview).
- Heavy contamination of mechanical fines restricts the potential to find and extract gypsum (Suárez, Roca and Gasso, 2016).
- Lack of incentives to enhance sorting of gypsum and plasterboard; and conversely incentives to process waste products containing gypsum into mechanical fines to qualify for the lower-rate tax (commercial landfill operator interview).
Mechanical fines: Upstream diversion
This section describes the upstream diversion options involving the reduction and reuse of concrete, bricks, tiles and ceramics. These options can prevent mechanical fines from being generated in the first place.
Reducing demolition through refurbishing and retrofitting
Refurbishing or repurposing buildings and assets extends their usable life, avoiding the generation of demolition waste. In doing so, it helps reduce both material use and embodied carbon, making it a key strategy for sustainable construction.
Lifecycle analysis (LCA) is a valuable tool for comparing the impacts of refurbishing and retrofitting with demolition and new build. While new builds may achieve lower operational carbon, they usually require more materials and result in more embodied carbon emissions. In many cases, this means retrofit has lower emissions overall.
Adopting a retrofit-first approach can reduce unnecessary demolition, prioritising reuse unless structures are severely derelict or face irreparable structural issues (Green Alliance, 2023; construction company interview). To support this, pre-demolition assessments could be introduced earlier in the planning process, ensuring that any proposed demolition is justified in terms of carbon and material impacts (Green Alliance, 2023).
Barriers:
- VAT policy favours new builds (0%) over renovations (20%) (Green Alliance, 2023).
- Current policies focus on reducing operational emissions, such the Heat in Buildings Strategy to increase energy efficiency (Scottish Government, 2021a), rather than embodied carbon emissions (Green Alliance, 2022).
- Circular principles are underused in construction and infrastructure, such as rail infrastructure projects (O’Leary, Osmani and Goodier, 2024).
Reduction and reuse of construction materials
Reducing demand for materials in the design stage has the greatest impact on reducing the environmental impact of construction (Green Alliance, 2023). This is particularly important for cement, which is challenging to remove from a building for reuse. Reduction and reuse can be increased through circular construction tools and approaches, sometimes described as ‘modern methods of construction’. These can improve companies’ understanding of GHG emissions throughout their supply chains. Examples include modular buildings, digital tools such as material passports, offsite manufacturing, and sustainable material substitution (Green Alliance, 2023).
Barriers:
- Current circular building standards are voluntary, such as the UK Net Zero Carbon Building Standard, and the Scottish Government’s Net Zero Public Sector Buildings Standard (Scottish Government, 2021b; UK Net Zero Carbon Building Standards, n.d.). Construction design is determined by the client. With voluntary initiatives, cost factors are more likely to win over environmental factors (Construction company interview).
- There are no mandatory requirements for construction companies in Scotland to conduct an LCA or report scope 3 emissions (those in its upstream and downstream value chains, which typically include the majority of material-related impacts) (construction company interview; Green Alliance, 2022).
- Skills shortages and inconsistent standards, for instance for LCAs and product passports, limit the sector’s ability to apply circular practices (Hurst and O’Donovan, 2024; construction company interview).
- Certain industry practices lead to unnecessary waste. For example, to ensure they have enough supply, contractors will often order 5-10% surplus, which can be hard to reuse (construction company interview).
- Sustainable construction materials often cost more (construction company interview).
- Environmental benefits of modern methods of construction are not fully accounted for in public procurement and other financial investment opportunities (Green Alliance, 2023).
Designing for deconstruction
Designing buildings with future disassembly in mind allows more materials, especially bricks and tiles, to be reused instead of downcycled. Such direct reuse has a greater impact in reducing raw material use than recycling (Green Alliance, 2023). However, deconstruction should only be pursued if the building is not fit for repurposing (construction company interview).
Early sorting of demolition materials also improves recovery outcomes. Many mechanical fines are produced from mixed, unsorted demolition waste, which results in variable and lower-quality outputs. Sorting materials earlier produces cleaner, inert fines that are more straightforward to reuse (C&D waste management processor interview, SEPA interview).
A major barrier to recovery and recycling of mechanically-treated fines is their complexity and variability (Section 6.1.1). To minimise the challenges associated with this, upstream measures should support sorting at source, before waste reaches skips or waste transfer sites (C&D waste management processor interview, SEPA interview). Greater source separation would generate more inert-only fines, which are also easier to find uses for due to waste management exemptions.
Barriers:
- Mainstream current and historical construction practices do not design for deconstruction (Arup and Ellen McArthur Foundation, 2020).
- Investors are not incentivised to incorporate circularity principles in design, considering material recovery (Arup and Ellen McArthur Foundation, 2020).
- Demand for low-quality recycled aggregate (Section 6.1.2) takes the focus away from higher-quality recycling and reuse.
- Integrated C&D tools and requirements for identifying, classifying and certifying salvaged materials are lacking (construction company interview).
Soil and stones: End-of-pipe diversion
This section explores the end-of-pipe diversion options for soils and stones from construction waste (EWC 17 05 04). End-of-pipe diversion options are concerned with when the material is classified as waste, and is then reprocessed into another material. As there are many exemptions for soil and stones reuse, the main diversion options are upstream, occurring before waste classification. The main end-of-pipe diversion option is to produce recycled aggregates.
Recycled aggregates
Soils can be washed to separate sand, gravel, and stone from contaminants, especially on brownfield sites, and reused as aggregate in construction (Magnusson et al., 2015; Choi et al., 2018; waste industry association interview).
Barriers:
- Recycled aggregate is more expensive than virgin materials (Magnusson et al., 2015; commercial remediation company interview). Quarrying for natural aggregate is cheaper and more accessible (commercial remediation company and waste industry association interviews).
- Soil remediation technologies are not widely used in Scotland (C&D skip operator interview).
- Fluctuations in cost and quality lead to inconsistent demand, impacting the feasibility of supply. For example, a facility failed in 2016 due to lack of demand (commercial landfill operator interview). There is good supply in Scotland of recycled quarry materials, but demand is low (commercial remediation company interview).
- There is low industry understanding of how to use recycled aggregates. For example, road projects where the ground is damp tend to require natural aggregates; recycled aggregates are more applicable for farm tracks, because they meet requirements for tractors more easily than cars (C&D skip operator interview).
- There is a higher recycling and reuse rate for soils and aggregates on site; what is taken off site tends to be less usable (C&D skip operator interview).
Soil and stones: Upstream diversion options
This section covers how soils and stones can be kept on site or reused at another site under exemptions, avoiding classification as waste.
Landfill/quarry cover, engineering and restoration
Soils and stones are used for temporary or final landfill cover, haul roads within a site, and restoring quarry sites. In landfill restoration, layers of subsoil and topsoil must be added, to enable development of vegetation (SEPA, 2018).
In Scotland, exemptions from SLfT apply under the Waste Management Licensing (Scotland) Regulations 2011 (Schedule 1, paragraph 9). This relates to where soil and stones treat land for agricultural or ecological benefit. Soil and stones are not subject to the same per-hectare limits for infilling agricultural land as other waste types (Waste Management Licensing Regulations, Schedule 2, paragraph 2), making it easier to divert them in larger quantities.
Barriers:
- Fewer landfills are operational. The number has declined since 2005 (SEPA, 2023) and this is expected to reduce further after the ban on landfilling biodegradable municipal waste (interviews with commercial remediation company; waste industry association; large public body).
Landscaping and construction
On-site reuse of soils reduces transportation and storage issues, making it the most cost-effective option (commercial remediation company interview). Transfer to another work site requires a waste management licence or exemption. Exemptions apply where soils and stones are used to treat land, provided certain conditions are met (Waste Management Licensing (Scotland) Regulations 2011, Schedule 1, Paragraph 7).
SEPA has issued regulatory guidance to support the sustainable reuse of greenfield soils which are soils from undeveloped, uncontaminated land. The soil must be used for a specified purpose, identified before excavation begins, and transfer must be approved by SEPA. Purposes may include the operational land of railways or land which is woodland, park, garden, verge, landscaped area, sports or recreation ground, churchyard or cemetery.
Interviewees indicated that practices for coordinating soil reuse in Scotland vary between projects based on developers (commercial remediation company and engineering consultancy interview). Public sector contracts sometimes include reuse requirements, while private contracts typically show less incentive. Carbon considerations are an emerging driver for on-site reuse, where these materials are less ideal than virgin quarry materials but still meet requirements (engineering consultancy interview).
Barriers:
- The UK has over 700 soil types requiring thorough classification by type (topsoil/subsoil) and hazard level (hazardous/non-hazardous, active/inactive) prior to reuse (The Royal Society, 2020; Soil Association, 2021).
- Mismatches in soil type, availability, project timelines, and storage requirements often hinder reuse (Thompson, 2021; Choi et al., 2018; Hale et al., 2021; Marasini et al., 2012; SEPA, commercial remediation company and engineering consultancy interviews).
- Geography and pressure to keep heavy vehicle movements off community roads incentivises finding reuse options close to sites of origin, but timing can prevent this (engineering consultancy interview).
- In some cases, the SLfT can have less negative financial impact on a project than costs of storage, transport, or project delays, making reuse impractical (engineering consultancy interview).
- Reuse of soil and stones may be deprioritised compared to the sustainability of manufactured materials like concrete (Berryman et al., 2023) especially where time and budget constraints apply (commercial remediation company and engineering consultancy interviews).
- Reuse options for contaminated soils are limited. Untreated soil is costly to landfill, while treated soil is typically restricted to low-grade uses such as embankments (engineering consultancy interview).
- Liability concerns discourage topsoil reuse as developers and landowners remain responsible for future environmental impacts (Hale et al., 2021).
- Multiple compliance pathways such as exemptions, permits, and definition of waste protocols create confusion, increasing the risk of non-compliance, misclassification, and illegal disposal (commercial remediation company interview; Thompson, 2021).
- Despite Berryman’s et al. (2023) guidance aimed at harmonising best practice, industry uptake remains inconsistent. The absence of a unified legislative framework results in varied approaches across agriculture, land development, engineering, and land management sectors (Thompson, 2021).
Preliminary feasibility assessment of diversion options
This section presents an indicative assessment of the viability of different waste diversion options for the three priority materials: mechanically-treated fines (19 12 12), mechanically-treated mineral fines (19 12 09), and soils and stones (17 05 04). The assessment considers how feasible the diversion options currently are. This includes information on current use, research and development activity, and the barriers mentioned above in section 6.
The feasibility score therefore indicates the extent that future interventions are needed to target barriers and enable diversion. The feasibility scoring is as follows:
- 1 = Not currently feasible, would require significant intervention to upscale.
- 2 = Feasible to some extent, some barriers would need to be addressed.
- 3 = Most feasible, already happening widely in Scotland.
- n/a = not applicable, didn’t come up as a diversion option for the material in the research.
The methodology behind this assessment can be viewed in Appendix D.
Tables 4 and 5 below present the preliminary feasibility assessment of the end-of-pipe and upstream diversion options. For reference we also include a general impact rating of the technology based on the findings from desk-based research and stakeholder interviews. The impact rating reflects the overall environmental and circular economy benefits (e.g. quantities of materials diverted from landfill) that could be achieved if the option were implemented more widely, using a simple scale of ‘high’, ‘medium’ or ‘low’.
Key takeaways of the assessment are:
- Mechanically-treated fines have a limited number of feasible end-of-pipe solutions at present. Landfill cover and gypsum recycling are technically possible, but most other downstream options score low on feasibility and offer only low to medium impact. As a result, it is likely better to prioritise upstream interventions – such as deconstruction, modular construction, and refurbishment – for their higher impact potential, even though they are not yet widely adopted.
- Mechanically-treated mineral fines have more feasible end-of-pipe diversion options, including reuse in land restoration and aggregate recycling. These options are already in operation and could be scaled further considering the opportunity to provide ecological improvements so maximum value is retained.
- Soils and stones show the greatest feasibility overall, particularly for recycled aggregates and reuse in landscaping. While some remediation technologies are not yet fully developed, most of the downstream options are already in use.
- Gypsum and plasterboard recycling is moderately feasible and could play a larger role with better separation and recovery at source.
- Upstream interventions such as modular construction, deconstruction, and refurbishment, score high on impact across all materials where relevant, but face barriers related to investment, data, and planning. Technological readiness is improving – especially with AI-driven solutions for sorting and design – and deployment is likely to increase in the next 5–10 years with the right incentives and digital infrastructure.
Table : Preliminary feasibility assessment of end-of-pipe diversion options
|
Diversion options |
Potential impact (low, med, high) |
Mechanically-treated fines |
Mechanically-treated mineral fines |
Soils and stones |
|
Landfill/quarry cover, engineering and restoration |
Low |
3 |
3 |
3 |
|
Recycled aggregates |
Medium |
1 |
2 |
3 |
|
Land treatment and agricultural soil improvement |
Medium |
1 |
3 |
n/a |
|
Gypsum fines recycling |
Medium |
2 |
n/a |
n/a |
Table 5: Preliminary feasibility assessment of upstream diversion options
|
Diversion options |
Potential impact (low, med, high) |
Mechanically-treated fines |
Mechanically-treated mineral fines |
Soils and stones |
|
Remediation technologies (e.g. soil washing) |
Medium |
1 |
1 |
2 |
|
Landscaping and construction soil reuse |
High |
n/a |
n/a |
2 |
|
Modular construction and material reuse |
High |
1 |
1 |
n/a |
|
Deconstruction and material sorting |
High |
1 |
1 |
n/a |
|
Refurbish or retrofit before demolition |
High |
1 |
1 |
n/a |
Key (see the methodology above for more information)
|
Score |
Colour |
|
1: Not currently feasible | |
|
2: Feasible to some extent | |
|
3: Most feasible | |
|
n/a: Not a diversion option |
Policy assessment
This section provides an overview of existing policies influencing the management and diversion of the three priority materials. It also identifies policy gaps and presents potential interventions discussed in previous sections to enhance waste diversion, aligning with Scotland’s environmental objectives.
Overview of existing policies
Several key policies and fiscal mechanisms shape the management and disposal of the priority materials in Scotland. Some policies are devolved to the Scottish Government, while others are reserved, under UK Government control. These policies shape the incentives and barriers encountered by waste producers and processors in diverting materials from landfill.
Fiscal measures
Scottish Landfill Tax (SLfT), the focus of this study, is devolved legislation introduced in 2015 to reduce the environmental impacts of waste, encouraging waste reduction and adherence to the waste hierarchy in Scotland. While standard-rate SLfT has risen significantly to £126.15 per tonne in 2025-26, the lower rate (£4.05 per tonne in 2025-26) remains considerably lower, as is broadly the case in the rest of the UK. As discussed, this lower rate is applied to seven groups of qualifying materials (Section 5.3), typically inert or less polluting wastes such as some construction and demolition waste. The lower-rate aims to provide an economic incentive for their diversion from landfill while avoid imposing undue costs on sectors where alternative treatment options may be limited.
The Aggregates Levy (AGL) is a UK-wide tax applied to commercially exploited (virgin) crushed rock, sand, and gravel to encourage the use of recycled alternatives. A Scottish Aggregates Tax (SAT) is expected to replace the UK AGL from April 2026, offering an opportunity to explore ways to further incentivise the use of secondary aggregates (Scottish Government, 2024b).
The Climate Change Levy (CCL) and Carbon Price Floor (CPF) are UK-wide fiscal measures designed to reduce carbon emissions by taxing energy use and setting a minimum price for carbon from electricity generation (HM Revenue and Customs, 2024). While these policies primarily lead to emissions reductions (Döbbeling-Hildebrandt et al. 2024, p.2) they also indirectly affect waste management across the UK by incentivising energy efficiency and low-carbon industrial processes.
Other regulatory measures
The Waste (Scotland) Regulations 2012, which are devolved secondary legislation, require waste producers to prioritise prevention, reuse, and recycling over landfill disposal (Scottish Government, 2012b). Businesses must segregate recyclable materials to improve recycling rates (Zero Waste Scotland, 2023). While these regulations reinforce waste hierarchy principles, they do not specifically address lower-rate waste streams.
The upcoming ban on biodegradable municipal waste (BMW) to landfill, effective 31 December 2025, is a devolved Scottish Government policy aimed at reducing environmental impacts from organic waste. While this ban will primarily impact standard-rate waste (Scottish Government, 2022), it could have indirect consequences for certain lower-rate materials. Minerals, and soils and stones, traditionally used for landfill engineering purposes, may see temporarily higher demand for use in landfill closures, but a long-term decline in demand. Alternative diversion pathways would be needed for these to align with Scotland’s circular economy objectives. In addition, gypsum, which currently can only be landfilled at sites without bio-waste, is likely to become easier to landfill. There may also be an increase bio-based mechanically-treated fines from municipal waste streams. Increased enforcement of fines’ classification and incentives for recycling may therefore be required. However, the ban will not signal the complete end of bio-waste to landfill, as it includes certain exemptions.
Digital Waste Transfer Notes (WTNs), a UK-wide initiative, aims to improve traceability and enforcement by transitioning to an electronic system for recording waste movements (DEFRA, 2023). This system aims to reduce the misclassification of waste, including lower-rate materials like mechanically-treated fines, by providing greater transparency in the movement of waste. It is expected to “shine a light on transactions and actors” currently missing from the system, while enhancing compliance with landfill tax regulations (CIWM, 2023). The April 2025 roll-out has recently been postponed to April 2026.
These are the key fiscal and regulatory policies interacting with lower-rate materials. However, gaps remain in their effectiveness for supporting diversion options for the three categories of waste which make up the bulk of lower-rated waste in Scotland notably mechanically-treated fines, soils and stones, and mineral waste. Addressing these gaps could involve targeted interventions, as discussed in the following sections and Appendix A.
Policy gaps and potential interventions
Despite existing regulatory and fiscal policies, several policy gaps hinder the effective diversion of lower-rate materials from landfill, such as mechanically-treated fines, and soils and stones from construction. These gaps are categorised according to their relation to either end-of-pipe waste management or upstream prevention in the material life-cycle.
This section outlines potential interventions to address such gaps. These are not policy recommendations but options to consider. Further research, analysis and consultation would be required before deciding whether to take any, or all, forward.
End-of-pipe diversion
Compliance risks and landfill misclassification
A key enforcement challenge is misclassification of waste at landfill sites. The widening gap between standard- and lower-rate SLfT (now standing at above £100 per tonne in 2025-26) may have inadvertently created financial incentives for waste producers to classify waste as lower-rate whenever possible. Along with the complex classification criteria (see section 5.3), this may have led to both deliberate and unintentional misclassification, particularly for mechanically-treated fines.
Rather than being residual outputs of material recovery, large quantities of fines are purposefully produced to qualify for the lower rate (Section 6.1.1). This distorts waste tracking data and results in potentially recoverable material being landfilled.
Landfill operators hold tax liability for misclassification, even though they do not generate or pre-process the waste. This creates financial risks for operators, leading some to refuse lower-rate fines altogether.
Ambiguity in classification raises costs for both regulators and waste operators. Waste producers may unintentionally misclassify waste due to lack of clear, standardised guidance, leading to incorrect application of the lower tax rate (see Section 7.2.1.1). Although better guidance could reduce some misclassification, it is unlikely to fully resolve the issue. This is because the underlying rules that determine whether fines are subject to the lower or standard rate are themselves complex and difficult to apply consistently, particularly when mapped against EWC waste code classifications (see Section 5.3). Clearer guidance may help reduce ambiguity, though it may also be worth exploring whether simplification of the tax qualification rules could support more consistent classification.
A recent SEPA report on the BMW-to-landfill ban notes that sorting residues from processing municipal waste (including mechanically-treated fines) may be generated in greater volumes in order to bypass the ban (SEPA, 2024a). This risks undermining the intent of the bio-waste ban policy through reclassification rather than genuine diversion. This risk is supported by our findings about the production of mechanically-treated fines to qualify for the lower rate (Section 6.1.1).
Potential fiscal interventions:
- Explore the feasibility of a specific tax rate for mechanically-treated fines which is much closer to the standard rate, or reclassification under the standard rate. This could discourage excessive fines production while retaining the lower rate for less problematic inert materials. A careful balance would need to be struck to avoid unintended consequences, particularly for businesses reliant on landfill for inert waste management. Supportive measures, addressing upstream value chains, would likely be needed.
Potential non-fiscal interventions
- Technical: Review LOI testing requirements to ensure they do not deter investment in fines processing, while maintaining environmental safeguards (C&D waste management processor interview; waste industry association interview; C&D skip operator interview).
- Enforcement: Explore the potential for enhanced regulatory oversight through the upcoming digital waste transfer notes (WTNs) system to track and verify waste classification at source rather than at landfill. Through this, tax liability for misclassified mechanical fines could be shifted to the company which produced the fines, even if this is discovered after it has been accepted at landfill, along with penalties for misclassification.
- Other: Improve guidance on EWC code classification by providing clearer criteria to support consistent decisions on whether waste qualifies for the lower rate. This could include practical examples of lower-rate materials, decision trees, and alignment with the upcoming digital waste transfer note system. In the longer term, there may also be value in exploring whether simplifying the underlying rules on lower-rate material classification could further reduce classification ambiguity.
Separation and recovery of mechanically-treated fines
Inadequate pre-sorting of C&D waste leads to contamination and fines production. Once contaminated, fines are difficult to reprocess. Industry practices in Scotland and globally do not sufficiently prioritise separation at the source, meaning valuable materials are lost to landfill.
Potential fiscal interventions:
- Continue strengthening incentives to increase the demand for recycled fines. This is already starting with the planned introduction of the Scottish Aggregates Tax in April 2026 which will initially align with the UK Aggregates Levy. Over time, there may be scope for policy divergence in Scotland. Additional financial incentives – such as tax breaks or recycled content requirements – could drive up industry circularity, such as for reused material content, recycled material content and reusable materials (Green Alliance, 2023). However, interventions would have to avoid unintended consequences related to availability of recycled fines. This could be a particular issue in rural areas, which are further from recycling infrastructure (commercial remediation company interview).
Potential non-fiscal interventions:
- Technological: More support for technologies and infrastructure to reprocess fines and reduce contamination could help address issues with fines in washing facilities. Programmes like the Knowledge Transfer Partnership could play a role. Existing examples include phytoremediation, which uses plants and microorganisms to degrade pollutants and reduce heavy metals (Yadav et al., 2022).
- Technological: Technologies exist to make the shape of fines coarser and more suitable for construction purposes, though the outputs are currently more costly than natural aggregates (C&D skip operator interview). Further reuse routes could be explored, for example how to promote fine aggregates being added to paints for flooring to increase traction.
- Regulatory: Encourage early-stage waste management planning by integrating material audits into construction permitting. This includes site investigations, sampling and testing to support effective use of recycled aggregates.
- Other: Improve industry understanding of recycled fines through guidance and awareness campaigns, including how and when they can be reused (C&D skip operator interview).
Cross-border waste movement risks
SLfT operates within a broader UK framework, presenting cross-border waste movement compliance challenges. For instance, if Scotland increased its lower-rate SLfT while England maintained the current lower rate, waste exports may increase, undermining the tax’s effectiveness as well as Scottish tax revenues. Similarly, restricting mechanical fines’ eligibility for the lower rate in Scotland could lead to this waste stream being diverted to England instead of being recovered.
These risks are particularly relevant in light of recent and proposed changes across the UK. As mentioned, the Welsh Government increased its lower rate of Landfill Disposals Tax in 2024, and the UK Government is currently consulting on significant reforms to Landfill Tax in England and Northern Ireland, with the consultation due to conclude in July 2025 (HM Treasury and HMRC, 2025).
Introducing financial or enforcement-based interventions is challenging in a cross-border context. The Scottish Government has limited or no authority over waste processed or disposed of in other UK jurisdictions.
Potential fiscal interventions:
- Considering penalties for cross-border misclassification, similar to Wales’ Unauthorised Disposals Tax (150% of the standard rate) and the proposal in the UK government’s consultation (200% of the standard rate) which creates an additional financial deterrent for people seeking to dispose of waste illegally.
Potential non-fiscal interventions:
- Regulatory/enforcement: Enhancing regulatory and enforcement coordination between Scotland, England, and Wales to ensure greater policy consistency and prevent waste tourism.
Upstream diversion
Reducing reliance on landfill also requires preventing lower-rate materials from being generated as waste. However, this is constrained by limited incentives for circular practices, inconsistent reuse standards, weak producer responsibility measures and insufficient integration of circularity in planning and procurement.
Lack of incentives for designing in circularity
Soils, stones, and minerals removed from C&D sites are often generated, and classified as waste, without efforts to improve their quality or assess their reuse potential. This results in unnecessary landfill disposal, despite available prevention and recovery pathways. Lack of guidance on soil and stone classification, combined with inconsistent reuse standards, means that secondary materials markets remain underdeveloped.
Mechanically-treated fines are often the result of poor material selection at the design and procurement stages. If more construction materials and products were designed for disassembly, reuse, or easier sorting, rather than demolition, the production of fines could be significantly reduced. Currently, there is no strong economic driver for waste producers to prioritise clean, separable materials over mixed waste streams that result in fines.
Current planning regulations and public procurement rules do not sufficiently integrate circular economy principles. Without upfront material assessments, valuable materials are classified as waste and disposed of unnecessarily.
The UK and the devolved nations are moving toward more comprehensive extended producer responsibility (EPR) schemes for other materials. If an effective system is adopted for construction, this could encourage producers to adopt circular practices and reduce waste generation at the design stage. There have also been sub-national developments in London, where large planning applications for approval by the mayor now require whole lifecycle carbon assessments, carbon reduction plans, and circular economy statements. Before a redevelopment or demolition plan can be approved, an audit must be carried out to determine the reuse potential of materials in the existing building (Mayor of London, 2022).
Circular economy policies such as these are needed to transition the construction sector as a whole, changing value chains so that much less of the priority materials in this study are generated. The lower rate of SLfT could be iteratively increased in tandem with these interventions, as a supporting measure; if it were to be raised too rapidly without supporting upstream interventions, negative impacts on the construction sector and on illegal disposal would likely occur.
Potential fiscal interventions:
- Consider raising the overall lower rate of SLfT to provide a greater incentive for circular practices on construction sites. Even a relatively modest increase could help to justify the costs of storing and transporting materials such as soils and stones for reuse (engineering consultancy interview). Wales’ new lower rate (£6.30 per tonne) could serve as a benchmark. A rate of £6 per tonne was deemed viable by industry interviewees (commercial landfill operator and C&D waste management processor).
- Consider monitoring the development and impacts of the upcoming Scottish Aggregates Tax (SAT), which will replace the UK Aggregates Levy from April 2026. While the SAT will be limited to the commercial exploitation of aggregates as defined in the 2024 Act (Scottish Government, 2024b), its introduction provides a useful opportunity to review whether taxation influences the quantities of lower-rate aggregates sent to landfill. Insights from this review could help inform future considerations around the treatment of other virgin materials used in construction, within the context of devolved powers and existing legislative frameworks.
- Consider financial incentives for reuse in construction, such as tax relief for projects incorporating secondary materials (construction company interview).
- Ensure SLfT exemptions support the diversion of lower-rate materials from landfill. A review of existing and upcoming exemptions, for instance with the bio-waste to landfill ban, may help assess their effectiveness in facilitating prevention, reuse and recovery while maintaining environmental protections.
- Consider engaging with HM Revenue and Customs over VAT reform, such as extending zero-rate VAT to refurbishment and retrofit to reduce incentives for demolition and new build construction.
Non-fiscal interventions
- Policy: Consider the expansion of EPR to cover construction materials, shifting financial responsibility for waste management onto producers to encourage modular design and reuse.
- Policy: Consider mandatory, rather than voluntary, circularity requirements targeting construction project clients (construction company interview). Investigate opportunities to strengthen public procurement rules to prioritise secondary materials, reuse, spoil management and design for deconstruction. These requirements could support more systematic waste prevention at the planning stage and drive investment in circular practices (SEDA, 2024; O’Leary, Osmani and Goodier, 2024).
- Policy: Consider reforms to embed circularity in planning policy, such as requirements for pre-demolition assessments, material recovery assessments before deconstruction and resource management plans to include deconstruction design (Construction company interview; Green Alliance, 2023).
- Policy: Explore adoption of carbon reporting tools that account for lifecycle emissions, including embodied carbon and Scope 3 (SEDA, 2024). Distinct reuse and recycling reporting for high-impact materials like concrete may also help reduce downcycling (Green Alliance, 2023).
- Technological: Consider supporting the development of product passports or material databases for construction materials to improve transparency and enable reuse (construction company interview).
- Technological: Consider the future use of AI and matching platforms to optimise design and reuse coordination (Huang et al., 2022; Choi et al., 2018; construction company interview).
- Operational: Consider investigating early-stage site audits, sampling and testing to support on-site recovery and reuse of recycled aggregates (C&D skip operator and engineering consultancy interviews).
- Operational: Consider the potential for construction material hubs to store and redistribute soils and other surplus materials. However, barriers remain around ownership, quality control, certification and fraud risk (commercial remediation company and construction company interviews).
- Other: Consider aligning government strategies on housing and urban development with circular economy targets to create long-term demand for reused materials (Green Alliance, 2023).
- Other: Consider investing in training and awareness to support greater uptake of recycled aggregates and reused soils. Cultural shifts may be needed to encourage viewing soil and stones as valuable resources, rather than ‘dirt’ (Thompson, 2021; Berryman et al., 2023).
Addressing both end-of-pipe and upstream barriers will be essential for improving SLfT effectiveness and enhancing material recovery. As with other areas of circular economy policy, coordinated packages of measures working across material value chains, targeting incentives at multiple stakeholders, are likely to be needed. By considering these policy measures, Scotland could identify strategies to reduce landfill reliance, improve material efficiency, and accelerate its transition to a circular economy.
Conclusions
This section summarises the key findings of the research and assesses whether the lower-rate SLfT remains effective in supporting Scotland’s environmental and waste management objectives. It also considers the broader policy implications, including potential enforcement challenges, unintended consequences, and cross-border impacts.
Summary of key findings
The lower rate of SLfT was introduced to enable the cost-effective disposal of low-risk, inert waste while ensuring compliance with Scotland’s broader environmental policies. Overall landfill trends show a mild downward trend in landfilled lower-rate materials at least until early 2020 (Figure 1), suggesting the tax may have initially influenced disposal patterns. Tonnages of lower rate material to landfill have since fluctuated without a clear trend (Figure 1). This research identifies several factors that may influence the continued effectiveness of the lower rate:
- Lower-rate landfill disposal is dominated by three specific waste streams—mechanically-treated fines, soils and stones, and mechanically-treated mineral fines—which together accounted for 77% of all lower-rate waste landfilled in 2023-24.
- Mechanically-treated fines are landfilled in the greatest quantities out of all lower-rate materials, and have seen the greatest increase in quantities between 2021-2024 (with a slight dip in 2022-23). This is despite originally being intended as residual outputs from material recovery processes. This trend raises concerns over misclassification and evidence from our interviews of fines being produced on purpose.
- Environmental impact analysis highlights that mechanically-treated fines pose significant risks, contributing disproportionately to air pollution, resource depletion, and biodiversity loss compared to other lower-rate materials.
- Current SLfT structures, fiscal incentives, and policy measures are not effectively supporting higher-value diversion options for lower-rate materials. The relatively affordable lower tax rate continues to make landfill the most economically attractive option for many waste producers of the priority materials, as it does in some other parts of the UK.
- The upcoming ban on BMW (effective December 2025) will change landfill dynamics, reducing long-term demand for materials traditionally used in landfill engineering, and may lead to more lower-rate materials being sent to landfill.
- Misclassification of waste remains a major issue, exacerbated by complex EWC code classifications that do not always align with SLfT qualifying material criteria. The lack of easy-to-use guidance and strong oversight contributes to both deliberate and unintentional misclassification.
These findings suggest that while the lower-rate SLfT has played a role in reducing landfill disposal overall, there may be opportunities to better align it with Scotland’s evolving circular economy and net zero ambitions.
Does the lower rate of Scottish Landfill Tax (SLfT) still support Scotland’s environmental objectives?
The lower-rate SLfT was designed to provide a cost-effective landfill option for inert, low-risk materials while supporting Scotland’s environmental policies, including waste reduction, emissions reduction, and adherence to the waste hierarchy. Since it was introduced, Scotland has introduced ambitious net zero targets and has increased its policy focus on achieving a circular economy. Compared to when the UK-wide Landfill Tax was first introduced in 1996, there is now more emphasis on reducing environmental impacts associated with upstream material use, rather than solely reducing emissions and hazards once materials are in landfill.
This research finds that the lower rate is no longer fully aligned with Scotland’s environmental objectives. Evidence suggests that progress in diverting lower-rate materials may have stalled, with data indicating a levelling-off of lower-rate landfill tonnages since 2020–21 (Figure 1). In addition, there is insufficient incentive to divert materials upstream, including via the planning and design stages of the construction projects which generate much of these materials.
Misalignment with policy goals
While the SLfT was intended to discourage landfill disposal and promote alternative waste management options, the lower rate has, in some cases, created unintended incentives:
- Mechanically-treated fines have become a dominant lower-rate waste stream despite their potential for reduction and recovery, indicating that the tax structure may not sufficiently encourage more circular treatment of the mixed construction materials that make up this waste stream.
- The low cost of landfill disposal creates limited incentives for repurposing soils and stones, which could otherwise be reused in construction and landscaping.
- The lower rate of tax, at £4.05 per tonne (2025-26) appears to have had a limited impact in shifting waste up the hierarchy, with landfill remaining the most economically viable option for many waste producers.
Environmental and economic consequences
Mechanically-treated fines, which now make up a significant portion of lower-rate landfill disposal, have disproportionately high environmental impacts (on a whole life-cycle basis) compared to other lower-rate materials, including contributions to air pollution, resource depletion, and biodiversity loss.
The financial attractiveness of landfill compared to investment in secondary material recovery remains a major barrier. The cost of processing and diverting lower-rate materials often exceeds landfill costs, discouraging investment in alternative waste management solutions.
Compliance and enforcement challenges
The widening tax differential between standard- and lower-rate waste contributes to increased misclassification, particularly for mechanically-treated fines, where interviewees pointed to the ‘production’ of fines in order to qualify for the lower rate.
Landfill operators, who bear the primary tax liability for misclassified waste, face increased financial and compliance risks, leading some to refuse lower-rate fines due to the high burden of tax assessments and retrospective penalties.
Complexities in aligning SLfT qualifying criteria with EWC codes contribute to misclassification, due to a lack of clear guidance for waste producers and operators.
Conclusion and policy implications
The lower-rate SLfT remains partially effective but is increasingly misaligned with Scotland’s circular economy and wider environmental objectives. While it has supported landfill diversion in some cases, the increasing quantity of mechanically-treated fines being landfilled at lower rate undermines resource efficiency and waste hierarchy goals. Without adjustments, in conjunction with other supporting policies, there is a risk that the tax may continue to favour landfill disposal over resource recovery, limiting Scotland’s progress toward a low-carbon, circular economy.
To ensure Scotland meets its waste reduction, emissions reduction, and circular economy goals, reforms to the lower-rate SLfT are necessary. Key areas for further exploration could include:
- Raising the lower SLfT rate by a greater margin than in previous years (as Wales is doing and proposed in the UK’s 2025 consultation), to incentivise application of the waste hierarchy.
- Assigning a significantly higher SLfT rate to mechanically-treated fines specifically, to address misclassification and recognise its relatively high environmental impacts.
- Strengthening enforcement and guidance on material classification to reduce compliance risks.
- Build on existing cross-border regulatory and enforcement cooperation to address ongoing challenges such as waste tourism and the evolution of the landfill tax, recognising the complexities of working across different regimes.
By considering these targeted interventions, Scotland can help reduce reliance on landfill, improve material efficiency, and ensure that landfill tax policy aligns with long-term sustainability goals.
References
Ali, M. (2023) ‘An investigation into the uses of trommel fınes produced from recyclıng of constructıon and demolition waste’, Construction and Building Materials, 369(130579), pp.1-11. Available at https://www.sciencedirect.com/science/article/pii/S0950061823002908 (Accessed: 12 March 2025)
Arup and Ellen Macarthur Foundation (2020) From principles to practices: Realising the value of circular economy in real estate https://www.arup.com/globalassets/downloads/insights/from-principles-to-practices-realising-the-value-of-circular-economy-in-real-estate.pdf (Accessed: 12 March 2025)
Berryman, C. et al. (2023) Sustainable management of surplus soil and aggregates from construction (C809). London, UK: CIRIA.
Bogas, J.A., Silva, M. and Glória Gomes, M. (2019) ‘Unstabilized and stabilized compressed earth blocks with partial incorporation of recycled aggregates’, International Journal of Architectural Heritage, 13(4), pp.569-584. Available at: https://www.tandfonline.com/doi/abs/10.1080/15583058.2018.1442891 (Accessed: 12 March 2025)
Braga, B.B., de Carvalho, T.R.A., Brosinsky, A., Foerster, S. and Medeiros, P.H.A., (2019) ‘From waste to resource: Cost-benefit analysis of reservoir sediment reuse for soil fertilization in a semiarid catchment’, Science of the total environment, 670, pp.158-169. Available at: https://www.sciencedirect.com/science/article/abs/pii/S0048969719310654 (Accessed: 12 March 2025)
Burdier, M., Anshassi, M., Guo, Y., Laux, S. and Townsend, T. (2022) ‘Enhancing the beneficial reuse properties of construction and demolition debris fines using lab-scale washing’, Resources, Conservation and Recycling, 183(106361). Available at: https://www.sciencedirect.com/science/article/abs/pii/S0921344922002063 (Accessed: 12 March 2025)
Burlakovs, J. et al. (2021) ‘Sustainable landfill fine fraction of waste reuse opportunities in covering layer development’, Research for Rural Development, 36, pp.303-310. Available at: https://llufb.llu.lv/conference/Research-for-Rural-Development/2021/LatviaResRuralDev_27th_2021-303-310.pdf (Accessed: 12 March 2025)
Campe, J. et al. (2012) The potential of remineralization with rock mineral fines to transform agriculture, forests, sustainable biofuels production, sequester carbon, and stabilize the climate. Available at: https://www.remineralize.org/wp-content/uploads/Rio%20Summit-RTE-2012.pdf (Accessed: 12 March 2025)
Choi, H, et al. (2018) ‘Soil Recycling Among Construction Sites by Optimizing Schedule and Costs for Earthmoving’ Journal of Asian Architecture and Building Engineering, 16(2), pp. 439-446. Available at: https://doi.org/10.3130/jaabe.16.439 (Accessed: 21 March 2025)
European Commission (2000) 2000/532/EC: Commission Decision of 3 May 2000 replacing Decision 94/3/EC establishing a list of wastes pursuant to Article 1(a) of Council Directive 75/442/EEC on waste and Council Decision 94/904/EC establishing a list of hazardous waste pursuant to Article 1(4) of Council Directive 91/689/EEC on hazardous waste. Available at: http://data.europa.eu/eli/dec/2000/532/2023-12-06 (Accessed: 27/03/2025)
CIWM (2023) Position Statement: Digital Waste Tracking. Available at: https://www.ciwm.co.uk/ciwm/news-and-insight/member_news/2023/ciwm_position_statement_digital_waste_tracking.aspx (Accessed: 12 March 2025)
Cottrell, J.A., Ali, M. and Etienne, G. (2024) ‘Utilisation of construction, demolition and excavation waste for the production of compressed trommel fines blocks’, Construction and Building Materials, 416(134985), pp.1-11. Available at: https://www.sciencedirect.com/science/article/pii/S0950061824001260 (Accessed: 12 March 2025)
ClimateXChange and Ricardo (2025) Evidence review on the potential role of alternatives to primary aggregates to deliver reductions in GHG emissions [Forthcoming; publication expected summer 2025].
DEFRA (2023) Government response: Implementation of mandatory digital waste tracking. Available at: https://www.gov.uk/government/consultations/implementation-of-mandatory-digital-waste-tracking/outcome/government-response (Accessed 14 March 2025)
Di Maria, F., Micale, C., Sordi, A., Cirulli, G. and Marionni, M. (2013) ‘Urban mining: Quality and quantity of recyclable and recoverable material mechanically and physically extractable from residual waste’, Waste Management, 33(12), pp.2594-9. Available at: https://www.sciencedirect.com/science/article/abs/pii/S0956053X13003814 (Accessed: 12 March 2025)
Döbbeling-Hildebrandt, N. et al. (2024) ‘Systematic review and meta-analysis of ex-post evaluations on the effectiveness of carbon pricing’, Nature Communications, 15(1) pp.1-12, Available at: https://www.nature.com/articles/s41467-024-48512-w#ref-CR69 (Accessed: 12 March 2025)
Dsposal (n.d.) Waste thesaurus. Available at: https://dsposal.uk/your/waste-thesaurus?keyword=19+12+12&type=low (Accessed: 12 March 2025)
Environment Agency (2023a) Check if your waste is suitable for deposit recovery. Available at: https://www.gov.uk/government/publications/deposit-for-recovery-operators-environmental-permits/check-if-your-waste-is-suitable-for-deposit-for-recovery#:~:text=and%20road%20construction.- ,Minerals%20(such%20as%20sand%20and%20stones)%20from%20the%20treatment%20of,gypsum%20from%20recovered%20plasterboard (Accessed: 05 February 2025)
Environment Agency (2023b) Land spreading: benefits and risks of the waste types you can use. Available at: https://www.gov.uk/guidance/landspreading-benefits-and-risks-of-the-waste-types-you-can-use/19-waste-codes (Accessed: 05 February 2025)
Environmental Standards Scotland (2024) The risks to Scotland’s soils: a scoping report. Available at: The-risks-to-Scotlands-soils-a-scoping-report-October-2024.pdf (Accessed: 21 March 2025)
European Commission (2000) 2000/532/EC: Commission Decision of 3 May 2000 replacing Decision 94/3/EC establishing a list of wastes pursuant to Article 1(a) of Council Directive 75/442/EEC on waste and Council Decision 94/904/EC establishing a list of hazardous waste pursuant to Article 1(4) of Council Directive 91/689/EEC on hazardous waste.
European Commission (2023) Use of recycled aggregates in concrete: Opportunities for upscaling in Europe. Available at: https://publications.jrc.ec.europa.eu/repository/bitstream/JRC131294/JRC131294_01.pdf (Accessed: 11 February 2025)
Ferriz-Papi, J.A. and Thomas, S. (2020) ‘Recycled aggregates from construction and demolition waste in the production of concrete blocks’, Journal of Construction Materials, 2(1), pp.1-12. Available at: https://salford-repository.worktribe.com/output/1349528/recycled-aggregates-from-construction-and-demolition-waste-in-the-production-of-concrete-blocks (Accessed: 12 March 2025)
Green Alliance (2022) Circular business: What companies need to make the switch. Available at: https://green-alliance.org.uk/wp-content/uploads/2022/07/Circular-business.pdf (Accessed: 25 March 2023)
Green Alliance (2023) Circular construction: Building for a greener UK economy. Available at: https://green-alliance.org.uk/wp-content/uploads/2023/03/Circular-construction.pdf (Accessed: 21 March 2025)
Hale, S. E (2021) ‘The Reuse of Excavated Soils from Construction and Demolition Projects: Limitations and Possibilities’, Sustainability, 13(11), p. 6083. Available at: https://doi.org/10.3390/su13116083 (Accessed: 21 March 2025)
Haynes, R.J., Zhou, Y.F. and Weng, X. (2022) ‘Formulation and use of manufactured soils: A major use for organic and inorganic wastes’, Critical Reviews in Environmental Science and Technology, 52(22), pp.4113-4133. Available at: https://www.tandfonline.com/doi/abs/10.1080/10643389.2021.1989909 (Accessed: 12 March 2025)
Hernández García, L.C., Monteiro, S.N., Colorado Lopera, H.A. (2024) ‘Recycling Clay Waste from Excavation, Demolition, and Construction: Trends and Challenges’, Sustainability, 16(14), pp. 1-20. Available at: https://www.mdpi.com/2071-1050/16/14/6265
HM Revenue and Customs (2024) Accredited official statistics: Environmental Taxes Bulletin background and references. Available at: https://www.gov.uk/government/statistics/environmental-taxes-bulletin/environmental-taxes-bulletin-background-and-references (Accessed: 11 February 2025)
HM Treasury and HMRC (2025) Consultation on reform of landfill tax. Available at: https://www.gov.uk/government/consultations/consultation-on-reform-of-landfill-tax (Accessed: 13 May 2025)
Huang, T. et al. (2022) ‘A BIM-GIS-IoT-Based System for Excavated Soil Recycling’, Buildings, 12(4), p. 457. Available at: https://doi.org/10.3390/buildings12040457 (Accessed: 21 March 2025)
Hub4 (2024) The next generation in aggregate and mineral processing. Hub 4, 85. Available at: https://hub-4.com/files/document/4675/1711115438_Issue85_web.pdf (Accessed: 12 March 2025)
Hurst, L.J. and O’Donovan, T.S. (2024). ‘Embodied impacts of key materials for UK decarbonised domestic retrofit: Differences between sources of embodied carbon and embodied energy data’, Energy and Buildings, 319(114515), pp. 1-12. Available at: https://www.sciencedirect.com/science/article/pii/S0378778824006315 (Accessed: 12 March 2025)
Kasinikota, P. and Tripura, D.D. (2021) ‘Evaluation of compressed stabilized earth block properties using crushed brick waste’, Construction and Building Materials, 280(122520). Available at: https://www.sciencedirect.com/science/article/abs/pii/S0950061821002804 (Accessed: 12 March 2025)
Katsumi, T. (2015) ‘Soil excavation and reclamation in civil engineering: Environmental aspects’, Soil Science and Plant Nutrition, 61(sup1), pp. 22–29. Available at: https://doi.org/10.1080/00380768.2015.1020506 (Accessed: 21 March 2025)
Kay, S. (2022) ‘Case report: Appeal against Scottish landfill tax assessment partially successful’ Croner-i Tax and Accounting. Available at: https://library.croneri.co.uk/cch_uk/tta22/wkid-202206081109470619-79727388 (Accessed: 05 February 2025)
Magnusson, S. et al. (2015) ‘Sustainable management of excavated soil and rock in urban areas: A literature review’ Journal of Cleaner Production, 93, pp. 18-25. Available at: https://doi.org/10.1016/j.jclepro.2015.01.010 (Accessed: 21 March 2025)
Manning, D. and Vetterlein, J. (2004) ‘ExpLOItation and use of quarry fines’, Mist Project-Solutions, 44, pp.1-60. http://www.katlapumice.com/mist/mist2.pdf (Accessed: 12 March 2025)
Mansoor, S.S., Hama, S.M. and Hamdullah, D.N. (2024) ‘Effectiveness of replacing cement partially with waste brick powder in mortar’, Journal of King Saud University-Engineering Sciences, 36(7), pp.524-532. https://www.sciencedirect.com/science/article/pii/S1018363922000046#:~:text=3.2.&text=As%20mentioned%20in%20Fig.,compared%20with%20the%20reference%20mix.&text=res%20image%20(75KB)-,Fig.,of%20mixes%20with%20different%20%25WBP (Accessed: 12 March 2025)
Mayor of London (2022) London Plan Guidance: Circular Economy Statements. Available at: https://www.london.gov.uk/sites/default/files/circular_economy_statements_lpg.pdf (Accessed: 31 March 2025
Marasini, R. et al. (2012) ‘An investigation into the logistics and management of uncontaminated soil exchange in the Southern region of the UK’ Available at: https://pure.solent.ac.uk/en/publications/an-investigation-into-the-logistics-and-management-of-uncontamina (Accessed: 27/03/2025)
O’Leary, M.J., Osmani, M. and Goodier, C. (2024) ‘Circular economy implementation strategies, barriers and enablers for UK rail infrastructure projects’, Resources, Conservation & Recycling Advances, 21. Available at: https://www.sciencedirect.com/science/article/pii/S2667378923000676 (Accessed: 12 March 2025)
Oujana, S. and Sanchez, D. (2018) ‘Origins of the Problematic Substances in Fines, for Their Acceptance at Inert Landfills’, Journal of Geoscience and Environment Protection, 6(5), pp.237-246. Available at: https://www.scirp.org/journal/paperinformation?paperid=84938 (Accessed: 12 March 2025)
Renella, G. (2021) ‘Recycling and Reuse of Sediments in Agriculture: Where Is the Problem?’ Sustainability, 13(4), pp. 1-12. Available at: https://www.mdpi.com/2071-1050/13/4/1648
Revenue Scotland (2024a) Scottish Landfill Tax rates and accounting periods. Available at: https://revenue.scot/taxes/scottish-landfill-tax/slft-rates-accounting-periods (Accessed: 19 February 2025)
Revenue Scotland (2024b) Taxes: Scottish Landfill Tax. Available at: https://www.gov.scot/policies/taxes/landfill-tax/ (Accessed: 19 February 2025)
Revenue Scotland (n.d.) SLfT3001 – Determining whether tax is payable. Available at: https://revenue.scot/taxes/scottish-landfill-tax/slft1000-slft-legislation-guidance/slft3001-determining-whether-tax-payable (Accessed: 12 March 2025)
Scottish Government (2012a) Criteria and Procedures for the Acceptance of Waste at Landfills (Scotland) Direction 2005. Available at: https://www.gov.scot/publications/criteria-and-procedures-for-the-acceptance-of-waste-at-landfills-scotland-direction-2005/ (Accessed: 25 March 2025)
Scottish Government (2012b) Waste (Scotland) Regulations 2012. Available at: https://www.legislation.gov.uk/sdsi/2012/9780111016657/contents (Accessed: 11 February 2025)
Scottish Government (2021a) Heat in Buildings Strategy – achieving net zero emissions in Scotland’s buildings. Available at: https://www.gov.scot/publications/heat-buildings-strategy-achieving-net-zero-emissions-scotlands-buildings/ (Accessed: 25 March 2025)
Scottish Government (2021b) Net Zero Public Sector Buildings Standard. Available at: https://www.scottishfuturestrust.org.uk/storage/uploads/nzpsb_0s1_the_standard_v3.pdf (Accessed: 28 March 2025)
Scottish Government (2022) Delivering Scotland’s circular economy – route map to 2025 and beyond: consultation, Package 6: Minimise the impact of disposal. [Consultation paper] https://www.gov.scot/publications/consultation-delivering-scotlands-circular-economy-route-map-2025-beyond/pages/11/ (Accessed: 19 February 2025)
Scottish Government (2024a) Scotland’s Circular Economy and Waste Route Map to 2030. Available at: https://www.gov.scot/publications/scotlands-circular-economy-waste-route-map-2030/documents/ (Accessed: 21 March 2025)
Scottish Government (2024b) Taxes: Aggregates Levy. Available at: https://www.gov.scot/policies/taxes/aggregates-levy (Accessed: 11 February 2025)
Scottish Ecological Design Association (SEDA) (2024) 2045: The Big Conversation.
SEPA; the Civil Engineering Contractors Association (Scotland); the Environment Industries Commission (2010) Regulatory guidance: Promoting the sustainable reuse of greenfield soils in construction. Available at: https://www.sepa.org.uk/media/154233/reuse_greenfield_soils_construction.pdf (Accessed: 12 March 2025)
SEPA; Activities Exempt from Waste Management Licensing. Scottish Statutory Instrument 2011 No. 228: The Waste Management Licensing (Scotland) Regulations 2011. Paragraph 19. Available at:
https://www.sepa.org.uk/regulations/waste/activities-exempt-from-waste-management-licensing/ (Accessed: 14 March 2025)
SEPA (2013) SEPA Guidance: Recycled Aggregates from Inert Waste. Available at: https://www.sepa.org.uk/media/162893/production-of-recycled-aggregates.pdf (Accessed: 31 March 2025)
SEPA (2015) European waste catalogue EWC guidance Nov 2015. Available at: https://www.sepa.org.uk/media/163421/ewc_guidance.pdf (Accessed: 05 February 2025)
SEPA, Natural Resources Wales, Northern Ireland Environment Agency and Environment Agency (England) (2015) Waste Classification Technical Guidance (WM3). Available at: https://www.sepa.org.uk/media/162490/waste-classification-technical-guidance-wm3.pdf (Accessed: 29 March 2025)
SEPA (2018) Landfill restoration general guidance. Available at: https://www.sepa.org.uk/media/594440/sepa-guidance-wst-g-057-restoration.pdf (Accessed: 12 March 2025)
SEPA (2023) 2022 waste data quality report: Waste landfilled in Scotland. Available at: https://www.sepa.org.uk/media/sbzb01hn/waste-landfill-quality-report.pdf (Accessed: 12 March 2025)
SEPA (2024a) Biodegradable municipal waste landfill ban. Available at: https://www.sepa.org.uk/regulations/waste/landfill/biodegradable-municipal-waste-landfill-ban/ (Accessed: 11 March 2025)
SEPA (2024b) The ban on landfilling Biodegradable Municipal Waste (scope and testing guidance). Available at: https://www.sepa.org.uk/media/vknblvy3/bmw-testing-guidance.docx (Accessed 14 March 2025)
SEPA (n.d) The use of gypsum to improve soil conditions. Available at: https://consultation.sepa.org.uk/operations-portfolio/the-use-of-gypsum-to-improve-soil-conditions/supporting_documents/170529%20Waste%20Gypsum%20Guidance.pdf (Accessed: 12 March 2025)
Soil Association (2021) Saving our soils: Healthy soils for our climate, nature and health. Available at: https://www.soilassociation.org/media/24941/saving-our-soils-report-dec21.pdf (Accessed: 12 March 2025)
Szmidt, R.A. and Ferguson, J. (2004) ‘Co-utilization of rock dust, mineral fines and compost’, Active Compost Limited SEPA Scotland, p.P4. https://www.remineralize.org/wp-content/uploads/Co-utilization%20of%20Rockdust,%20Mineral%20Fines%20and%20Compost.pdf (Accessed: 12 March 2025)
Suárez, S., Roca, X. and Gasso, S. (2016) ‘Product-specific life cycle assessment of recycled gypsum as a replacement for natural gypsum in ordinary Portland cement: application to the Spanish context’, Journal of cleaner production, 117, pp.150-159. Available at: https://www.sciencedirect.com/science/article/abs/pii/S0959652616000792 (Accessed: 12 March 2025)
The Royal Society (2020) soil structure and its benefits. Available at: https://royalsociety.org/-/media/policy/projects/soil-structures/soil-structure-evidence-synthesis-report.pdf (Accessed: 12 March 2025)
Thompson, A. (2021). Soils and Stones Report: Sustaining Our Future by Influencing Change in the UK and Beyond. Available at: https://aru.figshare.com/articles/report/Soils_and_Stones_Report_Sustaining_Our_Future_by_Influencing_Change_in_the_UK_and_Beyond/23783742?file=41718066 (Accessed: 21 March 2025)
Transport Scotland, Highways England, Welsh Government, Department for Infrastructure (2020) The use of recycled aggregated in structural concrete. Available at: https://www.standardsforhighways.co.uk/tses/attachments/e0ba4369-b995-4aff-8aa3-f57b69b3928d (Accessed: 12 March 2025)
UK Net Zero Carbon Buildings Standard (n.d.) UK Net Zero Carbon Buildings Standard. Available at: https://www.nzcbuildings.co.uk/home#:~:text=The%20UK%20Net%20Zero%20Carbon%20Buildings%20Standard%20enables%20industry%20to,with%20our%20nation’s%20climate%20targets.&text=The%20UKNZCBS%20aligns%20as%20far,FAQs%20page%20for%20further%20information. (Accessed: 28 March 2025)
Vincent, T. et al (2022) ‘Physical process to sort construction and demolition waste (C&DW) fines components using process water’, Waste Management, 143, pp.125-134. Available at: https://www.sciencedirect.com/science/article/abs/pii/S0956053X22000964 (Accessed: 12 March 2025)
Welsh Government (2024) Landfill Disposals Tax (Tax Rates) (Wales) (Amendment) Regulations 2024: Explanatory Memorandum. Available at: https://senedd.wales/media/laely1yg/sub-ld16992-em-e.pdf (Accessed: 13 May 2025)
WRAP and Environment Agency (2013) Aggregates from inert waste. Available at: https://assets.publishing.service.gov.uk/media/65fd7426f1d3a0001132add0/CD1.Y_Quality_Protocol.__Aggregates_from_inert_waste.__End_of_waste_criteria_for_the_production_of_aggregates_from_inert_waste._WRAP_October_2013..pdf (Accessed: 12 March 2025)
Yadav, R. et al. (2022) ‘Phytoremediation: A wonderful cost-effective tool,’ Cost effective technologies for solid waste and wastewater treatment (pp. 179-208). Available at: https://www.sciencedirect.com/science/article/abs/pii/B9780128229330000085
Zero Waste Scotland (2023) Waste (Scotland) Regulations. Available at: https://www.zerowastescotland.org.uk/resources/waste-scotland-regulations (Accessed: 10 March 2025).
Zero Waste Scotland (2024) Scottish Waste Environmental Footprint Tool (SWEFT). Available at: https://www.zerowastescotland.org.uk/resources/scottish-waste-environmental-footprint-tool-sweft (Accessed: 13 March 2025).
Zhao, Z. et al (2020) ‘Use of recycled concrete aggregates from precast block for the production of new building blocks: An industrial scale study’, Resources, Conservation and Recycling, 157(104786). Available at: https://www.sciencedirect.com/science/article/abs/pii/S0921344920301075 (Accessed: 12 March 2025)
Zhao, X. (2021) ‘Stakeholder-associated factors influencing construction and demolition waste management: A systematic review’, Buildings, 11(4), pp. 1-22. Available at: https://doi.org/10.3390/buildings11040149 (Accessed: 12 March 2025)
Appendices
This appendix provides further context on how the SLfT aligns with key environmental policy frameworks, specifically the Circular Economy (Scotland) Act 2024 and Scotland’s wider decarbonisation strategy. It highlights the role of SLfT in supporting waste hierarchy principles, promoting resource efficiency, and contributing to net-zero targets through practical examples – while also noting current limitations.
Circular Economy (Scotland) Act 2024
Example 1: Waste hierarchy alignment
The Circular Economy (Scotland) Act 2024 places strong emphasis on the waste hierarchy, which prioritises prevention, reuse, recycling, and recovery before landfill. SLfT reinforces this principle by applying a financial disincentive to landfill disposal. The lower rate of SLfT, applied to certain inert materials such as glass, ceramics and soil, encourages their diversion from landfill toward reuse or recycling. This supports the Act’s objectives by reducing dependence on landfill and promoting material circulation within the economy. However, as outlined in Section 3.1 the lower rate appears to be an insufficient incentive to drive significant upstream changes, such as waste prevention or more ambitious reuse practices.
Example 2: Waste prevention and resource efficiency
The Act also aims to improve resource efficiency across sectors. By differentiating tax rates based on environmental impact, SLfT promotes the recovery of materials with low impacts and discourages disposal of more polluting waste. This financial incentive supports businesses in adopting sustainable waste practices. That said, the influence of SLfT on broader resource efficiency is limited, as its primary focus is end-of-pipe disposal rather than incentivising upstream design, reduction, or material substitution choices
Scotland’s decarbonisation strategy
Example 3: Reducing emissions from waste management
Scotland’s decarbonisation strategy includes a target of net-zero emissions by 2045. Landfilled waste—particularly biodegradable materials—generates GHGs such as methane. SLfT supports emissions reduction by applying a higher tax rate to waste streams which emit more GHGs in landfill, encouraging their diversion. The upcoming ban on landfilling biodegradable municipal waste in 2025 builds on this, aligning landfill policy with Scotland’s climate commitments. However, SLfT’s impact remains focused on reducing emissions from landfilled waste, and does not yet provide strong incentives to reduce embodied carbon or promote lower-carbon materials earlier in the lifecycle.
Example 4: Circular economy and carbon footprint reduction
The strategy also promotes circular economy practices as a means of reducing carbon emissions. SLfT complements this by encouraging alternatives to landfill, such as repurposing lower-rate materials like soil and stones for construction. This can reduce the need to extract virgin materials, contributing to lower carbon footprints. Nonetheless, SLfT’s role in driving circular construction practices remains limited, as it does not directly incentivise material reuse, design for deconstruction, or low-carbon construction methods upstream.
Integration of policy goals
Example 5: Aligning SLfT with policy reviews and landfill ban
The Scottish Government has committed to reviewing waste management options by 2027, alongside the upcoming ban on landfilling biodegradable municipal waste. These developments present an opportunity to better integrate SLfT with other fiscal and regulatory tools. While SLfT plays a role in discouraging landfill and supporting environmental objectives, its effectiveness is partly constrained by limited coordination with wider policies on construction, procurement, and materials management. Stronger understanding of policy cross overs could enhance the overall impact of SLfT.
Data requests
Both Revenue Scotland (as regulators of the SLfT) and SEPA (as the national environmental authority) hold and publish statistical data on waste to landfill in Scotland. However, the public-facing outputs are summarised and categorised from more disaggregated data. This is primarily to protect confidentiality within the tax returns (RS) and to make the outputs more accessible to the public (SEPA). As such, we made data requests to both organisations.
RS provided annual financial year (FY) data for five full years against 13 EWC codes / group codes as highlighted in Section 4.1. Multiple codes were grouped together in six of the 13 rows of data where RS needed to aggregate data to protect confidentiality. This is where only one company is responsible for an entire tax return for a single code and could therefore be directly identifiable.
SEPA provided 3 full years of data broken down by quarter, also at EWC code level. This annual data is publicly available but the latest year was released early to us by SEPA for the purposes of this report. The data is fully disaggregated and includes operator name & address, operator description and waste origin. There are 2,514 individual records in the data file.
We also made a request to Zero Waste Scotland for access to their Scottish Waste Environmental Footprint Tool (SWEFT). The tool provides lifecycle-based factors for certain waste categories across different treatment pathways (e.g. landfill, recycling, incineration…) for six different environmental criteria:
- Climate / greenhouse gases, as kg CO2 eq. The contribution of emissions of greenhouse gases to climate change, measured as Global Warming Potential (GWP100)
- Biodiversity, as species loss. An aggregated measure of species at risk, based on the ReCiPe endpoint indicator for Ecosystem quality.
- Air pollution, as kg PM2.5 eq., Air pollution’s damage to human health, measured as the equivalent impact of PM2.5.
- Mineral resource scarcity, as kg Cu eq. Mineral resource scarcity is a measure of the difficulty to mine a resource in the future given expected future production (measured in kg of copper equivalent).
- Water consumption, as m3. Water consumption consists of the volume of water withdrawn and used.
- Land use, as m2 annual crop eq. The species lost due to loss of habitat and soil disturbance, expressed as the equivalent species loss per sqm typical crop production.
Given the timeframe of this project and the desire to consider the role of SLfT against Scotland’s wider environmental objectives – the use of such a tool was considered appropriate to provide quick assessment across a broad coverage of potential environmental impacts.
Data cleansing
We then cleansed the data:
- Annual totals were created in the SEPA data by FY, assuming that a financial year is the sum of Q2, Q3, Q4 and the following Q1.
- SEPA data was filtered to remove any EWC codes that do not appear in the RS data for lower rate materials.
- Tonnages for EWC codes in the SEPA dataset were aggregated where relevant in order to match the EWC code grouping provided by RS.
- A SWEFT category was assigned to each material / material group in the RS/SEPA data. This was based on expert judgement of the project team, with the allocations presented in Table A 1 below. It is noted that SWEFT has to date only been compiled for household waste streams. Therefore, the nature of materials from a commercial / industrial source (more likely to qualify as lower rate materials) may differ in nature from household wastes of a similar material description. Given the timeline of this project and the aim to use SWEFT as an indicator of environmental impacts, this was deemed to be an acceptable weakness in the data review method.
We reviewed landfill tonnage data for potential discrepencies by comparing the national total to landfill (SEPA) which is assumed to represent the sum of both lower- and standard- rate materials against the RS data for the same period. For two of the grouped codes, the RS data for lower rate materials was found to be greater than the total to landfill represented by the SEPA data. In one case, this was resolved through communication with the data providers. For the remaining group, it was stated that “there can be slight differences in counting between the organisations due to water discounts applied, permanent removals, and movement from/to non-disposal areas”. For the most part, this verification exercise found good alignment between the two datasets. This is supported by the finding that the two datasets match in totals for some of the EWC codes that are only landfilled at lower rate. As such, the group with a remaining discrepency was identified to the project steering group for their information, without there being a significant impact on research outcomes.
Data analysis and prioritisation scores
We analysed the data with the view of identifying materials/ material groups to prioritise for further research.
- For each of the 13 material groups in the RS dataset, we calculated the percentage of lower rate material as a portion of the total material landfilled (SEPA totals) for that group. This allowed for the groups with the highest quantities landfilled at lower rate to be identified and prioritised for further research, whilst providing additional context on the relationship between lower and standard rate wastes within the material definitions.
- We reviewed a number of different reference material including the SEPA operator descriptions for each landfill record to give specificity to the materials included under each of the defined material groups. This also enabled us to screen out certain material groups as “niche materials” as described in Section 4.1.
- Environmnetal impacts were estimated for each of the 13 material groups across the six environmental indicators included in SWEFT. This was completed by multiplying the 2023/24 tonnage for each material group with the corresponding SWEFT factor.
- Based on step III, we ranked material groups in terms of their weighted impact against each environmental indicator. The output of this is provided in Table A 1 below.
- An alternative view of the results was defined by calculating the relative impact of each material group across each indicator proportionally from zero to one. This helps to show the significance of impact for each material group which is not automatically understood from the appraoch in step IV. For example, there may be a significant difference in the scale of environmental impact between the first and second ranked material group for a given indicator. The ouput of this analysis is the spider diagram presented in section 4.4.
- We assigned an overall priority score to each of the 13 material groups by considering both the overall tonnage disposed at lower rate; and the indicative environmental impacts. The ouput of this priority scoring is provided in Table A 1 below.
This method for prioritising materials was agreed with the project steering group as a basis for narrowing down the materials / material groups for further research and policy review.
Table A : Descriptor terms, SWEFT category, tonnage and weighted environmental impact rankings (SWEFT output)
|
EWC code/ group of codes |
Descriptor |
SWEFT category |
Tonnage |
GHG |
Biodiversity |
Air pollution |
Mineral resource scarcity |
Waster consumption |
Land use |
Overall priority rank |
|
19 12 12 |
Mechanically-treated fines |
Combustion wastes |
1 |
2 |
NA |
1 |
1 |
1 |
1 |
1 |
|
17 05 04 |
Soil and stones |
Soils |
2 |
4 |
2 |
3 |
3 |
2 |
2 |
2 |
|
19 12 09 |
Mechanical treated-mineral fines |
Mineral waste from construction and demolition |
3 |
3 |
NA |
2 |
2 |
3 |
3 |
2 |
|
19 03 05, 19 05 99, 19 12 05, 19 13 06, 20 01 02, 20 01 99, 20 03 01, 20 03 03, 20 03 99[4] |
Mixed household wastes / Niche materials |
Mineral waste from construction and demolition |
4 |
5 |
NA |
4 |
5 |
5 |
5 |
4 |
|
19 01 12 |
Bottom ash and slag |
Combustion wastes |
5 |
6 |
NA |
5 |
6 |
6 |
6 |
5 |
|
19 01 02, 19 01 11, 19 01 14, 19 01 16, 19 02 09, 19 02 99 |
Niche materials |
Mixed and undifferentiated materials (aggregated) |
6 |
1 |
1 |
6 |
4 |
4 |
4 |
3 |
|
17 01 07 |
Mixed minerals (concrete, bricks, tiles, ceramics) |
Mineral waste from construction and demolition |
7 |
7 |
NA |
7 |
7 |
7 |
7 |
No priority |
|
01 04 08, 01 04 09, 01 04 10, 01 05 07, 02 01 03 |
Niche materials |
Mineral waste from construction and demolition |
8 |
8 |
NA |
8 |
8 |
8 |
8 |
No priority |
|
17 01 02, 17 01 03, 17 02 02, 17 05 06, 17 06 04, 17 09 04 |
Niche materials* |
Mineral waste from construction and demolition |
9 |
9 |
NA |
9 |
9 |
9 |
9 |
No priority |
|
06 01 99, 07 01 12, 07 07 12, 10 01 01, 10 01 17, 10 02 01, 10 03 05, 10 11 03 |
Niche materials* |
Combustion wastes |
10 |
10 |
NA |
10 |
10 |
10 |
10 |
No priority |
|
20 02 02 |
Soil and stones (garden, park, recreation) |
Soils |
11 |
11 |
3 |
11 |
11 |
11 |
11 |
5 |
|
12 01 07, 12 01 17, 15 01 07, 16 01 20, 16 03 04, 16 11 02 |
Niche materials* |
Mineral waste from construction and demolition |
12 |
12 |
NA |
12 |
12 |
12 |
12 |
No priority |
|
17 01 01 |
Concrete |
Mineral waste from construction and demolition |
13 |
13 |
NA |
13 |
13 |
13 |
13 |
No priority |
NA: SWEFT factor = zero for biodiversity loss associated with landfill for those waste categories.
The qualitative research consisted of a literature review and interviews to support an assessment of diversion and policy options.
Desk-based research
The desk-based research was initiated in two stages. The first stage was a preliminary review of diversion options for four top ranking materials, based on the quantitative data collection and analysis of SEPA and RS data (Appendix B). These were: mechanically treated fines, mechanically treated mineral fines, soils and stones, bottom ash, and slags. The second stage was a more detailed review following the quantitative assessment of environmental impacts and a narrowing of focus on three priority materials (Appendix B). After prioritisation was finalised, further research was not conducted for bottom ash and slags.
The priority materials were researched using academic search engines, such as Google Scholar, Scopus and Web of Science. Organisations concerned with inert waste were checked for relevant sources, such as WRAP, Zero Waste Scotland and Green Alliance. Sources were prioritised for review if they were based in Scotland or the UK, summarised a wide range of sources through a literature review, or were indicated to be widely referenced.
Often, sources were not published based on EWC codes. Instead, they refer to common industry names for the materials, for instance, ‘trommel fines’ or ‘mechanical fines’ rather than ‘EWC 19 12 12’. In addition, as research refers to the recycling and recovery of mechanical fines generally, we combined searches on diversion options for mechanically-treated fines and mechanically treated mineral fines.
A combination of search terms were used, including terms related to:
- Research questions, e.g. downstream, upstream, diversion, circular, barriers, enablers, limitations, risk, disposal and landfill.
- Priority materials, e.g. trommel fines, mechanical fines, minerals, bricks, tiles, ceramics, fines, skip fines, soils, stones and gypsum.
- Circularity or waste hierarchy stages, e.g. reuse, recovery, recycling, retrofit and refurbishment.
- Industries, e.g. construction, demolition, quarrying, excavation, engineering and recycling.
- Diversion options, e.g. aggregate, treatment, land, deconstruction, engineering, landscaping and cover materials.
- Geography, e.g. Scotland, UK, Europe and rural.
Stakeholder engagement
Eight one-hour, semi-structured interviews were conducted online and in-person between January and March 2025. In addition, questions were answered via email by some of these stakeholders, and a 3 further stakeholders. The full list can be viewed below in Table A 2 .
Table A 2: Stakeholder engagement list
|
Stakeholder category |
Stakeholder reference |
Form of data collection |
Date of interview |
Position held |
|
Regulator |
Revenue Scotland-A |
Interview |
21 Jan 2025 |
SEPA Specialist |
|
SEPA |
Interview |
21 Jan 2025 |
Waste Policy Lead | |
|
Revenue Scotland-B |
|
N/A |
Head of Scottish Landfill Tax | |
|
Waste management, including industry associations |
Commercial landfill operator |
Interview and email |
10 Feb 2025 |
Regional Operations Manager |
|
C&D waste management processor |
Interview and email |
17 Jan 2025 |
Managing Director | |
|
Chair | ||||
|
Waste industry association |
Interview |
22 Jan 2025 |
Policy Advisor | |
|
Large public body |
|
N/A |
National Sustainability Manager | |
|
Upstream sources |
Commercial remediation company |
Interview |
03 Feb 2025 |
Regional Remediation Manager, Scotland |
|
Engineering consultancy |
Interview |
21 Feb 2025 |
Technical Director | |
|
C&D skip operator |
Interview |
06 Feb 2025 |
Operations Director | |
|
Construction company |
Interview |
25 March 2025 |
Head of Supply Chain Development |
A set of standard interview/email questions were developed based on the overarching research questions asked in the project. Before each contact with a stakeholder, these standard questions were tailored to the stakeholder’s knowledge and background and developed into an interview proforma. The standard questions investigated the following key points:
- verifying quantitative findings on priority materials and sources of lower-rate materials;
- identifying existing or future end-of-pipe diversion options for each priority material;
- identifying existing or future upstream diversion options for each priority material;
- understanding the barriers hindering the advancement of each diversion option, including technical, operational, policy, financial or wider barriers;
- understanding potential policy options to address barriers associated with accelerating the diversion options; and
- understanding the unintended consequences of any policy options.
All meeting invites were issued by the Scottish Government via email and were accompanied by a participant information and consent form for interviewees to review and sign. This included full details of data use and protection, in line with UK Government guidance.[5]
Interview requests were sent out in two stages to support research aims. The first stage targeted regulators, waste management organisations, local governments and tax-implementing organisations. They were selected to provide insights on data availability and granularity, triangulate/verify the assessment prioritising certain materials, and identify further stakeholders to contact. The second stage targeted ‘the source’ of lower-rate materials sent to landfill. Namely, stakeholders from sectors using large amounts of priority materials. Their insights were used to understand the on-the-ground situation, and triangulate quantitative findings on priority materials and desk-based findings on diversion options.
Qualitative analysis
Findings from desk-based research and stakeholder engagement were added to a spreadsheet, using the template shown below in Table 6. This spreadsheet enabled assessment of the diversion options, barriers and enablers. In addition, it informed the analysis of policy options and unintended consequences of these options, and was used to conduct the feasibility assessment described below in Appendix D.
Table : Template of structural headings used to analyse qualitative data
|
Priority material |
Description of diversion option |
Limitations |
Upstream or downstream |
Current barriers |
Potential enablers |
Risks |
This initial feasibility assessment evaluates the viability of different waste diversion options for mechanically-treated fines (19 12 12), mechanically-treated mineral fines (19 12 09), and soils and stones (17 05 04) by considering their existing use in Scotland, research and development efforts, and regulatory and financial barriers. The Table A 2 below details the logic behind our assessment given in Section 6.5.
Note that this assessment serves more as a summary of Section 6 and a high-level guide for policy-makers, than an in-depth feasibility assessment.
Table A : Feasibility assessment methodology
|
Diversion option |
Lifecycle stage of diversion |
Key barriers |
Feasibility score (3 max) |
Feasibility score justification | |
|---|---|---|---|---|---|
|
Mechanically-treated fines (19 12 12) | |||||
|
Landfill cover/quarry cover, engineering and restoration |
End-of-pipe |
Demand exists, minimal barriers |
3 |
Common practice in Scotland, demand for landfill cover | |
|
Recycled aggregates |
End-of-pipe |
Low substitution rate, contamination risks, infrastructure investment lacking |
1 |
Variability of fines makes reuse challenging and current incentives make virgin aggregate use easier. | |
|
Land treatment and agricultural soil improvement |
End-of-pipe |
Contamination concerns, nutrient content inconsistency |
1 |
Regulatory restrictions in the UK – more limited land where mechanically-treated fines can be used | |
|
Gypsum fines recycling |
End-of-pipe |
Contamination risks, landfill tax incentives encourage disposal |
2 |
Existing recovery infrastructure, but purity issues and low cost to landfill remain | |
|
Remediation |
Upstream |
Need bespoke technologies, barriers to investment in infrastructure |
1 |
Some promising research, but not scaled commercially | |
|
Mechanically-treated mineral fines (19 12 09) | |||||
|
Landfill cover/quarry cover, engineering and restoration |
End-of-pipe |
Demand exists, minimal barriers |
3 |
Common practice in Scotland, but might waste nutrient rich fines that could be used in agriculture, providing a higher value | |
|
Recycled aggregates |
End-of-pipe |
Lack of steady supply, market uptake issues |
2 |
Exemptions exist, and some use is ongoing but low demand. | |
|
Land treatment and agricultural soil improvement |
End-of-pipe |
Requires permits, some contamination concerns |
3 |
Permitted in agriculture with waste management licensing exemptions | |
|
Remediation |
Upstream |
Need bespoke technologies, barriers to investment in infrastructure |
1 |
Some promising research, but not scaled commercially | |
|
Soils and stones (17 05 04) | |||||
|
Landfill cover/quarry cover, engineering and restoration |
End-of-pipe |
Long-term decline in landfill sites |
3 |
Common practice in Scotland | |
|
Recycled aggregates |
End-of-pipe |
Cost competitiveness with virgin aggregates |
3 |
Commercially used, but virgin materials remain cheaper | |
|
Remediation (e.g., soil washing) |
Upstream |
Limited adoption, investment barriers and high processing costs |
2 |
Underutilised in Scotland as it is costly but growing | |
|
Landscaping and construction |
Upstream |
Coordination challenges between projects |
2 |
Varies across projects | |
|
Fines upstream diversion (19 12 09 and 19 12 12) | |||||
|
Modular construction and material reuse |
Upstream |
Expensive upfront investment, scalability challenges |
1 |
Expanding in modern construction but cost barriers remain Future advances in AI will help | |
|
Deconstruction and material sorting (including sorting plasterboard) |
Upstream |
Lack of incentives, infrastructure and industry skill/common practice limitations |
1 |
Circular economy support exists, but still underdeveloped | |
|
Retrofit before demolition |
Upstream |
Predominantly policy/fiscal barriers |
1 |
Wide understanding that retrofit often has a better carbon impact, but fiscal policy and cost are a barrier | |
How to cite this publication:
Ross, V., Owens, H., Evans, S., Claxton, R., Kaczmarski, J., Chalmers-Arnold, I. (2025) ‘Scottish Landfill Tax: lower rate review‘, ClimateXChange.
DOI: http://dx.doi.org/10.7488/era/6063
© The University of Edinburgh, 2025 (publication year)
Prepared by Resource Futures on behalf of ClimateXChange, The University of Edinburgh. All rights reserved.
While every effort is made to ensure the information in this report is accurate as at the date of the report, no legal responsibility is accepted for any errors, omissions or misleading statements. The views expressed represent those of the author(s), and do not necessarily represent those of the host institutions or funders.
This work was supported by the Rural and Environment Science and Analytical Services Division of the Scottish Government (CoE – CXC).
ClimateXChange
Edinburgh Climate Change Institute
High School Yards
Edinburgh EH1 1LZ
+44 (0) 131 651 4783
If you require the report in an alternative format such as a Word document, please contact info@climatexchange.org.uk or 0131 651 4783.
Some of the data provided by Revenue Scotland was grouped to ensure confidentiality is retained, for example where there is only one operator responsible for a specific code. These grouped codes have been verified by the project team as containing mostly niche materials, and therefore excluded from the shortlist. ↑
This group contains a code for mixed household wastes (20 03 01). An insignificant portion of this code is expected to be landfilled at lower rate. As such, it was assessed separately from the niche materials that make up the remainder of this group (which are more likely to be landfilled under the lower rate). ↑
Diversion options for gypsum have been reviewed, as the upcoming ban on landfilling biodegradable waste may unintentionally make it easier to landfill gypsum. Currently restricted from co-disposal with biowaste, gypsum may no longer face this barrier once all landfills exclude biodegradable waste. ↑
This group contains a code for mixed household wastes (20 03 01). An insignificant portion of this code is expected to be landfilled at lower rate. As such, it was assessed separately from the niche materials that make up the remainder of this group (which are more likely to be landfilled under the lower rate). ↑
UK Government: Getting informed consent for user research ↑
Why it is important
A just transition to a net zero, climate resilient economy presents opportunities for businesses to develop in new areas.
To understand what those areas are, the Scottish Government asked ClimateXChange to commission an analysis of the strengths, weaknesses, opportunities and threats (SWOT) of Scotland’s existing and emerging net zero and adaptation economy.
The study developed a framework for assessing different sectors. It then identified 12 priority sectors where Scotland might have a competitive advantage in producing goods and services that would grow the nation’s net zero economy.
While the study was underway, the Scottish Government started work on a green industrial strategy. Evidence on priority sectors would also be relevant for these new areas of work.
How ClimateXChange supported policymakers
Researchers reviewed over 60 sectors and sub-sectors. From those, they identified 12 offering the greatest potential to deliver economic benefits and conducted a comprehensive SWOT analysis for each.
The work provided a range of metrics and insights. This enabled policymakers to make informed and strategic decisions on where the Scottish Government might focus in its Green Industrial Strategy.
Furthermore, the report included visuals that ensured findings were easy to interpret.
Impact
Green industrial strategy
The report has strengthened the evidence underpinning the Green Industrial Strategy’s focus on specific opportunity areas. It supports Ministers’ overarching aim of helping Scotland realise the full benefits arising from the global transition to net zero. Outputs from the study were the basis of strategic discussions on prioritisation in different sectors.
Action across sectors: just transition plans and the Climate Change Plan
The Scottish Government also used the report in other related work. For example, the section on heavy duty vehicles informed the development of the draft Just Transition Plan for transport.
The report will continue to be useful as government develops further Just Transition Plans and continues to consider the economic impacts and implications of work on the Climate Change Plan.
Furthermore, the lead policy team for the report found this work to be a useful basis for conversations with a diverse range of sector teams across government. Cross-government connections were vital to assess the validity of data being produced, such as on workforce and economic impact.
Enhanced evidence and collaboration
The report also prompted collaboration between the Scottish Government and Scottish Enterprise, an agency that supports business development and growth. The work provided a useful foundation for policy teams to engage more closely with Scottish Enterprise’s projects developing scenario-based projections of jobs and economic impact.
Further afield, the National Economic and Social Council of Ireland recognised the work as a very useful template for data gathering.
“The report has significantly improved the quality of our evidence base, helping us make informed choices on a range of projects such as the Green Industrial Strategy and just transition plans across sectors. It also fostered a collaborative effort with Scottish Enterprise by drawing on and shaping their work and approaches.”
– Jayne Winter, Net Zero Economy Team Lead
Scottish Government
Overall, the study provided a consistent framework for appraising different sectors, even where it is difficult to obtain comparable data. It had an impact in Scotland and provides an effective analytical template that could be applied elsewhere in the UK or in other countries.
Related reports
Economic opportunities in Scotland’s net zero and climate adaptation economy
Image credit: Julia Schwab from Pixabay