
Research completed in September 2024
DOI: http://dx.doi.org/10.7488/era/4915
This work was carried out in accordance with the requirements of the international quality standard for Market Research, ISO 20252.
Executive summary
This report sets out key findings from an exercise that mapped public engagement activities on the heat transition in Scotland.
The aim of the research was to help inform the delivery of the Heat in Buildings Public Engagement Strategy by addressing questions related to who delivers engagement activities and to whom, the type of activities and messages, and gaps in engagement.
We conducted a web search, interviews with experts from organisations involved in the heat transition and an online survey of organisations delivering public engagement activity.
Findings
Overview of ongoing activities:
- A wide range of organisations across the public, private and charitable sectors have been delivering public engagement activities on the heat transition in Scotland.
- The types of public engagement have also been varied, with the most common being advice services, workshops and information sharing online.
Target audience, messaging and accessibility as discussed by experts and organisations:
- Engagement activities were mostly open to the general public. There were also some specific target groups identified, including residents within a specific geographic area, homeowners, people in fuel poverty, low-income households and energy sector professionals.
- Despite attempts to engage a broad range of audiences, those actually engaged in the activities were typically more climate aware than the general public overall.
- Messaging that was focused on home energy efficiency and reducing energy bills, rather than the adoption of clean heating systems, resonated better with wider audiences in the context of the cost of living.
- Engagement on “simple fixes” (e.g. turning boiler temperature down) was therefore more widespread than messaging around bigger steps (e.g. installing a heat pump).
- Activities delivered through trusted messengers and existing local channels were accessible forms of engagement.
- Tailoring messages to the specific target audience was an effective approach to accessible engagement as it helped to improve understanding.
Gaps in public engagement identified by experts and organisations:
- Audiences under-engaged on the heat transition included private landlords, renters, professionals in the energy sector, young people and the digitally excluded.
- Lack of regulatory clarity on clean heat and energy efficiency was a key reason for the engagement gap among landlords and the energy sector.
- The upfront costs of transitioning were a barrier to widening reach among the general public, especially in the context of the cost of living crisis.
- Key messaging gaps in public engagement included:
- A lack of public understanding of heating systems.
- Insufficient practical and transparent advice on installing and operating clean heating systems.
- Interviewees thought that certain aspects of the transition, such as what clean heating systems are and how to install them, were not successfully communicated to the wider public due to their perceived complexity.
- They felt that communication about the efficacy of clean heating systems, based on real use cases, was lacking.
- There was a shortage of trusted messengers providing reliable, impartial advice, as well as a lack of tradespeople able to provide technical support on the practical aspects of the transition.
Conclusions
To ensure that public engagement on the heat transition builds on what has been done before and is effective in prompting action, consider:
- Prioritising the private rented sector, professionals in the energy sector and those who are digitally excluded:
- Firstly, engage with the energy and private rented sectors to drive engagement and action forward, for example by sharing information and practical advice among the wider public.
- Secondly, engage with the general public, emphasising the experiences of early adopters to build trust in the efficacy of clean heating systems.
- Tailoring messages to the audience:
- For industry professionals, provide clarity on the changes required and reassurance on the support available.
- For the general public, make it easier for those who are more highly motivated by the climate crisis to take action, so that there are more operational examples to encourage those who may be more hesitant to take action.
- Highlight the financial benefits and availability of grants and loans.
- Building trust:
- Improve the baseline public understanding of clean heating systems.
- Communicate transparently around the needs, benefits and risks of transitioning to a clean heating system.
- Use trusted messengers who are already embedded in local communities.
- Providing regulatory clarity, as organisations feel they cannot deliver effective public engagement activities without knowing if and when clean heat and energy efficiency regulations will come into force, and what specific changes will be required.
Introduction
This report presents the findings from research conducted by Ipsos on behalf of ClimateXChange and the Scottish Government, mapping public engagement on the heat transition in Scotland.
Background
Scotland’s climate change legislation sets a target date for net zero emissions of all greenhouse gases by 2045. The Scottish Government reports that domestic buildings account for around 12% of Scotland’s greenhouse gas emissions, and non-domestic buildings contribute another 7%. Urgently reducing emissions from Scotland’s buildings is therefore a crucial part of achieving net zero, and will require the majority of households in Scotland to change their heating systems. Plans for this are set out in the Scottish Government’s Heat in Buildings Strategy (HiBS). The process of transitioning heating from using fossil fuels to using clean heating systems, is often referred to as the ‘heat transition’.
To ensure success in decarbonising Scotland’s home heating, public engagement is key. Existing research by Consumer Scotland highlights a general lack of awareness among the Scottish public about the heat transition, clean heating systems, and low-carbon technology. Building on this, research conducted for ClimateXChange included recommendations about the ways in which messages around the heat transition should be communicated to the public, including making a positive case for change in a highly visible way, harnessing the influence of existing trusted messengers to deliver information consistently, and giving plenty notice in advance of any legislation being announce. The Existing Homes Alliance Scotland published a report in July 2023 which highlighted the need for clear and tailored messaging, backed up with accessible resources, to encourage action at the scale and pace required to reach net zero.
In this context, the Scottish Government published its Heat Transition Public Engagement Strategic Framework in December 2023 to guide its engagement work around clean heat and energy efficiency. The Framework aims to ensure the Scottish public are aware of and understand the changes required in the heat transition, know how to access support, can actively participate in shaping policy, legislation and delivery schemes, and importantly can take action in decarbonising their homes.
Research aims
ClimateXChange and the Scottish Government commissioned Ipsos Scotland to map existing public engagement on the heat transition in Scotland to help inform the delivery of the Heat in Buildings Public Engagement Strategy.
This public engagement mapping aimed to address the following research questions:
Who is delivering engagement activities?
What types of activities are being delivered?
Which audiences are being targeted?
What types of messages are being communicated?
How accessible are messages and activities?
Where are the gaps in engagement?
Method
The research involved three strands:
A web search to identify public engagement activities.
Interviews with 10 experts representing a range of organisations involved in the heat transition.
An online survey of organisations delivering public engagement activity.
A brief overview of each strand is provided below, and a more detailed methodology can be found in Appendix A.
Web search
First, a web search was conducted using defined search parameters and search strings (see Appendix B) in May 2024. The web search included a traditional search using Google and Google Scholar, and Ipsos’s proprietary social media listening tool, Synthesio.[1]
Over 2,500 references to public engagement across social media channels were reviewed and, from those initial results, 62 instances of engagement matched the inclusion criteria and were included in the analysis. The results from the web search also informed the sample development for the expert interviews and online survey, and the design of the interview topic guide and questionnaire.
Expert interviews
Interviews were conducted with 10 organisations involved in the Scottish heat transition from 30 May to 7 Aug 2024 (identified via web search and recommendations from the Scottish Government and ClimateXChange). The profile of expert organisations included a mix of charities/advice services, climate hubs, private companies, non-government organisations and industry bodies.
This strand of the research explored the different types of public engagement activities currently being delivered in Scotland in more detail. A topic guide was developed by the Ipsos research team and reviewed by ClimateXChange and the Scottish Government (see Appendix C). Interviews also helped to identify potential organisations for inclusion in the online survey sample.
Online survey
The third strand of the research involved a five-minute online survey with organisations delivering public engagement activities in Scotland to explore the purpose and nature of these activities. The questions were designed by Ipsos and reviewed by ClimateXChange and the Scottish Government (see Appendix D).
An initial sample of 78 contacts was generated by Ipsos through the web search and interviews, and the survey link was also shared by ClimateXChange and the Scottish Government, through various email networks and communications channels, to broaden participation.
The survey was live for five weeks, from 19 June to 24 July 2024, and 34 completed responses were received. Of these, 25 organisations reported that they had delivered some form of public engagement in the last three years.
Analysis
The data generated from the web search, interviews and online survey was used to map the range of activities (including details such as the type of activity, who delivered it, when it happened, who it was aimed at, and the topics covered). More reflective themes relating to impact, challenges and possible gaps in engagement were drawn from online survey results and the interviews.
Scope and limitations
The web search identified a wide range of public engagement activities across Scotland over a number of years. However, this search was not exhaustive, as it was limited to what was available online, and provided varying levels of detail depending on what was published. Data collected from interviews with experts provided more in-depth and reflective insights from a range of perspectives, but on a much smaller range of activities than that of the web search. Meanwhile the online survey provided insights on activities across a wider range of activities, but not in as great a depth, as those gathered from the interviews.
Using multiple data sources has enabled a more comprehensive understanding of public engagement activity in Scotland than any one source would be able to provide. However, it is important to acknowledge that the research parameters may have overlooked some forms of public engagement (particularly those at a small community level or those not promoted online). Furthermore, not all perspectives on the heat transition (such as those of the intended target audiences) have been captured.
The online survey was an open link and responses were gathered anonymously. This means that the data may contain multiple responses from the same organisation and duplication of responses between the survey and web searches. Interviews were also conducted confidentially, and so their views have been reported anonymously. Any examples or organisations mentioned in the report are taken from publicly available information and it should not be assumed that they correlate with organisations taking part in either the depth interviews or online survey. Where more detailed case studies are provided (e.g. in relation to Impacts), these have been shared with the permission of the main delivery organisation responsible.
Lastly, online survey results are based on a small sample and so should be read and interpreted with this in mind. Where percentage figures don’t sum to 100, this is due to computer rounding. Where counts do not sum to the base, this is due to questions allowing multiple responses.
Public engagement on the heat transition
This chapter provides an overview of the types of public engagement that have taken place in Scotland between October 2021 and May 2024 and the organisations delivering them. It addresses the following research questions:
- Who is delivering current heat transition-related engagement activities and messaging in Scotland?
- What types of activities are being delivered?
This chapter also explores awareness of the Scottish Government’s Heat in Buildings Strategy among the organisations delivering public engagement.
- A wide range of organisations from across the public, private and charitable sectors, have been delivering public engagement activities on the heat transition in Scotland.
- The types of public engagement have also been varied, with the most common being advice services, workshops and information sharing online.
- Awareness of the HiBS is high among those delivering public engagement.
Who is delivering current heat transition-related engagement activities and messaging in Scotland?
The web search, survey and expert interviews identified a range of organisations delivering public engagement activities in relation to the heat transition since October 2021, including:
- Charities, such as One Parent Families Scotland, Age Scotland, Under One Roof, and Community Energy Scotland.
- Non-profit organisations and social enterprises, such as Nesta, Scarf and Energy Action Scotland.
- Community groups, such as climate hubs and local interest groups.
- Private sector organisations, such as UK energy companies.
- Advice and support bodies, such as Energy Savings Trust (who administer the Scottish Government’s Home Energy Scotland service).
- Collectives, consortiums, networks or member groups that include organisations representing a range of sectors (e.g. Built Environment-Smarter Transformation and the Poverty Alliance).
- Local authorities.
- Education and research institutes, such as the University of Strathclyde and the Energy Training Academy.
The Synthesio (social media listening) search provided an indication of the extent of activity and messaging from particular organisations, based on volume of online mentions (see Figure 1). This does not necessarily mean that these organisations have delivered more engagement, but rather reflects higher levels of posts on the heat transition by organisations directly or by other actors citing them.
Figure 1. Organisations delivering public engagement by volume of online mentions

What types of activities are being delivered?
The types of activities being delivered were broad, and included advice services, workshops and various types of information and knowledge sharing. The online survey data and Synthesio search provided a snapshot of this range (see Figure 2), which was also reflected in the interviews.
Figure 2. Types of public engagement activities

Among the most common types of public engagement activity were advice and support services, which have been delivered by a range of organisations (including non-profits, non-government bodies, charities and community groups). This was a broad category encompassing free impartial advice on energy saving measures and keeping homes warm, through to practical advice on installing renewable technologies and verifying providers of retrofitting work. A range of advice and support services were accessible online, in-person and via telephone.
Advice and support services example
Energy Saving Trust is an independent organisation supporting households and businesses towards decarbonisation, and is one of the Scottish Government’s main partners in addressing the climate emergency.
Their Green Homes Network connects those interested in low carbon heating with householders who have installed clean heating systems through a database. Households give permission to post case studies so others can find out about their journeys and contact them for further advice. Households may also be invited to speak at webinars or to the press about their conversion to a new heating system.
Workshops were delivered by a range of actors (including local authorities, charities, non-government organisations, social enterprises and community groups). Some were one-off events while others were run as a series of workshops. The aims of the workshops included: to generally increase knowledge and understanding around the Scottish Government’s heat policy, to help community groups and individuals reduce costs, and to inform individuals on the availability of grant funding for heat transition projects and energy efficiency improvements.
Workshop example
Transition Black Isle is a community group that aims to help Black Isle communities respond to the climate emergency and to encourage non-car travel, local food production and energy saving measures. The group organised a series of workshops in March 2022 on low carbon home heating which involved expert speakers and group discussions:
- Session 1 explored ways to make houses warmer and cheaper to heat without compromising air quality or risking damage to building fabric.
- Session 2 identified various low carbon methods of home heating and circumstances which suit each approach.
- Session 3 covered managing these changes, including financial support, choosing contractors and incorporated advice from those who had already been through the process.
Lectures and talks were delivered by organisations of all types. Some events were open to the public, either as stand-alone events or pop-ups as part of other events or festivals, and provided opportunities to learn about opportunities and risks in making properties more energy efficient. Others engaged industry professionals specifically and provided information on the Scottish Government’s energy policy, availability of funding, best practice for retrofitting schemes and challenges in heat pump deployment. There was also evidence of employee engagement, with organisations being invited to give talks to advise employees on ways to save energy at home.
Training and knowledge sharing were typically targeted at industry and policy makers. These took the form of panel discussions and events, as well as online networks/hubs to facilitate knowledge exchange and practical training modules on aspects of the heat transition.
Training and knowledge sharing example
HeatSource is a programme funded by Scottish Enterprise that aims to better equip companies involved in manufacturing, installation, training and the wider supply chain to deliver clean heating systems.
The programme seeks to support the decarbonisation of Scotland’s built environment through the creation of an online information hub to help industry maximise the opportunities around new zero carbon heating.
Various organisations have provided information online and delivered public information campaigns aimed at the general public, including:
-
- Get a Heat Pump – a website that provides information on what a heat pump is, how to get one installed and the associated costs (Nesta).
- Heat pump heroes – an annual awareness-raising campaign to promote conversion to heat pumps (Home Energy Scotland).
- Money-saving boiler challenge – a public-facing campaign which aimed to raise awareness about how to use energy more efficiently and save on bills (set in the context of the cost of living crisis) (Nesta).
Other public engagement activities included:
- Showcases, including live demonstrations and trial installations of heat pumps in different types of homes to gather user feedback.
- Consultations, typically delivered by community groups to gather responses to the Heat in Buildings (HiBs) proposal and the Scottish Local Heat and Energy Efficiency Strategies (LHEES).
- Advocacy work, such as speaking up for consumers who have had issues with clean heating systems (e.g. increased energy costs) and opinion pieces published in media outlets to raise awareness and tackle myths around the heat transition.
Awareness of Heat in Buildings Strategy
Among organisations that have delivered public engagement activity and responded to the online survey, the majority (88%) reported knowledge of the HiBS, of which just under two-thirds (64%) said they knew a fair amount or great deal about it. Just over one in ten (12%) had either heard of the strategy but knew nothing about it, or had never heard of it (see Figure 3).
Figure 3. Awareness of the HiB strategy among survey participants

Experts interviewed for the research also reported that their organisations had high levels of awareness and understanding of the HiBS. This was based on their existing relationships with the relevant policy teams in Scottish Government, involvement in the initial consultation process, and/or providing responses to it. Other ways in which experts mentioned becoming familiar with the strategy included through the introduction of new build heat standards and working with local authorities.
Target audiences and messaging
This chapter provides an overview of the types of public engagement that have taken place between October 2021 and May 2024 and the organisations delivering them. It addresses the following research questions:
- Who is the target audience of these activities?
- What types of messages are being communicated?
- How accessible are the activities being delivered?
- Activities were mostly open to the general public, however, there were some target groups identified (e.g. residents within a specific geographic area, homeowners, people in fuel poverty, low-income households and energy sector professionals).
- Messaging focused on home energy efficiency and reducing energy bills, rather than the adoption of clean heating systems, was felt to resonate more with wider audiences.
- Engagement on “simple fixes” (e.g. turning boiler temperature down) was therefore more widespread than practical messaging around bigger steps (e.g. installing a heat pump).
- Activities delivered through trusted messengers and existing local channels were felt to be more accessible forms of engagement. Tailoring messages to the specific target audience was also a key consideration.
- However, there was a clear distinction between intended target audiences and those actually being engaged, who typically were those who were already more climate aware in any case.
Who is the target audience of these activities and messaging?
Public engagement activities were mostly targeted at a broad, general public audience. Evidence gathered from the Synthesio search, interviews and survey showed that activities were often advertised as open to all, rather than targeting a specific demographic. This was driven by the understanding that there are high levels of concern about climate change among the general public (an assertion supported by public opinion research), and that the environmental impact of energy use affects everyone, which requires a wide reaching approach to engagement.
However, the research highlighted a clear distinction between audiences being targeted and audiences actually being engaged.
Intended target audiences
While most engagement activities were targeted at the general public, the research also found evidence of some activities targeted at specific groups, including local residents of a specific geographic area, people in fuel poverty and low-income households, homeowners, and energy sector professionals (see Figure 4).
However, it should be noted that delivery organisations responding to the online survey often mentioned targeting multiple different groups rather than one group in particular.
Figure 4. Target audiences (number of mentions by organisations delivering public engagement activities)

Public engagement at regional or local levels was found to be happening across Scotland, with most events concentrated in Edinburgh and Glasgow and a smaller number of activities being delivered in East Lothian, Falkirk, Perth and Kinross, Dundee, West of Scotland, Fife, Aberdeen and Aberdeenshire, and Highlands. There was some evidence of public engagement activities happening on the islands, highlighted by experts, however this was more limited (which could reflect the fact that engagement was more localised and less promoted online).
People in fuel poverty and low-income households were frequently identified as a key target group for engagement activities. However, evidence from the Synthesio search and from the interviews indicated that the primary focus of those activities was encouraging simple energy efficiency changes that would lead to lower energy bills rather than promoting a transition to clean heating systems.
There was also some evidence of engagement targeting energy sector professionals (e.g. through conferences, knowledge-sharing and training). However, there was a broad view among experts that this group had not been sufficiently engaged (see Gaps).
Audiences actually being engaged
While activities were advertised as open to all (with some targeting), experts observed that they tended to draw interest from those who were typically more climate aware, highly engaged on the topic of sustainable home energy solutions, and more involved in their community anyway. This is consistent with earlier research conducted for ClimateXChange which found that early adopters tend to have higher than average knowledge of, and interest in, climate change as well as time and willingness to research energy alternatives.
In line with this research, the demographic profile of those who experts perceived to be more engaged was described as homeowners over the age of 40 with disposable income. It was also suggested that men were more likely to be interested in installing low-carbon heating technology than women. Experts cited lower attendance rates among other groups as a particular challenge to widening reach (see challenges).
What types of messages are being communicated?
Messaging around the heat transition mainly focused on energy efficiency rather than the adoption of clean heating systems, according to both the survey (see Figure 5) and Synthesio findings.
The focus on energy efficiency measures was seen to be driven by the cost of living crisis and rising energy prices. Experts highlighted energy efficiencies and reducing energy bills as messaging that had resonated most with the public and led to greater engagement. Some examples of this type of messaging included:
- “Warmer Homes, Cheaper Bills, Greener Lives” (an event organised by Sustaining Musselburgh and advertised on Eventbrite).
- “How to save cash with a single change to your boiler settings” (from Nesta’s Money-saving boiler challenge).
- “To help you lower your energy bills and have more energy efficient homes, whilst also reducing your carbon footprint” (from Thurso Community Development Trust’s home energy advice webpage).
Organisations that had delivered engagement activities with more of a focus on retrofit and the installation of heat pumps reported using the benefit of cheaper bills as a “pitch” to increase engagement among the wider public. This type of messaging was considered to resonate more with the public than messaging around heating systems.
There was also a perception among experts that the public have a limited understanding of their current heating systems. Experts felt that this, coupled with existing financial pressures, was contributing to a lack of curiosity about installing greener alternative systems. As highlighted in the examples above, some delivery organisations have focused on smaller, easier steps to address this and encourage engagement.
Organisations reported that they had found messaging focused on easy steps and “simple fixes”, such as turning down the flow temperature of a boiler, to be more effective than discussions around new heating systems. This reflects other recent research findings on heat transition communication, which suggested that messaging should be breaking down behaviour into small steps. Experts also felt that ensuring a basic understanding of how existing heating solutions affect bills would be an essential first step to engaging households about further decarbonisation measures beyond energy efficiency.
The web search and online survey found more limited evidence of practical messaging around bigger steps such as how to install and operate clean heating systems like a heat pump. Experts felt that this type of messaging was primarily engaging people who were already motivated to change their heating system.
How accessible are messages and activities being delivered?
Delivering engagement through trusted messengers was highlighted by experts as one of the more effective approaches in terms of accessibility. For example, engaging the public through existing community networks was a way in which some organisations had engaged hard-to-reach demographics, such as older people, people in poverty and vulnerable groups.
“That type of engagement [with vulnerable demographics] has to come from local trusted messengers – it’s about building that relationship. It’s not going to come from anywhere else for the most vulnerable. I think that is where there’s a role for community organisations to play.”
Climate Hub (interview)
Experts also highlighted local community events that are already well-attended by local residents as an effective way of promoting transition messaging to the broader public and extending the reach of engagement beyond the climate aware audiences. For example, one organisation had delivered entertainment for children at family-friendly local events to engage parents.
Synthesio search findings suggest that most activities had been held either online or in hybrid form and experts felt that this had promoted greater accessibility across Scotland. Social media was also used as a method of advertising and delivering engagement, particularly to reach younger demographics more effectively. Nevertheless, while the value of online activity for promoting wider reach was acknowledged, face-to-face engagement was still widely considered by experts to be the most effective.
Among the activities delivered, there was also evidence of public awareness campaigns utilising TV and printed media to reach a broad audience, including Nesta’s “Money Saving Boiler Challenge”, Citizens Advice Scotland’s “Big Energy Saving Winter” and Smart Energy GB’s “Smart Energy Heroes”. According to experts, wider public campaigns (in combination with simple and accessible messaging) have been most accessible for members of the public not already aware of, or engaged on, energy and climate issues.
Delivery organisations also reported the use of simple and clear messages to improve the accessibility of their public engagement activities. Experts felt that emphasising the energy efficient changes that individuals could easily adopt in their homes and outlining the financial benefits of making them was most effective in improving understanding of the impact of heating systems on the climate. In particular, the importance of clearly presenting the financial case for change was highlighted, recognising the challenges people face currently with their energy bills.
“The challenge is making sure the information is really simple and easy to access and reflects the fact that people are in crisis at the time – just transition terminology, for example, doesn’t work.”
Charity (interview)
Using informal (“chatty”) language in communication with the wider public on energy advice was felt to have promoted both accessibility and trust. The importance of positive, hopeful and uplifting rhetoric was highlighted, such as an emphasis on the short-term benefits (e.g. immediate decrease in energy bills). This was seen as particularly effective for effectively reaching low-income households and those in fuel poverty.
“The scale of the transition is immense and the potential opposition to some of what’s needed is also significant, so there’s a need to make sure that there are as many positive and supportive voices as possible to counter the noisy negativity.” Charitable organisation (interview)
Experts also emphasised the importance of tailoring messages to the specific target audience as a way to improve accessibility and understanding of information. For example, one expert described how their organisation changed the focus and language of any transition-focused activity depending on who they were aiming to reach. When speaking to tenants, they would highlight the links between climate change and heating and assert the case for the need for transition, while when addressing flat owners, they would discuss the specific challenges this group faces and focus on heat networks rather than heat pumps as a solution.
Some experts reported offering advice and information services in different languages and providing materials accessible to people with different reading abilities. However, among those delivering engagement, evidence of organisations making these accessibility considerations was limited.
Despite these considerations for delivering accessible engagement, our interviews identified accessibility as a challenge. This related primarily to the complexity of the topic and the highly technical language of certain aspects of the heat transition which was widely considered to be inaccessible and, therefore, limiting the reach of engagement beyond those who are already engaged on climate issues. Some examples that were recognised as particularly difficult for the wider public to understand included EPC ratings and the practicalities of choosing and installing clean heating systems. This is discussed in more detail in the following chapter.
Reflections on the effectiveness of public engagement
This chapter reflects on the perceived impact of public engagement activity and the challenges that delivery organisations have experienced, before summarising any future public engagement being considered or planned by delivery organisations who participated in this research.
Key findings
Impacts
- Simple messaging that focuses on easy energy efficiency actions and outlines financial benefits were felt to be the most effective forms of public engagement, building trust through the use of trusted messengers.
- Building trust with the audience was identified as one of the most important aspects of delivering successful engagement. Community-level engagement was seen as an effective way to foster that trust and reach hard-to-reach groups.
Challenges
- Lack of regulatory clarity on clean heat and energy efficiency was identified as the main barrier to delivering effective engagement.
- Misconceptions and lack of public awareness around sustainable heating solutions was also seen as a challenge.
- The cost of living crisis was recognised as a barrier to widening the reach of engagement. In this context, the general public was seen as unwilling to accept the upfront cost of transitioning.
- Certain aspects of the transition, such as installation of clean heating systems, were not seen to have been successfully communicated to the wider public due to topic complexity and specialised language that is not widely understood.
Impacts
Those delivering public engagement largely felt that their activities had had a positive impact on people’s understanding of issues relating to the heat transition in Scotland (see Figure 5). Among those taking part in the online survey, 89% reported that their audience’s understanding of the topic had improved as a result of engagement. There was less certainty over the extent to which public engagement had led to action, with fewer than half of organisations (44%) reporting that those activities had led to action and 26% reporting that individuals had decided to switch to a clean heating system as a result of the engagement.
Figure 5. Perceptions of impact 
Both the interviews and the Synthesio search also identified a number of impactful initiatives centred around simple energy efficiency actions that organisations felt had been effective at reaching the broader public and prompting people to action small changes, often framed around saving money as well as reducing carbon emissions (see Figure 6).
“The stuff that lands better with people, unsurprisingly, is – there’s a pretty quick fix that you can organise yourself and it saves you money.” Charity (interview)
Community-driven engagement was also highlighted by sector experts as a success factor in terms of reaching certain demographic groups, such as older people, families in in-work and fuel poverty and vulnerable groups (see figure 6). This was felt to be important because of the perception that community organisations enjoy high levels of trust from members of the community. Building trust was identified as one of the most important aspects of delivering effective engagement.
Figure 6. Evidence of impact
Money Saving Boiler Challenge Campaign
The campaign was delivered by Nesta, in partnership with energy providers and other organisations in the energy industry, which focused on providing basic and simple energy efficiency advice. The activity aimed to reach the general public and convince people to turn down flow temperature on their boiler, thus reducing carbon emissions and energy costs.
The campaign also aimed to promote better understanding of existing heating systems and their environmental impact among the general public. This activity was part of a wider campaign on decarbonisation.
Following the campaign, close to 240,000 households turned their boiler flow temperature down, resulting in savings of £112 per year for an average household and a reduction of carbon emissions by 37,000 tonnes.[2]
Success factors:
- Simple and straightforward messaging that resonated with people in the context of the cost of living crisis.
- Promoted small and easy changes.
- Partnership with trusted voices – public-facing organisations offering energy advice and energy providers.
- Clearly communicated individual financial benefits of making the changes.
- A wide public campaign that was advertised on TV and mainstream media.
Home Energy Advice Portal
The web portal was developed by Thurso Community Development Trust together with the Highlands and Islands Climate Hub.[3] The website aims to improve pathways to support and uptake of grants by providing energy advice and a comprehensive overview of the energy support services available to residents in Scotland. The portal is accessible to all but is aimed primarily at local community organisations. It provides training to staff and volunteers in offering energy advice, recognise struggling households most in need of energy support, how to approach them and signpost residents to local energy service providers and financial support.
As of May 2024, 435 community groups in the region had been trained on the portal, which has led to improved knowledge and confidence among staff on the topic of energy. The portal has been actively used, with an average of 3,000 hits per month and approximately 5,000 people supported through it to date. It has also reached some hard-to-reach and vulnerable groups, including older people and low-income families.
Success factors:
- Clear and accessible messaging.
- Community-based engagement.
- Use of trusted voices in the community.
Challenges
The research identified a range of challenges in delivering engagement that were perceived to have negatively impacted attendance rates and limited overall effectiveness.
A perceived lack of clarity around clean heat and energy efficiency regulations was one of the key challenges identified in the interviews. There was a shared sense that public engagement activities would be limited in their effectiveness until the legislative requirements are known. Experts felt there had been frequent changes in proposed legislation in the past and that there is currently a lack of clarity around the requirements for properties, which has created confusion among some groups and limited the reach and effectiveness of some engagement activities. Landlords in particular were identified as a group at risk of disengaging on the topic until there is clarity on what they will be required to do. The perceived frequency of changes in proposals was felt to have made it difficult for organisations to deliver effective public engagement because they feel they are unable to provide straightforward advice.
“Until there’s clarity on what the requirements are going to be, it’s difficult to go out there with firm messaging. You always have to caveat your messaging with “it’s just a proposal and it might change.”
Private company (interview)
It was also suggested in the interviews that the concern over further changes in requirements has caused hesitation among organisations to engage with the public until the legislation is finalised.
“[When] things can still change, that’s a disincentive to people actually doing works in their properties. Because they don’t know if the money they’re going to spend and the improvements they’re going to make are going to be beneficial when it comes to complying with possible future standards because we still don’t know what those possible future standards are going to be.” Private company (interview)
Representatives of the homebuilding sector highlighted that while homebuilders “are ready, understand and are committed to what needs done in supporting the transition”, there are concerns within the sector regarding limited communication from the Scottish Government about availability of the technology required to support the transition.
At the same time, interviewees stressed that there are still misconceptions, misinformation and lack of public awareness around sustainable heating solutions. It was suggested that the general public is still widely uninformed about the costs associated with the transition and whether low-carbon technology would be an effective heating solution for their home. Moreover, some stakeholders suggested that there is confusion around the different regulations in England and Scotland.
“…There’re still too many barriers to retrofitting – heat pumps are still considered pretty unusual and there’s a lot of myths, misinformation and misconceptions around how effective low-carbon tech is, which highlights the need for the public engagement strategy.” Membership organisation (interview)
The wider socio-economic context of the cost of living crisis was highlighted by experts as the key structural barrier to engaging the general public in the conversation about the heat transition and decarbonisation, particularly given the upfront costs of retrofitting and installing clean heating systems. They felt that, for most people, the kinds of interventions that will be required for the transition would be unaffordable.
“There is certainly a general gap in terms of people wanting to decarbonise their homes because of cost.” Private company (interview)
It was suggested that the public would be largely unprepared and unwilling to accept the cost of transitioning upfront based on a promise of future energy savings.
“We’re considering how we can get that messaging out to the public to make the public aware of the changes that will be required of them – yes, it might cost them more upfront but it should create longer- term benefits – but I don’t think the public is ready to make that connection yet and I don’t think any government messaging that I’ve seen to date has been explicit about that.” Private company (interview)
The complexity of the changes required and language accessibility around those changes was also identified by experts as a significant challenge. It was suggested that the language around the heat transition (e.g. clean heating systems) is specialised and requires a certain level of knowledge on the subject. It was therefore felt to be less accessible to people who don’t already have awareness on the topic.
“The challenge is making sure the information is really simple and easy to access and reflects the fact people are in crisis at the time – just transition terminology, for example, doesn’t work.” Statutory body (interview)
Despite attempts by organisations delivering engagement to address this challenge, such as by delivering energy advice through simple messaging, it was felt that other aspects of the transition such as installation of new heating systems have not been successfully communicated in a way that can be more widely understood. One expert, reflecting on their own experience installing a clean heating system, commented that even they found it difficult to navigate existing advice despite being highly engaged and knowledgeable on the topic.
“The challenge is that we were asking people to do the absolute low-hanging fruit thing in terms of decarbonisation of heating. So, it’s not as simple to take that framing – do this simple thing and save money – to almost any other part of the heat transition. The rest of the message is much harder.” Charity (interview)
Notwithstanding these challenges, over half of organisations who completed the survey (59%) and several of the interviewees said their organisations planned to deliver public engagement activities on the heat transition in Scotland in the future. These were mainly charities, but also included a range of other organisation types mentioned in Chapter 3. The types of activities planned included a continuation of existing advice and support services and information sharing campaigns, as well as further workshops or knowledge sharing events and new pilot schemes (such as for retrofitting).
Delivery organisations mentioned that these future activities would be open to all, but some specific target groups included homeowners, the social rented sector (landlords and tenants), those in fuel poverty, those living in flats, people with protected characteristics, and small businesses. It was felt that schemes like the Green Homes Network and Heat Pump Heroes should be promoted more widely to encourage further uptake of clean heating systems.
However, there was also reluctance among delivery organisations to carry out further public engagement until more is known about Scottish Government policy on the heat transition and the specific requirements needed for the different target groups.
“It is not worth individuals investing in bespoke renewables or low carbon heating systems. We need to know more about when the heat networks will be coming.” Charity (online survey)
Overall, while public engagement efforts have made good progress in raising awareness of the heat transition, substantial challenges remain in translating understanding into widespread action.
Gaps in public engagement
This chapter addresses the final research question: where are the gaps in engagement?
While the research has identified a range of different engagement activities that are reaching the broader public as well as targeted demographic groups, it has also identified some clear gaps in engagement. The identified gaps broadly relate to target audiences and messaging, but also relate to potential messengers (i.e. those who could have a role in supporting public engagement on the heat transition).
Key findings
- Audiences identified as having been under-engaged on the heat transition included private landlords, renters, professionals in the energy sector, young people and the digitally excluded.
- The key messaging gaps in public engagement include addressing the general lack of understanding among the public about current heating systems, as well as insufficient practical and transparent advice on installing and operating clean heating systems.
- Using existing case studies was also felt to be lacking, but could provide an opportunity to show how the technologies have been implemented in Scotland and elsewhere.
- A general lack of trusted messengers providing reliable and impartial advice was also identified, as well as those able to provide technical support on the practical aspects of the transition.
Target audience
Delivery organisations responding to the online survey felt that most groups of people would benefit from support or information on the heat transition in Scotland, with young people being a notable exception (Figure 7). Experts interviewed suggested that, although public engagement activities have largely been open to all because the transition is seen as an issue that will affect everyone, there were some groups who should be prioritised. The top four groups who would benefit from more information on the topic, as identified in the survey, were people in fuel poverty, homeowners, low-income households and landlords (see Figure 7).
Figure 7. Groups who would benefit from support

As highlighted in the previous chapter, experts suggested that there had been limited engagement with private landlords. This was reflected in the survey results too, with 77% of participants highlighting landlords as one of the groups who would benefit from support or information on the heat transition. This was seen as an important gap to address, since private landlords are expected to play an essential role in driving the heat transition forward and to be directly affected by the upcoming regulations around clean heat and energy efficiency under the current HiBS.
Experts perceived that the benefits of making the transition were not clear to landlords who would be bearing the costs of retrofit, leading to a reluctance to engage on the subject. Stakeholders who had conducted activities aimed at this group said that engaging with them had proven particularly difficult because of the sector’s resistance to being regulated, with both individual landlords (and some organisations representing them) pushing back and advocating against the legislation.
However, it was also acknowledged that responses to the HiBS have varied across this group. Some landlords, particularly the more climate conscious, were described as “very keen” to make sustainable improvements, but it was felt that a lack of clear and consistent information on the extent of upcoming regulations has held them back from taking action.
“It’s such a shame because people will phone us up – they have the money and the inclination to do the work and I have to tell them – actually, you’re better off not doing the work and spending the money just now because we don’t know what the requirements are going to be.”
Membership organisation (interview)
Lack of information and means to take action were felt to be even more of an issue in relation to renters. Out of all 62 public engagement activities identified through the Synthesio search, only two were targeted directly at tenants. Moreover, 66% of survey participants believed that private renters would benefit from more advice on the heat transition and 63% said the same in relation to social housing renters. Experts interviewed for this research felt that renters have been widely disengaged from the topic because they feel very limited in their power to make any changes in a rented home and the resources advising them are sparse. Moreover, it was suggested that renters were largely apprehensive about discussing the transition with their landlords due to concerns about losing housing in a competitive rental market.
“Those in rented accommodation often don’t know who to turn to – you may know that certain property standards exist but are not necessarily able to enforce them. In a rental market where renters are under pressure and aware that there is competition to rent, it doesn’t encourage you to speak to your landlord about these additional measures, for fear of losing housing.” Charity (interview)
Experts therefore perceived that those renting from private landlords would benefit from more sources offering practical advice on what changes they can make and how to discuss these with their landlords. In relation to social housing tenants, experts suggested that messaging should focus on building a stronger case for the need for transition. They felt that it was important to ensure that social housing tenants understood why retrofitting works were being carried out in their homes and what the benefits would be, and that they did not feel like the changes were being imposed on them. This echoes findings from the 2024 research on social housing decarbonisation conducted for ClimateXChange which highlighted the importance of tenant engagement and agreement prior to conducting decarbonisation works.
Limited engagement with professionals working in the energy sector was highlighted as a substantial gap in engagement on the heat transition. The Synthesio search and expert interviews identified some activities targeted at industry professionals being delivered, including professional conferences, training and workshops. However, it was widely felt by experts that this group has not been sufficiently engaged.
Industry-level engagement was described as a missed opportunity by experts who considered industry professionals and energy service providers as trusted messengers. It was felt they could provide technical and tailored advice to the public to mitigate the challenge highlighted earlier of poor understanding of clean heat technologies (see Challenges).
Beyond being a potential engagement opportunity, this gap was also seen by some experts as a risk; for example, if heat engineers do not understand clean heating systems themselves, they may provide incorrect advice to consumers. A comprehensive nationwide effort was deemed necessary to address the gap, and a particular focus on addressing any training or skills gap in rural areas.
Across the interviews, there is a widely shared sentiment that young people were one of the groups who have been least engaged on the heat transition. Experts suggested this related to the cost of living and the availability of affordable housing being more prevalent and pressing challenges for this group. It was also partly explained by young people in the rented market having limited agency to make any energy saving changes to their homes (with that responsibility resting upon the landlord) and therefore considering the heat transition as having limited personal relevance.
“Young people are not thinking about how they heat a home because they’re just trying to find a home in the first place. […] There’re so many issues in terms of housing for young people – particularly, if they are in the rented sector, they usually have no control over how that home may be heated.” Climate Hub (interview)
Despite these reflections expressed during the interviews, survey findings suggest that organisations involved in delivering engagement did not consider young people as a group that would benefit from more advice on the heat transition, with no participants identifying this as a priority group.
While it was felt that activities being delivered online have enabled broader participation (see Accessibility), it was also acknowledged by experts that those who are digitally excluded are potentially being left out of the conversation. Although organisations such as Scarf and HES do provide multimodal advice (via telephone, in-person, or online), these are often promoted online which experts felt could be limiting reach.
Messaging
One of the main perceived messaging gaps was addressing the lack of understanding among the general public about their existing heating systems. It was felt that this lack of awareness could act as an obstacle to the success of the longer-term strategy for decarbonisation, as people are unlikely to take action on changing their boiler to a different heating system if they do not fully understand the current one. Experts highlighted that energy efficiency advice promoting better understanding of how heating systems work and their impact on the climate should be a pre-requisite for any required action on the transition.
Interviewees also widely felt across interview that insufficient practical advice had been offered to the wider public around how to install and operate clean heating systems. This gap was closely linked to the limited engagement with the energy sector professionals who are seen as the key actors who would be able to offer such advice. Experts contrasted the availability of sources offering grant and funding support – which was felt to be plentiful – with the lack of reliable sources offering tailored practical advice.
“If you’ve got a property and you have absolutely no idea whether it has a wall that can be insulated, there are few sources that you can go to for advice – some of them are great and some of them aren’t so great. So, it’s very difficult when it comes to actually making changes.” Membership organisation (interview)
It was also stressed by some experts that there needs to be transparency in the practical advice about the things that can go wrong and any potential risks around the transition to ensure that consumers are making an informed choice and are equipped with the practical knowledge of what to do if issues arise. For example, some experts reported engaging with members of the public who had transitioned to clean heating systems and had experienced issues such as an increase in energy bills but did not know how to deal with those issues and could not find information about them. It was suggested that the lack of transparency around potential risks, coupled with negative experiences such as these, could limit progress on the heat transition.
“Once something has been installed, people need to be clearly shown how to use this system and that they’re not left with something that they don’t know how to work. […] we risk putting people into more expensive systems when they’ve been told they’ll be able to save money […] We’re sitting on quite a lot of evidence around where things aren’t working particularly well or where they can act against the just transition, e.g. increasing costs.” Statutory body (interview)
However, experts also emphasised the importance of demonstrating the efficacy of these heating systems, by showing how they have been implemented in homes across Scotland and in other countries. It was also felt that the experiences of those adopting low-carbon heating technologies could be amplified. By drawing on and learning from real-life experiences, whether positive or negative, it was felt that this could help to build trust in the systems and encourage more widespread uptake over time.
One expert also suggested that public engagement on the heat transition should focus more on heat networks. This was felt to be lacking in current discussions but a likely solution for lots of people, particularly those living in flats.
Messengers
When it comes to those delivering engagement and communicating these messages, despite sharing some examples of engagement activities delivered through trusted messengers, experts shared a view that there is a general lack of impartial and reliable sources offering tailored practical advice on managing clean heating systems. This was seen as significant given the importance of building trust in, and understanding of, clean heating systems for effective engagement (see Section 5.2).
Experts defined trusted messengers in different ways. Some considered private energy providers and installers of clean heating systems to be trusted voices given their technical expertise on the matter and consumer-facing branding. Others felt that local community organisations trained in providing energy advice should play that role as they are embedded in communities already and seen as trusted sources.
Another suggestion was that there should be a separate group of messengers who are impartial (i.e. not private contractors) and able to provide technical and tailored advice to people depending on their property, location, and circumstances. This group was seen as a missing link in the process which could help connect people with verified installers.
“If someone approached us asking if we could recommend someone they could speak to about insulating their property, I honestly don’t know where the best place for them to go to would be. It would be nice if somebody could tell us where we can signpost them to. You don’t necessarily want a contractor, you want someone who could give you independent advice on what you best options are, what the likely cost would be and ideally signpost you to some reliable contractors. It feels like there is a missing stage in the process.” Membership organisation (interview)
Reflecting on the gaps in audiences, messages, and messengers, there was a dominant perspective that more needed to be done to drive effective public communication and engagement activity on the heat transition in Scotland. One expert suggested that they would benefit from more guidance and insight into the effectiveness of the Scottish Government’s own engagement on the topic, as this would help organisations when developing their own engagement strategies.
Conclusions
This research has identified several considerations for ensuring future public engagement on the heat transition builds on what has be done before and is effective in prompting action.
Prioritising groups
Delivery organisations felt that public engagement activities should be open to all on the basis that the heat transition will affect everyone some way. However, certain priority groups were identified, including:
- The private rented sector, as landlords will be expected to play an essential role in driving the heat transition forward under the current HiBs proposals, which would require landlords to make energy efficiency improvements by 2028, and tenants will be affected by the changes.
- Professionals in the energy sector, including energy providers and engineers who can be trained in clean heating systems, amplifying messaging around the transition, and providing tailored technical advice to households.
- Those who are digitally excluded, who may not be accessing the full range of engagement activities given so much of it is being promoted online.
It was suggested that there should first be a focus on engaging professionals in the energy sector (e.g. providers and engineers) and housing sector (e.g. landlords and housing associations). This was based on the view that they represent groups who have been under-engaged but who will be key to driving the transition forward. It was also felt that engagement with industry professionals first would present an opportunity to harness their influence among wider groups, to encourage action by sharing information and practical advice, and helping to tackle the spread of misinformation.
With the support of these sectors, focus should then be given to engaging the general public. There was a view among experts that focusing on early adopters first could help to encourage action among other more hesitant groups by building up a larger body of evidence of successful examples across different types of properties. This was seen as key to building trust in the efficacy of clean heating systems.
Tailoring messages
For engaging with industry professionals, it was felt that messages should provide clarity on the changes required and reassurance on the support available, as well as addressing any issues or hesitations that might be prevalent among these groups. An in-person approach to engagement with this group was considered necessary for this, to ensure any barriers are addressed directly.
For engaging the general public it was recognised that framing activities around the climate benefits would engage those who are already highly motivated by the climate crisis and more likely to be early adopters. It was felt that making it easier for them to take action (with clear and consistent messaging and practical advice) would in turn make it even easier for those less motivated by the climate crisis to take action as they could benefit from the experiences and knowledge of those who have already done it.
Highlighting the financial benefits and availability of grants and loans was identified as a key message that could be amplified more. This was seen to be particularly important for engaging members of the public for whom the upfront costs would be off-putting or those who are struggling with their energy bills already.
It was also felt that messages should be tailored, based on an understanding that different solutions will be needed for different groups and that the benefits/challenges associated will also be different depending on people’s circumstances (e.g. for those in houses compared to those in flats, and for those living in urban areas compared to those living in rural areas).
Overall, experts were in favour of more national-level campaigning – coordinated between the Scottish Government and key stakeholders – to raise awareness around the HiBs proposal and emphasise positive messaging around the heat transition. It was also felt that this would need to be supported by local-level public engagement that is tailored to, and addresses, the needs of different groups.
Building trust
There was a broad sense that any public engagement activity on the heat transition needs to first build a baseline understanding of heating systems, before engaging on transitioning between current and future systems. It was felt that priority should be given to improving basic understanding among general public about how boilers operate and start with simple changes they can make their homes more energy efficient.
Building on this, it was felt that public engagement should emphasise the needs and benefits of the transition to clean heating systems. At the same time, the importance of transparency in communicating the potential risks was also highlighted. Ensuring the availability of practical advice on how to navigate these risks and deal with challenges (particularly around installation and unforeseen costs), was felt to be missing from engagement currently.
Using trusted messengers – whether organisations already embedded in communities, those with technical knowledge (e.g. industry professionals), or a new group of independent advisers from a range of backgrounds – was seen as an effective vehicle for communicating these aspects of the transition. Experts interpreted trusted messengers in a range of ways, and further research would be beneficial to determine who the public would trust to deliver messages.
Regulatory clarity
Organisations delivering public engagement reported feeling limited in what they can deliver until it is clearer when the regulations will come into force, and what the regulations will include (i.e. the changes that people will be required to make in relation to clean heat and energy efficiency). There was a general understanding of the direction of travel, but it was felt that a lack of detailed information was limiting the effectiveness of communication and engagement on the heat transition in Scotland.
Regulatory clarity was therefore widely called for, although it was recognised that this would be difficult to provide until the legislation is finalised. Nevertheless, it was strongly suggested that regulatory and financial decisions need to be made first. Organisations delivering public engagement activities felt they needed clarity on what the regulations will be, when they will come into force, and what financial support will be available, so that they can be equipped to support their members, service users and the general public through the transition.
Appendices
Appendix A – detailed methodology
The research involved three strands:
- A web search to identify public engagement activities.
- Interviews with 10 experts representing a range of organisations involved in the heat transition.
- An online survey of organisations delivering public engagement activity.
Web search
The web search was initially conducted using a traditional online search method, whereby “Boolean search strings” were used in Google and Google Scholar. Search strings were created beforehand and then refined throughout the search process where necessary, to improve the relevance of results (see Appendix B for the full list of search strings used).
Ultimately, the traditional online search results were limited, and the majority of public engagement examples analysed were identified through using Ipsos’ proprietary social listening software, Synthesio. The software works by identifying mentions of specified terms (in a similar way as search strings) across the web, including platforms such as X (formerly Twitter), Facebook, YouTube, Instagram and Facebook.
The initial Synthesio search (using the search string listed in Appendix B) produced around 2,500 references to public engagement across these social media channels, which were reviewed by the research team. Through search refinement using key word filtering and further manual review, most mentions were ultimately excluded due to duplication or being out of scope.
An analysis of 62 instances of engagement that matched the inclusion criteria (as specified below). Details of these engagement examples were recorded in a mapping spreadsheet in Excel, by the research team. Examples from a previous, brief web search by the Scottish Government that did not appear in Ipsos’ web search were also included in the spreadsheet, along with a very small number of activities that Ipsos were already aware of.
Expert interviews
A longlist of potential organisations was generated by Ipsos following an initial web search and initial recommendations from the Scottish Government and ClimateXChange, and was reviewed by ClimateXChange and the Scottish Government. Organisations were selected on the basis that they could comment on public engagement on the heat transition (either from direct delivery experience or from involvement on the heat transition in other ways) and that they represented a range of perspectives. Experts were invited to take part via email and the profile of expert organisations included a mix of charities/advice services, climate hubs,[4] private companies, non-government organisations and industry bodies.
This strand of the research explored the different types of public engagement activities in more detail. A topic guide was developed by the Ipsos research team and reviewed by ClimateXChange and the Scottish Government (see Appendix C). Interviews lasted around 45 minutes each, and covered public engagement activities/communications recently delivered or known about, target audiences, perceived impact of engagement, any future activities planned, and views on current gaps in engagement.
Interviews also helped to identify potential organisations for inclusion in the online survey sample. Interviews were originally planned to be completed before the online survey fieldwork began. However, the decision was made to hold four interviews back until the online survey was underway. This decision was partly practical to be flexible around participants’ availability, but also to allow for survey responses to inform discussions and identify potential organisations to interview for a broader range of perspectives.
Online survey
The third strand of the research involved a five-minute online survey with organisations delivering public engagement activities in Scotland to explore the purpose and nature of these activities (e.g. key topics, target audience and impact). The questions were designed by Ipsos and reviewed by ClimateXChange and the Scottish Government (see Appendix D).
An initial sample of 78 contacts was generated by Ipsos through the web search and interviews, and the survey link was also shared by ClimateXChange and the Scottish Government through various email networks and communications channels, such as X (formerly Twitter) and the CXC newsletter, to broaden participation.
Two reminder emails were sent to the sample during the fieldwork period to boost response rates. The survey was live for five weeks, from 19 June to 24 July, and 34 completed responses were received. Of these, 25 organisations reported that they had delivered some form of public engagement in the last three years.
Appendix B – overview of web search
Web search strings
The following strings were placed into Google or Google Scholar:
- ‘Public engagement’ AND ‘Scotland’ AND [heat transition/ heat decarbonisation/ clean heating/ energy efficiency/ net zero heating/ green heating/ zero emission heating/ zero direct emission heating/ fabric first] OR
- ‘Public participation’ AND ‘Scotland’ AND [heat transition/ heat decarbonisation/ clean heating/ energy efficiency/ net zero heating/ green heating/ zero emission heating/ zero direct emission heating/ fabric first] OR
- ‘Deliberative/deliberation’ AND ‘Scotland’ AND [heat transition/ heat decarbonisation/ clean heating/ energy efficiency/ net zero heating/ green heating/ zero emission heating/ zero direct emission heating/ fabric first] OR
- ‘Public consultation’ AND ‘Scotland’ AND [heat transition/ heat decarbonisation/ clean heating/ energy efficiency/ net zero heating/ green heating/ zero emission heating/ zero direct emission heating/ fabric first] OR
- ‘Public dialogue’ AND ‘Scotland’ AND [heat transition/ heat decarbonisation/ clean heating/ energy efficiency/ net zero heating/ green heating/ zero emission heating/ zero direct emission heating/ fabric first] OR
- ‘Citizen engagement’ AND ‘Scotland’ AND [heat transition/ heat decarbonisation/ clean heating/ energy efficiency/ net zero heating/ green heating/ zero emission heating/ zero direct emission heating/ fabric first] OR
The following string was placed into Synthesio
(Scotland OR Edinburgh OR Glasgow OR Aberdeen OR Aberdeenshire OR Dundee OR Inverness OR Isles OR Isle OR Ayrshire OR Arran OR Islands OR Lothian OR Fife OR Highlands OR Perth OR “Outer Hebrides” OR Shetland OR Orkney OR Stirling OR Angus OR Dumfries OR Galloway OR Argyll) NEAR/5 (advice* OR consultation* OR discussion* OR event* OR conference* OR talk* OR “public service” OR report* OR session* OR lecture* OR conversation* OR public OR forum* OR seminar* OR workshop* OR outreach OR community OR engagement OR dialogue OR meeting* OR briefing* OR presentation* OR program* OR survey* OR roadshow* OR “public outreach”)) AND (“heat transition” OR “heat decarbonisation” OR “clean heating” OR “energy efficiency” OR “net zero heating” OR “green heating” OR “zero emission heating” OR “zero direct emission heating” OR “fabric first” OR “#EnergyEfficiency”)
Parameters
Across both searches, the following inclusion criteria were used:
- Topic: Public engagement related to heat transition/ energy efficiency. The research team included public engagement that is wider than just the Heat in Buildings agenda, but focused on engagement that is exclusively focused on the heat transition. (The relative focus on the heat transition in general climate change engagement was also mapped where relevant).
- Date: From October 2021 onwards (introduction of the Heat in Buildings Strategy in Scotland). This was reviewed during initial stages of searching and was deemed to be appropriate based on the volume of material available. The final eligible date for inclusion was 20th May 2024, corresponding with when the web review strand of the research ended.
- Methodology: “For the purposes of this research, “Public engagement” was understood as including various forms (e.g. public participation, public consultation, public dialogue) and methods.
- Geographical coverage: Scotland.
- Level: National- and potentially regional-level public engagement was initially prioritised for this project, rather than community-level. However, much of the engagement examples identified were at the more local, community-level and so relevant examples of these were also reviewed and included in the mapping.
- Language: English language (it was agreed that the research team would also record any search results in Gaelic, but this was not called for).
Appendix C – Topic guide for expert interviews
Introduction (3 mins)
Ipsos has been commissioned by ClimateXChange and the Scottish Government to conduct research into public engagement on the heat transition in Scotland.
As part of the research, we are conducting interviews with organisations across Scotland who have carried out, been involved in, or have a good awareness of, engagement activities with the public on the heat transition. This includes engagement on topics like clean heating and energy efficiency, low carbon technology and zero direct emissions heating systems. These interviews will help us obtain a fuller understanding about the types of activities that have been carried out so far.
The research will inform the delivery of the Scottish Government’s Heat in Buildings Public Engagement Strategy.
The interview should last about 45 minutes and everything you say will be treated in the strictest confidence. No identifying information about individuals will be included in the report, for example, if we would like to quote you, we will do it anonymously. ClimateXChange and the Scottish Government will not receive notes from individual interviews or attributable comments.
Participation is voluntary and you can change your mind at any time, up until the report is published.
- We would like to record the discussion for analysis purposes. It will not be provided to anyone outside of the Ipsos research team. The recordings will be securely stored and will be destroyed three months after we have completed the evaluation.
Do I have your permission to record?
Turn on the recorder and record consent to take part and for the discussion to be recorded.
Do you have any questions before we begin? Are you happy to proceed?
Background (3-5 mins)
To start with, can you tell me a bit about yourself and your role at [organisation].
What, if anything, do you know about the Scottish Government’s Heat in Buildings Strategy?
IF NECESSARY: The strategy was published in October 2021, and sets out how the Scottish Government will achieve warmer, greener and more energy efficient heating in domestic and non-domestic buildings in Scotland. It established a target of decarbonising all properties in Scotland by 2045, including the approximately 2 million homes that currently use mains gas as their primary heating fuel.
And what, if anything, do you know about the Scottish Government’s Heat in Buildings Public Engagement Strategy?
IF NECESSARY: The Heat in Buildings Public Engagement Strategy provides an overview of how Scottish Government will work with other stakeholders to deliver a programme of public awareness raising, education and participation around clean heat and energy efficiency, in order to meet targets set out in the Heat in Buildings Strategy.
PROBE:
- General views on strategy – any positives, negatives
- Does organisation have a specific strategy / business plans in relation to this?
Overview of activities (10-15 mins)
We are interested in finding out about the different types of activities organisations may have carried out over the last three years to engage members of the public in relation to the heat transition to net zero emissions in Scotland. Can you tell me about any activities that your organisation has…
- Carried out over the last three years to engage the public on this topic?
- Contributed to or supported in some way?
- Been aware of (but not been involved in)?
Interviewer: note down examples initially raised by stakeholder, then gather information about each one in relevant section (apportioning time on each section depending on the number of examples relavant to each).
At this stage probe for brief details about each activity (explain you will ask for more detail after you’ve heard about all the different types of activities carried out):
- what was it about?
- what did it involve / how was it carried out?
- who was it carried out with? target audience?
- was anything published / any information available online?
- (if yes – interviewer does not need to spend time collecting factual information that will likely be in the report – focus on key questions instead).
Note to interviewer: if there are lots of activities to discuss and the stakeholder is not able to stay on the call, ask if they would be willing to share details of the remaining examples by email.
A – Information about activities the organisation delivered themselves (10-15 mins)
I’d now like to ask you a bit more about the [activity/activities] you mentioned.
It would be useful to know more about what took place, and your thoughts on how well you think this method of engagement worked and any impact it may have had.
You might not have all the answers, which is absolutely fine.
Interviewer: ask about each (relevant) activity mentioned in turn with remaining time. ask or adapt questions depending on the type and format of engagement activity being described. if short on time or if there are lots of examples, prioritise those that are newly uncovered, unpublished or that we have not collected details about already.
ensure that you leave five minutes at end to ask the future engagement section.
- What was the purpose or overall aim of the activity?
- Who was the activity aimed at? General public or specific groups?
Probe on groups such as:
- Particular geographical areas;
- Socio-economic groups;
- People living in particular types of properties
- Homeowners/landlords/renters
- Based on protected characteristics – disability, ethnicity
- other groups
- Why were you interested in engaging with [this group / these groups] in particular? Why was this important?
PROBE IF NECESSARY:
- How did you identify there was a need to engage with this group?
I’d now like to ask about the topics that were covered and the way those topics were communicated to the public…
- What areas / topics did the activity cover?
PROBE:
- What were the main / key messages being communicated / delivered by the activity?
- Why were these particular messages chosen?
- And were any steps taken to make it easier for people to take part or engage with the activity?
PROBE:
- Design of materials
- Language (e.g. use of plain English; terminology used; Gaelic)
- Location of activity (any considerations for urban/rural audiences)
- How engaged / method of engagement
- Why did you do this? Were there any groups of people you thought may have struggled to understand/engage with the activity otherwise?
- What is your understanding of the impact this activity has had? Did it achieve its goals/aims?
- If yes – In what ways would you say the activity was successful?
- If too early to tell / not sure:
- Why is that? (clarify whether activity was too recent, or if the impact is expected to be over longer term e.g. it will take a while for people to install heat pumps)
- What do you hope that the impact of the activity will be?
- PROBE: Was the impact or success of the activity measured in any way?
- Why do you think it was successful / unsuccessful?
- If not previously mentioned: And do you think it was it successful at reaching the target audience?
- Were there any groups of people missing?
- IF YES: What were the reasons for that?
- Does your organisation have any future plans to further engage the public on the heat transition to net zero emissions?
- IF YES:
- What? When?
- Who is the target audience (and why)?
- Are these plans based on learnings from any previous engagement?
B – Information about activities the organisation contributed to in some way (5-10 mins)
Thinking now about the other [activity], which you mentioned being involved in.
- If not covered already – What was involved in the activity?
- What was the purpose or overall goal of the activity?
- If not covered already – What was your organisation’s involvement?
- What were the main / key messages being communicated / delivered by the activity?
- Who was the activity aimed at? General public or specific groups? Probe on reasons for this (if known)
- Do you know if the target audience was reached successfully?
- Any groups not reached successfully?
- Do you think it was it easy or difficult for people to take part and engage with the information provided [or to attend the activity]?
- What is your understanding of the impact the activity had? Probe on what went well, any challenges, what could be improved
C – Information about activities that the organisation is aware of (5-10 mins)
Moving onto [activity], which you said you were aware of.
- If not covered already – What was involved in the activity?
- If not covered already – Who delivered the activity?
- What were the main / key messages being communicated / delivered by the activity?
- Who was the activity aimed at? General public or specific groups? Probe on reasons for this (if known)
- Do you know if the target audience was reached successfully?
- Any groups not reached successfully?
- Do you think it was it easy or difficult for people to take part and engage with the information provided [or to attend the activity]?
- What is your understanding of the impact the activity had? Probe on what thought went well, any challenges, what could be improved
Engagement gaps (5 minute)
Interviewer: ask all
Finally, I’d like to ask if you think there are any gaps in the engagement activities that have been carried out so far on the heat transition. For example, in terms of the groups of people being targeted or the types of activities being carried out.
- First of all, as far as you are aware, are there any groups of people you think are missing from the activities that have been carried out the heat transition in Scotland so far?
Probe:
- Why do you think this is?
- Are there any groups of people that your organisation would have liked to have engaged but have been unable to so far?
- And are there any particular types of public engagement activities not currently happening that you think should be?
- If yes: What? When? Who should the target audience be (and why)?
- Do you think you would benefit from any advice or support on public engagement in relation to the heat transition in Scotland?
- If yes: What would you find useful?
Close (3 mins)
That’s all the questions I wanted to ask you today, unless you think there is anything else we might have missed which would be useful for us to know?
Thanks. In the next few weeks, we will be conducting follow up research among organisations across Scotland responsible for delivering public engagement activities on the heat transition. This will comprise a short, 5-minute online survey asking about activities or communications being delivered. Would you, or someone else from your organisation, be willing to take part in the survey?
If yes: take contact details (name, email)
We are keen to invite as many organisations as possible to take part in the survey. Can I check, are there any other organisations or people you are aware of who are delivering public engagement activities on the heat transition that you think we should invite to take part in the survey?
Finally, the ClimateXChange and Scottish Government research teams may wish to conduct follow up research about this topic within the next 2 years. Are you willing to have your name and contact details passed on to the ClimateXChange and Scottish Government teams for this purpose?
Thank you so much for taking the time to speak to me today, it’s been really helpful.
Appendix D – online survey questionnaire
ASK ALL.
QWORK: First of all, which of the following best describes who you work for?
- Charitable organisation
- Community group
- Education or research institute
- Local authority
- Non-Governmental organisation
- Non-profit organisation
- Private sector organisation
- Scottish Government department
- Social enterprise
- Other – please specify:
- Don’t know
ASK ALL.
How much, if anything, would you say you currently know about the Scottish Government’s Heat in Buildings Strategy?
- A great deal
- A fair amount
- Just a little
- Heard of it but know nothing about it
- Never heard of it
ASK ALL.
Q1. As you may know, the Scottish Government’s Heat in Buildings Strategy aims to transform Scotland’s buildings and the systems that supply their heat, as part of the transition to net zero emissions by 2045. This includes working to support the rapid adoption of zero emissions systems for home heating, such as heat pumps and district heat networks.
Have you, or your organisation, carried out any activities over the last three years to engage members of the public about changing their home heating systems?
- Yes
- No
- Don’t know
IF YES AT Q1.
Q2. Which of the following categories would those activities most closely fall under? MULTICODE
- Workshops
- Public information campaigns
- Open days or showcases
- Lectures / talks
- Training or knowledge-sharing sessions
- Providing information online
- Consultations
- Citizens Panel
- Advice service (in person)
- Advice service (online)
- Advice service (telephone)
- Other – please specify:
ASK IF YES AT Q1
Thinking about the most recent activity that you / your organisation carried out…
Q3. Which of the following topics, if any, were covered by the activity? MULTICODE
- General provision of energy efficiency advice/information
- Information about Scottish Government’s Climate Change Plan / net zero targets
- Improving the energy efficiency of households (such as through improving home insulation)
- Installing air source or ground source heat pumps
- District heating networks
- Other types of clean heating systems*
- Provision of information about grants / loans
- Other – please specify:
- Don’t know
ASK IF YES AT Q1
Q4. Which groups, if any, was the activity targeted at? MULTICODE
- General public (no specific target groups) at national level
- General public (no specific target groups) at regional or local level
- Businesses or people working in the energy sector
- Homeowners
- Private renters
- Those renting their home from a local authority or housing association
- Landlords
- Low-income households
- Households in urban areas
- Households in rural areas
- Households using gas/oil heating
- People with protected characteristics (e.g. disabled people, minority ethnic groups)
- People in fuel poverty
- Older people
- Younger people
- Other – please specify:
- Don’t know
Q5. What was the main reason or reasons for focusing the activity on those groups in particular?
- OPEN TEXT
- Don’t know / not sure
ASK IF CODE 1 AT Q1.
Q6. To what extent do you agree or disagree with the following statements about the activity?
- The activity was effective at reaching its target audience.
- The activity was effective at improving the target audience’s awareness / understanding of the issue.
- Members of the public took action as a result of engaging with the activity.
- Members of the public decided to change their home heating system to a zero direct emissions heating system as a result of engaging with the activity.
- It was easy for members of the public to take part and engage with the activity / the information provided.
ANSWER OPTIONS
- Strongly agree
- Tend to agree
- Neither agree nor disagree
- Tend to disagree
- Strongly disagree
- Too early to tell
- Not relevant
- Don’t know
ASK IF YES AT Q1.
Q7a Has your organisation carried out an evaluation of any of its public engagement activities?
- Yes
- No
- Don’t know
ASK IF YES AT Q7a.
Q7b. Would you be willing to share this information with the ClimateXChange and Scottish Government research team, to allow them to understand more about the impact of public engagement activities on this topic? SINGLE CODE
- Yes
- No
- Don’t know
SHOW IF CODE 1 AT Q7b
Thank you, please send this information to UK-PA-HeatTransition@ipsos.com and let us know if there is anything you would not like to be shared with the ClimateXChange and Scottish Government research team.
Select ‘Next’ to move on to the next question.
ASK ALL.
Q8. Do you or your organisation have any plans to deliver public engagement activities on the heat transition in Scotland in the future?
- Yes
- No
- Don’t know
ASK IF CODE 1 AT Q8
Q9. Could you tell us more about your future plans, including what the activities will involve and who they will be targeted at?
- OPEN TEXT
- Don’t know / not sure
ASK ALL.
Q10: Are you aware of any activities that have been carried out over the last three years by other organisations to engage members of the public in relation to the heat transition to net zero emissions in Scotland?
- Yes
- No
- Don’t know / Can’t remember
IF YES AT Q10.
Q11. What types of public engagement activities are you aware of that have been carried out over the last three years? MULTICODE.
- Workshops
- Public information campaigns
- Open days or showcases
- Lectures / talks
- Training or knowledge-sharing sessions
- Providing information online
- Consultations
- Citizens Panel
- Advice service (in person)
- Advice service (online)
- Advice service (telephone)
- Other – please specify:
ASK IF CODE 1 AT Q10.
Q12. What topics did that activity / did those activities relate to? MULTICODE
- General provision of energy efficiency advice/information
- Information about Scottish Government’s Climate Change Plan / net zero targets
- Improving the energy efficiency of households (such as through improving home insulation)
- Installing air source or ground source heat pumps
- District heating networks
- Other types of clean heating systems*
- Provision of information about grants / loans
- Other – please specify:
- Don’t know
ASK IF CODE 1 AT Q10.
Q13. And, as far as you are aware, which of the following groups of people / households did this activity/ those activities focus on? MULTICODE
- General public (no specific target groups) at national level
- General public (no specific target groups) at regional or local level
- Businesses or people working in the energy sector
- Homeowners
- Private renters
- Those renting their home from a local authority or housing association
- Landlords
- Low-income households
- Households in urban areas
- Households in rural areas
- Households using gas/oil heating
- People with protected characteristics (e.g. disabled people, minority ethnic groups)
- People in fuel poverty
- Older people
- Younger people
- Other – please specify:
- Don’t know
ASK ALL
Q14. Which of the following groups of people, if any, do you think would benefit from more support or information on the heat transition in Scotland? MULTICODE
- General public (no specific target groups) at national level
- General public (no specific target groups) at regional or local level
- Businesses or people working in the energy sector
- Homeowners
- Private renters
- Those renting their home from a local authority or housing association
- Landlords
- Low-income households
- Households in urban areas
- Households in rural areas
- Households using gas/oil heating
- People with protected characteristics (e.g. disabled people, minority ethnic groups)
- People in fuel poverty
- Older people
- Younger people
- Other – please specify:
- Don’t know
© The University of Edinburgh
Prepared by Ipsos Scotland on behalf of ClimateXChange, The University of Edinburgh. All rights reserved.
While every effort is made to ensure the information in this report is accurate, no legal responsibility is accepted for any errors, omissions or misleading statements. The views expressed represent those of the author(s), and do not necessarily represent those of the host institutions or funders.
Synthesio is an Ipsos proprietary tool that trawls the social web and mainstream media to monitor online presence and identify posts, re-posts and tags on a given topic (in this case, public engagement on the heat transition in Scotland). ↑
https://moneysavingboilerchallenge.com/ ↑
https://www.thursocdt.co.uk/helpandsupport ↑
Climate hubs are volunteer-led networks that supports community-led action across Scotland’s regions: https://www.gov.scot/policies/climate-change/community-led-climate-action/ ↑
This report sets out key findings from an exercise that mapped public engagement activities on the heat transition in Scotland.
The aim of the research was to help inform the delivery of the Heat in Buildings Public Engagement Strategy by addressing questions related to who delivers engagement activities and to whom, the type of activities and messages, and gaps in engagement.
We conducted a web search, interviews with experts from organisations involved in the heat transition and an online survey of organisations delivering public engagement activity.
Findings
Overview of ongoing activities:
- A wide range of organisations across the public, private and charitable sectors have been delivering public engagement activities on the heat transition in Scotland.
- The types of public engagement have also been varied, with the most common being advice services, workshops and information sharing online.
Target audience, messaging and accessibility as discussed by experts and organisations:
- Engagement activities were mostly open to the general public. There were also some specific target groups identified, including residents within a specific geographic area, homeowners, people in fuel poverty, low-income households and energy sector professionals.
- Despite attempts to engage a broad range of audiences, those actually engaged in the activities were typically more climate aware than the general public overall.
- Messaging that was focused on home energy efficiency and reducing energy bills, rather than the adoption of clean heating systems, resonated better with wider audiences in the context of the cost of living.
- Engagement on “simple fixes” (e.g. turning boiler temperature down) was therefore more widespread than messaging around bigger steps (e.g. installing a heat pump).
- Activities delivered through trusted messengers and existing local channels were accessible forms of engagement.
- Tailoring messages to the specific target audience was an effective approach to accessible engagement as it helped to improve understanding.
Gaps in public engagement identified by experts and organisations:
- Audiences under-engaged on the heat transition included private landlords, renters, professionals in the energy sector, young people and the digitally excluded.
- Lack of regulatory clarity on clean heat and energy efficiency was a key reason for the engagement gap among landlords and the energy sector.
- The upfront costs of transitioning were a barrier to widening reach among the general public, especially in the context of the cost of living crisis.
- Key messaging gaps in public engagement included:
- A lack of public understanding of heating systems.
- Insufficient practical and transparent advice on installing and operating clean heating systems.
- Interviewees thought that certain aspects of the transition, such as what clean heating systems are and how to install them, were not successfully communicated to the wider public due to their perceived complexity.
- They felt that communication about the efficacy of clean heating systems, based on real use cases, was lacking.
- There was a shortage of trusted messengers providing reliable, impartial advice, as well as a lack of tradespeople able to provide technical support on the practical aspects of the transition.
If you require the report in an alternative format, such as a Word document, please contact info@climatexchange.org.uk or 0131 651 4783.
Scotland is already experiencing climate change impacts, including increasing water scarcity, flooding and extreme weather events. The Scottish Government is preparing for these challenges with the third Scottish National Adaptation Plan (SNAP3).
This report presents indicators for monitoring the four domestic outcomes of SNAP3. It establishes a baseline prior to the implementation of the Plan for monitoring and determining progress at the end of its five-year period.
The research was undertaken through desk-based review and stakeholder engagement.
Findings
The proposed indicators for monitoring each of the four domestic outcomes of SNAP3 are presented below.
Nature Connects
- Habitat Connectivity Index
- Proportion of surface water bodies classified in high and good condition
- Proportion of Scotland’s protected sites in favourable condition
- Proportion of soft shorelines affected by coastal erosion
- Extent of green-blue land cover in urban areas
- Proportion of adults who live within a five-minute walk of their nearest green or blue space
Communities
- Level of community awareness around climate change
- Level of community climate action
- Progress of actions in local flood risk management plans
- Level of community wellbeing
Public Services and Infrastructure
- Level of collaboration across public services
- Level of adaptation actions across public services
Economy, Business and Industry
- Proportion of businesses monitoring climate-related risks
- Proportion of businesses taking action to adapt to the effects of climate change
- Number of green jobs
- Uptake of grants for agriculture storage reservoirs and off-season storage lagoons
Recommendations
Key recommendations for the outcome indicators include:
- Consistent application of indicators.
- Maintain continuity, quality and availability of data required by each indicator.
- Maintain flexibility regarding potential for additional indicators.
- Establish a working group to sustain the functioning of the indicators.
For further details please read the report.
If you require the report in an alternative format, such as a Word document, please contact info@climatexchange.org.uk or 0131 651 4783.
Related Scottish Government publications
Scottish National Adaptation Plan 2024-2029 (www.gov.scot)
Scottish National Adaptation Plan 2024-2029: Monitoring and Evaluation Framework (www.gov.scot)
Research completed August 2024
DOI: http://dx.doi.org/10.7488/era/4836
Executive summary
Aims
This report presents indicators for monitoring the four domestic outcomes of the third Scottish National Adaptation Plan (SNAP3). These outcomes are summarised as:
- Nature Connects
- Communities
- Public Services and Infrastructure
- Economy, Business and Industry
It establishes a baseline prior to the implementation of SNAP3 for monitoring and determining progress at the end of the Plan’s five-year period.
The report addresses the challenges of developing indicators for a national adaptation plan by adopting an approach that balances robustness and practicality, considering available resources and data. We have developed a set of indicators for each outcome, assessing their relevance and feasibility for monitoring, through desk-based review and stakeholder engagement. The assessment has been grounded in the practical reality of what data is available rather than theoretically ideal indicators.
Findings
The indicators proposed for each of SNAP3’s outcomes are listed below. For each indicator, there was sufficient data available to allow for a pre-SNAP3 baseline to be established and then reported against after a five-year period.
- Nature Connects – outcome indicators
- Habitat Connectivity Index
- Proportion of surface water bodies classified in high and good condition
- Proportion of Scotland’s protected sites in favourable condition
- Proportion of soft shorelines affected by coastal erosion
- Extent of green-blue land cover in urban areas
- Proportion of adults who live within a five-minute walk of their nearest green or blue space
These six indicators cover elements of ecological connectivity, ecosystem health, and nature-based solutions (NbS) for climate adaptation. A marine ecosystem indicator could not be included due to insufficient data availability.
- Communities – outcome indicators
- Level of community awareness around climate change
- Level of community climate action
- Progress of actions in local flood risk management plans
- Level of community wellbeing
The four indicators cover elements of community resilience, wellbeing, and climate action. It was particularly challenging to capture the complexity of health and equity in relation to climate adaptation with only a few high-level indicators. The onus was placed on monitoring levels of community action in creating resilient, healthy, and equitable places.
- Public Services and Infrastructure – outcome indicators
- Level of collaboration across public services
- Level of adaptation actions across public services
The two indicators monitor collaboration and adaptation action among public bodies. While these indicators provide high-level insights into public sector collaboration and adaptation efforts, they do not measure the effectiveness or inclusiveness of these actions, which would require numerous sector-specific indicators that would be onerous to monitor.
- Economy, Business and Industry – outcome indicators
- Proportion of businesses monitoring climate-related risks
- Proportion of businesses taking action to adapt to the effects of climate change
- Number of green jobs
- Uptake of grants for agriculture storage reservoirs and off-season storage lagoons
The five indicators cover elements of business preparedness, adaptation actions, and economic opportunities related to climate change. These indicators provide an overview of Scotland’s economic adaptation to climate change. However, they do not cover investment in climate adaptation initiatives or economic resilience to climate-related hazards, as there were insufficient available data.
Recommendations
Key recommendations for the outcome indicators following this project include:
- Consistent application of indicators. The indicator set for SNAP3 should be finalised as soon as possible and consistently applied to enable meaningful and coherent monitoring over the Plan’s five-year period. Any changes made to individual indicators or the data that underpin them may compromise the ability to track progress consistently relative to the baseline.
- Maintain continuity, quality and availability of data required by each indicator. It is vital to maintain the allocation of resources to the collection, maintenance and accessibility of datasets used by the indicators across all relevant Scottish Government departments.
- Maintain flexibility regarding potential for additional indicators. New indicators may be added in the immediate term if relevant data becomes available, as may be anticipated regarding, for example an ecosystem functions indicator for Nature Connects or a green finance indicator for Economy, Business, and Industry. While the suite of indicators addresses the needs for monitoring the outcomes of SNAP3, it may be viewed as a foundation to build upon regarding monitoring of SNAP4.
- Establish a working group to sustain the functioning of the indicators. The working group could comprise key stakeholders and data providers who could meet annually to review the functioning of the indicators and address any issues regarding their deployment, e.g., continuity and availability of data and its quality.
The findings of this report may also be of interest to anyone interested in monitoring and evaluation of climate adaptation planning more generally.
Glossary / Abbreviations table
BICS | Business Insights and Conditions Survey |
CCAH | Community Climate Action Hubs |
LPP | Local Place Plans |
|
MEL | Monitoring, Evaluation and Learning |
|
NAP | National Adaptation Plan |
|
NbS | Nature-based solutions |
|
ONS | Office of National Statistics |
|
SEPA | Scottish Environment Protection Agency |
|
SHeS | Scottish Health Survey |
|
SHS | Scottish Household Survey |
|
SNAP3 | 3rd Scottish National Adaptation Plan |
|
SSN | Sustainable Scotland Network |
|
WEMWBS | Warwick-Edinburgh Mental Wellbeing Scale |
Introduction
Aims of this report
The third Scottish National Adaptation Plan (SNAP3)[1] will be published in Autumn 2024 and Scottish Ministers have agreed that there is a need to improve monitoring of its outputs and outcomes, as compared with the way previous adaptation plans in Scotland have been monitored. The central aim for monitoring, evaluation and learning (MEL) of SNAP3 is to ensure that the indicators are as robust and relevant as possible for monitoring its specific outcomes, while remaining practical and accessible to implement in terms of resources and data available. We have sought to strike this balance between robustness and feasibility in the outcome indicators presented in this report.
The structure of SNAP3 is based around five long term outcomes and 23 objectives that set out adaptation priorities for the Scottish Government between 2024-2029. These five outcomes are (with abbreviations used hereinafter in brackets):
- “Nature connects across our lands, settlements, coasts, and seas” (Nature Connects)
- “Communities are creating climate-resilient, healthy, and equitable places” (Communities)
- “Public services are collaborating in effective and inclusive adaptation action” (Public Services and Infrastructure)
- “Economies and industries are adapting and realising opportunities in Scotland’s Just Transition” (Economy, Business and Industry)
- “Scotland’s international role supports climate justice and enhanced global action on climate adaptation” (International Action)
The indicators developed here address the first four outcomes, which are focused on Scotland’s resilience at the national level. Through a process of desk-based research and engagement with the Scottish Government’s departments and relevant organisations, we have developed a suite of indicators to monitor progress of these outcomes. Each indicator was assessed using criteria to determine its inclusion. The criteria addressed the indicator’s conceptual relevance and practical implications, including availability of baseline data. Our development of indicators for the four outcomes of SNAP3 took place concurrently with work undertaken by the Scottish Government to develop a suite of indicators for the 23 objectives that sit beneath the outcomes.
This report takes the following structure: first, Section 1.2 provides a brief overview of MEL in national adaptation contexts. Section 2 outlines the process undertaken to develop the outcome indicators. Section 3 provides information for each indicator and is structured by each outcome. Baseline data is presented in the Section 4. Section 5 concludes with a discussion and recommendations for next steps. Annexes provide further details on methodology and technical information.
Context
A key takeaway from the COP28 in December 2023 was the importance of monitoring, evaluation, and learning (MEL) to understand and report on the effectiveness of the design and implementation of national adaptation planning processes (Beauchamp & Józefiak, 2023). Due to the iterative nature of climate adaptation, MEL is essential to periodically understand the effectiveness of adaptation plans effectiveness and improve their design accordingly (GEF, 2016). Furthermore, national MEL systems are of importance for fulfilling national reporting commitments, such as the Enhanced Transparency Framework under the Paris Agreement (UNDP, 2022).
Developing indicators of climate adaptation is challenging, conceptually and practically, due to the complex, multi-sectoral and context-specific nature of climate impacts that need to be addressed (UNFCC, 2022). Challenges include: the length of time it can take to implement adaptation actions due to their scope and scale; the length of time for adaptation actions to mature and deliver measurable outcomes; and the need for monitoring to be sustained, which poses practical issues regarding maintenance of a consistent methodology using comparable data and associated long-term funding and policy cycles.
No standard metrics exist to capture adaptation nor an off-the-shelf indicator framework to apply to a country’s context (New et al., 2022). Nevertheless, there are numerous efforts to structure MEL of climate adaptation in the form of checklists and toolkits. Examples include: the BASE Evaluation Criteria for Climate Adaptation, which offers a checklist for evaluation focused on outcomes and processes; and the ‘Toolkit for MEL for National Adaptation Plan (NAP) Processes’ for developing countries (Beauchamp et al., 2024).
The Global Goal on Adaptation (GGA) framework adopted at COP28 (known as the UAE Framework for Global Climate Resilience) represents a concerted effort at a global level to establish universal targets to guide countries’ adaptation pathways. However, identifying a set of indicators to monitor progress remains a fundamental challenge (Gabbatiss & Lempriere, M, 2024). This is exemplified by the wide-ranging list of potential indicators found in the recent UAE – Belém work programme that synthesises countries’ submissions to the United Nations Framework Convention on Climate Change (UNFCCC) (UNFCCC, 2024).
In Scotland, the approach to climate adaptation M&E monitoring and evaluation has been robustly developed through the previous Scottish Climate Change Adaptation Programmes (SCCAPs). The Climate Change Committee (CCC) has provided significant recommendations on enhancing the M&E framework within Scotland. A key recommendation from the CCC has been to establish clear, measurable outcomes and associated indicators that can effectively capture the progress and impact of adaptation initiatives (CCC, 2022). Recognising the benefits of this approach, the Scottish Government has adopted an outcomes-focused approach for its Adaptation Plan. The importance of aligning national adaptation indicators with local contexts, ensuring that the indicators are relevant and actionable for Scotland’s unique environmental, social, and economic conditions has been highlighted in previous ClimateXChange research (Moss, A., 2019). he work presented in this project builds upon this background of previous MEL work.
Developing the suite of indicators
To develop the suite of indicators for monitoring the four outcomes of SNAP3, we followed a five-step approach, as illustrated in Figure 1 and described below.
The first step was a desk-based, data-mapping process. This involved reviewing draft SNAP3, the previous adaptation national plans, the published relevant Scottish policies and some international guidelines on MEL to identify possible indicators. The second step involved developing criteria to rank the indicators and facilitate their selection. At the third and fourth steps, this first longlist of indicators was presented and discussed with several stakeholders, during both one-to-one interviews and four workshops organised on each of the four SNAP3 outcome areas. This dynamic process enabled us to refine and amend the longlist of indicators, clearly identify gaps and limitations, and provide some recommendations. The final step of the process was the presentation of the indicator framework containing 12 outcome indicators.
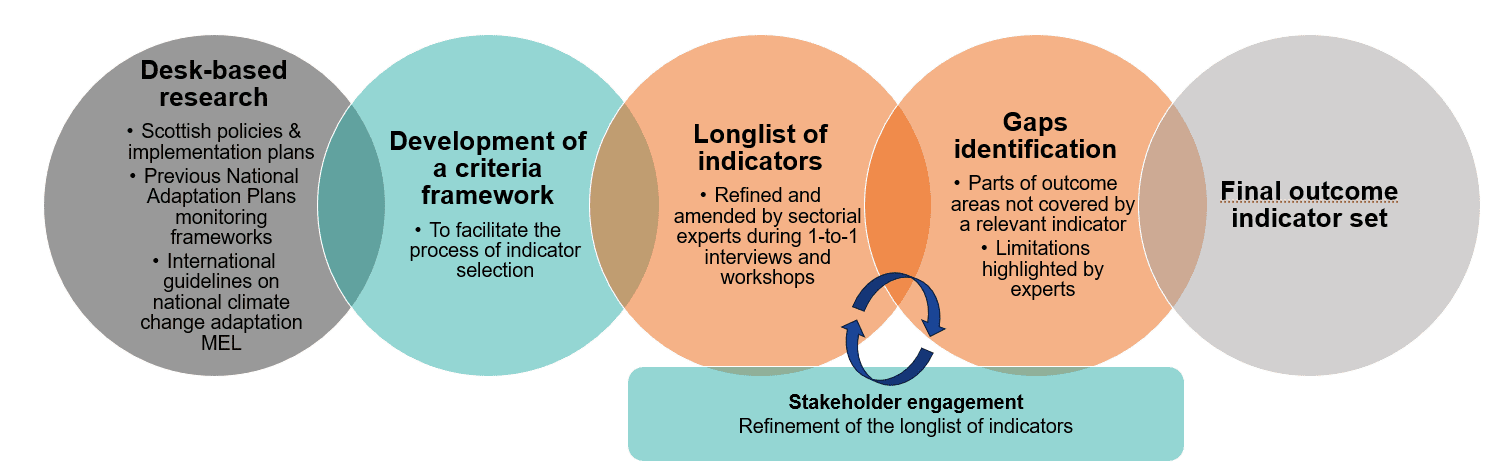
Figure 1: The five-step approach to develop the suite of indicators
Figure 2:: visualisation of the indicator development process
Desk-based research
The first stage of developing indicators involved data mapping through review of:
- Sectoral policies listed in the draft SNAP3 and their implementation plans, where published, to search for relevant existing indicators and associated datasets (See Annex 1).
- Relevant existing indicators and associated datasets used by previous Scottish adaptation plans (CCC, 2023; Moss, A., 2019,) and unpublished meeting notes from a stakeholder workshop led by CXC in May 2023 entitled ‘Monitoring and evaluation of Scotland’s Climate Change Adaptation Programme 2024-2029’.
- A selection of international guidelines and frameworks on national climate change adaptation monitoring and evaluation (EPA, 2017; FAO, 2017; Mäkinen et al., 2018; OECD, 2015; UNFCCC, 2023; UNFCCC, 2024) to learn from others’ approaches to the identification of outcome indicators and to identify if they used any adaptation outcome indicators that might be modified for use regarding SNAP3.
The four outcomes cover a wide range of different elements. Therefore, we used an approach based around theory of change (ToC) to identify those core elements that the indicators for each outcome should cover. This approach complemented the ToC work undertaken by Scottish Government as part of the draft SNAP3. We identified core elements through interpretation and analysis of each outcome section in the draft SNAP3. The core elements identified were:
- Nature Connects: Ecological connectivity (terrestrial, marine, and coastal); ecosystem health (terrestrial, marine, and coastal); and connection to nature.
- Communities: Community action; community resilience; health and equity.
- Public Services: Public sector collaboration; public sector adaptation action; effectiveness of public sector action; and inclusiveness of public sector action.
- Economy, Business, and Industry: Business preparedness and action; and economic adaptation.
This approach provided a broad structure and scope for the development of a longlist of potential indicators. The latter emerged from this desk-based research (See Annex 2). The longlist was refined by applying the indicator criteria (see Section 2.2 below) and amended based on the inputs gathered during the stakeholder engagement.
Indicator criteria
The indicator criteria (see Table 1) built upon established indicator criteria, such as SMART (Specific, Measurable, Achievable, Relevant and Time-Bound) (Biden, 2022) and RACER (Relevant, Accepted, Credible, Easy and Robust) (Peter & Peter, 2009), while refining elements to the specific context (e.g. adaptation relevance). Indicator ranking “low” for any criterion were excluded.
Table 1: Criteria for selecting outcome indicator for SNAP3
| Criterion | Description | Low | Moderate | High |
|---|---|---|---|---|
|
Adaptation relevance |
The indicator should relate to key elements of climate adaptation, including vulnerability, risk, exposure, and adaptive capacity. |
Minimal to no relevance to key climate adaptation elements. |
Some relevance to key climate adaptation elements. |
Clear relevance to key climate adaptation elements. |
|
Representativeness |
The indicator represents a core element of the outcome area within the adaptation plan that it fits under. |
Indicator only represents a small element of the outcome area. |
Indicator somewhat represents the key characteristics of the outcome area. |
Indicator represents well the key characteristics of the outcome area. |
|
Understanding |
The indicator should be easily understandable by a wide range of stakeholders, including non-experts, to ensure effective communication. |
Technical expertise required to fully understand indicator. |
Some technical expertise required but broadly understandable to non-expert audiences. |
Indicator is clearly understandable to a wide audience. |
|
Data availability |
Data for the indicator is readily available and accessible for use by wide range of stakeholders |
No data available or heavily restricted access to necessary data. |
Data exists but requires resources and expertise to fully access. |
Data fully and freely available. |
|
Sensitivity |
The indicator is sensitive enough to detect changes over five-year period. |
Changes in indicator not detectable over the required time-period. |
Indicator data is somewhat sensitive enough to detect changes over the required time-period. |
Indicator data is sensitive enough to detect changes over the required time-period. |
|
Baseline |
It should be possible to set clear, quantifiable baseline for the indicator to track progress. |
Data not available to establish a baseline. |
Baseline data is possible but requires resources to obtain. |
Baseline data is easily accessible. |
|
Practicality |
Indicator should be cost-effective to use and have low resource requirements for data collection and analysis. |
Prohibitively expensive and/or impractical to use indicator data. |
Some expenses and resources required to use indicator data. |
Cost-effective and low-resource to use indicator data. |
Stakeholder engagement
With support from the Scottish Government’s steering group, and drawing upon our desk-based research, we identified relevant stakeholders that could help validate and refine indicators within each outcome area. Stakeholders were considered from various backgrounds relevant to outcome areas, who could offer insights into data availability and gaps, as well as practicality of indicators.
We conducted one-to-one interviews with experts who could offer insights into data availability and gaps to discuss specific areas of the SNAP3 and four stakeholder workshops were organised; one for each outcome area[2]. We also gathered 66 participants over four workshops, from more than 25 different organisations, detailed in Annex 3. They were invited based on their expertise in fields relevant to each outcome area discussed and their knowledge of climate adaptation. The participants received the longlist of indicators before the workshop and were asked: (a) whether the indicators proposed covered well the targeted outcome area and (b) if there were any aspects missing.
The overall aim of stakeholder engagement was to engage with relevant teams across the Scottish Government on existing monitoring work to date, review existing available datasets, and amend the longlist of quantitative indicators developed by Ricardo. Experts confirmed, advised against, or suggested indicators that would best reflect the outcome areas. The workshops helped identify limitations of the selected indicators, as well as highlighting suggested outcomes that should not be included (for example, due to lack of data availability).
Outcome indicators
This section presents the proposed outcome indicators for SNAP3. Figure 2 visually presents the proposed outcome indicators, with each indicator categorised under the relevant outcome area. An overview is provided for each outcome before detailing each indicator. This information includes the indicator title, description, data holder, unit and rationale for inclusion. Detailed information for how the indicator criteria was applied to each indicator is provided in Annex 4.
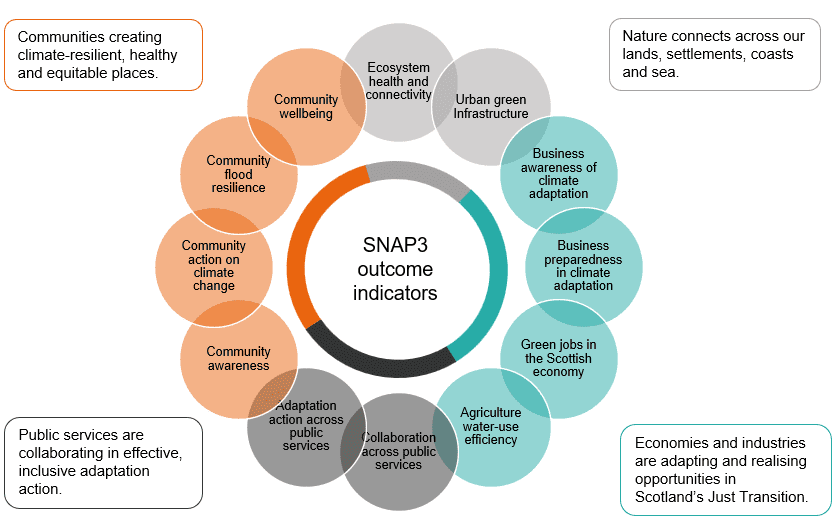
Figure 2: Proposed outcome indicators for SNAP3
Nature connects across our lands, settlements, coasts, and seas
Overview
The outcome Nature Connects places emphasis on nature’s role in climate adaptation. It emphasises connectivity across landscapes, settlements, coasts, and seas to bolster ecosystem resilience. Key actions include developing nature networks in every local authority area, managing invasive species, and enhancing natural carbon stores like peatlands and forests. Taking a holistic approach aims to improve Scotland’s climate resilience while delivering co-benefits for biodiversity, flood mitigation and human wellbeing. Figure 3 illustrates the SNAP3’s pathway from objectives to outcome and impact for the Nature Connects outcome.[3]
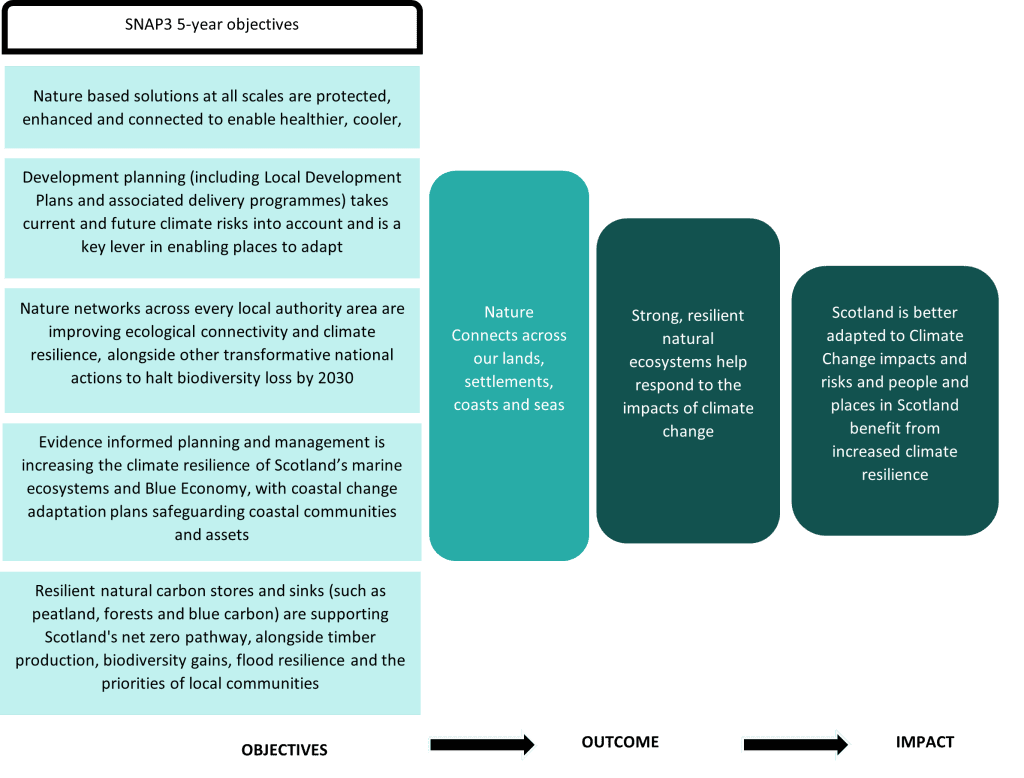
Considerations for indicator selection
Following the desk-based review and stakeholder engagement, several considerations emerged regarding indicator selection for the Nature Connects outcome:
- The importance of acknowledging that connectivity indicators do not necessarily reflect habitat quality or overall ecosystem resilience. Hence, ideally, there would be a focus on ecosystem functions and processes. However, while indicators focused on ecosystem functions are currently under development by Nature Scot, they will not be operational in time for use in monitoring SNAP3.
- Despite the high-level nature of indicators, there is a need to reflect Scotland’s diverse environment. Freshwater environments were highlighted as both a useful proxy for the extent of ecological connectivity and with a comprehensive and accessible dataset.
- Urban green infrastructure is an important aspect of this outcome and the indicators should capture the extent of accessibility to nature and green spaces.
- Species indicators are not sufficiently sensitive to show a significant trend over SNAP3’s five years. Changes in species abundance and distribution due to climate change are often gradual. Species’ adaptation, whether through genetic changes, changes in behaviour, or moves to new areas, often require longer than five years to be observable. Over a shorter period, it can be difficult to distinguish between short-term fluctuations and longer-term changes driven by climate change. While five-year studies can provide valuable snapshots and early indicators, longer timeframes are typically needed to confidently assess significant trends in species abundance and distribution related to climate adaptation. Therefore, indicators like “terrestrial species’ abundance” developed by Nature Scot were deemed inappropriate for inclusion.
- As outlined in SNAP3, marine ecosystems will make a vital contribution to Scotland’s adaptation to climate change. However, there is very limited data available to measure marine habitat connectivity. Furthermore, there is difficulty capturing adaptation of the marine environment in a single, general indicator. For example, NatureScot’s marine species’ abundance indicator focuses upon the average abundance of 14 species of breeding seabird. Such an indicator was not considered to be suitably representative of marine ecosystems and, therefore, not selected.
- Not all the natural habitat types are captured in this framework. Specific indicators were considered but not selected. For example, the baseline for the Woodland Ecological Condition indicator was too old and the indicator would not cover the 2024-2029 period.
Nature Connects – proposed indicators
When setting out to develop a list of indicators for the Nature Connects outcome, it was important to cover ecological connectivity between habitats across land and sea, ecosystem health, and the implementation of NbS for climate adaptation. To a large extent, the six indicators chosen for this outcome efficiently achieve this coverage by using established indicators and available data held for various Scottish Government agencies.
The proposed indicators are:
- Habitat Connectivity Index
- Proportion of surface water bodies classified in high and good condition
- Proportion of Scotland’s protected sites in favourable condition
- Proportion of soft shorelines affected by coastal erosion
- Extent of green-blue land cover in urban areas
- Proportion of adults who live within a five-minute walk of their nearest green or blue space.
Immediately below we present the baseline information foreach of the six indicators proposed to monitor the Nature Connects outcome. For each indicator, we provide the baseline value, a description of the baseline, the recent trend and desired trend for each indicator to provide context. More information on baseline data is available in Annex 5. This is followed by a further detailed summary of each indicator and the rationale for their inclusion.
Nature Connects – baseline
Habitat Connectivity Index
- Description: In 2020, the total Equivalent Connected Area (Probability of Connectivity) (ECA (PC) value for Scotland was 35,570 ha for semi-grassland (2.9%), 5,655 ha for woodland (1.4%) and 214,277 ha for heathland (8.3%).
- Recent trends: None.
- Desired trend: Increase
- Baseline
- Semi-grassland: 2.9%
- Woodland: 1.4%
- Healthland: 8.3%
Proportion of surface water bodies classified in good and better condition
- Description: In 2022, 445 (13.7%) surface water bodies were in better condition and 1664 (51.2%) surface water bodies were in good condition.
- Recent trends: This percentage has remained broadly stable in recent years, rising slightly from 61.8% in 2014.
- Baseline: 64.9%
- Desired trend: Increase
Proportion of Scotland’s protected sites in favourable condition
- Description: In March 2024, the proportion of natural features in favourable condition on protected sites was 75.6%.
- Recent trends: The trend between 2023 and 2024 is relatively stable, slightly decreasing by 0.9%. However, the proportion of features in favourable condition has decreased by 4.8 percentage points since 2016 when it peaked at 80.4%.
- Baseline: 75.6%
- Desired trend: Increase
Proportion of soft shorelines affected by coastal erosion
- Description: In 2021, 46% of the soft coast is affected by coastal erosion. The average rate of erosion is 0.43 m/year.
- Recent trends: In 2017, 38% of the soft coast was affected by coastal erosion, representing an 8% increase in eight years. Note, the proportion of shorelines experiencing coastal erosion, and the rate of erosion, increases under all climate change emissions scenarios.
- Baseline: 46%
- Desired trend: Decrease
Extent of green-blue land cover in urban areas
- Description: The total area of urban greenspace in Scotland as defined by Ordnance Survey is 3,167 km².
- Recent trends: April 2024 represents the only OS MasterMap Greenspace data currently available from the Ordnance Survey.
- Baseline: 3,166km2
- Desired trend: Increase
Proportion of adults who live within a 5-minute walk of their nearest green or blue space
- Description: In 2022, 70% of adults reported living within a 5-minute walk of their nearest green or blue space.
- Recent trends: This percentage has remained broadly stable since 2013, where it was 68%. There has been a slight, steady increase from 2017 from 65% to 70%.
- Baseline: 70%
- Desired trend: Increase
Nature Connects – indicator summaries
ECOSYSTEM HEALTH AND CONNECTIVITY
Habitat Connectivity Index
|
Indicator |
Habitat Connectivity Index |
|
Description |
This habitat connectivity indicator measures ‘functional connectivity’. This refers to how well species can move from one habitat patch to another. This indicator shows the functional connectivity of three habitats (Woodland; Heathland; Grassland;). |
|
Data holder |
Nature Scot |
|
Unit |
% of total habitat area per catchment |
The Habitat Connectivity Index was selected to represent the functional health of natural ecosystems in Scotland. Habitat networks enable species to follow their shifting climate envelope and move to new habitats, ensuring their survival and the continuity of ecosystem services. Connectivity is crucial for promoting the survival, migration, and adaptation potential of species populations in response to climate change. By assessing functional connectivity, this indicator provides valuable insights into ecosystem resilience, highlighting areas where habitat fragmentation might increase the risk and exposure of species to climate-related impacts. Enhancing habitat connectivity directly supports the adaptive capacity of species by facilitating movement and gene flow, thereby reducing vulnerability, and supporting biodiversity conservation (Haddad et al., 2015). It reflects the interconnectedness of ecosystems and underscores the importance of maintaining and improving habitat connectivity to mitigate climate risks and enhance the adaptive capacity of natural systems (Krosby et. al., 2010).
Proportion of surface water bodies classified in good or better condition
|
Indicator |
Proportion of surface water bodies classified in high or good condition |
|
Description |
This indicator shows the proportion of surface water body with an overall status classified either “good” or “high”. SEPA monitors the environment to assess the condition of water quality, water resources, physical condition, fish migration and the impact of invasive non-native species. If any single aspect of a water body is classified as below good, that water body’s overall condition is reported as below good. |
|
Data holder |
Scottish Environment Protection Agency (SEPA) |
|
Unit |
% |
We chose ‘proportion of surface water bodies classified in high or good condition’ as a proxy for climate change adaptation because it reflects the health and quality of water ecosystems. Healthy water bodies are more resilient to climate change impacts such as altered precipitation patterns, increased temperatures, and pollution. By maintaining high and good conditions, these water bodies can better support biodiversity and delivery of ecosystem services that fulfil human needs, particularly regarding climate adaptation (Palmer et al., 2009).
Proportion of Scotland’s protected sites in favourable condition
|
Indicator |
Proportion of Scotland’s protected sites in favourable condition |
|
Description |
This indicator shows the efforts to improve the condition of natural features in protected sites as they will ensure terrestrial habitats are in good ecological health in Scotland. This indicator relates to the quality of natural habitats. |
|
Data holder |
Nature Scot |
|
Unit |
% |
We chose ‘proportion of Scotland’s protected sites in favourable condition’ as a proxy to reflect the health and resilience of Scottish ecosystems. Healthy and well-managed protected sites are better able to withstand and adapt to the impacts of climate change, such as shifting species distributions and extreme weather events (Watson et al., 2014). This indicator shows how effectively Scotland is preserving biodiversity and ecosystem services, which are crucial for climate resilience. It is important to look at the proportion of sites in favourable condition by habitat type. Indeed, habitats such as native woodland, which are vulnerable to overgrazing and invasive non-native species, have a lower percentage (56.8%) of sites in favourable condition than the other types of habitats (average of 73.4%).
Proportion of soft shorelines affected by coastal erosion
|
Indicator |
Proportion of soft shorelines affected by coastal erosion |
|
Description |
This indicator shows the proportion of shorelines experiencing coastal erosion in Scotland. |
|
Data holder |
Ordnance Survey |
|
Unit |
% |
Scotland’s coastline is estimated to be 18,743 km in length along the high-water line. This indicator was chosen as coastal erosion affects society’s assets such as infrastructure and cultural heritage, and contributes to more frequent coastal flooding. Coastal erosion is exacerbated by climate change. Implementing adaptation strategies to protect Scotland’s coasts is crucial to protect the biodiversity of coastal ecosystems. It also ensures the safety and resilience of coastal communities against climate impacts, as well as the resilience of regional and national infrastructure (McGranahan et al., 2007).
URBAN GREEN INFRASTRUCTURE
Extent of green-blue land cover in urban areas
|
Indicator |
Extent of green-blue land cover in urban areas |
|
Description |
This indicator shows the accessible and non-accessible greenspaces (woodland open semi-natural areas, inland water, beach or foreshore, manmade surface, multi-surface) in urban areas in Scotland. |
|
Data holder |
Ordnance Survey |
|
Unit |
% |
This indicator is chosen as a proxy for integration of nature into urban settlements. Green infrastructures within towns and cities are NbS designed to reduce the urban heat island effect, improve resilience to flooding and provide an opportunity for people to enjoy and benefit from nature. Compared to technology-based solutions to climate challenges, NbS like green-blue land cover in urban areas are often more cost-effective and longer lasting. They also have multiple co-benefits, such as reducing net emissions, providing habitats for biodiversity, enhancing human health and well-being (Demuzere et al., 2014; Gill et al., 2007).
Proportion of adults who live within a five-minute walk of their nearest green or blue space
|
Indicator |
Proportion of adults who live within a five-minute walk of their nearest green or blue space. |
|
Description |
This indicator measures the proportion of adults who live within a five-minute walk of their nearest green or blue space. |
|
Data holder |
Scottish Household Survey |
|
Unit |
% |
This indicator is chosen as a proxy to reflect the extent communities have access to natural spaces. Easy access to green and blue spaces enhances community resilience in the face of climate stressors by promoting well-being (e.g. air quality improvement, mental and physical health, etc.) (Maas et al., 2006). Access to green and blue spaces helps mitigate the urban heat island effect, providing cooler areas that can reduce heat-related health risks during extreme weather events. Lastly, green and blue spaces contribute to biodiversity and water management, supporting ecosystems that buffer against climate impacts such as flooding (Demuzere et al., 2014).
Communities are creating climate-resilient, healthy and equitable places
Overview
This outcome focuses on empowering communities to create climate-resilient, healthy and equitable places. It adopts a place-based approach, acknowledging that climate impacts vary by local context. Key initiatives include establishing Climate Action Hubs, developing collaborative planning partnerships and providing capacity-building support. This community-centred approach seeks to ensure adaptation efforts are inclusive, address local needs and build societal resilience to climate impacts. Figure 4 presents the SNAP3’s pathway from objectives to outcome and impact for the Communities outcome.[4]
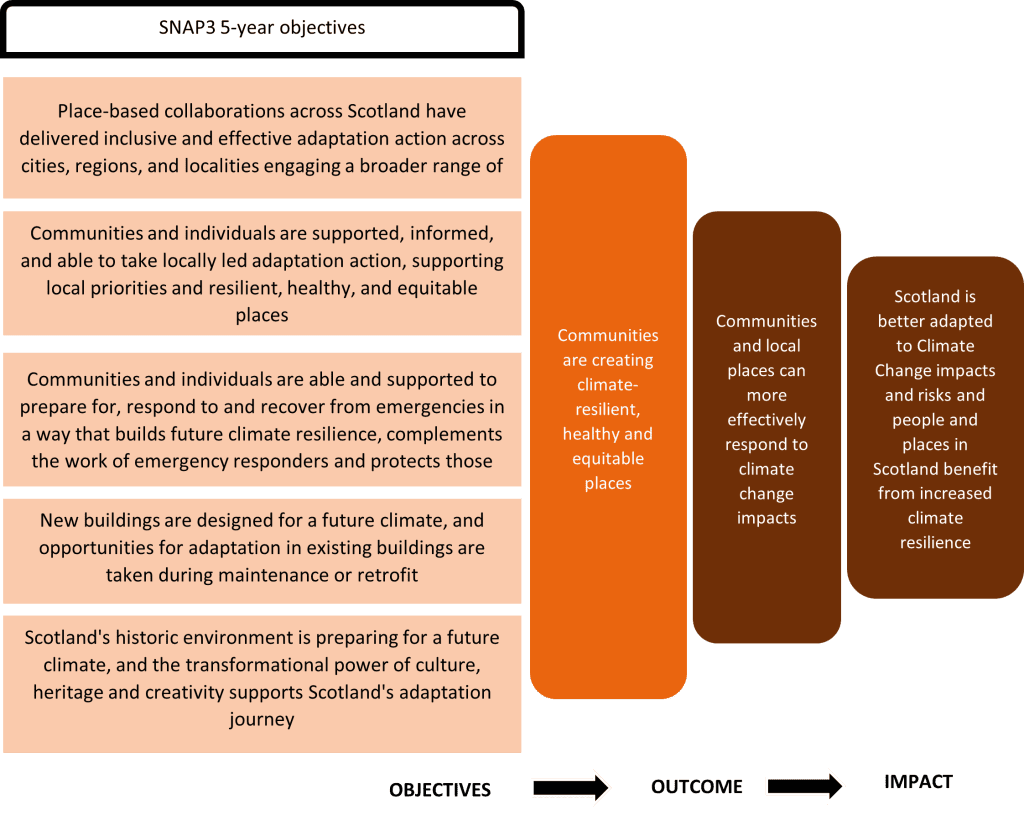
Considerations for indicator selection
Following the desk-based review and stakeholder engagement, several considerations emerged regarding indicator selection for the Communities outcome:
- Data on exposure to climate-related hazards provides information on the places where efforts need to be intensified to limit inequalities, for example, if hazard data is coupled with data on deprivation or social vulnerability (Sayers, PB., et al., 2021). We explored one indicator related to the exposure of vulnerable populations to climate-related hazards. This indicator sought to understand inequality in how communities are impacted by climate hazards. There are limitations to such an indicator focusing on exposure to flood, heat, drought, or wildfire, as it does not consider the resilience of the population exposed. While exposure is unlikely to change in the short to medium term, measures to reduce the vulnerability of those most exposed to risks will be key to increasing their resilience. It is, therefore, important data but less suitable as an indicator measuring increased community resilience for the purposes of this work. The overall conclusion was that the indicators for the Communities outcome should focus more on actions being taken by communities that are indicative of resilience.
- Flooding and the action taken to adapt to this hazard was a focus for consideration due to its significance as a climate-related hazard for Scotland. Example indicators include the ‘proportion of flood resilience action undertaken’ or ‘uptake of property flood protection measures in deprived areas’, or ‘responses to surveys on adaptation action’. Indicators around property flood protection measures and insurance were considered. However, although schemes such as “Build back better” exist, there were insufficient national data available to include this indicator.
- A combination of two indicators, ‘progress of actions in local flood risk management plans’ and ‘percentage of the population declaring that they understand what actions they should take to help tackle climate change’ were selected as proxies to capture community action in climate adaptation.
- Collaboration at community level was often mentioned as essential when it comes to adaptation to ensure the salience, credibility and legitimacy of actions and common understanding, ownership, and a desire to implement. The level of community climate collaboration is captured through monitoring the Community Climate Action Hubs (CCAH) and Local Place Plans.
- Health is embedded in all the areas of SNAP3. This makes it difficult to have a general indicator linking health to climate-related hazards and issues, such as heatwaves, cold, flooding, vector-borne diseases, and food systems. This could only be captured by a fuller set of indicators focusing on health and well-being. A dataset measuring climate morbidity in Scotland could be relevant as a future outcome indicator for SNAP4 should suitable data become available. For this indicator set, a focus on wellbeing is taken using national data on the Warwick-Edinburgh Mental Wellbeing Scale (WEMWBS).
Communities – proposed indicators
When setting out to develop a list of indicators for the Communities outcome, we aimed to cover aspects of community resilience, health, and equity. Of the four indicators selected for this outcome, three indicators reflected the community resilience aspect (level of community awareness; level of community climate action; and progress of actions in local flood risk management plans). There was a particular challenge in capturing the complexity of health and equity in relation to climate adaptation with only a few high-level indicators in this framework. Instead of health, a focus on community wellbeing was taken with the use of national data on the Warwick-Edinburgh Mental Wellbeing Scale (WEMWBS). With elements of health and equity not explicitly covered, we have instead put onus on using established indicators and available data to monitor levels of community action in creating resilient, healthy, and equitable places. Monitoring this level of community action, be it in increased community awareness, the growth of Community Climate Action Hubs (CCAH) and Local Place Plans (LPP) or in specific community actions around flood management, provides important insight on how communities are adapting to climate change.
The proposed indicators are:
- Level of community awareness around climate change
- Level of community climate action
- Progress of actions in local flood risk management plans
- Level of community wellbeing.
Below we present the baseline information for each of the four indicators proposed to monitor the Communities outcome. For each indicator, we provide the baseline value, a description of the baseline, the recent trend and desired trend for each indicator to provide context. More information on baseline data is available in Annex 5. This is followed by a further detailed summary of each indicator and the rationale for their inclusion.
Communities – baseline
Proportion of adults viewing climate change as an immediate and urgent problem
- Description: In 2022, 74% of adults viewing climate change as an immediate and urgent problem.
- Recent trends: The Scottish population concerned about climate change representing an immediate and urgent problem has risen every year since 2013, where 46% held this view. In 2017, 61% held this view.
- Baseline: 74%
- Desired trend: Increase
Proportion of the population declaring that they understand what actions they should take to help tackle climate change
- Description: In 2022, 80% of adults agreed that they understood what actions they should take to help tackle climate change.
- Recent trends: In 2018, 74% of adults stated they understood what actions they should take to help tackle climate change.
- Baseline: 80%
- Desired trend: Increase
Number of Community Climate Action Hubs
- Description: In 2024, 20 hubs across Scotland support community-led climate action, covering 81% of the Scottish council areas.
- Recent trends: The first two hubs launched in September 2021 and the network has now expanded, consisting of the 20 hubs.
- Baseline: 81%
- Desired trend: Increase
Number of Local Place Plans
- Description: In 2024, no local place plans have been adopted.
- Recent trends: Many councils have recently invited communities to prepare Local Place Plans so that they can play a proactive role in defining the future of their places.
- Baseline: 0
- Desired trend: Increase
Progress of actions in local flood risk management plans
- Description: In 2019, 90% of the actions to avoid an increase in flood risk were complete. By 2021, 100% of the actions were expected to be complete. In 2019, 84% of the actions to reduce flood risk were complete. By 2021, 96% of the actions were expected to be complete.
- Recent trends: progress was assessed for cycle 1 (2015-2021).
- Baseline: 90% (completed actions to avoid an increase in flood risk), 84% (completed actions to reduce flood risk)
- Desired trend: Increase
Level of community wellbeing
- Description: In 2022, the mean WEMWBS score for all adults was 47.0
- Recent trends: The mean WEMWBS score for all adults remained stable between 2008 and 2019, between 49.4 and 50.0. Since 2019, it has decreased to 48.6 in 2021 and now 47.0 in 2022.
- Baseline: 47.0
- Desired trend: Increase
Communities – indicator summaries
Community awareness around climate change
|
Indicator |
Level of community awareness around climate change |
|
Description |
This indicator is measured by the following:
|
|
Data set holder |
Scottish Household Survey |
|
Unit |
% |
This indicator is chosen as it combines the knowledge of what is required to tackle climate change with the perception of urgency in addressing climate change. This combination is a critical aspect of community resilience. A well-informed community that recognises the urgency of climate action is more likely to engage in adaptive behaviours (Marshall et al., 2013; Shi et al., 2016). This indicator provides insights into the adaptive capacity of communities and their readiness to implement adaptation measures.
Community action on climate change
|
Indicator |
Level of community climate action |
|
Description |
This indicator covers the number of Community Climate Action Hubs (CCAH) and Local Place Plans in Scotland. Community Climate Action Hubs are centers that support local initiatives focused on climate resilience, providing resources, education, and networking opportunities to empower communities in addressing climate challenges. This indicator will look at the percentage across all Scotland’s regions that have at least one CCAH. Local Place Plans are community-led plans that detail the aspirations and priorities of residents for the development and improvement of their areas, ensuring that local voices are integrated into the broader planning process. |
|
Data set holder |
Scottish Government |
|
Unit |
CCAH – % / LPP – Number |
This indicator was selected as the number of Community Climate Action Hubs in Scotland indicates strong community resilience. This is done through fostering local engagement, resource distribution, capacity building, innovation, network-building, and policy advocacy for climate adaptation (Agrawal, 2008). Local Place Plans act as a good proxy for community-led collaboration and action. The data is available and how the hubs and plans relate to action is understandable to wider audiences.
Community flood resilience
|
Indicator |
Progress of actions in local flood risk management plans |
|
Description |
This indicator measures the progress of actions to reduce or avoid flooding set in the Flood Management Plans. |
|
Data set holder |
The 14 lead local authorities in charge of local Flood Risk Management Plans |
|
Unit |
% of actions completed |
This indicator focuses on actions of local authorities to build community flood resilience. It emphasises the importance of communities playing an active role in reducing the impact of climate change effects, in this case increased flooding (McEwen et al., 2014). This aspect is a key part of communities creating climate-resilient, healthy, and equitable places. These flood risk management plans are part of Scotland’s route map for reducing the effects of flooding on communities. This is key to Scotland’s health, wellbeing and economic success, with an estimated 284,000 homes, businesses and services identified as at risk of flooding.
Community wellbeing
|
Indicator |
Level of community wellbeing |
|
Description |
This indicator measures adults (aged 16+) average score on the Warwick-Edinburgh Mental Wellbeing Scale (WEMWBS). The WEMWBS scale comprises 14 positively worded statements designed to assess positive affect, satisfying interpersonal relationships and positive functioning. |
|
Data set holder |
Scottish Health Survey |
|
Unit |
Mean score on WEMWBS scale |
This indicator captures the extent of wellbeing within communities. Evidence shows that experience of the effects of climate change, for example a flooding event, and the capacity to adapt or react to it has a direct impact on mental health (Berry et al., 2018; Palinkas & Wong, 2020). Therefore, it is representative of communities and their health in relation to adaptation.
Public services are collaborating in effective and inclusive adaptation action
Overview
This outcome addresses the need for public services to collaborate effectively on adaptation. It aims to enhance governance, culture, skills and resources within public services to enable effective adaptation. Key actions include strengthening the Public Sector Climate Adaptation Network, modernising water industry adaptation and embedding adaptation across transport networks. This approach seeks to ensure continued delivery of essential services and infrastructure resilience amidst climate change. Figure 5 presents the SNAP3’s pathway from objectives to outcome and impact for Public Services.[5]
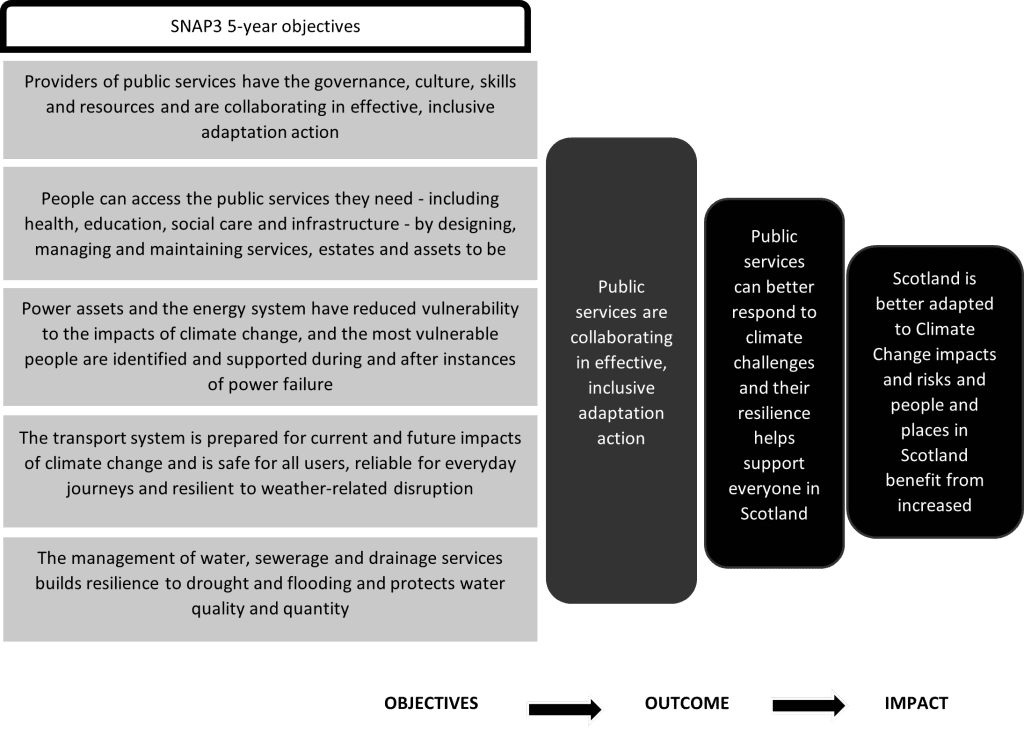
Considerations for indicator selection
Following the desk-based review and stakeholder engagement, several considerations emerged regarding indicator selection for the Public Services outcome:
- We determined that focusing on specific sectoral indicators related to the adaptation of critical infrastructure would result in numerous indicators. This would go against a core aim of our work to develop a concise and clear set of indicators. As discussed, the Scottish Government’s work developing indicators at an objective level has taken place alongside development of the outcome indicators presented in this report. Specific sectoral indicators have been determined at the objective level rather than being included in the high-level outcome indicators developed through this work.
- We explored the possibility of an indicator around participation levels at a recently established infrastructure adaptation forum. However, the objectives and the ambitions of this forum are still at an early stage and it was not possible to determine a baseline, so it was not included here.
- Collaboration is an important aspect of this outcome. The extent of collaboration of public service bodies is captured through the Sustainable Scotland Network annual report. The quality of collaboration is equally as important to capture. However, there is currently insufficient data available to incorporate this element within the outcome indicators.
Public services – proposed indicators
When setting out to develop a list of indicators for the Public Services outcome, we aimed to cover the extent of collaboration between public services, as well as the extent of effective and inclusive adaptation. These indicators use data available to capture high-level insights on the extent of public sector collaboration and adaptation actions that public bodies are taking. These indicators do not cover the extent to which these actions are effective or inclusive. Ultimately, this can only be captured at a sector-specific level, as no generalised metric for effectiveness or inclusiveness of public services and infrastructure exists. It was not possible to go to the level of sector-specific indicators for public services and infrastructure as this would result in numerous indicators.
The proposed indicators are:
- Level of collaboration across public services
- Level of adaptation actions across public services.
Below we present the baseline information for each of the two indicators proposed to monitor the Public Services outcome. For each indicator, we provide the baseline value, a description of the baseline, the recent trend and desired trend for each indicator to provide context. More information on baseline data is available in Annex 5. The is followed by a further detailed summary of each indicator and the rationale for their inclusion.
Public services – baseline
This section presents baseline information. For each indicator, we provide the baseline value, a description of the baseline, the desired trend for each indicator and recent trends for each baseline to provide context.
Number of public bodies members in the Public Sector Climate Adaptation Network
- Description: In 2024, the Public Sector Climate Adaptation Network counted 50 members.
- Recent trends: the Public Sector Climate Adaptation Network was launched in 2019 with 40 major organisations. 10 additional 10 organisations joined the Network in October 2023.
- Baseline: 50
- Desired trend: Increase
Number of public bodies citing the Work in partnership & collaborations as a priority for the year ahead in relation to climate change adaptation
- Description: In 2022-2023, 53.2% of the 188 listed public bodies (100 public bodies) submitting an annual compliance report cite “Work in Partnerships & Collaborations” in their top five priorities for the year ahead in relation to climate change adaptation.
- Recent trends: In 2021/22, 36.2% of public bodies declared that they prioritized “Work in Partnerships & Collaborations”.
- Baseline: 53.2%
- Desired trend: Increase
Level of risk assessment across the public sector
- Description: 70.2% of the public bodies submitting an annual compliance report have completed some form of risk assessment during or prior to the 2022/23 reporting period. 43.6% of bodies have carried out a limited risk assessment. 20.7% of bodies have carried out a comprehensive risk assessment. 5.8% have completed an advanced risk assessment, involving stakeholders and considering a range of climate or socioeconomic scenarios.
- Recent trends: In 2021/22 reporting, 66.0% of public bodies submitted some form of adaptation risk assessment.
- Baseline:
- Limited risk assessment: 43.6%
- Comprehensive risk assessment: 20.7%
- Advanced risk assessment: 5.8%
- Desired trend: Increase
Level of adaptation action taken across the public sector
- Description: 71.8% of all listed public bodies submitting an annual compliance report have taken adaptation action during or prior to the 2022/23 reporting period. 44% of bodies have taken some action, 21% of all bodies are taking good action. 6% of bodies are taking advanced action.
- Recent trends: In 2021/22 reporting, 67.0% of public bodies reported taking some form of action on adaptation.
- Baseline:
- Some actions taken: 44%
- Good action taken: 21%
- Advanced action taken: 6%
- Desired trend: Increase
Public Services – indicator summaries
Level of collaboration across public services
|
Indicator |
Level of collaboration across public services |
|
Description |
This indicator is a combination of:
and
|
|
Data set holder |
Adaptation Scotland and Sustainable Scotland Network on behalf of Scottish Government |
|
Unit |
This indicator is selected as a proxy to demonstrate the level of collaborative effort between different public bodies on shared outcomes and priorities. Collaboration is vital to tackling the complex challenges involved in strengthening climate resilience. Effective collaboration can enhance adaptive capacity, reduce vulnerability, and ensure a cohesive response to climate change (Runhaar et al., 2018).
Level of adaptation actions across public services
|
Indicator |
Level of adaptation actions across public services |
|
Description |
This indicator is measured by the following:
This indicator is a combination of two pieces of information reported by 188 public bodies according to Section 44 of the Climate Change (Scotland) Act 2009. The level of risk assessment (none, limited, comprehensive, advanced) and of adaptation action (none, some, good, advanced) taken across the public sector are assessed. The Sustainable Scotland Network manages the annual reporting process and analyses the returns on behalf of the Scottish Government. |
|
Data set holder |
Sustainable Scotland Network on behalf of the Scottish Government |
|
Unit |
% |
This indicator captures the level of climate adaptation actions undertaken by public bodies. The public sector must assess and address climate risks through adaptation planning and action to ensure the quality of its services to the population in a changing climate (Runhaar et al., 2018). By monitoring the level of risk assessment and adaptation actions, this indicator provides insights into the preparedness and resilience of public services.
Economies and industries are adapting and realising opportunities in Scotland’s Just Transition.
Overview
This outcome focuses on adapting the economy and industries to realise opportunities in Scotland’s Just Transition. It aims to support businesses in understanding and responding to climate risks, whilst fostering innovation in adaptation solutions. Key actions include increasing business awareness of climate risks, supporting adaptation in sectors like farming and forestry, and promoting Scotland as an innovation hub for adaptation solutions. This approach seeks to ensure Scotland’s economy remains competitive and resilient whilst capitalising on emerging opportunities. Figure 6 presents SNAP3’s pathway from objectives to outcome and impact for Economy, Business and Industry.[6]
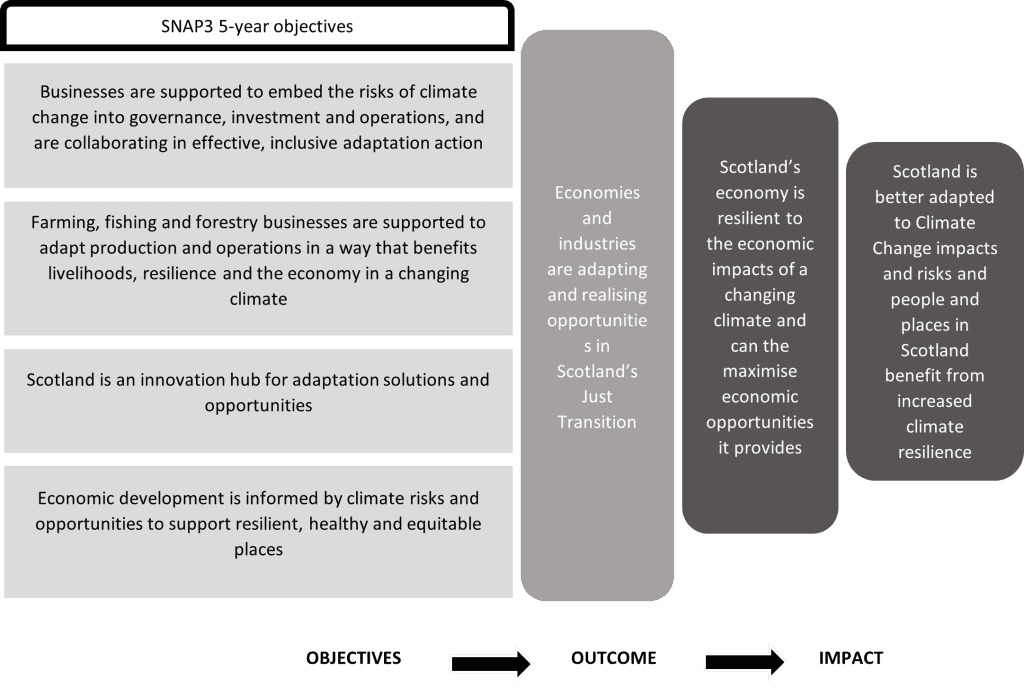
Considerations for indicator selection
Following the desk-based review and stakeholder engagement, several considerations emerged regarding indicator selection for the Economy, Business and Industry outcome:
- Investments in climate resilience, with a specific taxonomy for adaptation-related investment, was considered a potential indicator. Such a taxonomy would prove a useful indicator for how the economy is adapting to climate change. However, while initiatives are emerging, this has not been fully implemented at national level yet. It is something to consider for inclusion in the next SNAP.
- The direct economic loss associated with climate-related hazards, such as flooding was considered. Some stakeholders felt that many businesses could be reluctant to invest in resilient infrastructure because its benefits are not easily quantified. Capturing direct loss associated with climate-related hazards helps industries understand the value of investments in adaptation. Nevertheless, no viable dataset currently exists for such an indicator in the Scottish context.
- An indicator on green jobs is included in the indicator set. However, it does not capture the development of adaptation skills needed by existing Scottish businesses to address the challenges of climate change. Training employees to increase adaptation knowledge and skills specific to the needs of individuals or businesses is an important aspect that is not captured as no viable dataset currently exists.
- Sustainable practice in the agriculture sector is the focus of one indicator, given it accounts for 69% of Scotland’s total land use. Another area of the economy initially considered was the forestry sector. An indicator “percentage of certified woodland area in Scotland” was considered. However, considering that certification mostly applies to woodlands used for timber production and not woodlands more generally, the coverage of this indicator was considered too limited.
- The proportion of agricultural land categorised as High Nature Value (HNV) Farming has initially been chosen as a proxy of adaptation to climate change in agriculture in Scotland. High Nature Value (HNV) Farming is an indicator used to identify agricultural systems that support high levels of biodiversity through low-intensity, traditional farming practices. HNV farms are more likely to be resilient to climate variability and extreme weather events. However, this indicator was not selected because the latest baseline is from 2013 and has not been updated since then. Should new data become available this indicator could be reviewed in the future.
- Capturing innovation in Scotland’s economy was considered as an important aspect of this outcome. However, given the broad scope, complexity and subjectivity around what constitutes innovation, it is a difficult aspect to capture in a single quantitative indicator and is, therefore, not included.
Economy, Business and Industry – proposed indicators
It is important that the indicators cover the preparedness and adaptation of businesses and industries and the extent into which they take advantage of economic opportunities linked to climate change. The five indicators selected cover business preparedness and action using data periodically recorded by the Business Insights and Conditions Survey. The use of Office of National Statistics (ONS) data on green jobs provides an indicator for the transition towards a climate-smart economy and workforce skills development for the green economy. Another indicator focused specifically on adaptation action in the agricultural sector, which is a significant part of the Scottish economy. Taken together, this set of indicators uses available data to provide a broad indication of whether Scotland’s economy is adapting to climate change. Nevertheless, there are some key aspects that are not covered. These include levels of investment in climate adaptation initiatives and economic resilience (e.g., economic loss related to climate-related hazards) as well as the level of innovation from businesses in responding to climate risks.
The proposed indicators are:
- Proportion of businesses monitoring climate-related risks
- Proportion of businesses taking action to adapt to the effects of climate change
- Number of green jobs
- Uptake of grants for agriculture storage reservoirs and off-season storage lagoons.
Below we present the baseline information for each of the five indicators proposed to monitor the Economy, Business and Industry outcome. For each indicator, we provide the baseline value, a description of the baseline, the recent trend and desired trend for each indicator to provide context. More information on baseline data is available in Annex 5. This is followed by a further detailed summary of each indicator and the rationale for their inclusion.
Economy, Business and Industry – baseline
Proportion of businesses monitoring climate related risks
- Description: In 2023, 15.6% of Scotland businesses have assessed risks for supply chain disruption and distribution, 6.2% for increased flooding and 4.4% for temperature increase.
- Recent trends: August 2023 was the first time the question related to businesses monitoring climate related risks was asked.
- Baseline:
- Supply chain disruption: 15.6%
- Increased flooding: 6.2%
- Temperature increase 4.4%
- Desired trend: Increase
Proportion of businesses taking action to adapt to the effects of climate change
- Description: In 2023, 26.5% of Scotland businesses have taken action to adapt supply chain disruption and distribution, 11.5% to adapt to increased flooding and 4.4% to adapt to temperature increase.
- Recent trends: August 2023 was the first time the question related to businesses taking adaptation action was asked.
- Baseline:
- Supply chain disruption: 25.6%
- Increased flooding: 11.5%
- Temperature increase 5.7%
- Desired trend: Increase
Number of green jobs
- Description: In 2022, Scotland employment in green jobs in 2022 was estimated at 46,200 full-time equivalents (FTEs).
- Recent trends: This number has increased yearly since 2015 (32,800 FTE), except between 2021 and 2022.
- Baseline: 46,200
- Desired trend: Increase
Uptake of grants for agriculture irrigation lagoons
- Description: In 2024, 5 AECS applications for irrigation lagoons were successful. 14 applications were submitted.
- Recent trends: the number of applications submitted and successful are usually between 0 and 2 per year.
- Baseline: 5
- Desired trend: Increase
Economy, Business and Industry – indicator summaries
Business awareness of climate adaptation
|
Indicator |
Proportion of businesses monitoring climate related risks |
|
Description |
This indicator is a survey question from the Business Insights and Conditions Survey. |
|
Data holder |
Office for National Statistics |
|
Unit |
% |
This indicator captures the level of knowledge and awareness of climate-related risks by businesses. Ensuring businesses across Scotland are aware of the risks that climate change may pose to their operations, premises, staff, and supply chains is a crucial component of a climate resilient economy (Linnenluecke et al., 2013; Surminski, 2013).
Business preparedness in climate adaptation
|
Indicator |
Proportion of businesses taking action to adapt to the effects of climate change |
|
Description |
This indicator is a survey question from the Business Insights and Conditions Survey. |
|
Data holder |
Office for National Statistics |
|
Unit |
% |
This indicator captures businesses’ capacity to respond to the risks posed by climate change. Ensuring businesses across Scotland have a plan to face the risks climate change may pose to their operations, premises, staff and supply chains will be crucial to building a more climate resilient economy (Linnenluecke et al., 2013; Surminski, 2013).
Green jobs in the Scottish economy
|
Indicator |
Total Scotland employment in green jobs |
|
Description |
This indicator looks at green jobs, as defined as “employment in an activity that contributes to protecting or restoring the environment, including those that mitigate or adapt to climate change”; they can be estimated using industry, occupation, and firm approaches. This indicator follows an industry-based approach which includes all jobs in a green industry or sector and provides our headline estimate of employment in green jobs. |
|
Data holder |
Office for National Statistics |
|
Unit |
Number |
This indicator monitors the adaptation opportunity in Scotland’s Just Transition as it directly tracks employment in environmentally sustainable sectors. This indicator reflects the economic growth and industry shift towards sustainable practices, essential for climate adaptation and effective Just Transition (Martinez-Fernandez et al., 2010).
Agriculture water-use efficiency
|
Indicator |
Uptake of grants for agriculture irrigation lagoons |
|
Description |
This indicator follows the number of applied and approved agricultural projects (AECS) to improve water-use efficiency by collecting and storing water in an irrigation lagoon. |
|
Data set holder |
Scottish Government |
|
Unit |
Number of applications and approved grants |
This indicator represents proxy of adaptation by the agricultural sector. Improving water storage efficiency through irrigation lagoons is a strategic adaptation measure that addresses several challenges posed by climate change: it helps mitigate the variability of rainfall patterns and allow farmers to store water during periods of excess rainfall to ensure a steady water supply for crops. It will also contribute to reduce the stress on Scotland’s water resources and reduce flood risk at times by capturing and storing excess rainfall runoff (Schmitt et. al., 2022).
Discussion
Conclusions
Climate adaptation is complex and multifaceted, spanning across sectors and scales. Therefore, MEL of climate adaptation will always be challenging. Nevertheless, monitoring the extent to which an adaptation plan’s outcomes are achieved is essential to understand the effectiveness of its associated activities and policies. Ultimately, efforts to monitor adaptation plans, such as SNAP3, must navigate this complexity, seeking a balance of indicators that is relevant, robust, and practical to implement. We have sought to achieve this balance by taking a systematic approach to the selection of indicators through desk-based review and extensive engagement with stakeholder groups across Scottish governmental departments and associated organisations. The assessment has been grounded in the practical reality of what data is available rather than theoretically ideal indicators.
In relation to the relevance and robustness of indicators, we have developed outcome indicators that efficiently capture most of the core elements of four of SNAP3’s outcomes.
For the Nature Connects outcome, the indicators proposed cover ecological connectivity, ecological health, and urban-nature connection. Taken together, these indicators will provide useful insights on progress in securing the resilience of Scotland’s natural ecosystems to climate change. Lack of an indicator specifically for marine ecosystems, due to inadequate available data, is a key, is a key limitation.
For the Communities outcome, capturing health and equity in high-level, generalised indicators was challenging due to the complexity of these issues. Therefore, the proposed indicators focus on monitoring community action of relevance to climate adaptation.
For the Public Services outcome, the proposed indicators focus upon collaboration and adaptation actions at a high-level. It was impractical to address the effectiveness of actions, as the number of different sectors associated with this outcome would result in numerous indicators.
For the Economy, Business, and Industry outcome, the indicators proposed cover areas of business preparedness and action, the extent of the transition to green economy, and the extent to which an important sector of the economy (agriculture) is undertaking climate adaptation. While acknowledging that the level of investment in climate adaptation initiatives and economic losses resulting from climate-related hazards is not addressed, these indicators will still provide useful insights about the delivery of this outcome.
Regarding practical implementation, the proposed indicators redeploy established indicators that, crucially, are based on accessible data. Most are publicly reported, although some require correspondence with the relevant Scottish Government data holder. The proposed indicators allow for a baseline to be established at the start of SNAP3 and then reported against after a five-year period. There is variation on the extent of historic data available across the indicators; there; there is more extensive data on previous trends for some than others. Importantly, we believe the relevance of proposed indicators is clear and they are straightforward to apply. As such, they can be used at the end of the five-year period by those who have not been closely involved in their development.
The stakeholder engagement process was critical in the development of the outcome indicators. A wide range of relevant stakeholders across Scotland engaged in one-to-one calls, workshops or written feedback to provide insights both conceptually on what indicators might capture SNAP3 outcomes and practically on what data are available. This engagement provided sector- and topic-specific knowledge, as well as offering validation of the final proposed set of indicators. Several themes emerged from this process of engagement. First, there was an inherent tension between what is ideal and what is possible. Discussions sometimes veered more towards enthusiasm about theoretically ideal indicators that monitor outcomes rather than being grounded in the practical reality of what data is available. While this certainly did not negate the importance of discussing ideal indicators, it was important to ensure, insofar as possible, that an onus on what is practically possible influenced the discussion.
Second, often data limitations lay at the heart of challenges regarding identification of suitable indicators. The limitations took different forms: no data existed (e.g., economic loss from climate-related hazards); it was insufficiently captured (e.g., marine species’ abundance); or it was not easy to access or publicly available (e.g., data on Build Back Better grants). It is not uncommon for data limitations to be a significant obstacle to developing indicators for climate adaptation (Vallejo, 2017).
Third, the SNAP3 outcomes are structured in a clearly defined way, which was beneficial for developing the set of proposed indicators, these outcomes overlap in ways that should be acknowledged. One example relates to the Communities outcome and the Public Services outcome, as collaboration is of significance for both community resilience and for effective public services. Hence, community actors and public service actors cannot be clearly distinguished from each other. Another example is the emphasis of Nature Connects outcome on access to green space and associated health benefits that overlaps with the community health and wellbeing aspects of the Communities outcome. Such overlaps are not inherently problematic but did point to the need for the net to be cast as wide as possible when considering stakeholder engagement for when identifying indicators.
Recommendations
Several recommendations and next steps emerge from this work. It is important to finalise the outcome indicators for SNAP3 as soon as possible, as applying these indicators consistently will be crucial to enable meaningful comparisons against the baseline. Any changes made to individual indicators or the data that underpin them may compromise the ability to track progress consistently relative to the baseline. Furthermore, it is important to maintain continuity, quality and availability of data required by each indicator. It is vital to maintain the allocation of resources to the collection, maintenance and accessibility of datasets used by the indicators across all relevant Scottish Government departments.
Whilst the indicators represent a complete and operational indicator set, there should be a flexibility regarding potential for additional indicators. New indicators may be added in the immediate term if relevant data becomes available. For example, an ecosystem functions indicator for Nature Connects or a green finance investment indicator for Economy, Business, and Industry are anticipated in the near future. While the suite of indicators addresses the needs for monitoring the outcomes of SNAP3, it may be viewed as a foundation to build upon regarding monitoring of SNAP4.
Lastly, we recommend establishing a working group to sustain the functioning of the indicators. The working group could comprise key stakeholders and data providers who could meet annually to review the functioning of the indicators and address any issues regarding their deployment, e.g., continuity and availability of data and its quality. Furthermore, this working group would build on the strong interest evident across a wide range of stakeholders to engage in the topic of climate adaption MEL.
References
Agrawal, A. (2008). The role of local institutions in adaptation to climate change. In Social Dimensions of Climate Change: Equity and Vulnerability in a Warming World (pp. 173-198). World Bank.
Beauchamp, E. & Józefiak, I., 2023. Breaking the Glass Ceiling at COP 28: Four key elements to ensure a successful global goal on adaptation. International Institute for Sustainable Development. Available at: https://www.iisd.org/publications/report/global-goal-on-adaptation-monitoring-evaluation-learning-framework-cop-28 [Accessed 16 July 2024].
Beauchamp, E., Leiter, T., Pringle, P., Brooks, N., Masud, S., and Guerdat, P., 2024. Toolkit for Monitoring, Evaluation, and Learning for National Adaptation Plan Processes. NAP Global Network. Available at: https://www.adaptation-undp.org/sites/default/files/resources/internal_brief_transparency-mrv-me-april202249_adjusted_doc_revised.pdf [Accessed 16 July 2024].
Berry, H. L., Waite, T. D., Dear, K. B., Capon, A. G., & Murray, V. (2018). The case for systems thinking about climate change and mental health. Nature Climate Change, 8(4), 282-290.
Biden, A., 2022. 5 Smart Indicators in Monitoring and Evaluation. tools4dev. Available at: https://tools4dev.org/blog/smart-indicators-in-monitoring-and-evaluation/ [Accessed 16 July 2024].
Climate Change Committee (CCC), 2022, Is Scotland Ready? 2022 Report to Scottish Parliament. Available at: https://www.theccc.org.uk/publication/asc-writes-to-scottish-government-about-outcomes-based-approach-for-the-sccap/
Climate Change Committee, 32023. Adapting to climate change – Progress in Scotland. Climate Change Committee. Available at: https://www.theccc.org.uk/publication/adapting-to-climate-change-progress-in-scotland/ [Accessed 16 July 2024].
Demuzere, M., Orru, K., Heidrich, O., Olazabal, E., Geneletti, D., Orru, H., Bhave, A.G., Mittal, N., Feliu, E. & Faehnle, M. (2014) Mitigating and adapting to climate change: multi-functional and multi-scale assessment of green urban infrastructure, Journal of Environmental Management, 146, pp. 107–115.
Food and Agriculture Organization of the United Nations (FAO), 2017. Tracking adaptation in agricultural sectors. FAO. Available at: https://www.fao.org/policy-support/tools-and-publications/resources-details/en/c/1193260/ [Accessed 16 July 2024].
Global Environmental Facility (GEF), 2016. Monitoring and Evaluation of Climate Change Adaptation. Global Environment Facility. Available at: https://www.thegef.org/sites/default/files/council-meeting-documents/EN_GEF.STAP_.C.51.Inf_.03_M%26E_of_CCA.pdf [Accessed 16 July 2024].
Gabbatiss, J. & Lempriere, M., 2024. Bonn climate talks: Key outcomes from the June 2024 UN climate conference. Carbon Brief. Available at: https://www.carbonbrief.org/bonn-climate-talks-key-outcomes-from-the-june-2024-un-climate-conference/ [Accessed 16 July 2024].
Gill, S. E., Handley, J. F., Ennos, A. R., & Pauleit, S. (2007). Adapting cities for climate change: the role of the green infrastructure. Built Environment, 33(1), 115-133.
Haddad, N.M., Brudvig, L.A., Clobert, J., Davies, K.F., Gonzalez, A., Holt, R.D., Lovejoy, T.E., Sexton, J.O., Austin, M.P., Collins, C.D., Cook, W.M., Damschen, E.I., Ewers, R.M., Foster, B.L., Jenkins, C.N., King, A.J., Laurance, W.F., Levey, D.J., Margules, C.R., Melbourne, B.A., Nicholls, A.O., Orrock, J.L., Song, D.X. & Townshend, J.R. (2015) Habitat fragmentation and its lasting impact on Earth’s ecosystems, Science Advances, 1(2), e1500052
Krosby, M., Tewksbury, J., Haddad, N. M., & Hoekstra, J. (2010). Ecological connectivity for a changing climate. Conservation Biology, 24(6), 1686-1689.
Linnenluecke, M.K., Griffiths, A. & Winn, M.I. (2013) Firm and industry adaptation to climate change: a review of climate adaptation studies in the business and management field, Wiley Interdisciplinary Reviews: Climate Change, 4(5), pp. 397–416.
Maas, J., Verheij, R.A., Groenewegen, P.P., de Vries, S. & Spreeuwenberg, P. (2006) Green space, urbanity, and health: how strong is the relation?, Journal of Epidemiology & Community Health, vol. 60, no. 7, pp. 587–592.
Mäkinen, K., Prutsch, A., Karali, E., Leitner, M., Völler, S., Lyytimäki, J., Pringle, P., and Vanneuville, W., 2018. Indicators for adaptation to climate change at national level – Lessons from emerging practice in Europe. European Topic Centre on Climate Change impacts, Vulnerability and Adaptation (ETC/CCA) Technical paper 2018/3. DOI: 10.25424/CMCC/CLIMATE_CHANGE_ADAPTATION_INDICATORS_2018.
Marshall, N. A., Park, S. E., Howden, S. M., Dowd, A. B., & Jakku, E. S. (2013). Climate change awareness is associated with enhanced adaptive capacity. Agricultural Systems, 117, 30-34.
Martinez-Fernandez, C., Hinojosa, C. & Miranda, G. (2010) Green jobs and skills: The local labour market implications of addressing climate change, OECD Local Economic and Employment Development (LEED) Working Papers, 2010/02, OECD Publishing, Paris.
McEwen, L., Jones, O. & Robertson, I. (2014), ‘A glorious time?’ Some reflections on flooding in the Somerset Levels, The Geographical Journal, 180(4), pp. 326-337.
McGranahan, G., Balk, D., & Anderson, B. (2007). The rising tide: assessing the risks of climate change and human settlements in low elevation coastal zones. Environment and Urbanization, 19(1), 17-37.
Moss, A., 2019. A monitoring and evaluation framework for the second SCCAP. ClimateXChange. Available at: https://www.climatexchange.org.uk/publications/a-monitoring-and-evaluation-framework-for-the-second-sccap/ [Accessed 16 July 2024].
New, M., Reckien, D., Viner, D., Adler, C., Cheong, S.-M., Conde, C., Constable, A., Coughlan de Perez, E., Lammel, A., Mechler, R., Orlove, B., and Solecki, W., 2022. Decision-Making Options for Managing Risk. In: Pörtner, H.-O., Roberts, D.C., Tignor, M., Poloczanska, E.S., Mintenbeck, K., Alegría, A., Craig, M., Langsdorf, S., Löschke, S., Möller, V., Okem, A., and Rama, B. (eds.) Climate Change 2022: Impacts, Adaptation and Vulnerability. Contribution of Working Group II to the Sixth Assessment Report of the Intergovernmental Panel on Climate Change. Cambridge University Press, Cambridge, UK and New York, NY, USA, pp. 2539–2654, doi:10.1017/9781009325844.026.
Organisation for Economic Co-operation and Development (OECD), 2015. National Climate Change Adaptation: Emerging Practices in Monitoring and Evaluation. OECD Publishing, Paris. Available at: http://dx.doi.org/10.1787/9789264229679-en [Accessed 16 July 2024].
Peter, S., & Peter, F., 2009. Evaluation of Indicators for EU Policy Objectives. Ecologic Institute. Available at: https://www.ecologic.eu/sites/default/files/publication/2016/1901-research_note-d2-1-evaluation-of_indicators-for-eu-policy-objectives-2009.pdf [Accessed 16 July 2024].
Palinkas, L. A., & Wong, M. (2020). Global climate change and mental health. Current Opinion in Psychology, 32, 12-16
Palmer, M. A., Lettenmaier, D. P., Poff, N. L., Postel, S. L., Richter, B., & Warner, R. (2009). Climate change and river ecosystems: protection and adaptation options. Environmental Management, 44(6), 1053-1068.
Runhaar, H., Wilk, B., Persson, Å., Uittenbroek, C., & Wamsler, C. (2018). Mainstreaming climate adaptation: taking stock about ‘what works’ from empirical research worldwide. Regional Environmental Change, 18, 1201-1210.
Sayers, PB., Lindley. S, Carr, S and Figueroa-Alfaro, R. W, 2021. The impacts of climate change on population groups in Scotland. Research undertaken by Sayers and Partners in association with the University of Manchester for ClimateXChange.
Schmitt, R.J. P., Rosa, L., Daily, G. (2022), ‘Global expansion of sustainable irrigation limited by water storage’, Proceedings of the National Academy of Sciences, 119 (47), https://doi.org/10.1073/pnas.2214291119.
Shi, J., Visschers, V.H.M., Siegrist, M. & Arvai, J. (2016) Knowledge as a driver of public perceptions about climate change reassessed, Nature Climate Change, 6, pp. 759–762.
Surminski, S. (2013) Private-sector adaptation to climate risk, Nature Climate Change, 3(11), pp. 943–945.
United Nations Development Programme (UNDP), 2022. Transparency, MRV, and M&E. United Nations Development Programme. Available at: https://www.adaptation-undp.org/sites/default/files/resources/internal_brief_transparency-mrv-me-april202249_adjusted_doc_revised.pdf [Accessed 16 July 2024].
United Nations Framework Convention on Climate Change (UNFCCC), 2024. Synthesis of submissions on the UAE – Belém work programme on indicators, Advance Unedited Version. UNFCCC. Available at: https://unfccc.int/documents/638384 [Accessed 16 July 2024].
United Nations Framework Convention on Climate Change (UNFCCC), 2023. Draft technical paper on monitoring and evaluation of adaptation at the national and subnational level (AC22). UNFCCC. Available at: https://unfccc.int/sites/default/files/resource/ac22_7c_monitoring_evaluation.pdf [Accessed 16 July 2024].
United States Environmental Protection Agency (EPA), 2017, . Development of a Climate Resilience Screening Index (CRSI): An Assessment of Resilience to Acute Meteorological Events and Selected Natural Hazards. EPA. Available at: https://cfpub.epa.gov/si/si_public_record_report.cfm?dirEntryId=335758 [Accessed 16 July 2024].
Vallejo, L. (2015). Insights from national adaptation monitoring and evaluation systems. In Mullan, M., Kingsmill, N., Agrawala, S. & Kramer, A.M. (eds) National Adaptation Planning: Lessons from OECD Countries. Springer, Cham. Available at: https://www.oecd.org/en/publications/2017/06/insights-from-national-adaptation-monitoring-and-evaluation-systems_d2e677fe.html [Accessed 16 July 2024].
Watson, J. E. M., Dudley, N., Segan, D. B., & Hockings, M. (2014). The performance and potential of protected areas. Nature, 515, 67-73.
Annexes
Annex 1 – Policies reviewed
The following policies were reviewed for sectorial indicators that could be relevant for the SNAP3 outcome indicators.
Scottish policies listed in the draft SNAP3 for the outcome area “Nature connects across our lands, settlements, coasts and seas”:
|
|
Scottish policies listed in the draft SNAP3 for the outcome area “Communities creating climate-resilient, healthy and equitable places”:
Scottish policies listed in the draft SNAP3 for the outcome area “Public services are collaborating in effective, inclusive adaptation action”:
Scottish policies listed in the draft SNAP3 for the outcome area “Economies and industries are adapting and realising opportunities in Scotland’s Just Transition”:
Annex 2 – Initial longlist of indicators
The initial longlist of indicators is listed below. This longlist was shared with stakeholders and revised through engagement as described in section 2.
Initial longlist of indicators for the outcome area “Nature connects across our lands, settlements, coasts and seas”:
|
|
|
|
|
|
|
|
|
|
|
|
Initial longlist of indicators for the outcome area “Communities creating climate-resilient, healthy and equitable places”:
|
|
|
|
|
|
|
|
|
|
|
Initial longlist of indicators for the outcome area “Public services are collaborating in effective, inclusive adaptation action”:
|
|
|
|
|
|
|
|
|
|
|
|
|
|
Initial longlist of indicators for the outcome area “Economies and industries are adapting and realising opportunities in Scotland’s Just Transition”:
|
|
|
|
|
|
|
|
|
|
Annex 3 – Workshop participation
The following organisations participated in the workshops.
Organisations represented in the workshop “Nature connects across our lands, settlements, coasts and seas”:
- Centre of Expertise for Waters
- Edinburgh Council
- Forestry and Land
- Glasgow City Council
- Highlands and Islands Airports
- James Hutton Institute
- Marine Directorate of Scottish Government
- National Centre for Resilience
- Nature Scot
- Public Health Scotland
- SEPA
- Scottish Government
- Scottish Water
- Sniffer
Organisations represented in the workshop “Communities creating climate-resilient, healthy and equitable places”:
- FloodRe
- Glasgow City Council
- National Centre for Resilience
- National Resilience Scotland
- Nature Scot
- Public Health Scotland
- Scottish Dynamic Coast
- Scottish Flood Forum
- Scottish Government
- Scottish Land Commission
- Scottish Waters
- Sniffer
- Strathclyde University
Organisations represented in the workshop “Public services are collaborating in effective, inclusive adaptation action”:
- Climate Change Committee
- Glasgow City Council
- MET Office
- Nature Scot
- Network Rail
- Public Health Scotland
- SEPA
- Scottish Flood Forum
- Scottish Government
- Scottish Water
- Sniffer
- Transport Scotland
- University of Strathclyde
Organisations represented in the workshop “Economies and industries are adapting and realising opportunities in Scotland’s Just Transition”:
- Climate Change Committee
- Forestry and Land Scotland
- Glasgow City Council
- Marine Directorate of Scottish Government
- Scottish Government
- SEPA
- Scottish Water
- Sniffer
Annex 4 – Indicator criteria
OUTCOME: Nature connects across our lands, settlements, coasts, and seas
ECOSYSTEM HEALTH AND CONNECTIVITY
Habitat Connectivity Index
|
Criterion |
Rating |
Assessment |
|
Adaptation Relevance |
Green |
This indicator addresses habitat connectivity and quality, which are important aspect for assessing the vulnerability of ecosystems to climate change. By evaluating how well species can move and adapt to changing conditions, the indicator provides valuable insights into the adaptive capacity of habitats. |
|
Representativeness |
Amber |
The indicator covers four key types of habitats: Woodland, Heathland, Grassland, and Fen/Marsh/Swamp – habitats that are representative of the broader landscape and crucial for maintaining ecological functions and services. However, the indicator does not cover freshwater, marine and coastal environments, and therefore has some limitations in its representativeness of indicating ecological health and connectivity. |
|
Data Availability |
Amber |
Data is collected by NatureScot. Data for CSGN area is publicly available on NatureScot’s website. However, data for the whole Scotland is provided directly by NatureScot and is not published online. |
|
Sensitivity |
Amber |
Updating this indicator every five years is considered a sensible frequency to observe meaningful changes in habitat connectivity. There may be a lag in reporting years, with data being published on average 2 years after. The up-to-date data may therefore not be available immediately at the end of the Plan. |
|
Understanding |
Green |
This indicator on habitat connectivity can be widely understood by a broad range of stakeholders in relation to improved ecological health and associated resilience. |
|
Baseline |
Green |
The indicator was last updated in 2022 for semi-natural grassland, heathland, and semi-natural woodland. Baseline maps are available on the Nature Scot website, providing a reference point for measuring changes over time. These baselines are crucial for assessing the progress and effectiveness of adaptation measures. The metric uses to calculate the habitat connectivity it is the Equivalent Connected Area (Probability of Connectivity), the ECA (PC). |
|
Practicality |
Green |
The data is publicly available and detailed by catchment area, making it practical for use in planning and decision-making processes. This accessibility ensures that stakeholders can utilize the information to enhance habitat connectivity and support climate adaptation strategies. The practical application of this data supports localized adaptation efforts and helps to mitigate the impacts of climate change on biodiversity and ecosystem services. |
Proportion of surface water bodies classified in good or better condition
|
Criterion |
Rating |
Assessment |
|
Adaptation relevance |
Green |
This indicator is relevant for climate adaptation as it addresses the quality and health of water ecosystems, which are critical for reducing vulnerability and enhancing adaptive capacity. By tracking the proportion of water bodies in good or high condition, this indicator provides insights into the resilience of water ecosystems and their capacity to adapt to changing climatic conditions. |
|
Representativeness |
Amber |
The indicator is broadly effective for monitoring ecological health as it encompasses key aspects of ecosystem quality. Although it has limitations due to its primary focus on surface water bodies, it can be used as a useful proxy for the status of broader ecological and biodiversity conditions. |
|
Data availability |
Green |
Full GIS data for this indicator is available on the SEPA website, ensuring that data is current and reliable. The data is updated every year by SEPA. |
|
Sensitivity |
Green |
Changes in water quality and ecosystem health can be noted over a five-year timescale interventions. |
|
Understanding |
Green |
This indicator on water quality can be widely understood by a broad range of stakeholders in relation to improved ecological health and associated resilience. |
|
Baseline |
Green |
The indicator is publicly available on SEPA’s website has an established baseline from 2007 to 2022. |
|
Practicality |
Green |
Statistical and mapping data for this indicator is already being collected and publicly accessible, making it practical to monitor as an indicator. |
Proportion of Scotland’s protected sites in favourable condition
|
Criterion |
Rating |
Assessment |
|---|---|---|
|
Adaptation relevance |
Green |
Protected sites play a role in improving the adaptive capacity of vulnerable species by providing safe havens with the functional network that species can migrate from or too. This indicator is relevant for climate adaptation as it directly relates to the resilience of ecosystems and their ability to adapt to changing environmental conditions. |
|
Representativeness |
Amber |
While the indicator is a useful proxy for ecological health and connectivity, its limitation should be noted. The indicator does not include offshore marine sites and features in Scotland beyond 12 nautical miles, and primarily focuses on protected sites and not all natural sites, which may limit its representativeness of the broader ecological health and connectivity. |
|
Data availability |
Green | |
|
Sensitivity |
Amber |
The indicator has shown longer-term changes, though it may not reflect notable changes within shorter periods, such as from 2023 to 2024. While a five-year timescale may be too short to observe long-term trends, the indicator is suitable to detect significant changes over longer periods. |
|
Understanding |
Green |
This indicator on condition of protected sites can be widely understood by a broad range of stakeholders in relation to improved ecological health and associated resilience. |
|
Baseline |
Green |
The indicator has an established baseline from 2005 to 2024, with historical data available for comparison. |
|
Practicality |
Green |
Statistical and mapping data for this indicator is already being collected and publicly accessible, making it practical to monitor as an indicator. |
Proportion of soft shorelines affected by coastal erosion
|
Criterion |
Rating |
Assessment |
|
Adaptation relevance |
Green |
Monitoring the extent of coastal erosion is relevant to climate adaptation as it reflects the efficacy of implemented adaptation measures in enhancing coastal resilience. |
|
Representativeness |
Green |
This indicator represents the coastal component of the Nature Connects outcome of the SNAP3. |
|
Data availability |
Amber |
Data is publicly available, however, it is not specifically stated how long the programme hosting the data is running for. |
|
Sensitivity |
Green |
Changes in this indicator are sufficient sensitive to the time-period of SNAP3. |
|
Understanding |
Green |
The connection between the extent of coastal erosion as a proxy for coastal adaptation to climate change is generally recognised. |
|
Baseline |
Green |
Baseline data available from 2017 and 2021. |
|
Practicality |
Green |
The indicator is publicly available on the Center of Expertise for Waters (CREW) website. It has been developed under the Dynamic Coast project. |
URBAN GREEN INFRASTRUCTURE
Extent of green-blue land cover in urban areas
|
Criterion |
Rating |
Assessment |
|---|---|---|
|
Adaptation relevance |
Green |
Green-blue land cover in urban areas reflects the extent of natural spaces in cities that provide crucial ecosystem services. It is relevant for climate adaptation as it captures how well cities are prepared to adapt to the challenges posed by climate change, making urban environments more sustainable and liveable. |
|
Representativeness |
Amber |
This indicator offers a good coverage of Scotland, with urban areas defined as those with a population more than 500. It covers public and private greenspaces, including woodland, open semi-natural, inland water, beach or foreshore, and manmade surface. It also distinguishes the different functions of greenspaces, such as public park or garden, school grounds, private garden, allotments, playing fields, etc. However, it does not cover the tree canopy over hard surfacing or green roofs, which are also relevant in terms of adaptation. |
|
Data availability |
Amber |
This dataset “OS MasterMap Greenspace Layer” is updated every 6 months by Ordnance Survey, but requires a licence to access it. |
|
Sensitivity |
Green |
Land use modification in urban areas can be noted over a five-year timescale. |
|
Understanding |
Green |
This indicator on green-blue land cover in urban areas can be widely understood by a broad range of stakeholders in relation to the extent of natural spaces in cities associated with resilience. |
|
Baseline |
Green |
This dataset “OS MasterMap Greenspace Layer” can be purchased on the Ordnance Survey website |
|
Practicality |
Amber |
Data is available in ESRI Shapefile, GML 3.2.1, GeoPackage and Vector Tiles format. The GIS map has to be purchased and analysed to be transformed to actual percentage. |
Proportion of adults who live within a five-minute walk of their nearest green or blue space
|
Criterion |
Rating |
Assessment |
|---|---|---|
|
Adaptation relevance |
Amber |
The indicator captures the distance to the nearest public or open space, but does not reflect the level of accessibility, the perception of safety people have toward the green and blue spaces nor the frequency of access. |
|
Representativeness |
Green |
The figures for this indicator come from the Scottish Household Survey (SHS). It covers the whole Scottish territory and includes people resident in Scotland aged 16 and over. The SHS sample has been designed to allow annual publication of results at Scotland level and for local authorities. To meet these requirements, the target sample size for Scotland was 10,450 household interviews with a minimum local authority target of 250. |
|
Data availability |
Green |
The data is published annually in the Scottish Household Survey Annual Report. |
|
Sensitivity |
Amber |
Changes in the proportion of adults who live within a five-minute walk of their local green or blue space can be noted over a five-year timescale. There is a lag in reporting years up to a maximum of one year (e.g. 2024 fieldwork ending in January 2025 with publication of results later in 2025) The up-to-date data will therefore not be available immediately at the end of the Plan. |
|
Understanding |
Green |
This indicator can be widely understood by a broad range of stakeholders. |
|
Baseline |
Green |
The figures for this indicator come from the Scottish Household Survey (SHS) which is a National Statistics product produced by the Scottish Government. This indicator is also part of the National Performance Framework. |
|
Practicality |
Green |
Statistical data for this indicator is already being collected and publicly accessible, making it practical to monitor as an indicator. |
OUTCOME: Communities are creating climate-resilient, healthy and equitable places.
Community awareness around climate change
|
Criterion |
Rating |
Assessment |
|
Adaptation relevance |
Amber |
This indicator is relevant for climate adaptation as it improves community adaptive capacity through knowledge enhancement. By understanding what actions are necessary to tackle climate change and recognizing the urgency of these actions, communities can better prepare for and respond to climate impacts. This knowledge reduces vulnerability and increases resilience. However, the question asked does not specifically address the impacts of climate change, the criteria is therefore orange. |
|
Representativeness |
Green |
The survey provides useful snapshot on the awareness and knowledge of communities around climate change. The SHS sample has been designed to allow annual publication of results at Scotland level and for local authorities. To meet these requirements, the target sample size for Scotland was 10,450 household interviews with a minimum local authority target of 250. |
|
Data availability |
Green |
The Scottish Household Survey climate awareness and action questions are asked biennially on odd years. The results are publicly available. |
|
Sensitivity |
Amber |
This indicator is sensitive to changes for the purposes of SNAP3 monitoring, as observed the marked changes that occurred in public perception and knowledge between 2019-2022. There is a lag in reporting years up to a maximum of one year (e.g. 2024 fieldwork ending in January 2025 with publication of results later in 2025)The up-to-date data will therefore not be available immediately at the end of the Plan. |
|
Understanding |
Green |
There is a clear connection on how understanding climate actions and the urgency of these actions relate to progress in climate adaptation. |
|
Baseline |
Green |
The baseline data for this indicator is available since 2019, providing a reference point for measuring changes in community awareness and perception over time. |
|
Practicality |
Amber |
The Scottish Household Survey has been collecting data since 1999, making it a practical, cost-effective, and well-established method for gathering information. |
Community action on climate change
|
Criterion |
Rating |
Assessment |
|
Adaptation relevance |
Green |
Community climate action hubs will improve knowledge of communities and enhances the preparedness of communities. |
|
Representativeness |
Amber |
This indicator does not capture the quality of action and may therefore not be fully representative of the effectiveness of climate actions. While it shows the presence of CCAHs and LPPs, it does not measure the depth or impact of the actions taken through these hubs/plans. |
|
Data availability |
Green |
Data is held by the Scottish Government, and is publicly accessible on the Scottish Government website: Community climate action hubs: contact details – gov.scot (www.gov.scot) . |
|
Sensitivity |
Amber |
This indicator is sensitive to changes for the purposes of SNAP3 monitoring, as observed by marked changes that between 2019-2022. |
|
Understanding |
Green |
It is easy to see the connection between the existence and maintenance of CCAHs and LLPs as metrics for climate action, although it might not be clear what specific actions arise from these. |
|
Baseline |
Amber |
20 CCAHs as of June 2024 (81% of the council areas covered). |
|
Practicality |
Amber |
Information on LPPs is not located in one centralised place, so requires time and resource to obtain. |
Community flood resilience
|
Criterion |
Rating |
Assessment |
|
Adaptation relevance |
Green |
This indicator is relevant to climate adaptation progress as it indicates the implementation effectiveness of strategies to mitigate flood risks and enhance community resilience. |
|
Representativeness |
Green |
Flooding is considered a significant climate hazard, as outlined in the SNAP3, therefore an indicator that captures action for this is representative of climate-resilient communities. |
|
Data availability |
Green |
Updated data on progress will be publicly available in 2025 and 2028. Data will be published by the 14 lead local authorities in charge of local Flood Risk Management Plans, and information will be centralised by SEPA. |
|
Sensitivity |
Green |
Changes in this indicator are sufficiently sensitive to the time-period of SNAP3 monitoring. However, reports are not published annually so the up-to-date data will therefore not be available immediately at the end of the Plan. |
|
Understanding |
Green |
The extent that actions are taking place to manage the impacts of flooding are clear to understand for a wide audience. |
|
Baseline |
Amber |
Actions to reduce or avoid flood are collated by the 14 lead local authorities in charge of Local Flood management Plans in their Flood Management Plan assessment report. The latest report was published in 2021, and the next one is expected in December 2025. |
|
Practicality |
Green |
Data is easy to obtain and easy to use to understand progress. |
Community wellbeing
|
Criterion |
Rating |
Assessment |
|
Adaptation relevance |
Amber |
Not directly related to climate change adaptation, but the experience of the effects of climate change, for example a flooding event, and the capacity to adapt or react to it has a direct impact on mental health. This indicator highlights the intersection between mental wellbeing and climate resilience, showing how adaptive capacity influences community health. |
|
Representativeness |
Amber |
Wellbeing metrics are useful indicators of community health, however, health and its impacts from climate change are wide-ranging in scope. Therefore, there is ultimately limitations that must be acknowledged with this indicator when representing overall community health. |
|
Data availability |
Green |
Data is publicly available from Scottish Government. |
|
Sensitivity |
Amber |
Whilst minor changes have been observed since 2006, this does not necessarily point to a lack of sensitivity in relation to the information this indicator provides. There is a lag in reporting years, with data being published on average one year later. The up-to-date data will therefore not be available immediately at the end of the Plan. |
|
Understanding |
Amber |
Whilst the concept of mental wellbeing and its importance as a metric of community resilience is easy to understand, how this indicator relates to climate adaptation is not clear. |
|
Baseline |
Green |
The baseline data from 2022 shows a mean score of 47.0 on the WEMWBS scale. |
|
Practicality |
Green |
Data has been monitored since 2006, the established data collection processes ensure that this indicator can be consistently and reliably monitored. |
OUTCOME: Public services are collaborating in effective and inclusive adaptation action
Level of collaboration across public services
|
Criterion |
Rating |
Assessment |
|---|---|---|
|
Adaptation relevance |
Green |
Collaboration is vital component of climate adaptation planning. Effective collaboration can enhance adaptive capacity, reduce vulnerability, and ensure a cohesive, equitable response to climate change. |
|
Representativeness |
Amber |
While this indicator shows the level of participation and collaboration, it does not capture the quality or depth of progress in terms of collaboration. It measures quantity rather than the effectiveness of the collaborative actions being taken. |
|
Data availability |
Green |
Data on the participation of public bodies in the Public Climate Adaptation Network is publicly available from Adaptation Scotland and the Sustainable Scotland Network. |
|
Sensitivity |
Amber |
While the indicator data is sensitive enough for the purposes of SNAP3 monitoring, the number of public bodies participating to the Public Climate Adaptation Network is not expected to rise significantly because Adaptation Scotland’s strategy is to integrate few members at a time to insure their good and lasting integration into the network. For the Public bodies climate change duties reporting, there is a lag in reporting years, with data being published on average 1 year after. The up-to-date data will therefore not be available immediately at the end of the Plan. |
|
Understanding |
Green |
This indicator is widely understood with the importance of collaboration in climate adaptation is broadly recognised and easily communicated. |
|
Baseline |
Green |
The baseline data is from 2024 for the Public Climate Adaptation Network and from 2022/23 for the SSN report. |
|
Practicality |
Green |
Data is easy to obtain and utilise to monitor progress over the SNAP3 monitoring period. |
Level of adaptation actions across public services
|
Criterion |
Rating |
Assessment |
|
Adaptation relevance |
Green |
This indicator is highly relevant to adaptation, providing information on levels of risk assessments undertaken by public sector and the extent that adaptation action is taking place. |
|
Representativeness |
Green |
The indicator is representative insights on the extent public services are engaging in adaptation action. However, it only captures the level of risk assessment and action of public bodies subject to mandatory reporting. |
|
Data availability |
Green |
Data is collected annually, providing a regular update on the level of adaptation action across public services. Data is publicly available. |
|
Sensitivity |
Amber |
Changes in collaboration will likely be observed over a five-year time period. There is a lag in reporting years, with data being published on average 1 year after. The up-to-date data will therefore not be available immediately at the end of the Plan. |
|
Understanding |
Amber |
This indicator requires some understanding of SSN’s analytical framework (and subjective nature of assessment) but the concept of risk assessment is widely understood. |
|
Baseline |
Green |
The baseline for this indicator is established from data collected in 22022-3. |
|
Practicality |
Green |
Data is easy to obtain and utilise to monitor progress over the SNAP3 monitoring period. |
OUTCOME: Economies and industries are adapting and realising opportunities in Scotland’s Just Transition.
Business awareness of climate adaptation
|
Criterion |
Rating |
Assessment |
|
Adaptation relevance |
Green |
Business action in relation to adaptation can make them more resilient and prepared for climate hazards, thereby reducing vulnerability. |
|
Representativeness |
Amber |
This indicator represents well the business adaptation component of the Economy, Business and Industry outcome area. It should be noted that it represents businesses with 10 or more employees. |
|
Data availability |
Green |
Data is publicly available and reported on annually. |
|
Sensitivity |
Amber |
Notable changes in the number of business monitoring climate risks is observable in the five-year period. This question was asked in August 2023. There exists potential for it to be asked soon after the end of the plan and therefore no lag in reporting. |
|
Understanding |
Green |
There is a clear connection between the extent in which businesses are monitoring climate risks and how this relates to adapting economy, business and industry. |
|
Baseline |
Green |
Baseline data available from August 2023. |
|
Practicality |
Green |
Data is being captured by BICS already, and practical to use. |
Business preparedness in climate adaptation
|
Criterion |
Rating |
Assessment | |
|---|---|---|---|
|
Adaptation relevance |
Green |
Business action in relation to adaptation can make them more resilient and prepared for climate hazards, thereby reducing vulnerability. | |
|
Representativeness |
Amber |
This indicator represents well the business adaptation component of the Economy, Business and Industry outcome area. It should be noted that it represents businesses with 10 or more employees. | |
|
Data availability |
Green |
Data is publicly available and reported on annually. | |
|
Sensitivity |
Amber |
Notable changes in the number of business monitoring climate risks is observable in the five-year period. This question was asked in August 2023. There exists potential for it to be asked soon after the end of the plan and therefore no lag in reporting. | |
|
Understanding |
Green |
There is a clear connection between the extent in which businesses are monitoring climate risks and how this relates to adapting economy, business and industry. | |
|
Baseline |
Green |
Baseline data available from August 2023. | |
|
Practicality |
Green |
Data is being captured by BICS already, and practical to use. |
Green jobs in the Scottish economy
|
Criterion |
Rating |
Assessment |
|
Adaptation relevance |
Amber |
The green jobs definition signifies its relevance to adaptation. However, important to realise limitations around green jobs, for example – adaptation considered as thinking embedded into all businesses, and not just new jobs created. |
|
Representativeness |
Amber |
In its focus on employment/skills in relation to climate adaptation, this indicator represents well the business adaptation component of the Economy, Business and Industry outcome area. |
|
Data availability |
Green |
Data is publicly available and captured annually. It should be noted that this data is currently categorised as ‘official statistics in development’. This means the data is potentially subject to revision. However, as stated by the Office of National Statistics, this data, even when in development, is considered sufficient quality to be used.[7] |
|
Sensitivity |
Amber |
Changes in this indicator are sufficiently sensitive to the time-period of SNAP3 monitoring. There is a lag in reporting years, with data being published on average 2 years after (e.g. 2022 data was published in March 2024). The up-to-date data will therefore not be available immediately at the end of the Plan. |
|
Understanding |
Amber |
The connection between a ‘green job’ and its relevance to climate adaptation is potentially unclear, therefore terminology and definitions used must be clearly stated. |
|
Baseline |
Green |
Baseline data available between 2015-2022. |
|
Practicality |
Green |
Statistical data for this indicator is already being collected and publicly accessible, making it practical to monitor as an indicator. |
SUSTAINABLE PRACTICE IN THE AGRICULTURE SECTOR
Agriculture water-use efficiency
|
Criterion |
Rating |
Assessment |
|---|---|---|
|
Adaptation relevance |
Green |
Improve water use efficiency in agriculture increases the resilience of farms against several effects of climate change. |
|
Representativeness |
Amber |
The east of Scotland is more concerned by drought risk than the west of the country. Moreover, irrigation lagoons are large-scale projects, but other ways to increase water-use efficiency can also be implemented on farms and will not be captured by this indicator. |
|
Data availability |
Amber |
Data is captured annually by Scottish governmentGovernment but is not publicly available. |
|
Sensitivity |
Green |
Changes in this indicator are sufficiently sensitive to the time-period of SNAP3 monitoring. |
|
Understanding |
Green |
There is a clear connection between water use efficiency and adaptation in the agricultural sector. |
|
Baseline |
Green |
Data has been collated annually since 2015. |
|
Practicality |
Amber |
This information is not publicly available. |
Annex 5 – Baseline information for each indicator
|
Indicator |
Year |
Baseline |
Data source |
|
Nature Connects Nature connects across our lands, settlements, coasts, and seas | |||
|
Habitat Connectivity Index |
2020 |
Equivalent Connected Area (Probability of Connectivity) (ECA (PC)) values from 2020 are available for Scotland for semi-grassland, woodlands and heathland. The data used was the 2020 EUNIS Level 2 landcover map produced by Space Intelligence. To get an overall ECA (PC) value from the local authorities data, each value needs to be squared, the totals summed and then the square root taken. The total Equivalent Connected Area (Probability of Connectivity) (ECA (PC) value for Scotland was 35,570 ha for semi-grassland (2.9%), 5,655 ha for woodland (1.4%) and 214,277 ha for heathland (8.3%). The overall national percentage figure is always going to be lower for each habitat than the individual local authority figures. This is because in a larger area you have more individual habitat patches which results in a lower connectivity measurement. |
For CSGN data visualisation: Habitat Connectivity Indicator – CSGN (arcgis.com) The data for whole Scotland was provided directly by NatureScot. |
|
Proportion of surface water bodies classified in good or better condition |
2022 |
445 (13.7%) surface water bodies in high condition, 1664 surface water bodies in good condition (51.2%) on a total of 3 249 surface water bodies monitored. | |
|
Proportion of Scotland’s Protected Sites in Favourable Condition |
2024 |
65.1% of natural features in favourable condition ‘Site condition monitoring assessment). If we include the sites where monitoring has detected signs of recovery, but favourable condition has not been reached (6.1%) and the sites with positive management is in place that is expected to improve the condition of the site (4.4%), the overall number reaches 75.6%. For woodlands (the least favourable habitat type), the proportion of sites in favourable condition is 56.8%. |
The Proportion of Scotland’s Protected Sites in Favourable Condition 2024 | NatureScot |
|
Proportion of soft shorelines affected by coastal erosion |
2021 |
46% of the soft coast is affected by coastal erosion. The average rate of erosion is 0.43 m/year. | |
|
Extent of green-blue landcover in urban areas |
2024 |
As of April 2024, the total area of urban greenspace in Scotland, as defined by Ordnance Survey, is 3,166 km². | |
|
Proportion of adults who live within a 5-minute walk of their nearest green or blue space |
2022 |
70% of adults reported living within a 5-minute walk of their nearest green or blue space. |
Supporting documents – Scottish Household Survey 2022: Key Findings – gov.scot (www.gov.scot) |
|
Communities creating climate-resilient, healthy and equitable places | |||
|
Proportion of adults viewing climate change as an immediate and urgent problem |
2022 |
74% of adults viewing climate change as an immediate and urgent problem. “Adult” refers to those aged 16 and over. | |
|
Proportion of the population declaring that they understand what actions they should take to help tackle climate change |
2022 |
80% of adults agreed that they understood what actions they should take to help tackle climate change. “Adult” refers to those aged 16 and over. | |
|
Number of Community Climate Action Hubs |
2024 |
There are currently 20 hubs across Scotland supporting community-led climate action. It covers 81% of the Scottish council areas (26 council areas covered by the 20 hubs). | |
|
Number of Local Place Plans |
2024 |
No local place plans have been adopted yet. Many councils have recently invited communities to prepare Local Place Plans so that they can play a proactive role in defining the future of their places. |
This information has not been centralised and published in one place by the Scottish government. |
|
Progress of actions in local flood risk management plans |
2019/21 |
90% of the actions set out in the strategies to avoid an increase in flood risk are green. 10% of the actions are amber. By 2021, 100% of the actions are expected to be complete. 84% of the actions described in the strategies to reduce flood risk are green, 12% of the actions are amber and 4% are red. With 96% of the actions completed or underway by 2021, the actions developed to meet the reduce objectives will mostly be achieved. | |
|
Mental wellbeing score (WEMWBS) |
2022 |
In 2022, the mean WEMWBS score for all adults was 47.0. |
Scottish Health Survey 2022 Main Report Volume 1 (www.gov.scot) |
|
Public services are collaborating in effective, inclusive adaptation | |||
|
Number of public bodies members in the Public Sector Climate Adaptation Network |
2024 |
50 organisations are currently members of the Public Sector Climate Adaptation Network. |
Adaptation Scotland :: Public Sector Climate Adaptation Network |
|
Number of public bodies citing the Work in partnership & collaborations as a priority s for the year ahead in relation to climate change adaptation |
2022/23 |
53.2% of the 188 listed public bodies (100 public bodies) submitting an annual compliance report cite “Work in Partnerships & Collaborations” in their top 5 priorities for the year ahead in relation to climate change adaptation. |
Public Bodies Climate Change Reporting – Analysis Report 2022/23 (sustainablescotlandnetwork.org) |
|
Level of risk assessment across the public sector |
2022/23 |
70.2% of all listed public bodies submitting an annual compliance report have completed some form of risk assessment during or prior to the 2022/23 reporting period. 43.6% of bodies have carried out a limited assessment which does not provide an in-depth risk assessment addressing a range of climate hazards or risks. 20.7% of bodies have carried out a comprehensive risk assessment. 5.8% have completed an advanced risk assessment involving stakeholders and considering a range of climate or socioeconomic scenarios. |
Public Bodies Climate Change Reporting – Analysis Report 2022/23 (sustainablescotlandnetwork.org) |
|
Level of adaptation action taken across the public sector |
2022/23 |
71.8% of all listed public bodies submitting an annual compliance report have taken adaptation action during or prior to the 2022/23 reporting period. 44% of bodies have taken some action where a range of actions or policies exist but it is unclear how the actions are contributing to addressing specific climate risks or hazards. 21% of all bodies are taking good action, meaning the bodies are taking action to reduce specific risks and/or taking significant sector-specific adaptation actions. 6% of bodies are taking advanced action where a comprehensive set of actions are in place to address specific climate risks and plans are in place to measure progress against the management of these risks. |
Public Bodies Climate Change Reporting – Analysis Report 2022/23 (sustainablescotlandnetwork.org) |
|
Economies and industries are adapting and realising opportunities in Scotland’s Just Transition | |||
|
Proportion of businesses monitoring climate related risks (flooding, temperature increase, supply chain disruptions) |
2023 |
15.6% of Scotland businesses have assessed risks for supply chain disruption and distribution. 6.2% of Scotland businesses have assessed risks for increased flooding. 4.4% of Scotland businesses have assessed risks for temperature increase. 60.6% of Scotland businesses have not assessed any risks related to climate change. The scope of “businesses” taken into account by this survey are businesses which have not permanently stopped trading, with 10+ employees and with a presence in Scotland (n=1,061). |
Climate Change – BICS weighted Scotland estimates: data to wave 88 – gov.scot (www.gov.scot) |
|
Proportion of businesses taking action to adapt to the effects of climate change |
2023 |
26.5% of Scotland businesses declare they have already taken action to adapt to supply chain disruption and distribution. 11.5% of Scotland businesses declare they have already taken action to adapt to increased flooding. 5.7% of Scotland businesses declare they have already taken action to adapt to temperature increase. 21.2% of Scotland businesses have not assessed any risks related to climate change. 18.1% of businesses reported that they do not expect to be impacted by these climate change effects. The scope of “businesses” taken into account by this survey are businesses which have not permanently stopped trading, with 10+ employees and with a presence in Scotland (n=521). |
Climate Change – BICS weighted Scotland estimates: data to wave 88 – gov.scot (www.gov.scot) |
|
Number of green jobs |
2022 |
Using the industry approach, Scotland employment in green jobs in 2022 was estimated at 46,200 full-time equivalents (FTEs). |
Experimental estimates of green jobs, UK: 2015 to 2022 – Office for National Statistics (ons.gov.uk) |
|
Uptake of grants for agriculture storage reservoirs/ off season storage lagoons |
2024 |
5 AECS applications for irrigation lagoons were successful in 2024. 14 applications were submitted. |
Scottish government – unpublished data |
© The University of Edinburgh, 2024
Prepared by Ricardo on behalf of ClimateXChange, The University of Edinburgh. All rights reserved.
While every effort is made to ensure the information in this report is accurate, no legal responsibility is accepted for any errors, omissions or misleading statements. The views expressed represent those of the author(s), and do not necessarily represent those of the host institutions or funders.
ClimateXChange
Edinburgh Climate Change Institute
High School Yards
Edinburgh EH1 1LZ
+44 (0) 131 651 4783
If you require the report in an alternative format such as a Word document, please contact info@climatexchange.org.uk or 0131 651 4783.
https://www.gov.scot/isbn/9781836017264 ↑
Meeting notes from the four workshops are provided as supplementary materials to this report. ↑
Note: the objectives used here are taken from the draft SNAP3. The wording in the final SNAP3 differs slightly. ↑
Note: the objectives used here are taken from the draft SNAP3. The wording in the final SNAP differs slightly. ↑
Note: the objectives used here are taken from the draft SNAP3. The wording in the final SNAP differs slightly. ↑
Note: the objectives used here are taken from the draft SNAP3. The wording in the final SNAP differs slightly. ↑
See Office of National Statistics – https://www.ons.gov.uk/economy/environmentalaccounts/bulletins/experimentalestimatesofgreenjobsuk/2024#measuring-the-data ↑
The UK Climate Change Committee states that adjustments to dietary patterns are necessary to meet greenhouse gas reduction targets for Scotland. Food-based dietary guidelines have a policy role to play in supporting such adjustments.
This study reviewed international evidence including three case studies. The report presents findings on whether and how greenhouse gas emission criteria could be included in Scottish food-based dietary guidelines.
Main findings
Out of 33 jurisdictions reviewed, only seven have food-based dietary guidelines with extensive climate focus. However, this number is increasing over time. Emissions-focused guidelines advise:
- reducing meat, in particular ruminant meat
- moderating dairy
- increasing vegetables, fruits and plant proteins
- sourcing sustainably
- avoiding highly processed foods
- reducing food waste
Guidelines for Flanders, the Netherlands and Sweden offer good examples of how dietary linkages between human and planetary health can be explained with clear recommendations for food consumers.
Development of climate-focused guidelines suits a ‘science first’ approach, involving cross-disciplinary expert panels and reviews. Stakeholder inputs are restricted to the final steps of messaging and implementation.
Policy implementation for climate-friendly diets requires coordinated effort and strategic packages of measures, to tackle the food system holistically.
In Flanders, the Netherlands and Sweden, policy coordination has been lacking. Measures to date are largely limited to information campaigns and voluntary actions in public catering. More recently, Flanders and the Netherlands have launched more integrative food strategies. They are starting to combine policy measures across the food chain to encourage more sustainable diets.
Implications for Scotland:
- Adopting climate-focused food-based dietary guidelines would require time and effort, but would be a generally low-regret action, aligning with dietary goals and the net zero agenda.
- Some micronutrient deficiency risks are possible for certain population groups, depending on which foods are substituted. Other potential risks include displacement of greenhouse gas emissions from import/export activities.
- To address such issues, a coordinated cross-departmental policy approach would be needed, deploying a mix of supply-side and demand-side measures.
- In particular, households at risk of micronutrient deficiencies due to constrained access to healthy foods would need targeted support, including improvements to their food environments.
Research completed in August 2024
DOI: http://dx.doi.org/10.7488/era/4792
Executive Summary
Background
The UK Climate Change Committee states that adjustments to dietary patterns are necessary to meet greenhouse gas (GHG) reduction targets for Scotland. Food-based dietary guidelines (FBDGs) have a policy role to play in supporting such adjustments.
Drawing on international evidence including three case studies, this report presents findings on whether and how greenhouse gas emission criteria could be included in Scottish FBDGs.
Main findings
- Out of 33 jurisdictions reviewed, only seven have FBDGs with extensive climate focus. However, this number is increasing over time.
- Emissions-focused FBGDs advise reducing meat, in particular ruminant meat; moderating dairy; increasing vegetables, fruits and plant proteins; sourcing sustainably; avoiding highly processed foods and reducing food waste.
- FBDGs for Flanders, the Netherlands and Sweden offer good examples of how dietary linkages between human and planetary health can be explained with clear recommendations for food consumers.
- Development of climate-focused FBDGs suits a ‘science first’ approach, involving cross-disciplinary expert panels and reviews. Stakeholder inputs are restricted to the final steps of messaging and implementation.
- Policy implementation for climate-friendly diets requires coordinated effort and strategic packages of measures, to tackle the food system holistically.
- In Flanders, the Netherlands and Sweden, policy coordination has been lacking. Measures to date are largely limited to information campaigns and voluntary actions in public catering.
- More recently, Flanders and the Netherlands have launched more integrative food strategies. They are starting to combine policy measures across the food chain to encourage more sustainable diets.
Implications for Scotland:
- Adopting climate-focused FBDGs would require time and effort, but would be a generally low-regret action, aligning with dietary goals and the net zero agenda.
- Some micronutrient deficiency risks are possible for certain population groups, depending on which foods are substituted. Other potential risks include displacement of GHG emissions from import/export activities.
- To address such issues, a coordinated cross-departmental policy approach would be needed, deploying a mix of supply-side and demand-side measures.
- In particular, households at risk of micronutrient deficiencies due to constrained access to healthy foods would need targeted support, including improvements to their food environments.
Glossary / Abbreviations table
BMI | Body Mass Index: a weight to height ratio used to indicate whether an individual is underweight, normal weight, overweight or obese. |
CAP | Common Agricultural Policy: the overarching framework for supporting agricultural production across the EU. |
CCC | Climate Change Committee: the statutory advisory body to the UK government and Devolved Administrations in relation to climate mitigation and adaptation. |
Demand-side | Used to describe policy measures seeking to influence the demand for (in this case) different foods. For example, raising or lowering consumer prices through taxation or subsidies. |
Eatwell Guide | A policy tool used to define government recommendations on eating healthily and achieving a balanced diet within the UK. |
Eco-labelled | Voluntary certification of products to indicate their environmental impact. |
FBDG | Food Based Dietary Guidelines offer advice on foods, food groups and dietary patterns to provide the required nutrients to the general public to promote overall health and prevent chronic diseases. Some now also include environmental considerations. |
Food Environment | The physical, economic, political and socio-cultural contexts in which people engage with the food system to make their decisions about acquiring, preparing and consuming food. Can significantly affect consumers’ access to different foods. |
GHG | Greenhouse Gases: gases in the atmosphere that contribute to climate change. Notably carbon dioxide and methane. |
HFSS | Food and drink high in fat, sugar or salt. |
Micronutrient decencies | A lack of certain dietary elements required in low concentrations. For example, various vitamins and minerals. |
NNR | Nordic Nutritional Requirements: these constitute the scientific basis for national dietary guidelines and nutrient recommendations across the Nordic and Baltic countries. |
Nutrient dense | Nutrient-dense foods contain relatively high levels of vitamins, minerals, complex carbohydrates, lean protein, and healthy fats for a given weight of food. |
Protein Strategy | A stated EU-wide and domestic approach to encourage greater production and consumption of plant proteins. |
Science first | The approach adopted in some countries for developing FBDG, basing recommendations on scientific evidence first before only later considering stakeholder views on implementation. |
Scottish Dietary Goals | The Scottish Dietary Goals describe the diet that will improve the health of people in Scotland by reducing the number of people who are overweight and obese, and the number of people getting diet related diseases. |
Supply-side | Used to describe policy measures seeking to influence the supply of (in this case) different foods. For example, production subsidies or regulatory controls. |
UPF | Ultra Processed Foods. Food items at the extreme end of the NOVA food classification system, characterised by a very high degree of processing and often including artificial ingredients. |
Introduction
Background
The food system is a significant emitter of greenhouse gases (GHGs), accounting for up to 30% of emissions globally and at least 20% within Scotland.[1] As other sectors of the economy (e.g. energy) decarbonise, food’s share of total emissions will increase over time. Mitigation of this can be (and is being) attempted through changes to the production methods of the foods that currently comprise our diets (e.g. via improved plant and animal health and reductions in chemical inputs).
Yet meeting GHG emission targets will also require changes to diets themselves, towards those featuring greater proportions of climate-friendly foods. Dietary shifts for climate reasons must also, of course, promote human health, a dual imperative that is captured in concepts such as the Planetary Health Diet.[2]
Scottish Government commitments to a sustainable, healthy food system and associated emission reductions are expressed in the Programme for Government 2023/24 and underpinned by, for example, the Good Food Nation (Scotland) Act 2022, the Climate Change (Scotland) Act 2009 (and subsequent amendments) and Climate Change Plan Updates.[3] In the Scottish Dietary Goals, the aim to reduce red and red processed meat intake to no more than 70g/day, due to the links with colorectal cancer, is also broadly consistent with the UK Climate Change Committee’s recommendation of a 20% reduction in meat by 2030 to reduce emissions.[4]
The current UK Food Based Dietary Guidance (FBDG) is the Eatwell Guide[5]. Studies indicate that a diet following the Eatwell Guide generates lower emissions than the current UK diet[6]. However, diets based on many FBDGs globally, including the Eatwell Guide, exceed emissions targets for 1.5 degrees global warming[7]. Hence this report was commissioned to gather international evidence on more climate-focused FBDGs, and explore how they may potentially apply in Scotland.
The specific project objectives were to:
(i) explore dietary guidelines and recommendations in other jurisdictions;
(ii) explore the extent to which these have a climate focus;
(iii) identify what policies, strategies and actions have been taken to encourage progress to the guidelines;
(iv) discuss what could potentially apply in Scotland, drawing on Scottish data and evidence, and
(v) explore impacts on different groups in Scotland, e.g. gender, age, social class, vulnerable groups.
The findings are relevant to the UK Climate Change Committee’s statement that meeting Scottish emission reduction targets will require changes to dietary patterns. The findings are also relevant to future revisions of the Scottish Dietary Goals.
Project Methods
The project was undertaken in five steps, from October 2023 to March 2024. The steps are shown in Figure 1.1 and described below.
Step 1: Guided by the Steering Group, and with reference to published studies, we selected the FBDGs of 33 international jurisdictions for inclusion in the study. The set comprised mainly European and anglophone jurisdictions.
Step 2: Using FAO resources and online documentation, we accessed the FBDGs in all 33 jurisdictions, and reviewed each one for reference to climate. We allocated each FBDG to one of three categories, according to the extent of climate focus: from ‘red’ (little to no reference to climate) to ‘green’ (extensive climate focus).
Step 3: Following discussion with the Steering Group, we selected three example ‘green’ FBDGs to examine in more detail. These were Flanders, the Netherlands and Sweden. In each case, we identified the main advice and how it is linked to climate. We also studied the development process for the FBDGs. Lastly, we reviewed key policies, strategies and actions taken to implement the FBDGs. The main data sources were online materials and grey literature. These were supported by semi-structured interviews with officials involved in the development of the guidance in each jurisdiction (see Appendix A).
Step 4: We compared the insights from the 3 jurisdictions with the current situation in Scotland, drawing from official data sources and recent studies. We then reflected on what could potentially apply in Scotland, in terms of more climate-focused FBDGs and supporting policies. These reflections drew from published studies and official statistics, and were also informed by semi-structured interviews with a range of Scottish stakeholder groups. Guided by the Steering Group, these groups were: ASSIST FM; the British Dietetics Association; Food and Drink Federation Scotland; National Farmers Union Scotland; Nesta; Soil Association Scotland.
Step 5: We explored the impacts of more climate-focused FBDGs on different sub-groups in Scotland. The key data sources were official dietary statistics and recent studies of potential impacts of climate focused diets in Scotland.
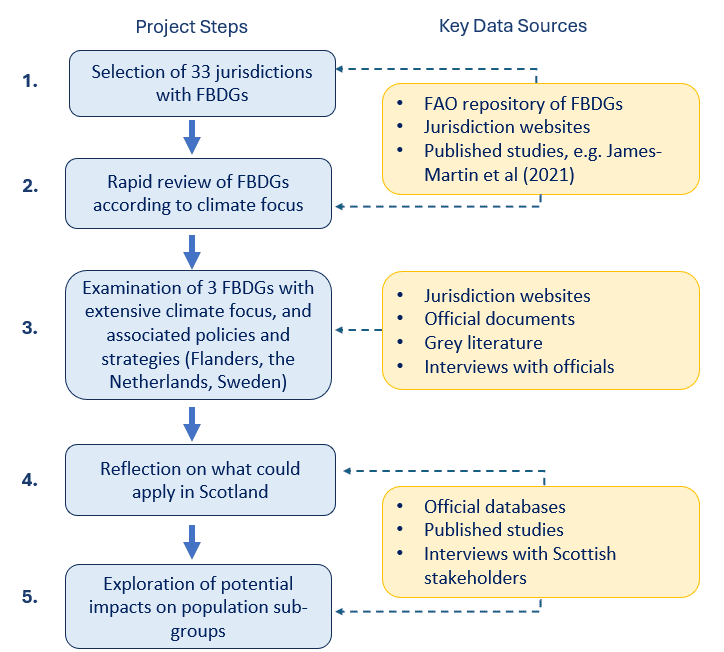
International review of FBDGs
Review of FBDGs in other jurisdictions, with reference to climate criteria
Appendix B provides a tabulated summary of information for all 33 FBDGs included in the review, on a country by country basis. Appendix C summarises the intakes for key food groups (all meat, red/processed meat, dairy, fruit and vegetables) as stated in the FBDGs for 22 of the 33 jurisdictions.
Of the 33 FBDGs studied, we found the majority (19) contained no or extremely limited reference to climate impact. Six contained moderate reference, while seven contained extensive reference (Table 2.1). It is worth noting that although the majority of countries have yet to explicitly include reference to climate in their FBDGs, or are still at the development phase, the number is increasing over time. For example, all the entries in the Extensive column have emerged in the past decade.
No reference, or very limited reference | Moderate reference | Extensive reference | |
Australia Austria Brazil Canada Croatia Cyprus Greece Hungary Iceland Ireland | Latvia Malta New Zealand Norway Portugal Romania Slovenia Switzerland UK USA | Belgium (national) Chile Estonia France Italy Poland | Denmark Finland Belgium (Flanders) Germany Netherlands Spain Sweden |
Jurisdictions in the red column: these have FBDGs which make no reference to climate impact, or only very limited reference, in either background or consumer-facing documents. ‘Limited reference’ denotes guidance which mentions sustainability, but only in an isolated way, and without any explanation or context. For example, the FBDGs of Austria and the UK (Eatwell Guide) both recommend choosing ‘sustainably sourced’ fish, by looking for MSC or similar labelling. However, this is the only reference to sustainability in the documents (i.e. no other food group has a similar recommendation), and there is no explanatory connection to the underlying sustainability issue with fishing.
Jurisdictions in the amber column: these FBDGs – in either consumer-facing or background documents – make more reference to climate than those in the red column. However, those references appear either in a circumscribed way, disconnected from the main guidance, or are individually brief or superficial within the body of the main guidance. An example of ‘circumscribed reference’ is the national guidance for Belgium. In the background document, there is a short stand-alone chapter dedicated to sustainability and climate, which explains the relevance to dietary issues. However, the contents are not connected to other chapters, and sustainability is not referred to in the consumer-facing guidance. An example of ‘superficial reference’ is the guidance for France. There are three individual references to climate and the environment in the consumer-facing guidance, however each one is very brief, without explanation of the underlying issues.
Jurisdictions in the green column: these FBDGs – in either the consumer-facing and/or background documents – make extensive reference to climate impact. The most advanced of these have climate impact as an integral component of the guidance, rather than an added feature, or set of ideas in development. Features that the ‘green’ FBDGs have in common include (i) introductory sections which make a clear connection between human health and planetary health, (ii) frequent references to climate impact throughout sections and applied to different food groups, (iii) effort (some more than others) to explain the reasons behind the climate-related guidance, and how consumers may navigate complexities and trade-offs between health and climate impacts.
Content of FBDGs with extensive climate focus
Overview of content
The jurisdictions found to have the most extensive reference to climate impact in their FBDGs were Denmark, Flanders, the Netherlands, Sweden and Finland. Germany and Spain are also included in this group, although their coverage is less extensive and integrated than the others[8].
These FBDGs make a clear link between human health and planetary health, by pointing out that what we eat affects not only our own well-being but also the environment. In terms of over-arching consumption advice, these FBDGs recommend:
- eating less meat and animal products;
- eating more plants, plant proteins and wholegrains;
- choosing nutrient dense foods over nutrient poor;
- drinking tap water;
- not overeating;
- avoiding waste.
The following sections describe what these climate-focused FBDGs advise, by food group. Advice from the Eatwell Guide is also referenced, for comparison.
Advice relating to meat
All seven FBDGs advise reducing meat consumption, due to the high GHG emissions from meat production, in particular ruminant meat. Table 2.2 shows the maximum recommended intake levels for meat in the seven FBDGs, and the Eatwell Guide. Germany specifies the lowest maximum weekly intake for all meat (240g), while Finland and the Netherlands specify the highest (500g). The Eatwell Guide does not specify a maximum level for all meat. The Netherlands specifies the lowest maximum intake for red/processed meat (300g) while Sweden specifies the highest (500g). The Eatwell Guide specifies the second highest maximum intake for red/processed meat at 490g.
All Meat (max g/wk) | Red/Processed (max g/wk) | |
Denmark | 350 | ns |
Finland | 500 | ns |
Flanders | ns | 330 |
Germany | 300 | 60 |
Netherlands | 500 | 300 |
Spain | 375 | ns |
Sweden | ns | 500 |
Eatwell Guide | ns | 490 |
ns: not specified. Germany: ‘all meat’ includes beef. Red/processed is processed only.
Examples of qualitative advice on meat in these FBDGs:
- When choosing meat, select more sustainably produced options, e.g. organic or agroecological, following a ‘’less but better” approach (The Netherlands, Sweden).
- Diets based on small amounts of meat can support the positive effects of grazing livestock on landscape and biodiversity (The Netherlands, Sweden)
- Meat-free days per week are specifically recommended by Denmark, Finland (1) Flanders (up to 4), Netherlands (up to 6), Spain (up to 7) and Sweden (up to 3).
The Eatwell Guide advises eating less red and processed meat. It gives no advice on production systems, nor on meat-free days.
Advice relating to dairy
The seven climate-focused FBDGs advise moderation in dairy product consumption, due to the GHG emissions associated with dairy farming. Table 2.3 shows the recommended daily intake levels for selected dairy products in these FBDGs. For milk/yoghurt, Denmark and Germany recommend c.250ml, while most others recommend a range extending to 500ml at the upper boundary. For hard cheese, the lowest recommended intake is 20g (Denmark) and the highest maximum is 60g (Spain). Four out of the six FBDGs do not specify a set intake level for cheese, although Germany offers guidance on how to allocate a total dairy amount between different product types. The Eatwell Guide does not specify intake levels for any dairy products.
Milk, yoghurt (ml/d) | Hard Cheese (g/d) | |
Denmark | 250 | 20 |
Finland | ns | ns |
Flanders | 250-500 | ns |
Germany | 250 | ns |
Netherlands | 300-450 | 40 |
Spain | 250-500 | 40-60 |
Sweden | 200-300 | ns |
Eatwell Guide | ns | ns |
Examples of qualitative advice for dairy consumption in these FBDGs:
- Take enough dairy to avoid chronic diseases and get enough nutrients, but not more than that, because dairy products come from cows, which have a high environmental impact (The Netherlands).
- Eating moderate amounts of dairy can support the positive effects of grazing livestock on landscape and biodiversity (Sweden).
- Where possible, choose eco-labels like organic for the more sustainably produced options (Sweden).
- Eat fewer processed dairy products, to get the nutritional benefits without the added climate burden from extra processing stages (Finland).
The Eatwell Guide advises eating ‘some’ milk and dairy food (or dairy alternatives). It gives no advice on production systems or levels of processing.
Advice relating to vegetables, fruit and plant proteins
All seven FBDGs give very clear recommendations to eat more vegetables, fruits and plant proteins for climate reasons. Table 2.4 shows the specified daily intake levels for these foods. For vegetables and fruit, recommended intakes range from 450g (Netherlands) to 690g (Spain). By comparison, the Eatwell Guide recommends the lowest minimum intake: at least 400g. In terms of legumes, only Denmark, Germany and Spain specify minimum intakes, from 100g (Denmark) to 200g (Spain) per week. For nuts, all jurisdictions except Sweden recommend intakes, from 15g to 30g per day. The Eatwell Guide does not recommend intake levels for legumes or nuts.
Examples of qualitative advice for vegetables, fruits and plant proteins in these FBDGs:
- Eat vegetables and fruit in season, for lower carbon footprint (Flanders, Sweden).
- Choose field grown rather than glasshouse grown (Flanders, Sweden), although glasshouses powered with renewable energy can have similar footprints (Finland).
- Locally grown is not necessarily lower carbon (Flanders).
- Choose ecolabelled and organic to reduce climate impact (Sweden).
- Legumes are nitrogen-fixing, which saves use of nitrogen fertilizer (Finland).
The Eatwell Guide does not advise on production methods or seasonality in this group.
Vegetables and Fruit (min g/d) | Legumes (min g/wk) | Nuts (g/d) | |
Denmark | 600 | 100 | 30 |
Finland | 500 | ns | 30 |
Flanders | 550 | ns | 15-25 |
Germany | 550 | 125 | 30 |
Netherlands | 450 | ns | 25 |
Spain | 690 | 200 | 20-30 |
Sweden | 500 | ns | ns |
Eatwell Guide | 400 | ns | ns |
Advice relating to cereals, grains, fats and oils
All climate-focused FBDGs highlight that, in general, grains and cereals have relatively low carbon footprints. Recommended intakes range from 75g (Denmark) to 90g (Sweden) wholegrain foods per day. Rice is identified as a grain with a higher carbon footprint (Denmark, Sweden, Finland), hence, advice is to swap rice for other grains or potatoes.
In terms of fats and oils, plant-based oils are recommended over butter and spreads due to their lower carbon impact (Denmark, Finland, Sweden). Within plant oils, rapeseed oil is presented as a particularly sustainable option, with a low carbon footprint (Sweden).
The Eatwell Guide does not advise about types of grains or fats from a climate perspective. This means that rice is recommended equally alongside pasta and potatoes. It recommends oils from plant sources, such as rapeseed and olive oil, as these are unsaturated fats. The outcome is that the same oils are recommended by Eatwell and the climate-focused FBDGs.
Advice relating to high fat, salt and sugar (HFSS) foods [9]
The seven FBDGs, advise to consume as few foods as possible from this category. This benefits the environment because (i) many foods in this category are ultra-processed (UPF), containing ingredients/processes which are carbon intensive, and (ii) they are nutrient poor. As all food production has an environmental impact, it is best to consume foods that are nutrient dense, to make the environmental impact ‘count’. All the FBDGs recommend tap water as the lowest carbon impact beverage, and that bottled drinks, including bottled water, should be avoided for the sake of the planet.
For HFSS foods, the Eatwell Guide’s recommendations are to avoid or eat in small amounts. The outcome is therefore the same as climate-focused FBDGs. For beverages, unlike the climate-focused FBDGs, the Eatwell Guide does not distinguish between bottled and tap water, and includes milk and diet/sugar-free drinks as recommended drinks.
Advice relating to sustainability
All climate-focused FBDGs contain the strong common messages of (i) only eat as much as you need and (ii) avoid food waste. The latter is advised as important for the planet because every food item wasted has an environmental impact that could have been avoided. The Eatwell Guide advises to eat only as much food as you need. It does not include any advice about food waste.
Summary of similarities and differences between climate-focused FBDGs and the Eatwell Guide
Advice within climate-focused FBDGs which is in common with the Eatwell Guide:
- Limit intake of red and processed meat (although 5 out of 6 FBDGs set maximum intakes lower than the Eatwell Guide)
- Eat plenty of vegetables and fruit (although all 6 FBDGs recommend minimum intake levels higher than the Eatwell Guide)
- Choose vegetable oils, e.g. rapeseed or olive oil, over animal fats
- HFSS foods are non-essential to diet so only eat in small amounts
- Only eat as much as you need
Advice within climate-focused FBDGs, which is different from the Eatwell Guide:
- Eat less meat and animal products, while increasing intake of plants and plant proteins (includes advocating meat-free days)
- Moderate dairy intake
- Choose seasonal, field grown vegetables and fruits
- Choose foods from more sustainable production methods, e.g. organic
- Choose potatoes, pasta or other grains over rice
- Favour unprocessed or lightly processed foods, and avoid UPFs
- The only recommended drinks are tap water, tea and coffee
- Avoid food waste
Sub-national variation
Of the seven FBDGs reviewed in this section, several come from jurisdictions with a degree of sub-national devolution, with regional powers able to adopt different approaches to certain policy areas. However, although guidance may be presented with regional badging, most often we found the substantive content of FBDGs is the same in different parts of a given country. The Flanders region of Belgium was the only clear example of sub-national variation in FBDGs found by this study. Yet policies to encourage uptake of nationally uniform FBDG do vary regionally in some jurisdictions. For example, across Dutch and Swedish municipalities and Australian States and Canadian Provinces.[10]
Case study: Flanders
This chapter provides an overview of the FBDGs in Flanders, how they were developed, and policy implementations to date. Appendix E provides more details.
FBDGs in Flanders: the Flanders Food Triangle
In Flanders, the FBDGs are captured in a 24-page consumer-facing document “Eating According to the Food Triangle: Good for Yourself and the Planet” (2021). It was developed by the Flemish Institute of Healthy Living (“Gezond Leven”), in cooperation with the Department of the Environment of the Flemish Government. The context of the guidance emphasises that the environmental impact of our food is currently greater than what our planet can bear, so dietary change is needed.
In terms of content, the Food Triangle (Figure 3.1) is offered as the basis for a healthy and environmentally responsible diet. It advises eating more vegetables, fruits, wholegrains and plant proteins, while eating less meat, butter and cheese. Discretionary foods (high in fat, salt and sugar) are separated from the triangle as non-essential to the diet, to be eaten ‘as little as possible’. This category includes processed meat. The guidance also recommends up to three or four days per week of meat-free meals. It provides links to support materials developed by Gezond Leven, including recipes for vegetarian meals and a seasonal buying guide for fruit and vegetables.

How the FBDGs were developed
A ‘science first’ approach was taken to develop the guidance. First, Gezond Leven and the Department of the Environment commissioned a review of scientific literature on the health and environmental impacts of dietary choices. Next, they convened a cross-disciplinary academic expert panel to help analyse the evidence and determine the core content of the final guidance. After this, public-facing messaging was designed and tested amongst citizens, with the support of experts in behaviour and communication. Only after the guidance was finalized were stakeholders consulted. Importantly, these consultations related only to the coordination and implementation of the guidance: they did not influence or change its substance.
Policies, strategies and actions related to the FBDGs
Various policy documents in Flanders have content aligned with the goals of the FBDGs, although they do not refer specifically to the guidance. For example, the ‘Strategic Plan: Flanders Lives Healthier in 2025’ and the ‘The Flemish Climate Policy Plan’ both refer to the need for changes to food consumption habits in the jurisdiction, for reasons of health and climate impact.
Recent strategies have also been launched with the aim to encourage more holistic, systems-based action on food than has been achieved historically. (In the past, policies for food have reflected departmental silos in government.) For example, the 2022 Flemish Food Strategy (“Go4Food”[11]) sets out 11 ‘Food Deal’ themes, around which cross-cutting actions are encouraged to coalesce. Funding is intended for these, albeit not specified in the document.
Another cross-cutting example is the ‘Flemish Protein Strategy 2021-2030’. This aims to increase the ratio of plant protein consumption vs animal protein consumption in Flanders to 60:40. Using CAP funding for domestic plant protein production as a catalyst, the strategy supports collaborations between food supply chain actors, research institutes and NGOs.
In practice, the Protein Strategy has led to increased domestic production of plant protein crops, research/innovation in processing, and promotion of plant proteins by food retailers. Overall, it represents an effort to fund coherent cross-sectoral work on sustainable food, by leveraging EU funding and private sector investment. CAP funding has similarly been used to encourage greater organic food production, albeit to a lesser degree than plant protein production.
Actions specifically to promote climate-friendly diets have been more limited in scope and scale. They have been largely focused on public communications campaigns and work with public catering (Table 3.1).
Policy type | What activities? |
Public information campaigns | Gezond Leven has produced various materials and resources for use by public and professionals, including videos, recipe cards, seasonal buying guides, etc. It has also entered into partnership with food retailers to promote increased consumption of plant proteins. |
Labelling | No introduction of new product labelling for climate impact. |
Regulation | No introduction of new demand-side regulations for climate impact of food. On supply side, targets have been set for levels of sustainable soya used in animal feeds. |
Taxes and Subsidies | The Belgian Government introduced a sugar tax in 2015. However no demand side taxes or subsidies on foods have been implemented for climate reasons. On the supply side, funding is available for plant protein production under the Protein Strategy. |
Public Procurement and Catering | Gezond Leven works with frontline staff in public catering, supporting them to change menus and practices for health and sustainability. All activity is voluntary, there are no mandatory changes. |
Evaluations of effects of FBDGs and/or policies
The Flanders Government conducts a National Food Survey on a 10-year cycle, with the next round due in 2024. This will be the first opportunity to gauge any changes in public dietary habits from the latest FBDGs. In the meantime, a recent small-scale survey on protein consumption showed trends in the desired direction (increases in plant consumption, decreases in meat consumption), but only to a very small extent. More formal evaluations of policy effectiveness are needed.
Case study: The Netherlands
This chapter provides an overview of the FBDGs in the Netherlands, how they were developed, and policy implementations to date. Appendix F provides more details.
FBDGs in the Netherlands: The Wheel of Five and Seven Steps to Sustainability
In the Netherlands, climate-focused dietary guidance is captured in the “Eating more sustainably: fact sheet” (2022), which accompanies the main “Wheel of Five” dietary model. The factsheet is a 10-page document targeted at professionals/policymakers. It sets out the case for environmentally sustainable diets, and explains how the Dutch diet should change to be in line with science-based planetary health recommendations.
The factsheet states that shifting from the current diet to the Wheel of Five is good for health and climate, but it also gives more specific advice about the most sustainable options to choose (Figure 4.1). The 7 ways are: (i) eat less meat (opt more often for pulses, nuts or eggs); (ii) waste as little as possible (buy and cook what you need); (iii) eat recommended amounts (moderate your snacks and sweets); (iv) drink mostly tap water; (v) eat enough dairy and cheese (but within bounds); (vi) buy seasonally (and check product origins); (vii) choose premium sustainability labels.

How FBDGs were developed
Two agencies led the development of the Dutch FBDGs. These were the National Institute for Public Health and the Environment (NIPHE), a research centre which collects and analyses scientific evidence and conducts data modelling, and the Netherlands Nutrition Centre (NNC), a body which translates the science into practical FBDGs for consumers and health professionals. Both are independent bodies, funded solely by the Ministries of Health and Agriculture.
In 2015, the NIPHE reviewed the scientific evidence on health and climate impacts of diets, with input from academic subject experts. NIPHE used this intelligence to model dietary guidelines as close as possible to the existing Dutch diet, while meeting parameters of health, climate impact, feasibility and impact on different target groups.
The NNC used the modelled solutions to draft the public facing dietary guidance, including the graphics. A transparent consultation process followed with experts, to check for any errors/omissions in the science, and also with health professionals, to advise on practical implementation.
The food industry was specifically not involved in the consultation. Only after the final guidance was completed were meetings held with industry representatives. This approach was taken to maintain both the real and perceived independence of the NIPHE and NNC. In total, the development process took several years.
Policies, strategies and actions related to the FBDGs
Policies relevant to food in the Netherlands appear to reflect the traditional priorities of host ministries, with relatively little integration of health and climate goals. For example, the 2018 ‘National Prevention Agreement: Towards a Healthier Netherlands’ makes no reference to climate or sustainability, while the 2019 ‘Climate Agreement’ contains only one brief reference to the need for change in food consumption habits. The 2015 ‘National Food Policy’ includes goals to increase consumption of fruits and vegetables, but these are justified for health not climate reasons.
However, the Dutch National Protein Strategy is more integrative. As in Flanders, CAP funding has been used to encourage plant protein production at farm level. This is being combined with further funding under economy-wide ‘green growth’ schemes, from both public and private sources, to encourage market growth along the supply chain.
Actions specifically to encourage take-up of the FBDGs are led by the NNC. They are centred on public communication tools and work with public caterers. In addition, one Dutch municipality (Haarlem city) is imposing a ban on outdoor advertising of meat. Table 4.1 provides more details.
What activities? | |
Public information campaigns | The NNC has launched two apps, to help consumers make healthier, more sustainable food choices. One of these, “Mijn Eetmeter”, allows users to record their eating habits and get tailored advice to improve their diet. This app has >2 million downloads and good ratings on GooglePlay and Apple Store. |
Labelling | No new labelling regime introduced, instead the NNC advises consumers on a set of the most reliable existing labels/certification schemes for making sustainable product choices. |
Regulation | At municipal level, the city of Haarlem will implement a ban on outdoor advertising of meat products in 2024. Climate impact is part of the motivation for the ban. There are no similar restrictions at national level. |
Taxes and Subsidies | There are no demand-side taxes or subsidies on foods for climate reasons (a sugar tax was introduced in 2023). In 2018 the Dutch Government stated an intention to remove VAT from fruit and vegetables. However, this was not implemented due to concerns about feasibility and effectiveness. On the supply side, funding is available for plant protein production and processing under the Protein Strategy. |
Public Procurement and Catering | The NNC works with public caterers to support and encourage them to develop more sustainable menus and practices. However, there are no mandatory measures imposed for climate impact. |
Evaluations of effects of the FBDGs and/or policies
The NNC undertakes consumer research and also administers the Dutch National Food Survey. Their data indicate that awareness of the Wheel of Five dietary model in the Dutch population is 71%, and trend analysis from the Dutch National Food Survey indicates small increases in fruit and vegetable consumption, and small decreases in meat consumption between 2007 and 2021. The changes are small, but in the right direction. However, policy effectiveness has not been evaluated formally.
Case Study: Sweden
This chapter provides an overview of the FBDGs in Sweden, how they were developed, and policy implementations to date. Appendix G provides more details.
FBDGs in Sweden: “Eat greener, not too much, and be active”
In Sweden, the FBDGs are captured in the 28-page consumer-facing document “Find your way to eat greener, not too much, and be active” (2015). It was developed by the Swedish National Food Agency (SNFA), in cooperation with the Swedish Public Health Agency, Board of Agriculture and Environmental Protection Agency. In terms of context, the guidance makes the argument for a holistic approach to eating, and for considering the environmental impact of food choices.
Advice is structured around 3 sections: 1. things to eat/do more of; 2. things to switch; and 3. things to eat less of (Figure 5.1). For each named food group (vegetables and fruits; seafood; wholegrains; healthy fats; low fat dairy products; red and processed meat; salt; sugar), there is a dedicated page which explains the advice in more detail, including the link to environmental impacts. These pages also offer specific ingredient and recipe suggestions to help make the change.

How FBDGs were developed
The Swedish National Food Agency is an independent, government-funded body, which administers public diet and health activities. It is one of 25 government agencies with special responsibility for achieving the government’s environmental objectives.
The FBDGs development process was science led, although stakeholder input happened earlier in the process than in Flanders and the Netherlands. From 2008-13, the Swedish Food Agency commissioned a series of reports on the environmental impacts of different foods, alongside evidence on the health effects of diet gathered from Nordic Nutrition Recommendations (NNR)[12]. The joint evidence was reviewed, with experts from the Swedish Public Health Agency, Board of Agriculture and Environmental Protection Agency. The review was supported by a stakeholder panel.
In 2014, a public consultation took place, including participants from industry, consumer and patient organisations, and public health professionals. Then the guidance was drafted and tested with consumers. The guidance was published in 2016/17. The whole process from initial discussions to publication took almost 10 years.
Since the development of this guidance, the latest revision of the Nordic Nutrition Recommendations (NNR), in 2023, has been published. It includes explicit reference to climate impact. It therefore provides a very high standard, scientifically informed evidence base on climate-friendly diets.
Policies, strategies and actions related to the FBDGs
In Sweden, the policy landscape for sustainable diets appears fragmented. For example, the 2016 “National Food Strategy for Sweden”, and subsequent 2019 “Action Plan”, focus almost exclusively on agricultural production. Meanwhile, the 2016 “Strategy for Sustainable Consumption” contains only a brief reference to food. The 2018 “Climate Framework Policy”, which sets out the Swedish Government’s net zero targets for the whole economy, also makes no reference to food consumption or dietary change.
In 2021, the Swedish Government tasked the Swedish Food Agency and Public Health Agency to propose areas of action needed for a more sustainable food system in Sweden, and indicators to measure progress[13]. The work was based on consultations with authorities, industry and civil society. The report, published 2024, emphasizes the need for joined-up policies to tackle health and climate problems. However, given recent shifts in politics in Sweden and hardening resistance from industry stakeholders to food system change, it may be challenging for officials to take forward many of the recommended Actions in the report.
Actions specifically to encourage take-up of the FBDGs are led by the Swedish Food Agency. To date, they have focused on public communications activities and work with public caterers, in particular schools. Table 5.1 provides more details.
Policy Type | What Activities? |
Public information campaigns | The Swedish Food Agency provides online information and manages a citizen panel to discuss healthy and sustainable eating. The Consumer Agency promotes food waste reduction within a circular economy. |
Labelling | No new product labelling introduced for climate-friendly food. Consumers are encouraged to refer to ‘Keyhole’ symbol (Swedish labelling scheme for healthy foods) and organic labels. |
Regulation | No regulatory changes applied. |
Taxes and Subsidies | No direct taxes or subsidies on the demand side to encourage shift to climate friendly diets. On supply side, there has been direct government investment in organic farming, to increase domestic land area under organic production. |
Public Procurement and Catering | Post-launch of FBDGs, the Swedish Food Agency undertook engagement work in school catering, this included encouragement of vegetarian days (voluntary). In 2020, “A New Recipe for School Meals” was launched, a collaboration between the National Food Agency and Vinnova, the Government research and innovation agency. The latter funded 4 municipalities to trial different projects, including measurement of waste and selling leftover meals[14]. |
Evaluations of effects of the FBDGs and/or policies
No formal evaluations have been conducted of the effect of the FBDGs on dietary habits. However, consumption trend data show that meat consumption peaked in 2016 and has subsequently declined whilst the proportion of Swedish meat within total meat consumed has increased. This suggests there has been some response to the “eat less but better” messaging, with ‘better’ meaning ‘Swedish’.
Implications for the potential development and implementation of climate-friendly FBDGs in Scotland
Having assessed climate-friendly FBGDs in other jurisdictions, and explored their development and policy implementation in Flanders, the Netherlands and Sweden, this chapter considers the possible implications for Scotland. Throughout this chapter, the FBDGs of Flanders, the Netherlands and Sweden are used as climate-focused comparators.
Dietary profile of Scotland compared with jurisdictions having climate-focused FBDGs
Studies show repeatedly that the diet of the average Scottish adult is unhealthy. It comprises higher than recommended intakes of calories, fat, sugar and salt, and lower intakes of fibre and fruit and vegetables[15]. These are associated with a range of chronic health problems, including diabetes, cardiovascular disease (CVD), hypertension and certain cancers.
In addition, average diets for some groups of Scottish consumers are deficient in micronutrients such as selenium and iodine. These deficiencies are also associated with a range of health problems, including fatigue, mental impairments and weakened immune systems. However, intake rates of red and processed meats are within the Scottish Dietary Goals maximum recommended for almost three quarters of the population[16].
Belgium (2014) | Netherlands (2021) | Sweden (2010/11) | Scotland (2021) | |
Fruit | 115 | 134 | 128 | 134 |
Vegetables | 155 | 174 | 176 | 131 |
Meat | 104 | 92 | 110 | 80 |
Dairy | 202 | 329 | 245 | 230 |
18 <= BMI <25 | 49% | 50% | 49% | 32% (42%)* |
25 <= BMI <30 | 35% | 35% | 35% | 36% (35%)* |
BMI >= 30 | 14% | 13% | 14% | 31% (20%)* |
Population | 6.8m | 18.0m | 10.6m | 5.4m |
* Scottish-specific BMI figures with UK figures in brackets from same Eurostat source as other countries. Comparisons are indicative given differences in survey methods, definitions and timings. See also Appendices B and C.
Table 6.1 above shows intakes for different food groups in Scotland, compared with Flanders, the Netherlands and Sweden. Notwithstanding caveats regarding precise comparability, the figures suggest that Scottish fruit consumption is relatively high compared to the other jurisdictions, while meat and vegetable intakes are relatively low. Dairy consumption appears similar to Sweden but lower than the Netherlands. Body Mass Index (BMI) scores, as indicators of broader diet-related health, are also similar for the proportion of the population overweight, but Scotland (and the UK) have markedly higher obesity rates.
Potential impacts on the Scottish population from take-up of climate-focused FBDGs
Potential Revisions to Eatwell Guide | Potential Risk to Population Health | |
Meat |
| Low, depending on substitution scenario |
Dairy |
| Deficiency risks for iron and iodine, depending on substitution scenario |
Vegetables, fruits and plant proteins |
| Low |
Cereals and grains |
| Low |
HFSS foods |
| Low |
Beverages |
| Low |
Other |
| Low |
Table 6.2. Examples of likely revisions needed to Eatwell Guide to align with more climate-focused FBDGs, and potential risks to Scottish population
The key features of climate-focused FBDGs were discussed in Chapter 2, summarizing similarities and differences between climate-focused guidance and the Eatwell Guide. Table 6.2 lists possible revisions for guidance in Scotland, to align with more climate-focused FBDGs. It also indicates the potential risks of negative impacts on the Scottish population, should the revised guidance be taken up. The potential risks for meat, dairy and sustainable sourcing advice are further discussed below. Potential risks for population sub-groups are discussed in section 6.3.
Potential impacts of revised meat intake advice
For greater climate focus, revisions to the Eatwell guidance would likely specify a lower maximum intake for red/processed meat, a new maximum intake for all meat, and strengthened messaging on reducing meat generally in the diet.
Comrie et al (2024) modelled the effects on micronutrient intake and of chronic disease risks from a 20% reduction in meat intake in Scotland, i.e. to levels consistent with the recommendations of UK Climate Change Committee (CCC).
They found that a 16% reduction could be achieved by encouraging the 28% highest red/processed meat eaters to limit their intake, of those meats alone, to the current Eatwell/SDGs maximum of 70g per day. To achieve the CCC’s 20% reduction target, the average intake of red/processed meat would need to reduce to 60g per day. This would impact the highest 32% of current red/processed meat consumers.
If meat intakes are substituted with alternative protein sources, e.g. fish, dairy or eggs, both scenarios above represent low risk options in terms of nutritional impacts. They would also bring health benefits associated with lowering red and red processed meat intakes. However, if meat intakes are substituted with refined grains or HFSS foods, then there are risks of diets becoming less rather than more healthy[18]. Therefore, revised dietary guidance needs to include advice about healthy and accessible substitutions for meat. Other policies need to make those substitutions affordable and accessible.
Non-GHG related environmental impacts are also possible from reduction in meat intakes, depending on which foods people switch to. Increases in demand for fish could exacerbate marine pollution/ecosystem problems. Also, switching from red ruminant meat (beef, lamb) to non-ruminant meat may lead to increases in intensive pig and poultry systems. Whilst these systems are more carbon efficient, they can increase air and water pollution problems[19]. To address these risks, a holistic perspective on environmental impact is needed during the scientific evidence gathering phase of the FBDG revisions. Other policies need to address environmental impacts of fish, pig and poultry systems.
Potential impacts of revised dairy intake advice
For greater climate focus, revisions to dietary guidance would likely set new advice to moderate dairy intake[20].
Comrie et al (2024) modelled the nutritional and chronic disease impacts of reducing dairy intake across the population by 20%, alongside meat reduction. They find that unless substituting with eggs, there are deficiency risks in the general population for iron and iodine. They highlight that as dairy is consumed in greater quantities across the population than meat, there is more reliance on it for micronutrients. Dairy is also a source of protection against Type 2 diabetes. Therefore, some nutritional and disease risks are possible, at the population level, from moderation of dairy intake.
In principle, nutritional and disease risks could be addressed with plant-based substitutes. However, these could require considerable changes to current dietary habits for many, and substitutes may have cost and accessibility issues. These have implications for the structure of the food environment. New advice on such changes would be needed, as the current guidance gives limited explanation. The new advice would need to address the composition of processed plant-based meat and dairy substitutes, in terms of fat, salt and sugar, and potentially , the use of fortification to supply key micronutrients. As is the case with existing meat and dairy products, at present, there is high variability between products and brands in the market, in terms of composition.
Potential impacts of advice on sustainable sourcing
For greater climate focus, revisions to the Eatwell guidance would likely introduce new advice on sustainable sourcing, for example choosing organic or agroecological products. These products are typically more expensive than conventional alternatives. In periods of generally squeezed incomes and high food price inflation, this advice may be unobtainable for many. Careful messaging would be needed within the guidance to address risks of frustration/alienation. At the same time, policy measures are needed to make sustainably sourced food more affordable and accessible[21].
Potential impacts on sub-groups of Scottish population from take-up of climate-focused FBDGs
With reference the likely changes to Eatwell guidance presented in Table 6.2, potential impacts are as follows:
Advice to reduce meat intake and moderate dairy intake
The modelling work conducted by Comrie et al (2024), on the impacts of reducing meat and dairy intakes across the population by 20%, also considered sub-groups. Depending on the substitution scenario, the authors found risks of some micronutrient deficiencies. These included selenium and zinc intakes for women and calcium intakes for young adults. Revised guidance on meat and dairy intakes would therefore need to include careful messaging and tailored advice for sub-groups, such as these, who may be at greater risk of micronutrient deficiencies. These problems may be exacerbated for women and young adults in lower income groups, who may find it more difficult to afford or access suitable meat alternatives, such as fish, eggs or plant proteins. Ability and capacity to cook meals using alternatives may also disproportionately affect these groups.
Advice to increase vegetable, fruit and plant protein intakes
Some population sub-groups may find it more difficult than others to access the range of vegetables, fruits and plant proteins recommended by revised guidance. As a result, they could face nutritional and disease risks, disproportionate to the wider population. These sub-groups could include lower-income consumers, who may struggle to afford more expensive items and/or cook the recommended foods. They could also include people in rural areas, or in urban food deserts/swamps, who face more limited ranges of foods and food retail options.
Advice to choose sustainably sourced foods
Citizens in lower income groups may be disproportionately unable to follow this advice. This could be particularly alienating. Careful messaging would be needed within the guidance. Programmes and initiatives are also needed to make sustainably sourced food more accessible and affordable.
Advice to favour potatoes, pasta and other grains over rice
This advice could disproportionately impact sub-groups whose diets rely more heavily on rice than the wider population. Tailored messaging would be needed, as well as advice on how to make the most climate-friendly choices for rice.
Advice to avoid UPFs and avoid food waste
Reducing consumption of processed and ultra-processed foods (UPFs) requires access to alternatives and a capacity for more labour and/or energy intensive food preparation. Hence consumers with restricted access due to income and/or food environment constraints and/or lacking the necessary time or facilities for food preparation (e.g. kitchen equipment) will be less likely to be able to avoid processed and UPFs. For similar reasons, consumers with limited or no access to appliances such as fridges and freezers may find it more difficult to follow advice to avoid food waste.
Policies, strategies and actions to implement climate-focused diets
Policy coordination for climate-focused diets
Policies to encourage take-up of climate-focused diets should make sustainable choices the easiest choices for consumers. This means tackling the food environment in a holistic way, using strategic packages of policy measures and instruments[22]. This requires collaboration and co-ownership between multiple government departments[23].
The case studies of Flanders, the Netherlands and Sweden reveal problems with coordination and coherent policy implementation on climate-friendly diets, to date. Siloed thinking has been evident, reinforced by resource allocations tied to narrow departmental remits rather than cross-cutting goals.
More recent food strategies aim to encourage more holistic, systems-based action on food and diets (e.g. the Flemish Food Strategy). However, implementation is at an early stage, and formal evaluations of their effectiveness have yet to be conducted.
Policy measures and actions for climate-focused diets.
Table 7.1 gives examples of specific policy measures for climate-focused diets that may feature in holistic packages. It also shows whether any of these measures have been applied in Flanders, the Netherlands or Sweden.
On both the demand and supply sides of the food system there are fiscal and regulatory measures. Also on the demand side are public information provision, labelling and public catering. The supply side also includes influencing voluntary industry action. In Flanders, the Netherlands and Sweden, public information campaigns and public catering dominate on the demand side, while fiscal measures and influencing industry dominate on the supply side. The pros and cons of these measures are discussed below, with implications for Scotland.
Policy Measure | Examples | At least one example applied in Flanders, Netherlands, Sweden? | |
Demand Side | Public information provision | Climate-friendly dietary guidance and information via websites, brochures, social media, digital technologies, face-to-face. | Yes (F, N, S). |
Labelling | Certifications for organic/agroecological production; carbon labels. | No new climate labels developed. | |
Fiscal Measures | ‘Cash first’ programmes for lower income groups; taxes on higher carbon foods; VAT reductions on lower carbon foods. | No food taxes or subsidies for climate reasons. | |
Regulation | Advertising restrictions on higher carbon foods; food waste restrictions. | One city-level ban on outdoor advertising of meat (N). | |
Public catering provision | Climate-friendly public food procurement standards; lower carbon menu design; carbon literacy training for catering staff. | Yes, voluntary actions for climate (F, N, S) | |
Supply Side | Influencing industry actions | Voluntary industry actions to reformulate products, give shelf space to plant proteins | Yes (F, N) |
Regulation | Climate-friendly domestic food production standards; climate-friendly standards for imported foods; mandatory carbon measurement and reporting. | Yes (F, N, S) | |
Fiscal measures | Subsidies for climate-friendly farming; funding for climate-friendly research and innovation. | Yes (F, N, S) |
Public information provision
This is a popular measure to encourage climate-friendly consumption. All three case study jurisdictions have applied it. Public information campaigns are relatively quick and inexpensive to implement, and the range of options now includes digital tools that offer interactivity (e.g. the Mijn Eetmeter diet tracking app in the Netherlands[24]).
However, there is little evidence that information alone can shift dietary habits. Population heterogeneity is significant, and people engage with or avoid information for multiple reasons[25]. Nevertheless, public information has a role to play in packages of policy measures. It may help to address low awareness of diet and sustainability issues in the population. Also, public information can signal the government’s priorities and direction of travel to citizens, industry and public bodies. This can be a way to show leadership to stakeholders[26].
Implications for Scotland:
Develop public information campaigns or messaging for climate-friendly diets as part of strategic policy packages, rather than stand-alone actions. Consider the multiple audiences for information on climate-friendly diets, and explore the potential for campaigns to signal clearly the policy agenda to a range of stakeholders.
Labelling
In theory, labelling schemes for climate-friendly foods can have an ‘industry pull’ effect. As producers change their practices in order to get certified, this brings widespread improvements[27]. However, evidence for the capacity of labels to change consumer behaviour is mixed at best[28]. Consumers already face multiple labelling schemes which compete for their attention. Also, environmental impact labels for food products are beset with technical challenges. For example, standardised, reliable metrics for carbon scores are lacking. In addition, labels which only show carbon values are ignoring other important environmental impacts.
For these reasons, climate-friendly labelling is uncommon[29]. None of the case study jurisdictions have sought to develop climate labels. Instead, they recommend existing certification schemes that are already familiar to consumers, as ways to identify more sustainable options. These include organic labels.
Implications for Scotland:
The development of any new carbon-specific labelling is unlikely to be worthwhile. Following the examples of the Netherlands and Sweden, it would be more feasible to focus on existing certification schemes (e.g. organic, meat quality assurance schemes), and explore ways to strengthen their climate relevance.
Fiscal measures and regulation (demand side)
Demand side regulation has been used actively in the food sector for public health reasons. Examples include restrictions on advertising unhealthy foods to children, and on the use of trans fats in food manufacturing. Fiscal measures (e.g. subsidies, taxes) have also been implemented for health reasons, for example, the Soft Drinks Industry Levy. Both types of measure are associated with stronger behaviour change outcomes than information or labelling. They are also associated with driving positive changes in industry practices, including reformulation of products[30].
However, these measures are less commonly applied explicitly in relation to climate-friendly diets, as they can have unintended consequences and evidence on effectiveness is mixed[31]. A risk of taxing high carbon foods like meat, for example, is that some consumers switch to foods of lower nutritional value, such as HFSS foods. As lower income households are already more likely to purchase such foods, such taxes risk exacerbating health inequalities. Furthermore, taxes on domestic high carbon foods may lead to carbon ‘leakage’ through import/export substitution effects, with no net reduction in global climate impact.
Implications for Scotland:
Taxes on foods for climate reasons may lead, unintentionally, to regressive outcomes. To address risks of exacerbating health inequalities, taxes should be partnered with policies to make healthier substitutes affordable and accessible to lower income groups. To address risks of GHG leakages, domestic carbon taxes should be partnered with appropriate trade policies.
Importantly however, not all tax/subsidy powers reside with the Scottish Government. Even those that do are subject to UK-wide agreement under the Internal Market Act 2020 and/or the Subsidy Control Act 2022.[32] Hence not all fiscal policy options are necessarily feasible within Scotland.
Public catering provision
Public catering is frequently presented as a policy area with the potential for direct behaviour change towards more climate-friendly diets[33]. There are two main ways this can happen. First, procurement standards and criteria can be revised to be more climate-focused. Criteria can relate to food and non-food purchases, facilities and equipment. Second, catering service practices can be revised to reduce climate impact. This can include, for example, recipe and menu design, and food waste reduction.
Flanders, the Netherlands and Sweden have all taken climate-related public catering actions, including introduction of meat-free days in school menus. To date, these actions have largely been voluntary for their sectors.
Implications for Scotland:
In the Scottish public sector, food procurement and catering provision are governed by separate standards. Often, they are also managed by different teams and processes, which presents challenges to coherent decision-making on climate impact.
To make public food procurement more climate friendly, a higher minimum weighting could be applied to climate criteria in contract awards. Suppliers could be asked to provide more carbon information, or be part of certification schemes. However, such demands may disproportionately impact small suppliers or first-time bidders. This would conflict with wider goals to encourage greater diversity in public procurement. Measures to reduce this risk may include supporting suppliers to meet more exacting climate requirements. Procurement officers could also be offered additional sustainability training.
Catering provision standards vary according to sector. In schools, statutory standards for food are based on nutritional not climate goals[34]. These standards could be revisited to explore ways to make them more climate-friendly. This would increase their consistency with local authority obligations to measure and reduce the carbon footprints of their services[35]. Extension of the Food For Life programme to all local authorities (currently voluntary) could also be a route to more climate focus.
In practice, school catering managers are increasingly taking voluntary climate actions, e.g. food waste reduction and meat-free days. Measures are needed to better support these actions, e.g. by strengthening public information on sustainable diets, and offering training and support for climate-friendly catering to service teams.
Influencing voluntary industry actions
Governments have well-established engagement with industry to encourage voluntary actions for public health reasons. Actions are now being encouraged to promote more climate-friendly food choices, for example, by reformulating products or changing microenvironments in-store to shape choice architecture[36]. Such approaches can be attractive to government since they avoid the time and effort needed to design and implement formal regulatory controls or taxes. However, industry actors may withdraw if market circumstances alter or industry leadership changes. Hence, voluntary agreements need to be monitored. They are often encouraged through the threat of imposing non-voluntary arrangements (e.g. regulation, fiscal measures) if engagement levels drop[37].
Both Flanders and the Netherlands are currently encouraging voluntary industry agreements related to sustainable diets. Under their Protein Strategies, they are encouraging domestic processors and retailers to increase activity in plant proteins. They have done this by presenting direct investments in domestic plant protein, derived from CAP Green Deal funding, as a market growth opportunity (see below). This is an example of more holistic policymaking, with coherence across supply and demand side measures.
Implications for Scotland:
Persuading industry partners to voluntarily adjust their practices requires either a perceived threat of future regulatory controls/fiscal distinctives from non-adjustment, or perceived benefits from doing so. Achieving either requires repeated engagement with industry stakeholders to establish mutual understanding of objectives, constraints and feasible options. Scottish industry stakeholders are already routinely involved in agricultural and food policy discussions, but voluntary actions by different stakeholders often progress at different rates. This can lead to poorly coordinated outcomes.[38]
Regulation and fiscal measures (supply side)
Various regulatory controls are applied to agricultural production across the EU, and some of these relate explicitly to mitigating GHG emissions. For example, farmers’ support funding requires adherence to Good Agricultural and Environmental Condition (GAEC) criteria. EU-level efforts also seek to regulate food imports on the basis of their GHG emissions. However, the link between all regulatory measures and domestic dietary guidance is often implicit at best.
Similarly, fiscal support for domestic agricultural production is also deployed under the EU-wide CAP. Much of this takes the form of decoupled payments not tied explicitly to the production of any particular (or indeed any) food product. However, some support is targeted explicitly at specific sectors, such as organic production and plant protein production. For the latter, further public funding from other sources has been deployed for R&D activities and to leverage private funding along the supply chain. This has been the case in Flanders and Netherlands’ Protein Strategies.
Implications for Scotland:
Agricultural production is already subject to various regulatory controls. Revision to agricultural funding support is likely to introduce new requirements related to GHG emissions. This will include obligations to monitor and report emissions[39]. Such improvements to the climate impact of Scottish agricultural production can be connected to advice within FBDGs, to choose more sustainably sourced foods.
Regulatory controls on imported food items fall outwith Scottish Government devolved powers.
Supply-side fiscal measures are already deployed within Scotland, most notably with respect to holders of agricultural land but also through investment and training grants for other parts of the supply-chain and funding for a range of research institutions. The majority of funding through such measures is not currently linked strongly to climate-related dietary change. However, as in some other countries, there may be scope to do so. This will require greater cross-departmental working and reprioritization of current budgets. Such issues feature in current parliamentary scrutiny of the Agricultural and Rural Communities Bill, including in relation to Good Food Nation ambitions.[40]
The scope for deploying new tax measures is more limited given constraints on devolved powers.
Conclusions
Listed by project objectives, the key findings are summarised here.
Dietary guidelines and recommendations in other jurisdictions
Out of 33 jurisdictions studied, only seven have FBDGs with extensive climate focus.
The main differences between health-focused and climate-focused guidance are that the latter recommends greater meat reduction, in particular ruminant meat, moderating dairy intake, choosing sustainably sourced foods, avoiding highly processed foods and avoiding food waste.
In three jurisdictions with climate-focused FBDGs (Flanders, the Netherlands, Sweden), the guidance was developed via a ‘science first’ approach, using expert panels and reviews. Stakeholder inputs were restricted to the final steps of messaging and implementation, to preserve the independence of the guidance.
Policies, strategies and actions taken to encourage progress to the guidelines
Policy implementation for climate-focused guidance requires coordination across government departments and budgets, and strategic packages of policy measures. These are needed to tackle food environments holistically, to make climate-friendly choices affordable and accessible.
Policy implementation of FBDGs in the three jurisdictions has lacked coordination, and measures have been largely limited to public information campaigns and encouragement of voluntary actions in public catering (e.g. menu adjustments).
Potential applications in Scotland and impacts on different groups
Adoption of climate-focused FBDGs would be a generally low-regret action, consistent with the direction of travel for policies relating to climate and health.
Some micronutrient deficiency risks are possible for certain population groups, depending on which foods are substituted. These include women, young adults, and lower income households. Other risks include import/export carbon leakage.
To address such issues, a coordinated cross-departmental policy approach would be needed, deploying a mix of supply-side and demand-side measures.
References and other supporting literature
Abrahamse, W., 2020. How to effectively encourage sustainable food choices: a mini-review of available evidence. Frontiers in psychology, 11, p.589674.
Aguirre-Sánchez, L., Teschner, R., Lalchandani, N.K., El Maohub, Y. and Suggs, L.S., 2023. Climate change mitigation potential in dietary guidelines: A global review. Sustainable Production and Consumption.
Ahrens, W., Brenner, H., Flechtner-Mors, M., Harrington, J.M., Hebestreit, A., Kamphuis, C.B., Kelly, L., Laxy, M., Luszczynska, A., Mazzocchi, M. and Murrin, C., 2022. Dietary behaviour and physical activity policies in Europe: learnings from the Policy Evaluation Network (PEN). European journal of public health, 32(Supplement_4), pp.iv114-iv125.
Ammann, J., Arbenz, A., Mack, G., Nemecek, T. and El Benni, N., 2023. A review on policy instruments for sustainable food consumption. Sustainable Production and Consumption.
Andretta, I., Hickmann, F.M., Remus, A., Franceschi, C.H., Mariani, A.B., Orso, C., Kipper, M., Létourneau-Montminy, M.P. and Pomar, C., 2021. Environmental impacts of pig and poultry production: insights from a systematic review. Frontiers in Veterinary Science, 8, p.750733.
Angelsen, A., Starke, A.D. and Trattner, C., 2023. Healthiness and environmental impact of dinner recipes vary widely across developed countries. Nature Food, pp.1-9.
Astbury, C.C., Aguirre, E., Cullerton, K., Monsivais, P. and Penney, T.L., 2021. How supportive is the global food supply of food-based dietary guidelines? A descriptive time series analysis of food supply alignment from 1961 to 2013. SSM-Population Health, 15, p.100866.
Bailey, R. and Harper, D.R., 2015. Reviewing interventions for healthy and sustainable diets. Chatham House, The Royal Institute of International Affairs.
Barton, K.L., Wrieden, W.L., Sherriff, A., Armstrong, J. and Anderson, A.S., 2015. Trends in socio-economic inequalities in the Scottish diet: 2001–2009. Public health nutrition, 18(16), pp.2970-2980.
Barton, K.L., Masson, L.F. and Wrieden, W.L., 2018. Estimation of food and nutrient intakes from food purchase data in Scotland, 2001-2015: report to Food Standards Scotland.
Barton, K.L., Ronald, C. and Savage, A., 2022. Estimation of food and nutrient intakes from food purchase data in Scotland between 2001 and 2018. Report to Food Standards Scotland
BDA 2020. Eating patterns for health and environmental sustainability: A Reference Guide for Dietitians. British Association of Dietitians.
Bechthold, A., Boeing, H., Tetens, I., Schwingshackl, L. and Nöthlings, U., 2018. Perspective: food-based dietary guidelines in Europe—scientific concepts, current status, and perspectives. Advances in nutrition, 9(5), pp.544-560.
Benton, T.G. and Bailey, R., 2019. The paradox of productivity: agricultural productivity promotes food system inefficiency. Global Sustainability, 2, p.e6.
Bergman, K., Lövestam, E., Nowicka, P. and Eli, K., 2020. ‘A holistic approach’: incorporating sustainability into biopedagogies of healthy eating in Sweden’s dietary guidelines. Sociology of Health & Illness, 42(8), pp.1785-1800.
Binns, C.W., Lee, M.K., Maycock, B., Torheim, L.E., Nanishi, K. and Duong, D.T.T., 2021. Climate change, food supply, and dietary guidelines. Annual review of public health, 42, pp.233-255.
Blomhoff, R., Anderson, R., Arnesen, A. et al. 2023. Nordic Nutrition recommendations 2023. Copenhagen: Nordic Council of Ministers.
Brennan, M., 2023. Food Systems Transformation in Scotland—The Journey to, Vision of, and Challenges Facing the New Good Food Nation (Scotland) Act. Sustainability, 15(19), p.14579.
Brink, E., van Rossum, C., Postma-Smeets, A., Stafleu, A., Wolvers, D., van Dooren, C., Toxopeus, I., Buurma-Rethans, E., Geurts, M. and Ocké, M., 2019. Development of healthy and sustainable food-based dietary guidelines for the Netherlands. Public health nutrition, 22(13), pp.2419-2435.
Burke, D.T., Hynds, P. and Priyadarshini, A., 2023. Quantifying farm-to-fork greenhouse gas emissions for five dietary patterns across Europe and North America: A pooled analysis from 2009 to 2020. Resources, Environment and Sustainability, p.100108.
Caleffi, S., Hawkes, C. and Walton, S., 2023. 45 actions to orient food systems towards environmental sustainability: co-benefits and trade-offs. London, UK: Centre for Food Policy
Cámara, M., Giner, R.M., González-Fandos, E., López-García, E., Mañes, J., Portillo, M.P., Rafecas, M., Domínguez, L. and Martínez, J.A., 2021. Food-based dietary guidelines around the world: A comparative analysis to update AESAN scientific committee dietary recommendations. Nutrients, 13(9), p.3131.
Cara, K.C., Goldman, D.M., Kollman, B.K., Amato, S.S., Tull, M.D. and Karlsen, M.C., 2023. Commonalities among dietary recommendations from 2010-2021 clinical practice guidelines: A meta-epidemiological study from the American College of Lifestyle Medicine. Advances in Nutrition.
Cobiac, L.J. and Scarborough, P., 2019. Modelling the health co-benefits of sustainable diets in the UK, France, Finland, Italy and Sweden. European journal of clinical nutrition, 73(4), pp.624-633.
Comerford, K.B., Miller, G.D., Boileau, A.C., Masiello Schuette, S.N., Giddens, J.C. and Brown, K.A., 2021. Global review of dairy recommendations in food-based dietary guidelines. Frontiers in nutrition, 8, p.671999.
Comrie, F., Jaacks, l., Kennedy, J., Mcdonald, A., McNeill, G., Runions, R., Stewart, C., Vonderschmidt, A. (2024). Approaches to modelling impact of reduction in meat and dairy intakes on micronutrient intakes and disease risk. CXC, University of Edinburgh, Food Standards Scotland.
Crippa et al., 2021. Food systems are responsible for a third of global anthropogenic GHG emissions. Nature Food, 2(3), pp.198-209.
Cullum, A., 2024. Developing food-based dietary recommendations in the UK. Proceedings of the Nutrition Society, 83(1), pp.55-61.
Darmon N, Drewnowski A. Contribution of food prices and diet cost to socioeconomic disparities in diet quality and health: a systematic review and analysis. Nutr Rev. 2015;73:643–660.
Dawkins, E., André, K., Leander, E., Axelsson, K. and Gerger Swartling, Å., 2023. Policy for sustainable consumptionan assessment of Swedish municipalities. Frontiers in Sustainability, 4, p.1265733.
Djojosoeparto, S.K., Kamphuis, C.B., Vandevijvere, S., Murrin, C., Stanley, I., Romaniuk, P., Harrington, J.M., Poelman, M.P. and PEN Consortium, 2022. Strength of EU-level food environment policies and priority recommendations to create healthy food environments. European Journal of Public Health, 32(3), pp.504-511.
Djojosoeparto, S.K., Kamphuis, C., Vandevijvere, S. and Poelman, M.P., 2022. How can national government policies improve food environments in the Netherlands? International Journal of Public Health, 67, p.1604115.
Drewnowski, A., 2020. Impact of nutrition interventions and dietary nutrient density on productivity in the workplace. Nutrition reviews, 78(3), pp.215-224.
EC. 2023. Health Promotion and Disease Prevention Knowledge Gateway. European Commission https://knowledge4policy.ec.europa.eu/health-promotion-knowledge-gateway/food-based-dietary-guidelines-europe-source-documents-food_en
EC. 2023. Food-Based Dietary Guidelines in Europe. European Commission. https://knowledge4policy.ec.europa.eu/health-promotion-knowledge-gateway/topic/food-based-dietary-guidelines-europe_en
Eluwa, T.F., Eluwa, G.I., Iorwa, A., Daini, B.O., Abdullahi, K., Balogun, M., Yaya, S., Ahinkorah, B.O. and Lawal, A., 2023. Impact of unconditional cash transfers on household livelihood outcomes in Nigeria. Journal of Social Policy, pp.1-16.
FAO 2023 Food-based dietary guidelines. https://www.fao.org/nutrition/education/food-based-dietary-guidelines/regions/countries/en/
Fischer, C.G. and Garnett, T., 2016. Plates, pyramids, and planets: developments in national healthy and sustainable dietary guidelines: a state of play assessment. Food and Agriculture Organization of the United Nations.
Food Standards Scotland 2020. The Scottish Diet – It needs to change, 2020 update. Food Standards Scotland.
Galli, A., Antonelli, M., Wambersie, L., Bach-Faig, A., Bartolini, F., Caro, D., Iha, K., Lin, D., Mancini, M.S., Sonnino, R. and Vanham, D., 2023. EU-27 ecological footprint was primarily driven by food consumption and exceeded regional biocapacity from 2004 to 2014. Nature Food, 4(9), pp.810-822.
Garnett, T., Mathewson, S., Angelides, P. and Borthwick, F., 2015. Policies and actions to shift eating patterns: what works. Foresight, 515(7528), pp.518-522.
Gladding, T.L., Rolph, C.A., Gwyther, C.L., Kinnersley, R., Walsh, K. and Tyrrel, S., 2020. Concentration and composition of bioaerosol emissions from intensive farms: pig and poultry livestock. Journal of environmental management, 272, p.111052.
Godin, L. and Sahakian, M., 2018. Cutting through conflicting prescriptions: How guidelines inform “healthy and sustainable” diets in Switzerland. Appetite, 130, pp.123-133.
Gržinić, G., Piotrowicz-Cieślak, A., Klimkowicz-Pawlas, A., Górny, R.L., Ławniczek-Wałczyk, A., Piechowicz, L., Olkowska, E., Potrykus, M., Tankiewicz, M., Krupka, M. and Siebielec, G., 2023. Intensive poultry farming: A review of the impact on the environment and human health. Science of the Total Environment, 858, p.160014
Hansen, K.L., Golubovic, S., Eriksen, C.U., Jørgensen, T. and Toft, U., 2022. Effectiveness of food environment policies in improving population diets: a review of systematic reviews. European Journal of Clinical Nutrition, 76(5), pp.637-646.
Harrington, J., Kenny, T. and O’Mahony, L. 2023. Building ‘sustainability’ into national healthy eating guidelines. Review of international practice and practical implications for policy. Safefood report.
Henchion, M., Moloney, A.P., Hyland, J., Zimmermann, J. and McCarthy, S., 2021. Trends for meat, milk and egg consumption for the next decades and the role played by livestock systems in the global production of proteins. Animal, 15, p.100287.
Hendrie, G.A., Lyle, G., Mauch, C.E., Haddad, J. and Golley, R.K., 2021. Understanding the variation within a dietary guideline index score to identify the priority food group targets for improving diet quality across population subgroups. International journal of environmental research and public health, 18(2), p.378.
Herforth, A., Arimond, M., Álvarez-Sánchez, C., Coates, J., Christianson, K. and Muehlhoff, E., 2019. A global review of food-based dietary guidelines. Advances in Nutrition, 10(4), pp.590-605.
Hoek, A.C., Malekpour, S., Raven, R., Court, E. and Byrne, E., 2021. Towards environmentally sustainable food systems: decision-making factors in sustainable food production and consumption. Sustainable Production and Consumption, 26, pp.610-626.
Jaacks, L., Frank, S., Vonderschmidt, A., Stewart, C., Runions, R., Kennedy, J., McNeill, G., Alexander, P. (2024). Understanding the climate impact of food consumed in Scotland. CXC report.
James-Martin, G., Baird, D.L., Hendrie, G.A., Bogard, J., Anastasiou, K., Brooker, P.G., Wiggins, B., Williams, G., Herrero, M., Lawrence, M. and Lee, A.J., 2022. Environmental sustainability in national food-based dietary guidelines: a global review. The Lancet Planetary Health, 6(12), pp.e977-e986.
Jennings, R., Henderson, A.D., Phelps, A., Janda, K.M. and van den Berg, A.E., 2023. Five US Dietary Patterns and Their Relationship to Land Use, Water Use, and Greenhouse Gas Emissions: Implications for Future Food Security. Nutrients, 15(1), p.215.
Kirwan, L.B., Walton, J., Flynn, A., Nugent, A.P., Kearney, J., Holden, N.M. and McNulty, B.A., 2023. Assessment of the Environmental Impact of Food Consumption in Ireland—Informing a Transition to Sustainable Diets. Nutrients, 15(4), p.981.
Kovacs, B., Miller, L., Heller, M.C. and Rose, D., 2021. The carbon footprint of dietary guidelines around the world: a seven country modeling study. Nutrition journal, 20, pp.1-10.
Kwasny, T., Dobernig, K. and Riefler, P., 2022. Towards reduced meat consumption: A systematic literature review of intervention effectiveness, 2001–2019. Appetite, 168, p.105739.
Laine, J.E., Huybrechts, I., Gunter, M.J., Ferrari, P., Weiderpass, E., Tsilidis, K., Aune, D., Schulze, M.B., Bergmann, M., Temme, E.H. and Boer, J.M., 2021. Co-benefits from sustainable dietary shifts for population and environmental health: an assessment from a large European cohort study. The Lancet Planetary Health, 5(11), pp.e786-e796.
Lassen, A.D., Christensen, L.M. and Trolle, E., 2020. Development of a Danish adapted healthy plant-based diet based on the EAT-Lancet reference diet. Nutrients, 12(3), p.738.
Leme, A.C.B., Hou, S., Fisberg, R.M., Fisberg, M. and Haines, J., 2021. Adherence to food-based dietary guidelines: a systemic review of high-income and low-and middle-income countries. Nutrients, 13(3), p.1038.
Lindström, H., Lundberg, S. and Marklund, P.O., 2020. How Green Public Procurement can drive conversion of farmland: An empirical analysis of an organic food policy. Ecological Economics, 172, p.106622.
Lobos, M.F., L’Abbé, M., Ng, S.H., Phulkerd, S., Ramirez‐Zea, M. and Rebello, S.A., 2019. An 11‐country study to benchmark the implementation of recommended nutrition policies by national governments using the Healthy Food Environment Policy Index, 2015‐2018. Obesity Reviews, 20, pp.57-66.
Macura, B., Ran, Y., Persson, U.M., Abu Hatab, A., Jonell, M., Lindahl, T. and Röös, E., 2022. What evidence exists on the effects of public policy interventions for achieving environmentally sustainable food consumption? A systematic map protocol. Environmental Evidence, 11(1), pp.1-9.
Martini, D., Tucci, M., Bradfield, J., Di Giorgio, A., Marino, M., Del Bo’, C., Porrini, M. and Riso, P., 2021. Principles of sustainable healthy diets in worldwide dietary guidelines: efforts so far and future perspectives. Nutrients, 13(6), p.1827.
Matthews, A., Candel, J., Mûelenaere, N.D. and Scheelbeek, P., 2023. The political economy of food system transformation in the European Union. In Resnick, D. and Swinnen, J., 2023. Political Economy of Food System Transformation. The Political Economy of Food System Transformation, Routledge.
Mazac, R., Renwick, K., Seed, B. and Black, J.L., 2021. An approach for integrating and analyzing sustainability in food-based dietary guidelines. Frontiers in sustainable food systems, 5, p.544072.
Milner, J., Green, R., Dangour, A.D., Haines, A., Chalabi, Z., Spadaro, J., Markandya, A. and Wilkinson, P., 2015. Health effects of adopting low greenhouse gas emission diets in the UK. BMJ open, 5(4), p.e007364.
OECD. 2021. Making Better Policies for Food Systems. OECD.
Pineda, E., Poelman, M.P., Aaspõllu, A., Bica, M., Bouzas, C., Carrano, E., De Miguel-Etayo, P., Djojosoeparto, S., Blenkuš, M.G., Graca, P. and Geffert, K., 2022. Policy implementation and priorities to create healthy food environments using the Healthy Food Environment Policy Index (Food-EPI): A pooled level analysis across eleven European countries. The Lancet Regional Health–Europe, 23.
Purnell, J.Q., Gernes, R., Stein, R., Sherraden, M.S. and Knoblock-Hahn, A., 2014. A systematic review of financial incentives for dietary behavior change. Journal of the Academy of Nutrition and Dietetics, 114(7), pp.1023-1035.
Reay, D. et al. 2020. From farm to fork: growing a Scottish food system that doesn’t cost the planet. Frontiers in Sustainable Food Systems, 4, p.72.
Reisch, L.A., Sunstein, C.R., Andor, M.A., Doebbe, F.C., Meier, J. and Haddaway, N.R., 2021. Mitigating climate change via food consumption and food waste: A systematic map of behavioral interventions. Journal of Cleaner Production, 279, p.123717.
Reisch, L.A., 2021. Shaping healthy and sustainable food systems with behavioural food policy. European Review of Agricultural Economics, 48(4), pp.665-693.
Romaniuk, P., Kaczmarek, K., Brukało, K., Grochowska-Niedworok, E., Łobczowska, K., Banik, A., Luszczynska, A., Poelman, M., Harrington, J.M., Vandevijvere, S. and Pen Consortium, 2022. The healthy food environment policy index in Poland: implementation gaps and actions for improvement. Foods, 11(11), p.1648.
Röös, E., Bajželj, B., Smith, P., Patel, M., Little, D. and Garnett, T., 2017. Greedy or needy? Land use and climate impacts of food in 2050 under different livestock futures. Global Environmental Change, 47, pp.1-12.
Röös, E., Larsson, J., Sahlin, K., Jonell, M., Lindahl, T., André, E., Säll, NS., Harring, N. and Persson, M. 2021. Policy Options for Sustainable Food Consumption – Review and Recommendations for Sweden. Mistra Sustainable Consumption report 1:10.
Rossi, L., Ferrari, M. and Ghiselli, A., 2023. The Alignment of Recommendations of Dietary Guidelines with Sustainability Aspects: Lessons Learned from Italy’s Example and Proposals for Future Development. Nutrients, 15(3), p.542.
Scheelbeek, P., Green, R., Papier, K., Knuppel, A., Alae-Carew, C., Balkwill, A., Key, T.J., Beral, V. and Dangour, A.D., 2020. Health impacts and environmental footprints of diets that meet the Eatwell Guide recommendations: analyses of multiple UK studies. BMJ open, 10(8), p.e037554
Schwingshackl, L., Watzl, B. and Meerpohl, J.J., 2020. The healthiness and sustainability of food based dietary guidelines. bmj, 370.
Scott, C., Sutherland, J. and Taylor, A., 2018. Affordability of the UK’s Eatwell Guide. The Food Foundation, p.17.
Sinclair, M., Combet, E., Davis, T. and Papies, E.K., 2023. Sustainability in food-based dietary guidelines: a review of recommendations around meat and dairy consumption and their visual representation. University of Glasgow preprint.
Some, S., Roy, J., Chatterjee, J.S. and Butt, M.H., 2022. Low demand mitigation options for achieving Sustainable Development Goals: Role of reduced food waste and sustainable dietary choice. Journal of Cleaner Production, 369, p.133432.
Speck, M., Wagner, L., Buchborn, F., Steinmeier, F., Friedrich, S. and Langen, N., 2022. How public catering accelerates sustainability: a German case study. Sustainability Science, 17(6), pp.2287-2299.
Springmann, M., Spajic, L., Clark, M.A., Poore, J., Herforth, A., Webb, P., Rayner, M. and Scarborough, P., 2020. The healthiness and sustainability of national and global food based dietary guidelines: modelling study. bmj, 370.
Stewart, C., McNeill, G., Runions, R., Comrie, F., McDonald, A. and Jaacks, P.L.M., 2023. Meat and milk product consumption in Scottish adults: Insights from a national survey. Available at SSRN 4628199.
Stoll-Kleemann, S. and Schmidt, U.J., 2017. Reducing meat consumption in developed and transition countries to counter climate change and biodiversity loss: a review of influence factors. Regional Environmental Change, 17, pp.1261-1277.
Strid, A., Hallström, E., Hjorth, T., Johansson, I., Lindahl, B., Sonesson, U., Winkvist, A. and Huseinovic, E., 2019. Climate impact from diet in relation to background and sociodemographic characteristics in the Västerbotten Intervention Programme. Public health nutrition, 22(17), pp.3288-3297
Tetens, I., Birt, C.A., Brink, E., Bodenbach, S., Bugel, S., De Henauw, S., Grønlund, T., Julia, C., Konde, Å.B., Kromhout, D. and Lehmann, U., 2020. Food-based dietary guidelines–development of a conceptual framework for future Food-Based Dietary Guidelines in Europe: report of a Federation of European Nutrition Societies Task-Force Workshop in Copenhagen, 12–13 March 2018. British Journal of Nutrition, 124(12), pp.1338-1344.
The Carnon Trust. 2016. The eatwell guide: A more sustainable diet.
Tucci, M., Martini, D., Marino, M., Del Bo’, C., Vinelli, V., Biscotti, P., Parisi, C., De Amicis, R., Battezzati, A., Bertoli, S. and Porrini, M., 2022. The Environmental Impact of an Italian-Mediterranean Dietary Pattern Based on the EAT-Lancet Reference Diet (EAT-IT). Foods, 11(21), p.3352.
van Dooren, C., Marinussen, M., Blonk, H., Aiking, H. and Vellinga, P., 2014. Exploring dietary guidelines based on ecological and nutritional values: a comparison of six dietary patterns. Food Policy, 44, pp.36-46.
von Philipsborn, P., Geffert, K., Klinger, C., Hebestreit, A., Stratil, J., Rehfuess, E.A. and PEN Consortium, 2022. Nutrition policies in Germany: a systematic assessment with the Food Environment Policy Index. Public Health Nutrition, 25(6), pp.1691-1700.
Vermeir, I., Weijters, B., De Houwer, J., Geuens, M., Slabbinck, H., Spruyt, A., Van Kerckhove, A., Van Lippevelde, W., De Steur, H. and Verbeke, W., 2020. Environmentally sustainable food consumption: A review and research agenda from a goal-directed perspective. Frontiers in psychology, 11, p.520238.
Whybrow, S., Hollis, J.L. and Macdiarmid, J.I., 2018. Social deprivation is associated with poorer adherence to healthy eating dietary goals: analysis of household food purchases. Journal of Public Health, 40(1), pp.e8-e15.
Wijesinha-Bettoni, R., Khosravi, A., Ramos, A.I., Sherman, J., Hernandez-Garbanzo, Y., Molina, V., Vargas, M. and Hachem, F., 2021. A snapshot of food-based dietary guidelines implementation in selected countries. Global Food Security, 29, p.100533.
Wood, A., Moberg, E., Curi-Quinto, K., Van Rysselberge, P. and Röös, E., 2023. From “good for people” to “good for people and planet”–Placing health and environment on equal footing when developing food-based dietary guidelines. Food Policy, 117, p.102444.
Wrieden, W., Halligan, J., Goffe, L., Barton, K. and Leinonen, I., 2019. Sustainable diets in the UK—developing a systematic framework to assess the environmental impact, cost and nutritional quality of household food purchases. Sustainability, 11(18), p.4974.
Yin, J., Hua, J., Zhang, X., Tuyishimire, A. and Yang, D., 2023. Healthy Eating for All? The Challenge of Adhering to Dietary Guidelines for Low-Income Groups in China. Nutrients, 15(12), p.2704.
Yoong, S.L., Turon, H., Wong, C.K., Bayles, L., Finch, M., Barnes, C., Doherty, E. and Wolfenden, L., 2023. An audit of the dissemination strategies and plan included in international food-based dietary guidelines. Public health nutrition, 26(11), pp.2586-2594.
Appendices
Appendix A: Interviewees and discussion guide
Flanders:
Senior professional from Flanders Institute of Healthy Living (Gezonden Leven)
Senior professional from Flanders Department of the Environment and Spatial Planning
Netherlands:
Senior professional from the Netherlands Nutrition Centre (Voedingscentrum)
Sweden:
Senior academic from the Swedish University of Agricultural Sciences
Scotland:
Representative from NESTA
Representative from NFUS
Representative from the British Dietetic Association
Senior academic, University of Edinburgh
Representative from the Soil Association
Two representatives from ASSIST FM
Representative from the Food and Drink Federation Scotland
Other:
Team of academics from the London School of Hygiene and Tropical Medicine (undertaking similar research on behalf of Defra)
Discussion Guide
Aims of Interview
The Scottish Government currently provides dietary guidance via the EatWell Guide, which promotes better health and nutritional outcomes. Scottish Government is exploring how to align the guidance with its climate objectives, to encourage diets that are both healthy and climate-friendly. The purpose of these discussions is to gather views on what climate-friendly dietary guidelines could look like in Scotland, what actions would be most effective to encourage their uptake, and what barriers, problems or unintended consequences Scottish Government should be aware of, from your perspective as a representative of [name of stakeholder group].
1.Explain privacy notice and confirm consent to undertake the interview [2 mins]
2. Opener [5 mins]
- From the perspective of your organisation/profession, what does a climate-friendly diet mean to you?
- What key features, or guidelines, would you expect in a climate-friendly diet?
- If interviewees are familiar with the EatWell Guide, could also ask how climate-friendly they think it currently is, and what they would change/revise, to make it more climate-friendly.
3. Discussion of climate friendly dietary guidance, using prompt material [10 or 15 mins, depending on interviewee’s expertise]
In advance, we will share the attached montage of dietary guidelines assembled from climate-focused FBDGs, i.e. Flanders, Netherlands, Sweden:
On the slide are examples of climate-friendly dietary guidance, from other countries. Please tell me:
- What is your impression of these dietary guidelines?
- To what extent could they apply in Scotland?
- In particular, what is your view about the advice to:
- Reduce meat consumption, especially red meat (including specifying maximum intake per week)?
- Moderate dairy consumption?
- From your perspective, what difference does the addition of climate-focused guidance make to nutritional outcomes? Does it create any tensions? Will consumers be more or less receptive?
- What problems or unintended consequences might come from guidance such as this in Scotland?
- Which groups may particularly benefit, and which groups may be negatively impacted?
- (If time – If ScotGov decided to develop climate-friendly dietary guidelines, what would your advice be about which stakeholders should be involved in the development process?
- Who should lead the process?
4. Discussion of how to encourage take-up of dietary guidance, using prompt material [10 or 15 mins, depending on interviewee’s expertise]
In advance, we will share the attached montage of policy instruments from other jurisdictions, designed to encourage climate-friendly diets.
On the slide are examples of policy actions in other countries to encourage take-up of climate-friendly diets. Please tell me:
- What is your impression of these policy actions?
- To what extent could they apply in Scotland?
- In particular, what is your view of:
- Carbon labelling of food
- Subsidising fruit and vegetables to targeted groups
- Changing public catering standards to encourage more meat-free menus
- Acting on the food environment
5. Wrap up
- Do you have any questions you would like to ask?
- Confirm how information will be used
- Thank participant and end interview
Appendix B: FBDG information for selected countries
Dietary Guideline information for selected countries, citing official documentation and showing degree to which guidance is linked to environmental impact. Recommendations included where linked explicitly to environment/climate[41]
All weblinks accessed during December 2023.
Austria
Document type | Publishing organisation | Document name (publication date) and weblink source | Document length (pages) | Comments |
Consumer | Austrian Agency for Health and Food Safety | Austrian Food Pyramid (2010)* https://www.fao.org/3/as659o/as659o.pdf also The Austrian Food Pyramid – AGES | 12 (pdf) | Only ref to environment is sustainable fish. Recommends low meat consumption, and seasonal, regional and organic food, but not for environmental reasons. No dietary recommendations are linked explicitly to environment or climate. |
Background | None found[42] | None found | N/A | N/A |
Degree to which document links guidance to environmental impact: Extensive and frequent Partial Occasional or none
Which document? | What Advice? | Why Do This? | How Do This? | Quantification? |
Consumer. | Consume sustainably sourced fish. | “In the spirit of sustainability” | “In the spirit of sustainability, when buying fish, look for certifications from MSC, ASC or organic” | “At least 300g fish per week” |
* New Austrian Food Pyramids (plural) are due to be published in the autumn of 2024, https://www.sozialministerium.at/Themen/Gesundheit/Ern%C3%A4hrung/%C3%96sterreichische-Ern%C3%A4hrungsempfehlungen-NEU.html
Australia
Document type | Publishing organisation | Document name (publication date) and weblink source | Document length (pages) | Comments |
Consumer | National Health and Medical Research Council | Eat for Health. Australian Dietary Guidelines Summary (2013) | 2 (pdf) | No mention of climate or environment. No dietary recommendations are linked explicitly to environment or climate. |
Background | National Health and Medical Research Council | Eat for Health. Australian Dietary Guidelines (2013) https://www.eatforhealth.gov.au/sites/default/files/2022-09/n55_australian_dietary_guidelines.pdf | 226 (pdf) | Briefly mentions climate and emissions, although cited examples do not relate to primary production. No dietary recommendations are linked explicitly to environment or climate. |
Degree to which document links guidance to environmental impact: Extensive and frequent Partial Occasional or none
Which Document? | What Advice? | Why Do This? | How Do This? | Quantification? |
N/A | N/A | N/A | N/A | N/A |
NB. National level guidelines apply everywhere but supporting policy measures vary across sub-national jurisdictions across Australia.
Belgium (country-wide)
Document type | Publishing organisation | Document name (publication date) and weblink source | Document length (pages) | Comments |
Consumer | Superior Health Council FPS Public Health, Walloon Agency for Quality Life (AVIQ) for the French version, Gezond Leven and Vlaanderen is zorg for the Flemish version. | FBDG: Eat and gain life-years? Doable! (2019) https://www.youtube.com/watch?v=_GcH7x7unQY The Food Tree (2019) https://www.karott.be/karott-epi-alimentaire/ and https://www.foodinaction.com/nl/voedingstak-pijlers-beter-eten/ (in Dutch and French, machine translated to English via Google Translate and DeepL) | 2.14 minutes (video) 6 (pdf) | Dietary recommendations are not linked explicitly to environment and climate. |
Background | Superior Health Council | Dietary Guidelines for the Belgian Adult Population (2019) https://www.health.belgium.be/sites/default/files/uploads/fields/fpshealth_theme_file/20191011_shc-9284_fbdg_vweb.pdf | 91 (pdf) | Sustainability issues are noted and endorsed as relevant, but not in an integrated way. Dietary recommendations are not linked explicitly to environment and climate. |
Degree to which document links guidance to environmental impact: Extensive and frequent Partial Occasional or none
Which document? | What Advice? | Why Do This? | How Do This? | Quantification? |
N/A | N/A | N/A | N/A | N/A |
NB. Guidance expected to be updated after 2023 see https://www.health.belgium.be/en/advisory-report-9284-fbdg-2019
Belgium (Flanders)
Document type | Publishing organisation | Document name (publication date) and weblink source | Document length (pages) | Comments |
Consumer | Departement Omgeving (Department of Environment) | Eating According to the Food Triangle: Good for Yourself and the Planet (2021) | 24 (pdf) | Dietary recommendations are linked explicitly to environment and climate. |
Background | Vlaams Instituut Gezond Leven (Flemish Institute for Healthy Living) | Rationale for a substantive food and health vision (2017); Food & Environmentally Responsible Consumption (2021) Achtergronddocument-Voeding-en-gezondheid.pdf (gezondleven.be) (in Dutch, machine translated to English via Google Translate and DeepL) Background-food-and-environment-EN.pdf (gezondleven.be) and www.gezondleven.be/voedingsdriehoek . | 30 (pdf) 133 (pdf) | Dietary recommendations are linked explicitly to environment and climate. |
Degree to which document links guidance to environmental impact: Extensive and frequent Partial Occasional or none
Which document? | What Advice? | Why Do This? | How Do This? | Quantification? |
Consumer. NB. Guidelines for Flanders are distinct from those issued by Wallonia, and indeed to those issued by the Superior Health Council for all adult Belgians. | Eat more plant-based food than animal-based food. Eat seasonal fruit and veg. Drink mostly tap water. Moderate fish consumption. Opt for less processed plant-based meat and dairy substitutes. | “Plant-based generally has lower environmental impact. Legumes very low impact compared to meat. Not only are seasonal fruits and veg at their best, but their environmental impact is also more limited. Did you know that buying local is not always better for the environment? They can have a higher environment impact if they are grown in heated greenhouses.” “Given that no packaging and transport is required, tap water has a lower environment impact. Fish can have a significant environmental impact.” | “Make a week menu and plan one veggie day to begin with. Increase number of veggie days step by step. Website and app for tasty and healthy recipes and a decision-tree to help choice. Better to opt for less processed variants like tofu, tempeh and seitan and use the Nutri-Score to make better choices. For dairy substitutes, soy drinks enriched with calcium and vitamins has nutritional value comparable to milk. Drinks based on nuts, oats or rice have lower protein content.” | “Start with one meat-free day per week and build from there. Eat handful of unsalted nuts every day.” “If opt for meat, have one meat meal per day and have a small portion… size of your palm.” “It is recommended to eat (oily) fish once or twice per week.” |
Brazil
Document type | Publishing organisation | Document name (publication date) and weblink source | Document length (pages) | Comments |
Consumer | Ministry of Health | Food Guide for the Brazilian population (2018) https://www.gov.br/saude/pt-br/assuntos/saude-brasil/publicacoes-para-promocao-a-saude/guiadebolso2018.pdf/@@download/file (in Portuguese, machine translated by Google Translate and DeepL). | 49 (pdf) | Environmental sustainability is mentioned briefly, but no dietary recommendations are linked explicitly to environment and climate. |
Background | Ministry of Health University of São Paulo | Dietary Guidelines for the Brazilian Population (2015) https://bvsms.saude.gov.br/bvs/publicacoes/dietary_guidelines_brazilian_population.pdf Food and health: the scientific basis of the food guide for the Brazilian population (2019) https://www.livrosabertos.sibi.usp.br/portaldelivrosUSP/catalog/view/339/298/1248 | 152 (pdf) 133 (pdf) | Environmental sustainability is acknowledged as important but no dietary recommendations are linked explicitly to environment and climate. |
Degree to which document links guidance to environmental impact: Extensive and frequent Partial Occasional or none
Which document? | What Advice? | Why Do This? | How Do This? | Quantification? |
N/A | N/A | N/A | N/A | N/A |
Canada
Document type | Publishing organisation | Document name (publication date) and weblink source | Document length (pages) | Comments |
Consumer | Health Canada | Canada’s Food Guide (2019) https://food-guide.canada.ca/sites/default/files/artifact-pdf/HEPs-Guide-nw-en.pdf see also https://food-guide.canada.ca/en/ | 2 (pdf) | Does recommend choosing protein that comes from plants more often and notes lower environmental impact, but no dietary recommendations are linked explicitly to environment or climate |
Background | Health Canada | Canada’s Dietary Guidelines for Health professionals and Policy makers (2018/19) https://food-guide.canada.ca/sites/default/files/artifact-pdf/CDG-EN-2018.pdf see also https://www.canada.ca/en/health-canada/services/food-nutrition/healthy-eating-strategy.html | 62 (pdf) | Background document briefly notes emissions from food waste. No dietary recommendations are linked explicitly to environment or climate |
Degree to which document links guidance to environmental impact: Extensive and frequent Partial Occasional or none
Which document? | What Advice? | Why Do This? | How Do This? | Quantification? |
N/A | N/A | N/A | N/A | N/A |
NB. National level guidelines apply everywhere but supporting policy measures vary across sub-national jurisdictions across Canada.
Chile
Document type | Publishing organisation | Document name (publication date) and weblink source | Document length (pages) | Comments |
Consumer | Ministry of Health | Food Guides for Chile (2022) https://www.minsal.cl/wp-content/uploads/2023/08/Guias-alimentarias-version-corregida-MINSAL.pdf (in Spanish, machine translated into English by Google Translate, DeepL unable to do so) | 12 (pdf) | No mention of climate or environment beyond reducing food packaging and waste. No dietary recommendations are linked explicitly to environment or climate |
Background | Ministry of Health | Dietary Guidelines for Chile (2022) https://www.minsal.cl/wp-content/uploads/2022/12/guias_alimentarias_2022_2ed.pdf (in Spanish, machine translated into English by Google Translate and DeepL) Updating Of Food-Based Dietary Guidelines Food-Based Dietary Guidelines (Fbg) For The Chilean Population”. Conceptual Development Framework Reports 1 & 2 (2022) https://www.minsal.cl/wp-content/uploads/2022/12/02.11.2022-PRODUCTO-1.pdf https://www.minsal.cl/wp-content/uploads/2022/12/02.112022-PRODUCTO-2.pdf (in Spanish, machine translated into English by Google Translate and DeepL) | 108 (pdf) 686 (pdf) 236 (pdf) | Sustainable, environment and climate are mentioned frequently, but no dietary recommendations are linked explicitly to environment or climate |
Degree to which document links guidance to environmental impact: Extensive and frequent Partial Occasional or none
Which document? | What Advice? | Why Do This? | How Do This? | Quantification? |
N/A | N/A | N/A | N/A | N/A |
Croatia
Document type | Publishing organisation | Document name (publication date) and weblink source | Document length (pages) | Comments |
Consumer | Croatian Institute for Public Health | Healthy living. Do you also eat healthy? (2018) https://www.hzjz.hr/wp-content/uploads/2020/03/Hrana-LETAK.pdf (in Croatian, machine translated into English by Google Translate and DeepL) | 2 (pdf) | No mention of climate or environment. No dietary recommendations are linked explicitly to environment or climate |
Background | Croatian Institute for Public Health | Recommendations for the spring and summer nutrition (2018) https://zivjetizdravo.eu/wp-content/uploads/2020/03/Brosura-PROLJECE_LJETO-.pdf and Recommendations for the autumn and winter nutrition, 2018 https://zivjetizdravo.eu/wp-content/uploads/2020/03/Brosura-JESEN_ZIMA-LowRes.pdf (in Croatian, machine translated into English by Google Translate and DeepL) | 2 x 28 (pdf) | No mention of climate or environment. No dietary recommendations are linked explicitly to environment or climate |
Degree to which document links guidance to environmental impact: Extensive and frequent Partial Occasional or none
Which document? | What Advice? | Why Do This? | How Do This? | Quantification? |
N/A | N/A | N/A | N/A | N/A |
Cyprus
Document type | Publishing organisation | Document name (publication date) and weblink source | Document length (pages) | Comments |
Consumer | Ministry of Health | National Nutrition and Exercise Guidelines leaflet (2011) (in Greek, machine translated into English by Google Translate, DeepL unable to do so) | 2 (pdf) | No mention of climate or environment. No dietary recommendations are linked explicitly to environment or climate |
Background | Ministry of Health | National Nutrition and Exercise Guidelines (2011) Layout 1 (moh.gov.cy) (in Greek, machine translated into English by Google Translate, DeepL unable to do so) | 16 (pdf) | No mention of climate or environment. No dietary recommendations are linked explicitly to environment or climate |
Degree to which document links guidance to environmental impact: Extensive and frequent Partial Occasional or none
Which document? | What Advice? | Why Do This? | How Do This? | Quantification? |
N/A | N/A | N/A | N/A | N/A |
NB. National level guidelines apply everywhere but supporting policy measures vary across sub-national jurisdictions across Canada.
Denmark
Document type | Publishing organisation | Document name (publication date) and weblink source | Document length (pages) | Comments |
Consumer | Ministry of Food, Agriculture and Fisheries | The Official Dietary Guidelines – Good for Health and Climate (2021) https://foedevarestyrelsen.dk/publikationer/2021/de-officielle-kostraad-godt-for-sundhed-og-klima-pjece (in Danish, machine translated into English by Google Translate and DeepL). Website also includes other materials. | 23 (pdf) | Frequent mention of climate/ environment. Recommendations are linked explicitly to environment or climate |
Background | National Food Institute Department of Risk Assessment and Nutrition | Nordic Nutrition Recommendations 2023 Integrating Environmental Aspects (2023) https://pub.norden.org/nord2023-003/ Advice on sustainable healthy eating. Professional basis for a supplement to the Official Dietary Guidelines (2020) https://www.food.dtu.dk/english/-/media/institutter/foedevareinstituttet/publikationer/pub-2020/rapport-raad-om-baeredygtig-kost.pdf (in Danish, machine translated into English by Google Translate and DeepL). | c.20 (web) 116 (pdf) | Explicit reference to Planetary Boundaries, SDGs, environment, climate change and EAT-Lancet etc. Recommendations are linked explicitly to environment or climate |
Degree to which document links guidance to environmental impact: Extensive and frequent Partial Occasional or none
Which document? | What Advice? | Why Do This? | How Do This? | Quantification? |
Consumer | “Eat more fruit and veg.” “Limit the use of butter”. “Eat less meat.” | Fruit and veg “…are among the foods with the lowest carbon footprint.” “A high intake of dairy products contributes to increased climate impact. “Cutting down on meat is also good for the climate. This applies to all types of mea, especially beef and lamb…. Poultry, pork and eggs have a significantly lower impact on the climate than beef and lamb.” | “Introduce meat-free days and use less meat in your meals. “Replace meat with vegetables, legumes or wholegrains.” “Choose vegetable oils and low-fat dairy products.” “Eat foods with wholegrains.” | “Around 350g or meat per week is sufficient.” “Around 250ml milk product per day, 20g cheese per day” “30g nuts per day, 1-2 tablespoons seeds per day” “75g wholegrains per day” “600g per day fruit and veg” plus “100g per day legumes” |
Estonia
Document type | Publishing organisation | Document name (publication date) and weblink source | Document length (pages) | Comments |
Consumer | National Institute for Health Development | The Food Pyramid(2017) tai_toidupuramiid_plakat_est_420x594mm_bleed_5mm_FIX (in Estonian, machine translated to English via Google Translate) | 1 (pdf) | No mention of environment or climate No dietary recommendations are linked explicitly to environment or climate |
Background | National Institute for Health Development | Estonian Diet and Exercise Recommendations (2017) https://intra.tai.ee/images/prints/documents/149019033869_eesti%20toitumis-%20ja%20liikumissoovitused.pdf (in Estonian, machine translated to English via Google Translate) | 338 (pdf) | Section on sustainable consumption and notes climate and environmental impacts. No dietary recommendations are linked explicitly to environment or climate |
Degree to which document links guidance to environmental impact: Extensive and frequent Partial Occasional or none
Which document? | What Advice? | Why Do This? | How Do This? | Quantification? |
N/A | N/A | N/A | N/A | N/A |
Finland
Document type | Publishing organisation | Document name (publication date) and weblink source | Document length (pages) | Comments |
Consumer | Finnish Food Authority
| Nutrition and Food Recommendations (2020) | c.30 (web) | Dietary recommendations are linked explicitly to environment and climate. |
Background | State Nutrition Advisory Board | Health from food. Finnish Nutrition Recommendations 2014 (2018) https://www.ruokavirasto.fi/globalassets/teemat/terveytta-edistava-ruokavalio/kuluttaja-ja-ammattilaismateriaali/julkaisut/ravitsemussuositukset_2014_fi_web_versio_5.pdf (in Finnish, machine translated to English via Google Translate) | 59 (pdf) | Dietary recommendations are linked explicitly to environment and climate. |
Degree to which document links guidance to environmental impact: Extensive and frequent Partial Occasional or none
Which document? | What Advice? | Why Do This? | How Do This? | Quantification? |
Consumer. | “More fruit and berries, vegetables, leguminous plants, whole and nuts and seeds.” “Less red meat and meat products” “We should favour domestic plants of the crop season, i.e. local and seasonal food.” | “A higher proportion of vegetables, root plants, potatoes, berries and fruit as well as cereal products in the diet reduces the load on the climate and eutrophication.” | “The more colourful your food is, the better! Eat some of your vegetables uncooked. Oil-based dressings add juiciness and flavour to salads and grated vegetables. Eating berries and fruit whole is better than juicing them.” “…it is advisable to select poultry meat rather than red meat.” | “Eat at least five handfuls of vegetables, berries and fruit a day.” “No more than 500 g of red meat and meat products a week (cooked weight).” |
France
Document type | Publishing organisation | Document name (publication date) and weblink source | Document length (pages) | Comments |
Consumer | Santé publique France | 50 Tips to Eat Better and Move More (2017) https://www.mangerbouger.fr/content/show/1501/file/Brochure_50_petites_astuces.pdf (in French, machine translated using Google Translate and DeepL) | 32 (pdf) | Document makes limited reference to the env, and only for meat and bottled water consumption. Other guidance, such as eating more veg, consuming organic, is made without linking to env outcomes. Eating to benefit the env is presented as choosing local and seasonal products. |
Background | ANSES French Agency for Food, Environmental, and Occupational Health & Safety Santé publique France | Updating of the PNNS guidelines: revision of the food-based dietary guidelines ANSES opinion Collective expert report (2016) https://www.anses.fr/en/system/files/NUT2012SA0103Ra-1EN.pdf Recommendations Concerning Diet, Physical Activity and Sedentary Behaviour for Adults (2019, Updated 2023) https://www.santepubliquefrance.fr/content/download/515446/3807453?version=1 | 282 (pdf) | Document gives explanation of the process by which the revised guidelines were arrived at, and justification/evidence for the decisions. It does not refer to the environment – it is entirely health-based. |
Degree to which document links guidance to environmental impact: Extensive and frequent Partial Occasional or none
Which document? | What Advice? | Why Do This? | How Do This? | Quantification? |
Consumer. | “Good eating also means taking into account the environment by showing preference for foods from local producers and foods in season.” “Eat less meat, eat more pulses.” | “Of all foods, it’s meat which has the biggest climate impact. Pulses are the heroes of sustainable agriculture, as they naturally enrich the soil without need for fertilisers, and use little water.” | Various meal suggestions for including more pulses. No actual direction on swapping meat with pulses | “Maximum of 500g per week of meat, of which maximum 150g processed meat. Eat minimum 2 portions of pulses per week.” |
Germany
Document type | Publishing organisation | Document name (publication date) and weblink source | Document length (pages) | Comments |
Consumer | German Society for Nutrition (DGE) | DGE Nutrition Circle (2024) https://www.dge.de/gesunde-ernaehrung/gut-essen-und-trinken/dge-ernaehrungskreis/ but also Eat and drink well – the DGE recommendations (2024) Eat and drink well – the DGE recommendations | DGE and FAQ (2024) https://www.dge.de/gesunde-ernaehrung/faq/lebensmittelbezogene-ernaehrungsempfehlungen-dge/#c6508 | 1+ (web) 1+ (web) 1+ (web) | Explicit reference to environment impacts, albeit not explained in great detail |
Background | German Environment Agency German Federal Ministry for Food and Agriculture German Society for Nutrition (DGE) | Towards healthy and sustainable diets in Germany An analysis of the environmental effects and policy implications of dietary change in Germany (2023) https://www.umweltbundesamt.de/sites/default/files/medien/11740/publikationen/2023-05-10_texte_67-2023_towards_healthy_1.pdf Key Issues Paper: Towards the Federal Government’s Food Strategy (2022) https://www.bmel.de/SharedDocs/Downloads/DE/_Ernaehrung/ernaehrungsstrategie-eckpunktepapier.html (in German, machine translated to English using Google Translate and DeepL) Scientific basis of food-related dietary recommendations for Germany (2024) https://www.ernaehrungs-umschau.de/fileadmin/Ernaehrungs-Umschau/pdfs/pdf_2024/03_24/EU03_2024_M158_M166_Online.pdf (machine translated via DeepL) | 11 (pdf) 10 (pdf) 9 (pdf) | Environmental impacts of dietary choices acknowledged explicitly. |
Degree to which document links guidance to environmental impact: Extensive and frequent Partial Occasional or none
Which document? | What Advice? | Why Do This? | How Do This? | Quantification? |
Consumer | Take advantage of the variety of foods and eat a varied diet. Choose predominantly plant-based foods. | Predominantly plant-based diet have less impact on the environment and the climate. In the production of plant-based foods, the consumption of resources and the emission of harmful greenhouse gases is lower than in the production of animal-based foods | Incorporate vegetables and fruits into every meal, either raw or gently prepared, so that many nutrients are preserved. The more colorful, the better. For meat and sausage, choose the low-fat variants. | At least 550g of fruit and vegetables daily. No more than 500g of milk and dairy products daily. A weekly amount of meat and sausage of no more than 300g. |
Greece
Document type | Publishing organisation | Document name (publication date) and weblink source | Document length (pages) | Comments |
Consumer | Ministry of Health | National Nutrition Guide for Greek Adults (2014) http://www.diatrofikoiodigoi.gr/files/PDF/ADULTS.pdf (in Greek, machine translated to English via Google Translate) Also http://www.diatrofikoiodigoi.gr/?page=summary-adults (English summary) | 132 (pdf) 16 (web) | Pollution from food transport is mentioned. No dietary recommendations are linked explicitly to environment or climate. |
Background | Ministry of Health | National Nutrition Guide for Greek Adults – Scientific Documentation (2014) | 250 (pdf) | Briefly notes climate and environmental impacts of animal production and benefits of plant based Mediterranean diet, but no dietary recommendations are linked explicitly to environment or climate. |
Degree to which document links guidance to environmental impact: Extensive and frequent Partial Occasional or none
Which document? | What Advice? | Why Do This? | How Do This? | Quantification? |
N/A | N/A | N/A | N/A | N/A |
Hungary
Document type | Publishing organisation | Document name (publication date) and weblink source | Document length (pages) | Comments |
Consumer | National Association of Hungarian Dietitians (endorsed by Food Science Scientific Committee of the Hungarian Academy of Sciences) | OKOSTÁNYÉR® – SmartPlate, new Hungarian Dietary Recommendations (2016, renewed in 2021) http://mdosz.hu/uj-taplalkozasi-ajanlasok-okos-tanyer/ (Hungarian, machine translated into English using Google Translate and DeepL) and https://www.okostanyer.hu/wp-content/uploads/2021/11/2021_OKOSTANYER_ANGOL_felnott_A4.pdf (in English). Other web resources (2018 – 2021) at https://www.okostanyer.hu/ (some in English) | 1+ (web) 3 (pdf) | Renewed version mentions more plant-based foods and restricting meat. No dietary recommendations are linked explicitly to environment or climate. |
Background | None found | None found | N/A | N/A |
Degree to which document links guidance to environmental impact: Extensive and frequent Partial Occasional or none
Which document? | What Advice? | Why Do This? | How Do This? | Quantification? |
N/A | N/A | N/A | N/A | N/A |
Iceland
Document type | Publishing organisation | Document name (publication date) and weblink source | Document length (pages) | Comments |
Consumer | Directorate of Health | Dietary Recommendations for Adults and Children from the Age of Two (2017) https://island.is/en/nutrition-recommendations/radleggingar_spurningar_svor see also Radleggingar_mataraedi_vef_utgafa_2021.pdf (ctfassets.net) and diskamodel- skola (ctfassets.net) (both in Icelandic, machine translated to English using Google Translate and DeepL) | 28 (pdf) | Based on Nordic Nutrition Recommendations from 2013. No mention of environment or climate. No dietary recommendations are linked explicitly to environment or climate. |
Background | Directorate of Health | Basis for dietary recommendations (2016) Grundvollur_radlegginga_um_mataraedi_og_radlagdir_dagskammtar.pdf (ctfassets.net) (in Icelandic, machine translated to English using Google Translate) | 25 (pdf) | Based on Nordic Nutrition Recommendations from 2013. Passing reference to environment and climate. No dietary recommendations are linked explicitly to environment or climate |
Degree to which document links guidance to environmental impact: Extensive and frequent Partial Occasional or none
Which document? | What Advice? | Why Do This? | How Do This? | Quantification? |
N/A | N/A | N/A | N/A | N/A |
Ireland
Document type | Publishing organisation | Document name (publication date) and weblink source | Document length (pages) | Comments |
Consumer | Health Service Executive | The Healthy Food Pyramid (2016) https://www.hse.ie/eng/about/who/healthwellbeing/our-priority-programmes/heal/food-pyramid-images/food-pyramid-simple-version.pdf and Healthy Food for Life. The Food Pyramid guide to every day food choices for adults, teenagers and children aged five and over (2016) https://assets.gov.ie/7649/3049964a47cb405fa20ea8d96bf50c91.pdf | 1 (pdf) 7 (pdf) | No mention of environment or climate No dietary recommendations are linked explicitly to environment or climate |
Background | Health Service Executive | Healthy Food for Life Food Pyramid Questions and Answer (2016) Healthy Food for Life Revised healthy eating guidelines and Food Pyramid rationale (2016) https://www.hse.ie/eng/about/who/healthwellbeing/our-priority-programmes/heal/food-pyramid-images/foodforlifefoodpyramidrationale2016.pdf | 4 (pdf) 8 (pdf) | No mention of environment or climate No dietary recommendations are linked explicitly to environment or climate |
Degree to which document links guidance to environmental impact: Extensive and frequent Partial Occasional or none
Which document? | What Advice? | Why Do This? | How Do This? | Quantification? |
N/A | N/A | N/A | N/A | N/A |
Italy
Document type | Publishing organisation | Document name (publication date) and weblink source | Document length (pages) | Comments |
Consumer | CREA Food and Nutrition Research Center | Guidelines for Healthy Eating (2019) https://sapermangiare.mobi/483/linee-guida.html (in Italian, machine translated to English using Google Translate and DeepL), with links through to sections of Background document (oddly ignoring meat) Sustainable Diets https://sapermangiare.mobi/N3567/diete-sostenibili.html (in Italian, machine translated to English using Google Translate and DeepL) | 13 (web + vidoes)) 1 (web) | Sustainable consumption discussed, but dietary recommendations are not linked explicitly to environment or climate, and env criteria are secondary to health and cultural criteria |
Background | CREA Food and Nutrition Research Center | Healthy Eating Guidelines Revision 2018 (2019) https://www.crea.gov.it/en/web/alimenti-e-nutrizione/-/linee-guida-per-una-sana-alimentazione-2018 (in Italian, machine translated to English using Google Translate and DeepL) | 231 (pdf) | Section on sustainable consumption and notes climate and environmental impacts, but dietary recommendations are not linked explicitly to environment or climate |
Degree to which document links guidance to environmental impact: Extensive and frequent Partial Occasional or none
Which document? | What Advice? | Why Do This? | How Do This? | Quantification? |
N/A | N/A | N/A | N/A | N/A |
Latvia
Document type | Publishing organisation | Document name (publication date) and weblink source | Document length (pages) | Comments |
Consumer | Ministry of Health | Eat healthily using the plate principle (2020) https://esparveselibu.lv/sites/default/files/2020-09/Skivja-princips-infografika.pdf (in Latvian, machine translated to English using Google Translate and DeepL) | 1 (pdf) | No mention of climate or environment. No dietary recommendations are linked explicitly to environment or climate. |
Background | Ministry of Health | Dietary Guidelines for Adults (2020) https://esparveselibu.lv/sites/default/files/inline-files/VM_Uztura_ieteik_pieaug.pdf (in Latvian, machine translated to English using Google Translate and DeepL) | 13 (pdf) | Guidelines influenced by the WHO recommendations and Nordic Nutrition. No mention of climate or environment. No dietary recommendations are linked explicitly to environment or climate. |
Degree to which document links guidance to environmental impact: Extensive and frequent Partial Occasional or none
Which document? | What Advice? | Why Do This? | How Do This? | Quantification? |
N/A | N/A | N/A | N/A | N/A |
Malta
Document type | Publishing organisation | Document name (publication date) and weblink source | Document length (pages) | Comments |
Consumer | Ministry for Health | Dietary guidelines for Maltese adults. Healthy eating the Mediterranean way! (2015) https://hpdp.gov.mt/sites/default/files/2023-07/healthy_eating_the_mediterranean_way_en.pdf Dietary Guidelines for Maltese Children the Mediterranean Way! (2018) | 16 (pdf) 16 (pdf) | No mention of climate or environment. No dietary recommendations are linked explicitly to environment or climate. |
Background | N/A | None found (but strategy is published as https://health.gov.mt/wp-content/uploads/2023/04/Food_and_Nutrition_Policy_and_Action_Plan_for_Malta_2015-2020_EN.pdf) | N/A | FAO cites “Dietary guidelines for Maltese adults: information for professionals” but links are broken |
Degree to which document links guidance to environmental impact: Extensive and frequent Partial Occasional or none
Which document? | What Advice? | Why Do This? | How Do This? | Quantification? |
N/A | N/A | N/A | N/A | N/A |
Netherlands
Document type | Publishing organisation | Document name (publication date) and weblink source | Document length (pages) | Comments |
Consumer | Netherlands Nutrition Centre Netherlands Nutrition Centre | The Wheel of five (2020) https://www.voedingscentrum.nl/Assets/Uploads/voedingscentrum/Documents/Service/English/Wheel-of-five.pdf How do you eat healthy and sustainably? Sustainable eating in 7 steps (2020) https://www.voedingscentrum.nl/nl/duurzaam-eten/duurzaam-eten-in-7-stappen.aspx https://www.voedingscentrum.nl/nl/gezond-eten-met-de-schijf-van-vijf/hoe-eet-je-gezond-en-duurzaam.aspx (in Dutch, machine translated to English using Google Translate, DeepL unable to do so) | 5 (pdf) 1 (web) 1 (web) | Mentions sustainability but no meaningful link to recommendations Dietary recommendations are linked explicitly to environment or climate. |
Background | Netherlands Nutrition Centre | Eating More Sustainably: Fact Sheet for professionals (2022) | 8 (pdf) | Dietary recommendations are linked explicitly to environment or climate. |
Degree to which document links guidance to environmental impact: Extensive and frequent Partial Occasional or none
Which document? | What Advice? | Why Do This? | How Do This? | Quantification? |
Background | ”..eat less meat, and what meat you do eat, make it more sustainably produced meat” “within each food category, eat the most sustainably produced or lowest envtl impact option” “eat enough dairy and cheese, but within boundaries”. “navigate trade-offs between sustainability impacts of animal production systems” | “The current Dutch diet is not sustainable.” “The food we eat has a major impact on the environment” “Generally speaking, the greatest environmental benefit can be achieved by: eating less meat and more sources of plant-based proteins, such as pulses and nuts; wasting less food; only eating what you need”. “…meat is responsible for easily the largest proportion of GHG emissions” | “A diet based on the Wheel of Five can be food for your health as well as beneficial in terms of sustainability.” “Opt more often for pulses, nuts or eggs”. “Select certified products from the list approved by Milieu Centraal” “Consume fewer products that are not on the Wheel of Five” “Buy and cook what you need”, “eat recommended amounts” “…sometimes compromises are necessary… | “If you eat 400g of meat a week rather than the recommended maximum of 500g, this would result in a reduction in GHG emissions of 9% for men and 10% for women”. Also “If you stop eating meat and replace it with pulses, nuts and eggs, this would result in a reduction in GHG emissions of 35% for men and 37% for women” |
New Zealand
Document type | Publishing organisation | Document name (publication date) and weblink source | Document length (pages) | Comments |
Consumer | Ministry of Health | Eating and Activity Guidelines for New Zealand Adults: Summary of Guidelines Statements and Key Related Information (2021) | 6 (pdf) | No mention of climate or environment. No dietary recommendations are linked explicitly to environment or climate |
Background | Ministry of Health | Eating and Activity Guidelines for New Zealand Adults (2020) https://www.health.govt.nz/system/files/documents/publications/eating-activity-guidelines-new-zealand-adults-updated-2020-oct22.pdf | 164 (pdf) | Mentions environmental impacts and emissions but no dietary recommendations are linked explicitly to environment or climate. |
Degree to which document links guidance to environmental impact: Extensive and frequent Partial Occasional or none
Which document? | What Advice? | Why Do This? | How Do This? | Quantification? |
N/A | N/A | N/A | N/A | N/A |
Norway
Document type | Publishing organisation | Document name (publication date) and weblink source | Document length (pages) | Comments |
Consumer | Norwegian Directorate of Health | Norwegian Dietary Guidelines (c.2014) | 28 (pdf) | No mention of climate or environment. No dietary recommendations are linked explicitly to environment or climate |
Background | National Council for Nutrition, Directorate of Health | Dietary advice to promote public health and prevent chronic illnesses: methodology and scientific knowledge base (2011). Not found online, only in printed form https://www.fagbokforlaget.no/Kostr%C3%A5d-for-%C3%A5-fremme-folkehelsen-og-forebygge-kroniske-sykdommer/I9788245022995 | 353 (physical) | N/A |
Degree to which document links guidance to environmental impact: Extensive and frequent Partial Occasional or none
Which document? | What Advice? | Why Do This? | How Do This? | Quantification? |
N/A | N/A | N/A | N/A | N/A |
NB New Nordic Nutrition Recommendations (2023) https://www.norden.org/en/publication/nordic-nutrition-recommendations-2023 explicitly address sustainability issues and may indicate likely revision to expected update of dietary guidelines
Poland
Document type | Publishing organisation | Document name (publication date) and weblink source | Document length (pages) | Comments |
Consumer | Ministry of Health National Institute of Public Health | Eating and Activity Guidelines for New Zealand Adults: Summary of Guidelines Statements and Key Related Information (2021) Talerz i zalecenia 3 strony www (pzh.gov.pl) (in Polish, machine translated to English using Google Translate and DeepL) | 3 (pdf) | Environment mentioned only once, in relation to recommendation for meat and meat products |
Background | None found | N/A | N/A | N/A |
Degree to which document links guidance to environmental impact: Extensive and frequent Partial Occasional or none
Which document? | What Advice? | Why Do This? | How Do This? | Quantification? |
Consumer | Substitute meat with plant-based protein products, i.e. pulses (beans, chickpeas, soybeans, peas, lentils, broad beans) and nuts, as well as fish and eggs. | For health and the environment | Step 1 – Enter one day a week without meat. Step 2 – Swap processed meats and red meat for poultry, fish, pulses and eggs. Step 3 – Substitute meat with plant-based protein products, i.e. pulses (beans, chickpeas, soybeans, peas, lentils, broad beans) and nuts, as well as fish and eggs. | Do not eat more than 500 grams of red meat and processed meat (cold cuts, sausages) per week. Swap processed meats and red meat for poultry, fish, pulses and eggs. |
Portugal
Document type | Publishing organisation | Document name (publication date) and weblink source | Document length (pages) | Comments |
Consumer | Portuguese Health Directorate; Portuguese Consumer’s Directorate | The New Food Wheel. Guide to daily food choices. (2016) (in Portugese, machine translated to English using Google Translate and DeepL) The Mediterranean Food Wheel. Culture, tradition and Balance.(2020) https://alimentacaosaudavel.dgs.pt/roda-dos-alimentos/ (in Portugese, machine translated to English using Google Translate and DeepL) | 5 (pdf) 1 (web) | Two sets of guidelines exist in parallel. Environment and climate are not mentioned in either. No dietary recommendations are linked explicitly to environment or climate. |
Background | University of Porto | The Portuguese mediterranean diet wheel: development considerations (2022) | 7 (pdf) | Environment mentioned in passing. No dietary recommendations are linked explicitly to environment or climate. |
Degree to which document links guidance to environmental impact: Extensive and frequent Partial Occasional or none
Which document? | What Advice? | Why Do This? | How Do This? | Quantification? |
N/A | N/A | N/A | N/A | N/A |
Romania
Document type | Publishing organisation | Document name (publication date) and weblink source | Document length (pages) | Comments |
Consumer | Ministry of Health | The Food Pyramid (2006) https://www.ms.ro/documente/5%20recomandari%20nutritionale_8319_6030.pdf (in Romanian, machine translated to English using Google Translate and DeepL) | 1 (pdf) | Environment and climate are not mentioned. No dietary recommendations are linked explicitly to environment or climate. |
Background | Romanian Nutrition Society | Guide to Healthy Eating (2006) https://www.spitalsmeeni.ro/docs/ghiduri/ghid_alimentatie_populatie.pdf and https://www.fao.org/3/as693ro/as693ro.pdf (in Romanian, machine translated to English using Google Translate and DeepL) | 48 (Word) 173 (pdf) | Environment and climate are not mentioned. No dietary recommendations are linked explicitly to environment or climate. |
Degree to which document links guidance to environmental impact: Extensive and frequent Partial Occasional or none
Which document? | What Advice? | Why Do This? | How Do This? | Quantification? |
N/A | N/A | N/A | N/A | N/A |
Spain
Document type | Publishing organisation | Document name (publication date) and weblink source | Document length (pages) | Comments |
Consumer | Spanish Agency for Food Safety and Nutrition | Sustainable Dietary and Physical Activity Recommendations (2022) https://www.aesan.gob.es/AECOSAN/docs/documentos/nutricion/RECOMENDACIONES_DIETETICAS_EN.pdf | 19 (pdf) | Recommendations are linked explicitly to environment or climate |
Background | Spanish Agency for Food Safety and Nutrition | Report of the Scientific Committee of the Spanish Agency for Food Safety and Nutrition (AESAN) on sustainable dietary and physical activity recommendations for the Spanish population (2022) https://www.aesan.gob.es/AECOSAN/docs/documentos/seguridad_alimentaria/evaluacion_riesgos/informes_cc_ingles/RRDD_SOSTENIBLES_INGLES.pdf | 55 (pd) | Explicit reference to Planetary Boundaries, SDGs, environment, climate change and EAT-Lancet etc. Recommendations are linked explicitly to environment or climate |
Degree to which document links guidance to environmental impact: Extensive and frequent Partial Occasional or none
Which document? | What Advice? | Why Do This? | How Do This? | Quantification? |
Consumer | “Consume a minimum of 5 [fruit and veg] servings per day…3-6[cereals] servings a day….. a maximum of 3 [dairy]servings a day”. “0 to a maximum of 3 servings of meat per week” “At least 3 [fish] servings per week” “Consume a maximum of 4 medium-sized eggs a week” “Consume at least 4 [legume] servings a week” | “The environmental impact of cereals…vegetables and fruits is low…legumes have little environmental impact.” “The environmental impact of meat is greater than that of other types of food” “…high environmental impact of dairy products…” | Prefer buying fresh seasonal, local, and minimally processed products. Choose products from farms where animal husbandry meets the highest standards of animal welfare and eat all parts of the animal (including fatty cuts and offals), to avoid waste. Prioritising the consumption of white meat of poultry and rabbit | Fruit & veg: 120g – 200g per portion Cereals: 40g -80g per portion Legumes: 50g – 60g per portion Fish: 120g – 150g per portion Eggs: 53g – 63g per portion Dairy: <250g per portion Meat: 100g – 125g per portion |
Slovenia
Document type | Publishing organisation | Document name (publication date) and weblink source | Document length (pages) | Comments |
Consumer | National Institute for Public Health | 12 Steps Towards Health Eating. Dietary recommendation (2018) https://nijz.si/wp-content/uploads/2022/07/12_korakov_plakat_0.pdf (in Slovenian, machine translated to English using Google Translate and DeepL) | 1 (pdf) | Meat free days and plant-based food mentioned. No dietary recommendations are linked explicitly to environment or climate. |
Background | None found | None found | N/A | N/A. However, a Strategic Council for Health & Nutrition was appointed in 2023 and endorses a shift to the Eat Lancet approach – implying it is not currently deployed https://www.gov.si/zbirke/delovna-telesa/strateski-svet-za-prehrano/ |
Degree to which document links guidance to environmental impact: Extensive and frequent Partial Occasional or none
Which document? | What Advice? | Why Do This? | How Do This? | Quantification? |
N/A | N/A | N/A | N/A | N/A |
Sweden
Document type | Publishing organisation | Document name (publication date) and weblink source | Document length (pages) | Comments |
Consumer | Swedish Food Agency | The Swedish Dietary Guidelines. Find your way to eat greener, not too much and be active (2015) | 28 (pdf) | Frequent mention of climate/ environment. Dietary recommendations are linked explicitly to environment or climate. |
Background | Swedish Food Agency | The Swedish Dietary Guidelines – risk benefit and management report (2015) | 79 (pdf) | Frequent mention of climate/ environment. Dietary recommendations are linked explicitly to environment or climate. |
Degree to which document links guidance to environmental impact: Extensive and frequent Partial Occasional or none
Which document? | What Advice? | Why Do This? | How Do This? | Quantification? |
Consumer | “eat more.. fruit and veg…seafood, healthy fats… low fat dairy” “., switch to wholegrain, eat less meat”. “Choose more sustainably produced foods” | “what you eat isn’t just important to your own personal well-being: it’s important to the envt as well… one quarter of the climate impact of Swedish households comes from the food we eat – or throw away. That’s why we’ve devised this advice on how you can eat sustainably – to the benefit of both your health and the envt. So that you don’t have to choose.” | “Ecolabels such as ‘organic’ help you choose foods produced with the envt in mind.” “Focus more on vegetarian foods and eggs, and sometimes fish or poultry. Or eat meat a little more often, but in small quantities.” “If you cut back on meat, you’ll have enough money for meat produced sustainably, with attention paid to the welfare of the animals. Choose ecolabelled meats such as free range, organic or certified eco-friendly.” | Fruit & veg: 500g per day (does not include potatoes) Fish: 2-3 times p/w (with caveats for oily fish from polluted waters Wholegrain 70g per day women, 90g per day men Red meat and processed meat; 500g per week Dairy: 2-3 decilitres of milk or fermented milk per day, to ensure you get enough calcium |
Switzerland
Document type | Publishing organisation | Document name (publication date) and weblink source | Document length (pages) | Comments |
Consumer | Swiss Society for Nutrition | The Swiss Food Pyramid (2016) | 5 (pdf) | Environment and sustainable diets mentioned. No dietary recommendations are linked explicitly to environment or climate. |
Background | Federal Department of Home Affairs. See also Federal Office of Food Safety and Veterinary Affairs; Federal Commission for Nutrition | Eating Well and Staying Healthy Swiss Nutrition Policy 2017–2024 (2017) https://www.blv.admin.ch/dam/blv/en/dokumente/lebensmittel-und-ernaehrung/ernaehrung/schweizer-ernaehrungsstrategie-2017-2024.PDF.download.PDF/Ernaehrungsstrategie_Brosch_EN.PDF also Nutrition Strategy Action Plan (2017) https://www.plandactionnutrition.ch/ NB Reappraisal of the scientific evidence linking consumption of foods from specific food groups to NCDs (2020) https://www.blv.admin.ch/blv/en/home/das-blv/organisation/kommissionen/eek/pyramide-neubewertung-lebensmittelkonsum-ncd.html | N/A | No mention of environment or climate. No dietary recommendations are linked explicitly to environment or climate. |
Degree to which document links guidance to environmental impact: Extensive and frequent Partial Occasional or none
Which document? | What Advice? | Why Do This? | How Do This? | Quantification? |
N/A | N/A | N/A | N/A | N/A |
UK (England, Northern Ireland, Scotland and Wales)
Document type | Publishing organisation | Document name (publication date) and weblink source | Document length (pages) | Comments |
Consumer | Public Health England in association with the Welsh Government, Food Standards Scotland and the Food Standards Agency in Northern Ireland | The Eat Well Guide (2016) https://assets.publishing.service.gov.uk/media/5a75564fed915d6faf2b2375/Eatwell_guide_colour.pdf (mirrored identically on official websites in Northern Ireland, Scotland and Wales) The Eatwell Guide. Helping you eat a healthy, balanced diet (2019) https://www.food.gov.uk/sites/default/files/media/document/eatwell-guide-master-digital%20Final.pdf (mirrored almost identically on official websites in Northern Ireland, Scotland and Wales) | 1 (pdf) 12 (pdf) | No mention of environment or climate, sustainable mentioned briefly. No dietary recommendations are linked explicitly to environment or climate. |
Background | As above As above | From Plate to Guide: What, why and how for the eatwell model (2016) https://assets.publishing.service.gov.uk/media/5a7f73f7e5274a2e8ab4c461/eatwell_model_guide_report.pdf The Eatwell Guide: a More Sustainable Diet. Methodology and Results Summary (2016) https://www.foodstandards.gov.scot/downloads/ The_Eatwell_Guide_a_more_sustainable_diet.pdf | 37 (pdf) 12 (pdf) | Lack of a sustainability criteria acknowledged (and no dietary recommendations are linked explicitly to environment or climate) but points to ex post estimation by Carbon Trust of positive environmental gains relative to current average diet |
Degree to which document links guidance to environmental impact: Extensive and frequent Partial Occasional or none
Which document? | What Advice? | Why Do This? | How Do This? | Quantification? |
N/A | N/A | N/A | N/A | N/A |
USA
Document type | Publishing organisation | Document name (publication date) and weblink source | Document length (pages) | Comments |
Consumer | United States Department of Agriculture | MyPlate (2020) https://myplate-prod.azureedge.us/sites/default/files/2021-01/DGA_2020-2025_StartSimple_withMyPlate_English_color.pdf but see also broader web resources | 4 (pdf) c.30+ (web) | No mention of environment or climate. No dietary recommendations are linked explicitly to environment or climate. |
Background | United States Department of Agriculture | Dietary Guidelines for Americans 2020 – 2025 (2020) | 164 (pdf) | No mention of environment or climate. No dietary recommendations are linked explicitly to environment or climate. |
Degree to which document links guidance to environmental impact: Extensive and frequent Partial Occasional or none
Which document? | What Advice? | Why Do This? | How Do This? | Quantification? |
N/A | N/A | N/A | N/A | N/A |
NB. Federal MyPlate guidance appears to apply across all individual States. Some (e.g. California) have State-badged material that is otherwise identical to Federal guidance. However, Alaska and Hawaii (plus Pacific Island dependencies) appear to also refer to the Secretariat of the Pacific Community and The Pacific Food Guide. The latter was sponsored by the United States Department of Agriculture to account for regional differences in culture and dietary challenges, but makes no mention of environmental or climate impacts of dietary choices: http://manoa.hawaii.edu/ctahr/pacificfoodguide/index.php/about-the-guide/. In response to academic criticism of the Federal guidance, Harvard University publishes the ‘Healthy Eating Plate’ as an alternative to MyPlate, https://www.health.harvard.edu/staying-healthy/healthy-eating-plate
Appendix C: Recommended intakes for key food groups, in FBDGs for 22 jurisdictions
All meat (g/wk) | Red/processed Meat (g/wk) | Dairy (ml/day) | Fruit and vegetables (g/d) | |
Austria | 399-450g | 600 | 650 | |
Australia | – | 455 | 625 | 675 |
Belgium Flanders | – | 500 | 250-500 | 550 |
Denmark | 350 | – | >250 | 600 |
Finland | 500 | – | -500 | |
France | – | 500 | – | – |
Germany | 300 | 60 | 250 | 550 |
Greece | 450 | 150 | 500 | 690 |
Hungary | – | 350-500 | 500 | 600 |
Iceland | – | 500 | 500 | 500 |
Italy | 300 | 100 | 375 | 800 |
Latvia | – | 500 | – | 500 |
Malta | 480 | 180 | 500 | 400 |
Netherlands | 500 | 300 | 300-450 | 450 |
New Zealand | – | 500 | – | – |
Norway | – | 500 | – | 500 |
Poland | – | 500 | – | 400 |
Portugal | 595 | – | 500 | 820 |
Spain | 375 | – | 500 | 690 |
Sweden | – | 500 | 200-500 | 500 |
Switzerland | – | – | 450-600 | 600 |
Source: derived from references listed in Appendix B
Appendix D: Summary dietary patterns, recommended intakes and population characteristics for Flanders, Netherlands, Sweden and Scotland
Belgium (2014) | Netherlands (2021) | Sweden (2010/11) | Scotland (2021) | |
Fruit | 115 | 134 | 128 | 134 |
Vegetables | 155 | 174 | 176 | 131 |
Meat | 104 | 92 | 110 | 80 |
Dairy | 202 | 329 | 245 | 230 |
18 <= BMI <25 | 49% | 50% | 49% | 32% (42%)* |
25 <= BMI <30 | 35% | 35% | 35% | 36% (35%)* |
BMI >= 30 | 14% | 13% | 14% | 31% (20%)* |
Population | 6.8m | 18.0m | 10.6m | 5.4m |
* Scottish-specific BMI figures with UK figures in brackets from same Eurostat source as other countries. Comparisons are indicative given differences in survey methods, definitions and vintage.
Dietary statistics sources:
Belgium.
Scientific Institute for Public health 2016 Food Consumption Survey 2014-2015 https://www.sciensano.be/en/biblio/enquete-de-consommation-alimentaire-2014-2015-resume-des-resultats
Healthy Belgium 2020 Nutritional habits https://www.healthybelgium.be/en/health-status/determinants-of-health/nutritional-habits
STATBEL 2023. Structure of the Population.
https://statbel.fgov.be/en/themes/population/structure-population
Statistics Flanders 2023. Gross domestic product per capita
https://www.vlaanderen.be/en/statistics-flanders/macro-economy/gross-domestic-product-per-capita
For a Healthy Belgium 2020. Weight status.
https://www.healthybelgium.be/en/health-status/determinants-of-health/weight-status#references
Netherlands.
National Institute for Public Health and the Environment: Ministry of Health, Welfare and Sport. 2022. The diet of the Dutch Results of the Dutch National Food Consumption Survey 2019-2021 on food consumption and evaluation with dietary guidelines. https://www.rivm.nl/bibliotheek/rapporten/2022-0190.pdf
National Institute for Public Health and the Environment: Ministry of Health, Welfare and Sport. 2023. Dutch National Food Consumption Survey 2019-2021: Consumption https://statline.rivm.nl/#/RIVM/nl/dataset/50110NED/table?ts=1706353152036
Statistics Netherlands 2023. Regional key figures; National Accounts https://www.cbs.nl/en-gb/figures/detail/84432ENG
Statistics Netherlands 2023. Population Counter https://www.cbs.nl/en-gb/visualisations/dashboard-population/population-counter
Sweden
Swedish National Food Agency 2012 National food – adults 2010-11. Food and nutrient intakes among adults in Swedenhttps://snd.gu.se/en/catalogue/dataset/ext0093-1
Swedish Board of Agriculture. 2023. Food consumption and nutrient content. Data up to and including 2019 https://jordbruksverket.se/om-jordbruksverket/jordbruksverkets-officiella-statistik/jordbruksverkets-statistikrapporter/statistik/2020-12-09-livsmedelskonsumtion-och-naringsinnehall.–uppgifter-till-och-med-2019
Official statistics of Sweden 2023. Population statistics https://www.scb.se/en/finding-statistics/statistics-by-subject-area/population/population-composition/population-statistics/
Statistics Sweden 2023. Sweden’s GDP per capita ranks seventh in Europe
Scotland
Barton, K. and Ronald, C. 2023. Estimation of Food and Nutrient Intakes from Food Purchase Data in Scotland 2001-2018 https://www.foodstandards.gov.scot/downloads/FSS_-_Monitoring_Dietary_Intakes_-_Living_Costs_and_Food_Survey_-_LCFS_-_2001_to_2018_-_Report_for_Publication_-_FINAL_-_PDF_Version_for_Publication_on_Website_-_01_February_2022.pdf
Stewart, C., McNeill, G., Runions, R., Comrie, F., McDonald, A. and Jaacks, P.L.M., 2023. Meat and milk product consumption in Scottish adults: Insights from a national survey. Available at SSRN 4628199. https://deliverypdf.ssrn.com/delivery.php?ID=857005071031031000088070115122121000008032020031003054085010011001034115108111087086083066097092081020103030015004125120065026076016072087060115025026001021037011068002087078095090086003011000052053046070037015000090031072029087122085104109065002075126019112074019089127120092112074085122005&EXT=pdf&INDEX=TRUE
Scotland’s Census 2023. Scotland’s Census 2022 – Rounded population estimates.
https://www.scotlandscensus.gov.uk/2022-results/scotland-s-census-2022-rounded-population-estimates
Obesity statistic sources:
Eurostat Body mass index (BMI) by sex, age and country of citizenship https://ec.europa.eu/eurostat/databrowser/view/hlth_ehis_bm1c/default/table?lang=en&category=hlth.hlth_det.hlth_bmi
NCD-RISC NATIONAL ADULT BODY-MASS INDEX https://www.ncdrisc.org/data-downloads-adiposity.html
Scottish Government 2022. Scottish Health Survey 2021 https://www.gov.scot/collections/scottish-health-survey/#2022
Appendix E: Dietary guidance development and selected food policies and strategies in Flanders
Governance of the Flanders region
Flanders is a region of Belgium. At 483 km2, it comprises less than half the land mass of Belgium, but with more than 6 million inhabitants it represents 57% of the population. Authority for many aspects of health and environmental policy are devolved to regional governments in Belgium, including Flanders, whilst fiscal policy, defence, etc are governed centrally.
FBDGs in Flanders: the Flanders Food Triangle
In Flanders, the FBDGs are captured in a 24-page consumer-facing document “Eating According to the Food Triangle: Good for Yourself and the Planet” (2021). It was developed by the Flemish Institute of Healthy Living (“Gezond Leven”), in cooperation with the Department of the Environment of the Flemish Government. The stated aims of the document are to draw from the latest science and expert advice, in order to provide concrete, achievable consumer recommendations for diets that can improve human health and that of the planet.
The context of the guidance emphasises that the environmental impact of our food is currently greater than what our planet can bear, so dietary change is needed. A graph (Figure 13.1) ranks foods according to their environmental impact, such that citizens are advised to eat more of the foods at the top (legumes, tofu, wheat and rye, potatoes, root vegetables and nuts), and less of the foods at the bottom (lamb, beef, pork, cheese and milk). It also emphasises that consumer choices and habits are strongly influenced by the food environment. Consequently, it argues a multi-stakeholder effort is needed to make healthy, climate-friendly diet choices the most obvious and appealing options for consumers.

In terms of content, the Food Triangle is offered as the basis for a healthy and environmentally responsible diet. It is underpinned by 3 principles: (i) eat proportionately more plant-based food than animal-based food (due to the former generally having lower environmental impact than the latter); (ii) eat and drink as few nutrient poor foods as possible (because every food production step adds an environmental burden, hence our foods need to ‘count’ more); (iii) avoid food waste and moderate your consumption (because every food item that is wasted is an environmental impact that could have been avoided).
The guidance offers specific advice for each of the food groups in the Triangle, which includes quantified amounts for each category, with continued reference/justification to environmental impact. Discretionary foods (foods high in fat, salt and sugar) are separated from the triangle as non-essential to the diet, and this category also includes processed meat.
The Flanders FBDGs emphasises gradual change, not radical shifts: “balance is key: take care of yourself and the planet, but don’t forget to enjoy yourself.” It also recommends up to three or four days per week of meat-free meals. Links are offered to relevant support materials, developed by Gezond Leven, such as recipes for vegetarian meals and a seasonal buying guide for fruit and vegetables.
The guidance offers detailed and nuanced advice about the environmental impacts of different types of production system, and of transportation. For example, it cautions against assumptions that locally sourced food is automatically lower carbon. The guidance also advises on processed meat substitutes, for example, by recommending substitutes like tofu and tempeh, which are less processed than alternatives. It also gives specific advice about nutritional contents to look for in milk and dairy substitutes.
How the FBDGs were developed
Gezond Leven was the lead partner developing the guidance. It is an independent agency working under contract to the Flanders Government, responsible for public health promotion. The other key partner was the Department of the Environment and Spatial Development. The steps of the development process are depicted in Figure 13.2, and can be summarised as follows. The process began with a commissioned review of the scientific literature on the health and environmental impacts of dietary choices. Next, a cross-disciplinary expert panel of academics was convened, to help analyse the evidence and determine the core content of the final guidance, including the visual model. This step also involved development of the underpinning reasoning for the guidance, based on a strong scientific foundation. After this, public-facing messaging was designed and tested amongst citizens. Only after the guidance was finalized were stakeholders consulted on matters related to coordination and implementation of the guidance. Stakeholders did not influence or change the substance of the guidance.

The primacy of science in the development process, and the exclusion of stakeholders from the core development, was a deliberate decision by Gezond Leven. It was based on its first experience of designing climate-focused guidance in 2017, where stakeholders were included in the development process, and less time was spent establishing the scientific underpinning. Gezond Leven received criticisms from stakeholders and the media that the ensuing guidance was biased and lacking in scientific evidence. This led to the ‘science first’ approach for the 2021 guidance.
A co-benefit of developing a solid science base for the current guidance has been the creation of a background document, which explains clearly the reasoning for the integration of climate aspects. This helps Gezond Leven, and the Department of the Environment, to keep the momentum in policy actions which might otherwise be delayed or distracted, with regressive ‘why are we doing this?’ questions.
Policies, strategies and actions related to the FBDGs
The Flemish FBDGs, ‘Eating according to the food triangle: good for yourself and the planet’[43] do not exist in isolation but sit alongside several other food and/or climate-related government strategies and policies.
For example, the ‘Strategic Plan: Fleming Lives Healthier in 2025’ was published in 2018. This acknowledges multiple influences upon human health but makes explicit reference to nutrition and food and the importance of enabling healthy choices, plus monitoring dietary patterns. Similarly, the ‘The Flemish Climate Policy Plan’ commits to reducing agricultural emissions and acknowledges the role of diets and local production patterns in achieving this but notes the challenge of doing so against a backdrop of rising agricultural emissions.[44] Reducing food waste is also addressed in the ‘Action Plan Circular Food Loss and Biomass (Residual) Flows 2021-2025’.[45]
More particularly, the 2019-2024 Flemish Coalition Agreement included a commitment to create a strong food policy. This led to the Department of Agriculture and Fisheries publishing ‘Go4Food: A Flanders Food Strategy for Tomorrow’ in 2020 (subsequently updated).[46]
The Food Strategy explicitly recognises the importance of a healthy and environmentally responsible diet but highlights the need for an inclusive system-wide approach considering the interests of different groups of food consumers and producers. Moreover, the Strategy is acknowledged to exist alongside international (e.g. EU), national (i.e. Belgian) and municipal (e.g. city authorities) food strategies.

As shown in Figure 13.3 above, Go4Food presents four strategic pillars linked to 19 strategic objectives. The objectives include explicit reference to healthy and sustainable diets (SO1, SO2) and environmental sustainability (SO6 and SO7), plus more specific topics such as a circular economy (SO5), minimising food waste (SO8) and more sustainable protein production and consumption (SO9). In turn, these are linked to 11 ‘Food Deal’ ambitions, around which cross-cutting actions are encouraged to coalesce, supported by funding (albeit not yet specified).
The Strategy does not itself describe detailed policy measures but does list various possible policy. For example, public communications, education and training, research and development, voluntary agreements with private supply-chains, and financial incentives and regulatory controls.
A number of ‘food projects’ and ‘food deals’ with stakeholders have been initiated under the Strategy. However, no specific ring-fenced funding is attached to the Strategy, with budget allocations needing to be sought on an individual basis across multiple Departmental boundaries (and/or leverage private sector funding) and apparently encountering some political and administrative resistance (pers. comm).
One area in receipt of funding is protein production, reflecting the relative importance attached to the ‘Flemish Protein Strategy 2021-2030’ published in 2021.[47] The Protein Strategy represents an evolution from similar, earlier strategies to increase the volume and range of domestically produced protein (to reduce reliance on imports, particularly where imports are deemed to be produced unsustainably).
In particular, there is an emphasis on growing additional plant protein for animal feed but also for domestic human consumption, with explicit recognition that this links to dietary change (novel protein sources such as insects and lab-grown cultures are also included). No specific targets are stated for reducing animal protein consumption, but health and climate advantages are noted.
A possible reason for specific funding being made available for the Protein Strategy may be that it aligns with EU-level ambitions to increase self-sufficiency in plant proteins. Such ambitions have recently been reinforced by the European parliament but were already stated to some degree in the EU’s Green Deal and the Farm-to-Fork Strategy, and have been translated into explicit funding commitments in the Flanders CAP Strategic Plan.[48] Consequently, ring-fenced EU funding is available for increased on-farm production of plant proteins (e.g. in the form of specific public payments per hectare of crop grown). This has perhaps also made it easier to secure additional (if more modest) funding for product development and processing facilities (pers. comm.).
Ring-fenced funding under the Flanders CAP Strategic Plan is also available to increase the area of organic agriculture, and to increase the area of fruit and vegetables (not just protein crops) grown. Moreover, additional capital grant assistance is available for Producer Organizations (e.g. coops) wishing to invest in infrastructure or equipment for fruit and vegetable production. Such measures may increase the availability of locally produced food. Again, such measures align with EU-level ambitions, but it is notable that Flanders’ use of them is higher than in other Member States (including elsewhere in Belgium).[49]
Appendix F: Dietary guidance development and selected food policies and strategies in the Netherlands
Background to the Wheel of Five and Seven Steps to Sustainability
In the Netherlands, climate-focused dietary guidance is captured in the “Eating more sustainably: fact sheet” (2022), which accompanies the “Wheel of Five” main dietary guidance, both produced by the Netherlands Nutrition Centre (NNC). The former is a 10-page document targeted at professionals/policymakers. The stated aims are to set out the case for environmentally sustainable diets, and how the Dutch diet should change to be in line with science-based planetary health recommendations.
In terms of context/framing, the document begins by conveying the environmental impacts of food production and consumption, and the urgent need for change. It states that the current Dutch diet is not sustainable (“the environmental footprint of the average Dutch diet is almost twice as large as the available area on the planet, per person, for food production”, p2) because the Dutch population (i) consumes too much animal products (ii) wastes huge amounts of food (iii) consumes more energy than is recommended.
The document then refers explicitly to the Dutch “Wheel of Five” model (Figure 15.1), which depicts the proportions in which different food groups are recommended to feature in the diet (vegetables and fruit; spreading and cooking fats; dairy, nuts, fish, legumes, meat and eggs; bread, grain/cereal products and potatoes; drinks). In the model, discretionary foods (high in fat, salt and sugar) are classed as ‘outside’ the model and non-essential to diet. The document states that shifting from the current diet to the Wheel of Five is good for health and climate.

Finally, the document gives specific advice within food groups, about the most sustainable options to choose, and sums these up in ‘7 steps to a more sustainable diet’. These are: eat less meat (opt more often for pulses, nuts or eggs); waste as little as possible (buy and cook what you need); eat recommended amounts (moderate your snacks and sweets); drink mostly tap water; eat enough dairy and cheese (but within bounds); buy seasonally (and check product origins); choose premium sustainability labels.
Overall, there are three eye-catching features of the Dutch FBDGs. First, the dairy intake recommendations are to “eat sufficient dairy to avoid chronic diseases but not more than that”. Second, there is detailed and nuanced advice about meat. The guidance recommends clearly that eating less meat and dairy reduces the impact on the environment, however it explains that eating a small amount of meat (around once per week), requires less agricultural land than a totally meat-free diet. This is because animals can convert some inedible plants into edible proteins. Thus, the guidance advises that animal products have their place in a sustainable diet, but intake levels need to be less than current consumption. Finally, the guidance places emphasis on making diets more sustainable by choosing better options within food categories, by way of eco-labels, and in particular, from a defined set of ‘reliable’ eco-labels. This set has been compiled by the Dutch government to help address consumer confusion over labels, so they can choose with confidence.
Background to the FBDG development process
Two agencies led the development of the Dutch FBDGs. These were the National Institute for Public Health and the Environment (NIPHE), a research centre which collects and analyses scientific evidence and conducts data modelling, and the Netherlands Nutrition Centre (NNC), a body which translates the science into practical FBDGs for consumers and health professionals. Both are independent bodies, funded solely by the Ministries of Health and Agriculture. In 2015, the NIPHE reviewed the scientific evidence on health and climate impacts of diets, with input from academic subject experts. NIPHE used this intelligence to model dietary guidelines as close as possible to the existing Dutch diet, while meeting parameters of health, climate impact, feasibility and applicability to different target groups. Figure 15.2 shows the model constraints. For health reasons, minimum intake levels of vegetables, fruit, wholegrains, fish, legumes, nuts and dairy were specified. For climate reasons, maximum intake levels of fish, red meat, total meat, eggs and dairy products were specified. Maximum intake levels of red meat and eggs were specified also for health reasons.

The NNC used the modelled solutions to draft the public facing dietary guidance, including the graphics. A transparent consultation process followed with experts, to check for any errors/omissions in the science, and also health professionals, to advise on practical implementation.
The food industry was specifically not involved in the consultation. Only after the final guidance was completed were meetings held with industry representatives. This approach was taken to maintain both the real and perceived independence of the NIPHE and NNC. In total, the development process took several years.
At the time of writing, the Dutch Health Council are currently updating their nutritional guidance, and advances in climate science/data mean there is the opportunity for NNC to add more environmental indicators into their modelling (e.g. land and water use, pollution, and biodiversity), for the next revision. Another ambition is to set a clearer sustainability target for the FBDGs, for example, to achieve a certain percentage reduction of GHGs in the Dutch diet.
Policies, strategies and actions related to the FBDGs
Policies relevant to food in the Netherlands appear to reflect the traditional priorities of host ministries, with relatively little integration of health and climate goals. For example, the 2018 ‘National Prevention Agreement: Towards a Healthier Netherlands’ presents ambitions for healthier lifestyles by 2040 but without reference to sustainability. Similarly, the 2015 ‘National Health Policy’[50] includes goals to increase consumption of fruits and vegetables, but these are justified for health not climate reasons. Meanwhile, the 2019 ‘Climate Agreement’, which sets economy-wide emission reduction targets of 49% by 2030, contains only one brief reference to the need for change in food consumption habits (5 lines in a 247 page document).
In relation to agriculture, significant public funding has been allocated to support progress towards agricultural emission targets. This includes continuing production support measures under the CAP for organic farming, fruit and vegetable production, and protein production.[51] For example, direct support to increase the area of particular crops grown, consistent with EU-level ambitions to expand organic agriculture and reduce dependency upon imported protein crops and fruit and vegetables.[52] Dutch deployment of fruit and vegetable aid under the CAP is relatively high compared to most other Member States, although less than in Flanders.[53]
The Dutch National Protein Strategy represents a more integrative policy approach. As in Flanders, CAP funding has been used to encourage plant protein production at farm level. This is being combined with further funding made available under the National Green Fund. It also includes leverage of private sector investment, on the basis of potential market opportunities for plant (and more novel) forms of protein. The Strategy also links to broader ambitions under the earlier ‘Strategic Biomass Vision for the Netherlands towards 2030’.[54] Both Strategies acknowledge the health and climate motivations for reducing overall protein consumption by 10% to 15% whilst also decreasing the proportion of animal-based protein.
Example responses to encouragement for private funding to support the protein shift include bids for research and development, product innovations, and conversion of a meat processing plant to handle plant proteins.[55]
Actions specifically to encourage take-up of the FBDGs are led by the NNC, and it has deployed a range of communication tools, including extensive use of social media and also diet tracker apps. Other policy measures include voluntary private sector agreements to reformulate processed products[56] and reductions in advertising aimed at children. Certain municipalities have moved to ban advertising of fast food, and Haarlem is introducing a ban in outdoor advertising of meat.
In addition, reducing VAT on fruit and vegetables from the current rate of 9% to 0% has been proposed. This has, however, been delayed repeatedly because of political difficulties. A recent independent report commissioned by the government cautioned that implementation would be difficult. It also suggested that increased fruit and vegetable consumption would not be guaranteed.[57]
Appendix G: Dietary guidance development and selected food policies and strategies in Sweden
Background to “Find your way to eat greener, not too much and be active”
In Sweden, the FBDGs are captured in the 28-page consumer-facing document “Find your way to eat greener, not too much, and be active” (2015). It was developed by the Swedish Food Agency, in cooperation with the Swedish Public Health Agency, Board of Agriculture and Environmental Protection Agency. The Swedish Food Agency is an independent, government-funded body, which administers public diet and health activities, and is also charged with responsibility to achieve Swedish Government environmental targets.
The document explains that because what we eat has an impact on the environment as well as health, we need to eat more sustainably. In terms of context, it explains that one quarter of climate impact from Swedish households comes from food eaten or thrown away. Eating more sustainably means economising on Earth’s resources, to ensure there’s enough good food to eat in future. It refers to a wide range of environmental issues, including water quality, pesticide use and antibiotics in farm animals as well as climate change.
The guidance itself does not incorporate any plate or pyramid model. Instead, it structures advice around 3 sections: 1. things to eat/do more of; 2. things to switch; and 3. things to eat less of. For each of these actions, there is a dedicated page which explains the advice in more detail, including the link to environmental impact, offering specific ingredient and recipe suggestions to help make the change. There is strong emphasis on “making the changes work for you”. Figure 16.1 shows the page of guidance for red and processed meat. This includes practical advice for reducing consumption of these products, foods to swap with, dish and recipe suggestions, and advice on how to buy the most sustainable red meat.

There are three points of particular interest in the Swedish guidance. First, as Fischer and Garnett (2016) note, the guidelines are nuanced and detailed about which types of foods to choose within a category, and why those are best for the environment. For example, the guidance advises high fibre vegetables over greenhouse salad crops, due to lower GHGs in production, and better transportation. It also recommends other grains and potatoes over rice, within the cereals group, because of the high carbon impact of rice production.
Second, the advice takes a nuanced approach to the environmental impacts of animal production systems, noting that livestock can contribute to landscape and biodiversity. This leads to a mantra of a ‘less but better’ approach to meat consumption, with ‘better’ meaning organic, eco-labelled and Swedish: “If you cut back on meat, you’ll have enough money for meat produced sustainably, with attention paid to the welfare of the animals. Choose eco-labelled meats such as free range, organic or certified eco-friendly.” There is no further discussion of this advice in relation to lower income households, for example.
Background to the FBDGs development process
The origins of the current FBDGs date back to 2007/08, when the Swedish Government was motivated to act on international evidence on climate change, including from the IPCC, which recognised that food is part of the climate problem. From 2008-13, the Swedish Food Agency commissioned analysis of the environmental impacts of different foods, alongside evidence on the health effects of diet gathered from Nordic Nutrition Recommendations (NNR)[58]. The joint evidence was reviewed, in collaboration with experts from the Swedish Public Health Agency, Board of Agriculture and Environmental Protection Agency. The review was supported by a stakeholder panel.
Discussions during the review process were reportedly constructive, helped by the fact that the process was data-driven (e.g. no one could dispute that Swedes ate too much meat with the relevant statistics in front of them). Emphasis was also placed on finding points of agreement between the parties. For example, that although meat consumption should decrease, consumption of Swedish meat need not decrease, as Sweden is a net importer of meat. This led to the “less but better” messaging, which was supported by multiple stakeholders.
In 2014, a public consultation took place, including participants from industry, consumer and patient organisations, and public health professionals. From this process, the guidance was drafted and tested with consumers. The guidance was published in 2016/17, hence the whole process from initial discussions to publication took almost 10 years.
It is worth noting that since the development of this guidance, the latest revision of the Nordic Nutrition Recommendations (NNR), in 2023, has been published. The NNR is a forum and programme funded by the Nordic countries, including Sweden, to gather robust evidence on diet and nutrition. The latest revision includes explicit reference to climate impact. It therefore provides a very high standard, scientifically informed evidence base on climate-friendly diets.
Policies, strategies and actions related to the FBDGs
In Sweden, the policy landscape for sustainable diets appears fragmented. For example, the 2016 “A National Food Strategy for Sweden”, and subsequent “Action Plan” published in 2019, focus almost exclusively on supply-side measures, notably funding for farmers and technological innovation. This relies heavily upon pre-existing (ring-fenced) funding under the Common Agricultural Policy (CAP). The Strategy is justified in terms of increasing production for domestic and export markets and to increase self-sufficiency and rural employment. However, these measures are not connected to actions to stimulate domestic capacity or growth on the demand side.
In addition, the 2016 ‘Strategy for Sustainable Consumption’ contains only a brief reference to food (a short paragraph, which refers to a Government desire for country of origin labelling of meat in restaurants and canteens). Meanwhile, the 2018 “Climate Framework Policy”, which sets out the Swedish Government’s net zero targets for the whole economy, also makes no reference to food consumption or dietary change.
The gap between supply and demand side policy actions for healthy and sustainable food is also apparent in relation to organic food. The Government aims for 30% of Swedish agricultural output to be certified organic by 2030. It also aims for an increase in consumption of organic food, for 60% of public food to be certified organic by 2030. However, while direct funding has been allocated to support production, much less has been targeted at achieving the demand side ambitions.
In 2021, the Swedish Government tasked the Swedish Food Agency and Public Health Agency to propose areas of action needed for a more sustainable food system in Sweden, and indicators to measure progress[59]. The work was based on consultations with authorities, industry and civil society. The report, published 2024, emphasizes the need for joined-up policies to tackle health and climate problems: for example, Action area 3 concerns “cooperation between public and commercial actors to promote a sustainable and healthy food environment”. However, given recent shifts in politics in Sweden and hardening resistance from industry stakeholders to food system change, it may be challenging for officials to take forward many of the recommended Actions in the report.
The National Food Strategy does not provide details of specific policy measures but does list types of measures. For example, the provision of information to consumers and the role of public sector catering. However, the main focus is on support to food supply-chains to increase productivity and reduce food waste. Efforts to improve productivity include support for research and innovation, but also deployment of funding under the CAP Strategic Plan. This includes coupled support for livestock production but also funding for organic production plus a limited amount for fruit and vegetable production.[60]
A follow-up Action Plan to the National Food Strategy published in 2019[61] does list more specific policy measures and projects, accompanied by budget allocations, but again focuses almost completely on production rather than consumption. The Action Plan also sets targets for 30% of Swedish agricultural and 60% of public food consumption to be certified organic by 2030.
The general absence of specific targets and policy measures in relation to sustainable food consumption has also attracted commentary from Swedish academics.[62] Similarly, several published studies suggest that dietary change, particularly away from meat to more plant-based diets, has health as well as climate benefits.[63] However, whilst meat consumption has reduced slightly in recent years, it is acknowledged that changing consumer behaviour to achieve further reductions is challenging.[64]
Published academic studies have also commented on the general absence of specific policy measures. For example, over-reliance on public information, public sector catering and increased domestic production rather than direct regulatory controls and/or fiscal measures.[65]
It is possible that the anticipated refresh of the National Food Strategy scheduled for 2024 will address some or all of the identified policy weaknesses. However, the Board of Agriculture and its Minister are still actively promoting production-based policy approaches (pers. comm.)
© The University of Edinburgh
Prepared by Pareto Consulting on behalf of ClimateXChange, The University of Edinburgh. All rights reserved.
While every effort is made to ensure the information in this report is accurate, no legal responsibility is accepted for any errors, omissions or misleading statements. The views expressed represent those of the author(s), and do not necessarily represent those of the host institutions or funders.
e.g. see Reay (2020), Crippa et al., (2021), Agriculture and climate change – Agriculture and the environment – gov.scot (www.gov.scot). ↑
e.g. see Planetary Health | UNFCCC and The Lancet Planetary Health Home Page ↑
equality-opportunity-community-programme-government.pdf (www.gov.scot), Good Food Nation – Food and drink – gov.scot (www.gov.scot), Climate change – gov.scot (www.gov.scot) ↑
See Comrie et al, 2024, Scottish Emission Targets & Progress in reducing emissions in Scotland – 2022 Report to Parliament – Climate Change Committee (theccc.org.uk) and 2. Response to CCC Recommendations – Climate Change Committee’s (CCC) annual progress report 2022 recommendations: SG response – gov.scot (www.gov.scot) ↑
The Eatwell Guide | Food Standards Scotland ↑
The eatwell guide: A more sustainable diet | The Carbon Trust (2016); Scheelbeek et al., 2020. ↑
Springmann et al (2020) The healthiness and sustainability of national and global food based dietary guidelines: modelling study | The BMJ ↑
German guidance was updated in spring 2024, shortly before publication of this report. The consumer-facing documents now contain less reference to climate than before. However, background documents do retain a climate focus, and the guidance itself is based on optimization modelling for health, GHG emissions and land use. Hence, we have retained the German FBDGs in the ‘green’ category. ↑
For example, confectionery, sweet biscuits, savoury snacks, cakes, pastries, puddings and sugar containing soft drinks. See https://www.foodstandards.gov.scot/publications-and-research/publications/briefing-on-discretionary-foods ↑
see Australia | Food Policy Index and FoodEPI_AB_Report_WEB-FINAL.pdf (utoronto.ca), Dawkins et al (2023) ↑
Voedseltop Synthese (vlaanderen.be) ↑
The NNR is a forum and programme funded by the Nordic countries, including Sweden, to gather the latest scientific evidence on diet and nutrition. The aim is to provide a robust evidence base that national governments in the Nordics can use to inform their dietary guidance. ↑
Government Offices Sweden 2021. Sweden’s pathway for sustainable food systems. ↑
School meals will speed up the transition to a sustainable food system | Vinnova ↑
E.g. Barton et al, 2015; Barton et al, 2022; Food Standards Scotland, 2020; Comrie et al, 2024. ↑
Comrie et al, 2024. ↑
See also Appendix D. ↑
Matthews et al, 2023. ↑
e.g. Gladding et al., 2020; Andretta et al., 2021; Gržinić et al., 2023. ↑
This would be to recognise the target of the Climate Change Committee. However, how that target would apply to Scottish dietary guidance is unclear, as no intake range for dairy is currently recommended. ↑
E.g. Strid et al., 2019; Hendrie et al., 2021; Leme et al., 2021; Yin et al., 2023. ↑
Matthews et al, 2023. ↑
Garnett et al., 2015. ↑
https://mijn.voedingscentrum.nl/nl/eetmeter/ ↑
Roos et al, 2021; Matthews et al, 2023. ↑
Bailey and Ross Harper, 2015. ↑
Roos et al, 2021. ↑
Roos et al, 2021; Burgaz et al, 2023. ↑
Matthews et al, 2023. ↑
Scarborough et al 2020 cited by Burgaz et al 2023 ↑
e.g. Purnell et al., 2014; Vermeir et al., 2020; Eluwa et al., 2023 ↑
See United Kingdom Internal Market Act 2020 (legislation.gov.uk) and Subsidy Control Act 2022 (legislation.gov.uk) ↑
Roos et al, 2021 ↑
Healthy Eating in Schools: guidance 2020 (www.gov.scot) ↑
Sustainable Scotland Network – Public Bodies Climate Change Reporting 2021/22: Analysis Report ↑
Burgaz et al, 2023; Bailey and Ross Harper, 2015 ↑
Matthews et al 2023. ↑
For example, processors and retailers are progressing faster on adding climate-related criteria to their quality labels than sector-wide Quality Assurance or PGI schemes. The resulting fragmentation may not help consumers to make informed choices about climate-friendly options. ↑
https://www.ruralpayments.org/topics/agricultural-reform-programme/arp-route-map/ and https://www.gov.scot/publications/climate-change-action-policy-package/ ↑
e.g. see https://www.youtube.com/watch?v=LrmbyMaxZhk and https://www.youtube.com/watch?v=KJ-2NjQC1ag ↑
Tables adapted from style deployed in supplementary material presented by James-Martin et al. (2022). Where recourse has been made to machine translation via Google Translate and DeepL, the accuracy of terminology and titles in English may be imperfect. ↑
However, the FAO suggests Ministry of Health, the Austrian Agency for Health and Food Safety, the National Nutrition Commission and the Austrian Nutrition Society; Ministry for Labour, Social Affairs, Health and Consumer Protection ↑
Food-triangle-EN.pdf (gezondleven.be) ↑
https://publicaties.vlaanderen.be/view-file/13458, be_final_necp_parta_en_0.pdf (europa.eu) and be_final_necp_partb_en_0.pdf (europa.eu) ↑
210706 English version VR 2021 0204 DOC. Actieplan voedselverlies en biomassa 2021-2025 EN (oneplanetnetwork.org) ↑
Go4Food, A Flanders food strategy for tomorrow. Synthesis | Vlaanderen.be ↑
Vlaamse Eiwitstrategie 2021-2030 (oneplanetnetwork.org) ↑
EU protein strategy (europa.eu), REPORT European protein strategy | A9-0281/2023 | European Parliament (europa.eu), The Commission approves the CAP Strategic Plans of Belgium – European Commission (europa.eu), 16925dca-08d0-4592-8c87-202d12ec8bcd_en (europa.eu) ↑
7b3a0485-c335-4e1b-a53a-9fe3733ca48f_en (europa.eu) (Fig 30), Organic action plan – European Commission (europa.eu), Fruit and vegetables – European Commission (europa.eu). Organic and fruit & vegetable support has been and remains available in Scotland under the CAP, albeit with more modest funding. ↑
https://extranet.who.int/nutrition/gina/sites/default/filesstore/NLD%202015%20National%20Health%20Policy%20Note.pdf ↑
Including for organic production and fruit and vegetable production Microsoft Word – 20220209_Nederlands NSP GLB – versie 1.0 (overheid.nl) ↑
Organic action plan – European Commission (europa.eu), Fruit and vegetables – European Commission (europa.eu) , EU protein strategy (europa.eu), REPORT European protein strategy | A9-0281/2023 | European Parliament (europa.eu) ↑
7b3a0485-c335-4e1b-a53a-9fe3733ca48f_en (europa.eu) (Fig 30) ↑
92465_visie_biomassa_engels_def.pdf (europa.eu) ↑
Five major players launch masterplan for protein transition as economic engine in The Netherlands – WUR, The ‘master plan’ to double legume consumption in the Netherlands by 2030 (foodnavigator.com) , Test resolution 4K magazine design (investinholland.com) , ‘ME-AT the alternative’ launches first locally grown protein chain – Vion Food Group ↑
https://www.rivm.nl/publicaties/nieuwe-criteria-voor-productverbetering ↑
https://www.seo.nl/wp-content/uploads/2023/03/2023-32-btw-nultarief-eindrapport.pdf https://www.seo.nl/wp-content/uploads/2023/03/2023-32-btw-nultarief-eindrapport.pdf ↑
The NNR is a forum and programme funded by the Nordic countries, including Sweden, to gather the latest scientific evidence on diet and nutrition. The aim is to provide a robust evidence base that national governments in the Nordics can use to inform their dietary guidance. ↑
Government Office Sweden 2021. Sweden’s pathway for sustainable food systems. ↑
7b3a0485-c335-4e1b-a53a-9fe3733ca48f_en (europa.eu) ↑
The Government’s action plan part 2: A food strategy for Sweden – more jobs and sustainable growth throughout the country – Regeringen.se ↑
e.g. sei-wp-climate-food-transport-gong-2205a.pdf ↑
e.g. Less meat, more legumes: prospects and challenges in the transition toward sustainable diets in Sweden | Renewable Agriculture and Food Systems | Cambridge Core , Sustainability benefits of transitioning from current diets to plant-based alternatives or whole-food diets in Sweden | Nature Communications and Food Dishes for Sustainable Development: A Swedish Food Retail Perspective – PMC (nih.gov) ↑
e.g. Identifying barriers to decreasing meat consumption and increasing acceptance of meat substitutes among Swedish consumers – ScienceDirect, Livsmedelskonsumtion av animalier. Preliminära uppgifter 2020 – Jordbruksverket.se ↑
Dawkins et al. (2023) and 2023. Policy for sustainable consumptionan assessment of Swedish municipalities. Frontiers in Sustainability, 4, p.1265733. and Policy-Options-for-Sustainable-Food-Consumption-2021-Mistra-Sustainable-Consumption-report-1.pdf (sustainableconsumption.se) ↑
There is a need to decarbonise heating sources to reduce greenhouse gas emissions. Switching from fossil fuel-based technology, such as gas and oil, to low-carbon electricity is a significant step in this process.
To achieve Scotland’s emissions reduction targets, the number of zero direct emissions heating systems (ZDEH) installed, such as heat pumps, needs to increase.
Social landlords have begun taking steps to improve the energy efficiency of the homes they rent out and to meet standards set by the Scottish Government, such as the second milestone of the Energy Efficiency Standard for Social Housing (EESSH2). In recent years, their work has included a rising number of ZDEH projects.
This research has developed a series of case studies to support social landlords in their delivery of future ZDEH projects.
The learnings from this report and the associated case studies seek to encourage social landlords to deliver more decarbonisation projects, and support the delivery of Scottish Government’s net zero targets.
Lessons for future social housing heating projects
Some lessons for social landlords:
- Tenant engagement: Consider a mixed-method approach to engage and support a range of residents, such as face-to-face events, ongoing support and opportunities to see and use the technology in-situ.
- Impact evaluation: This should be planned from the outset of the project to truly understand the impact of the project on tenants, its success in achieving its aims and how it might be improved for next time. The methodology should provide a before and after picture, and include temperature and humidity assessments, energy consumption data and EPC data.
- Multiple buildings: In projects involving large or multiple buildings, delivering at least one building as a pilot helps identify and address any challenges. Rolling the installations out in one building helps to reduce disruption and focus tenant support.
- Project management and costs: If you plan to procure a project manager, involving them from the outset means that they can support with application writing. It should be noted that there may be a cost to this, which should be taken into account. Consider aspects such as planning permission requirements, meter changes and electricity grid upgrades at an early stage to avoid unexpected costs.
For further details, please read the report and/or see the case studies.
If you require the report in an alternative format, such as a Word document, please contact info@climatexchange.org.uk or 0131 651 4783.
Video summary of the lessons learned
Research completed: February 2024
DOI: http://dx.doi.org/10.7488/era/4549
Executive summary
There is a need to decarbonise our heating sources to reduce greenhouse gas emissions. Switching from fossil fuel-based technology, such as gas and oil, to low-carbon electricity is a significant step in this process.
To achieve Scotland’s emissions reduction targets, the number of zero direct emissions heating systems (ZDEH) installed, such as heat pumps, needs to increase.
Social landlords have begun taking steps to improve the energy efficiency of the homes they rent out and to meet standards set by the Scottish Government, such as the second milestone of the Energy Efficiency Standard for Social Housing (EESSH2). In recent years, their work has included a rising number of ZDEH projects.
Aims
This research has developed a series of case studies to support social landlords in their delivery of future ZDEH projects. The learnings from this report and the associated case studies seek to encourage social landlords to deliver more decarbonisation projects, and support the delivery of Scottish Government’s net zero targets.
Findings
The findings may not be fully representative as they only relate to eight case studies.
The majority of the case studies installed air source heat pumps. Most social landlords were confident in writing funding applications.
- Engaging with tenants throughout the project is important to delivery, and seeing the new heating system in person can increase tenant confidence.
- Delivering at least one building as a pilot helps identify and address any challenges. This engagement needs to continue after the installation as new heating systems may not be intuitive to use and require behaviour change; supporting tenants with this is important in achieving tenant satisfaction.
- Key considerations to project planning were overlooked by some landlords, resulting in challenges, delays and/or unforeseen costs. These included: unexpected costs in relation to gas meter removals, changes to the built environment required for planning permission and upgrades to the electricity grid required for solar panels.
- All of the case studies aimed to increase affordability for residents. However, the energy crisis has made impact on affordability difficult to assess. Energy Performance Certificate (EPC) ratings improved across all projects, with the majority of properties achieving an EPC B or C rating post-installation[1]. Overall, there was limited data to quantify the impact of the new heating systems, but landlords reported that anecdotally tenants feel positive about their new heating system.
Lessons for future social housing heating projects
Some lessons for social landlords:
- Tenant engagement: Consider a mixed-method approach to engage and support a range of residents, such as face-to-face events, ongoing support and opportunities to see and use the technology in-situ.
- Impact evaluation: This should be planned from the outset of the project to truly understand the impact of the project on tenants, its success in achieving its aims and how it might be improved for next time. The methodology should provide a before and after picture, and include temperature and humidity assessments, energy consumption data and EPC data.
- Multiple buildings: In projects involving large or multiple buildings, delivering at least one building as a pilot helps identify and address any challenges. Rolling the installations out in one building helps to reduce disruption and focus tenant support.
- Project management and costs: If you plan to procure a project manager, involving them from the outset means that they can support with application writing. It should be noted that there may be a cost to this, which should be taken into account. Consider aspects such as planning permission requirements, meter changes and electricity grid upgrades at an early stage to avoid unexpected costs.
Glossary / Abbreviations table
|
ABS |
Area Based Schemes |
|
EESSH |
Energy Efficiency Standard for Social Housing. When the EESSH was introduced in March 2014 it set a first milestone for social landlords to meet for social rented homes by 31 December 2020. A second milestone (EESSH2) was confirmed in June 2019, for social rented houses to meet by December 2032. |
|
EPC |
Energy Performance Certificate |
|
Housing Revenue Account |
A ring-fenced account which is separate from the council’s General Fund. The account is for income and expenditure relating to the management and maintenance of the council’s housing stock |
|
LCITP |
Low Carbon Infrastructure Transition Programme |
|
SHNZHF |
Social Housing Net Zero Heat Fund |
|
ZDEH |
Zero Direct Emissions Heating |
Introduction
Importance of decarbonisation
Greenhouse gas emissions from Scotland’s homes account for 13% of the total emissions in Scotland. The Heat in Buildings Strategy sets out the Scottish Government’s commitments both to decarbonise heating and to remove poor energy efficiency as a driver of fuel poverty.
In Scotland, 23% of domestic dwellings are social housing. The social housing sector has shown strong leadership on improving fabric energy efficiency, with the aim of supporting tenants to reduce their energy bills and contributing to carbon savings. However, to achieve net zero targets, the installation of zero direct emissions heating systems (ZDEH) such as heat pumps, is also needed.
Research aims
The research reviewed case studies to assist landlords in their planning for meeting the standard that will replace EESSH2.[2] The case studies show how various measures, including a change in the heating system, can improve the energy efficiency of their dwellings.
The learnings identified in this report and the associated case studies seek to:
- Encourage social landlords across Scotland to deliver more decarbonisation projects in their housing stock;
- Improve delivery of domestic decarbonisation projects, especially in the social housing sector, by building on existing learnings and solutions;
- Support the delivery of the Scottish Government’s net zero targets.
Method overview
Local Authorities and Housing Associations were approached in equal measure to provide case studies. However, in the research time available, only one Local Authority was able to commit. Furthermore, while many council-led decarbonisation projects exist many of them were out of scope of this research, either due to their focus on new build homes or because the projects were not yet complete. Additionally, some councils no longer have social housing.
Therefore, the higher ratio of Housing Associations to Local Authorities in this report should not be taken as evidence of a greater or lesser willingness to participate in decarbonisation projects from parts of the sector. Lessons are relevant across all social landlords.
The methodology is summaries in figure 1.
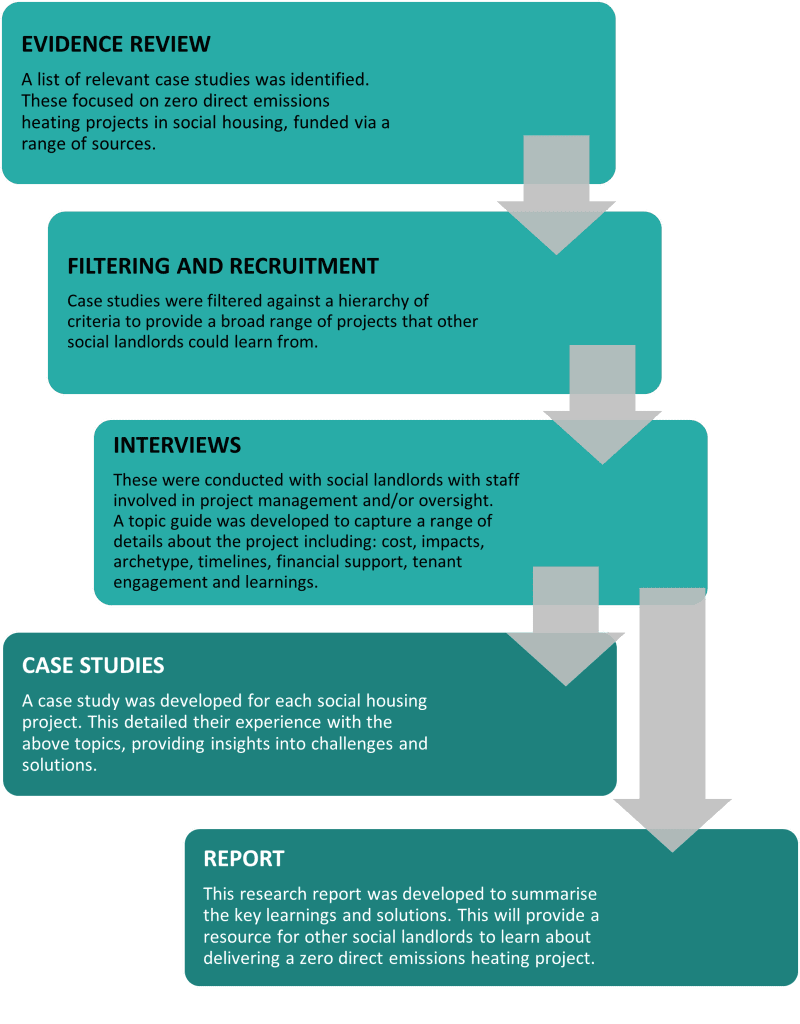
Overview of case studies
Eight case studies were selected from a range of social housing projects across Scotland:
- Angus Housing Association ‘Kirkbank Renewable Heat Project’ delivered 32 air source heat pumps in a mix of private and social rented housing to replace inefficient storage heaters. Solar photovoltaic (PV) panels and electricity storage batteries were also installed. The project took place between 2018 and 2022.
- Grampian Housing Association ‘Mackenzie Gardens’ Zero Emission Heating Project’ installed three commercial air source heat pumps, creating a heat network servicing 17 flats and three terraced houses. The project took place between 2021 and 2023.
- Hebridean Housing Partnership ‘Hebridean Heat Pumps Project’ installed air source heat pumps in a wide range of archetypes across 102 of their social rented properties. For three householders, this replaced solid fuel heat sources. The project took place between 2022 and 2023.
- Maryhill Housing Association ‘North-west Glasgow Replacement Heating Project’ installed 266 air source heat pumps into 11 seven-storey housing blocks. Their aim was to contribute towards their net zero targets whilst offering tenants a more affordable alternative to the existing electric storage heaters. The project took place between 2018 and 2021.
- North Lanarkshire Council ‘Lorne Gardens Air Source Heat Pumps Project’ installed air source heat pumps in 20 properties in a retirement housing complex. This also included cavity wall insulation for some of the properties. The project took place in 2021.
- Osprey Housing ‘Moray and Aberdeenshire Heat Pumps 2021 Project’ installed air source heat pumps in 61 properties, accounting for 20% of their off-gas housing stock. This was to provide a cost-effective alternative to the electric storage heating that had been used in the properties previously. The project took place between 2020 and 2022.
- Queens Cross Housing Association ‘Regeneration of Cedar Multistorey Flats in Woodside Project’ delivered a number of retrofit upgrades to a newly acquired tower block. This included an electric wet central heating system as their new form of zero direct emissions heating. Options appraisals began in 2012, with project delivery taking place between 2016 and 2023.
- Rural Stirling Housing Association ‘Old Kirk Loan and Craigmore View Heat Replacement Programme’ replaced older storage heaters with air source heat pumps in 40 properties, alongside installing solar PV panels and electricity storage batteries. This was to ensure that the properties met the requirements of EESSH2. The project took place between 2021 and 2022.
About this report
This report provides an overview of the above case studies. It gives social landlords a summary of the key challenges and successes experienced and draws lessons for future projects. The report should not be viewed as a comprehensive piece of research into the experiences of social landlords in delivering zero direct emissions heating projects, as it does not include sufficient numbers of projects to draw any wider conclusions.
Context
Scottish decarbonisation targets and policies
Heat in Buildings Bill and Strategy
The Scottish Government is currently consulting on a Heat in Buildings Bill with proposals on legislation covering energy efficiency standards and heating system requirements. This bill follows on from the 2019 Heat in Buildings Strategy, which outlines how Scotland will reduce greenhouse gas emissions from buildings and remove poor energy performance as a driver of fuel poverty. Since homes and buildings account for a significant portion of Scotland’s greenhouse gas emissions, the Bill is important in achieving Scotland’s statutory emissions target of net zero greenhouse gas emissions by 2045. The Bill will provide a regulatory framework that will drive the development of heat networks, the adoption of zero emission heating systems, and improved standards of energy efficiency.
The Heat in Buildings Strategy sets out the changes required to ensure Scotland’s buildings no longer contribute to climate change. As part of the support package to deliver the strategy, the Scottish Government has committed to invest £1.8 billion in heat and energy efficiency over the lifetime of the parliament. This includes the £200 million allocated to projects through the Social Housing Net Zero Heat Fund.
Energy efficiency standards for social housing
As part of the Heat in Buildings Strategy, the Scottish Government has established targets to improve the energy efficiency of social housing. The purpose of the standard is to encourage landlords to improve the energy efficiency of social housing in Scotland.
EESSH was originally introduced in 2014 and set an initial target for social landlords to meet by the end of 2020. This meant that no eligible social property in Scotland was to be lower than EPC band C or D by the end of 2020.
EESSH2 was established in 2019. It specified that all social housing must meet EPC band B, or be as energy efficient as practicably possible, by the end of December 2032. It also stated that no social housing below EPC band D should be re-let from December 2025, subject to temporary specified exemptions. At the time of writing, EESSH2 has been under review to realign the standard with net zero targets, and the 2032 milestone has been put on hold.
In November 2023, the Scottish Government launched a consultation on a new Social Housing Net Zero Standard, which will replace EESSH2. The proposed new standard includes a minimum fabric efficiency rating and would introduce a requirement to replace polluting heating systems with clean alternatives by 2045. Energy efficiency target ranges and interim target years have been proposed but are yet to be decided.
EPC reform
Improving energy efficiency is an important aspect of the Scottish Government’s decarbonisation and fuel poverty strategies, and EPCs are the most widely used tool for assessing the energy efficiency of properties. A number of issues with the current EPC methodology have been raised in recent years. These include that the current main metric is a cost efficiency rating which does not adequately incentivise the building and heating system improvements necessary to meet net zero targets.[3]
As set out in the Heat in Buildings Strategy, the Scottish Government is progressing work on the reform of EPCs.[4] A consultation on this topic closed in October 2023. The reform proposes to introduce new metrics that, among other things, separate out fabric efficiency and cost, and carbon emissions. The Government is also exploring options for the inclusion of energy use data to make EPCs more accurate and consistent (research by Changeworks, forthcoming). The reform will impact how buildings are assessed to ensure that they comply with Scottish regulations.
Retrofit programmes for social housing
This is a list of current and closed retrofit programmes for social housing and how the funds operate. Most of the case studies accessed one of these funding streams.
Social Housing Net Zero Heat Fund
The Social Housing Net Zero Heat Fund (SHNZHF) is an ongoing Scottish Government programme that supports the decarbonisation of social housing in Scotland. Funding is given to social landlords to install energy efficient zero emissions heating systems in their housing stock. The fund has £200 million available up to 2026.[5]
Low Carbon Infrastructure Transition Programme (Closed 2020)
The Low Carbon Infrastructure Transition Programme (LCITP) was a partnership between the Scottish Government and a range of other enterprise organisations and experts. The aim was to support Scotland’s transition to a low-carbon economy. This involved providing financial support to assist the development and delivery of low-carbon projects. The focus was to assist projects that would secure public and private finance to demonstrate innovative low carbon technology in Scotland. As part of this, financial support was made available to some social landlords delivering zero direct emissions heating projects.[6]
Area Based Schemes
The Area Based Schemes (ABS)[7] is a programme developed by the Scottish Government. It provides grant funding to local authorities to develop and deliver energy efficiency programmes, including measures such as insulation, solar PV and batteries, and air source heat pumps: “This funding is blended with owner’s contributions and funding from Registered Social Landlords who may choose to insulate their homes at the same time”.[8]
Scotland’s Heat Network Fund
Launched in 2022, Scotland’s Heat Network Fund makes £300 million available to applicants from the public and private sector to support the roll-out of large-scale heat networks in Scotland.[9] The Heat Network Support Unit (HNSU)[10] supports pre-capital stages of heat network development.
Other financing options/models
See section 11.2 for other previous funding that shaped the retrofit project landscape over the past 10 years.
Case study aims and motivations
Scotland’s buildings need to decarbonise. The case studies examined in this research demonstrate a range of approaches to how this can be achieved. They also display the many different motivations that underpin the choice to take action on specific buildings.
One of the key priorities present throughout all of the case studies was increasing affordability for residents. In six of the eight case studies, the previous heating system was electric storage heaters, which are known to be both expensive in their operation and can make it difficult to maintain a comfortable temperature. Complaints from residents about high energy costs motivated several of the social landlords to install new heating systems. Two of the landlords had carried out surveys which found that many tenants were unhappy with their existing heating systems.
One housing association noted that in moving from storage heaters, which are controlled room by room, to a central heating system would provide greater comfort for residents.
The decision to install air source heat pumps also related to regulatory requirements for housing associations. While both EESSH2 and EPCs are undergoing review and reform (see sections 4.1.2 and 4.1.3), many social landlords have begun the work needed to bring their housing stock to EPC band B.
For some, the presence of funding was a motivating factor which aligned with other priorities. As one social landlord expressed:
“We had access to funding, it was the right thing to do for the tenants and for the EESSH targets.”
Hebridean Housing Partnership, who have been installing heat pumps in their properties since 2011, described their main driver as “getting ahead of the curve” and making the most of the available funding to install as many heat pumps as possible.
Wider organisation-established goals related to net zero and decarbonisation also factored in, though generally not as highly as the other priorities. One Housing Association, whose project was the only case study that changed the heating systems from gas central heating, did so as part of their goal of being net zero, and they had a clear strategy:
“We wanted to get tenants on board with the idea of decarbonisation. We wanted it to be a positive experience that we could then sell to the rest of our tenants, because that’s the journey we’re on – [we have] committed to being net zero by 2035.”
Their priority was to demonstrate that switching to electric heating does not have to impact people financially, and thus set a positive example which would help deliver more projects in the future.
Overall, the social landlords expressed an awareness and concern for their tenants’ limited income, and some said that this is holding them back from switching on-gas properties to zero direct emissions heating systems.
Key findings: Project planning
Funding and project costs
Six of the eight social landlords we spoke to had received funding from the Social Housing Net Zero Heat Fund (SHNZHF) or the Low Carbon Infrastructure Transition Programme (LCITP). Two social landlords had not applied for Scottish Government funding. One of these was Queen’s Cross Housing Association, who had their project funded through a second stage stock transfer, and whose project began before Government funding became available in 2015. The other, North Lanarkshire Council, found there was no specific retrofit funding available for local authorities when they started the project in 2021, before the launch of the SHNZHF. Instead, their project was funded from their Housing Revenue Account.
Applications
Many found that the process of applying for funding was straightforward, and they were confident that they could do this themselves. Several social landlords found that a key to success was to demonstrate a robust tenant engagement strategy and to focus on the benefits for the householders. As one housing association representative said:
“I have found that Scottish Government are quite good at caring more about what the project is trying to achieve, than focusing too much on the language.”
To help develop their applications, one social landlord consulted with specialists to get figures for expected carbon savings. Another social landlord explained that they considered the application complex and found it useful to partner with a consultant. One social landlord, who used a consultant to write their proposal, has since found that some contractors are willing to include consultancy and application writing in the contract.
One social landlord found that the wait time to get funding confirmation was too long. Despite being ready to go ahead with installations in April, the funding was not confirmed until August of the same year. This caused delays in the timeline that had already been agreed with the contractor.
Internal staff costs
When speaking to the social landlords, we found that most did not consider internal staff costs as a part of the total project cost. When considering the full cost of retrofit, landlords may wish to consider the time and cost not directly related to installation of measures, such as applications, tenant engagement and support provided by their own staff. In the absence of this information, it makes it difficult to get a sense of the full cost of this work and how it varies across the projects.
Key findings
- Most social landlords felt confident about writing the funding applications.
- Some social landlords found it helpful to have a third party involved in writing the funding application or in calculating anticipated carbon savings.
- Staff costs related to tenant engagement were typically considered outside of the project costs and therefore their relative contribution was difficult to quantify.
Heating system considerations
6 domestic air source heat pumps | 1 commercial air source heat pump network | 1 electric wet central heating system |
Several factors influenced which Zero Direct Emissions Heating (ZDEH) system was chosen for the projects. These factors included:
- The type, condition, and location of the properties
- The available funding
- The priorities for the landlord
Air source heat pumps were the most common heating system choice across the case studies. In seven of the eight case studies, most properties had electric storage heating prior to the project installations.
Two projects included some properties using solid fuel, and one project switched the heating system away from gas central heating.
Comparing heat pumps and electric storage heaters
Both air source heat pumps and electric storage heaters fall under the category of Zero Direct Emissions Heating (ZDEH) systems since both run on electricity. Electricity is a less carbon intensive fuel type compared to other heating fuels (e.g. gas and oil). However, the efficiency of an air source heat pump is higher since it uses the latent heat energy in the air outside, resulting in more heat per unit of energy inputted.
Cost and affordability
Cost was a key factor across the case studies. Three of the social landlords considered ground source heat pumps, but the high cost of this solution led them to choose air source heat pumps instead. In one of these cases, there were also limitations related to the composition of the soil and the distance between the buildings, which made ground source heat pumps and district heating nonviable.
Air source heat pumps were preferred in most of the case studies as a more affordable and energy efficient heating solution. Though heat pumps are more expensive to install than electric storage heaters, they are cheaper to run for residents due to higher efficiency, resulting in higher EPC ratings (see Box 1). They are also an increasingly common and well-understood heating system and meet the SHNZHF criteria of having the potential to deliver a significant reduction in greenhouse gas emissions.
One project, delivered by Grampian Housing Association, installed three commercial air source heat pumps to supply 20 properties via a heat network. The key motivation was to increase efficiency and reduce heating costs for the residents. This was further achieved by also installing solar PV and battery storage.
One case study did not install a heat pump-based system. Air source heat pumps had been a desired option but there were not funds available for this after carrying out the prioritised fabric-first upgrades. Government funding was not available at the time to subsidise the measures, therefore electric wet central heating was chosen as a cheaper alternative.
Supply chain
Of the eight case studies, most of the social landlords did not highlight issues relating to the supply chain, however there were two exceptions to this. These landlords reported project delays due to material shortages and noted that many contractors at the time were struggling with supplies of heat pumps.
Maintenance and repairs
Two of the eight case studies referenced maintenance and repairs as a consideration in their choice of technology. They expressed concerns that eventual repairs of the air source heat pumps might be more expensive than the previous gas boilers and electric storage heaters. One social landlord explained that some of their concerns had been realised when some of their air source heat pumps began to develop faults. As a whole-house heating system, rather than a room heater as previously installed (with storage heaters), this was more expensive and challenging to deal with. In one case, a resident had to be relocated for three weeks while their heat pump was replaced.
The same landlord said that they also had worries regarding:
- Availability of organisations offering maintenance services due to the rurality of their area.
- Tenants’ understanding of air source heat pump controls, which it was felt could lead to a higher instance of faults and repairs required.
Planning permission
Two of the case studies experienced challenges that related to planning permissions. In the case of one project, some of the flats were required to have freestanding platforms built for the heat pumps in order to get planning permission. They felt that the platforms would negatively impact the aesthetics of the buildings, so these flats were removed from the project and other properties were included instead.
However, this was not possible for another social landlord for whom planning permission was a major obstacle to project delivery. Concerns had been raised over potential noise from the commercial air source heat pumps, which were close to other private properties. This delayed the project by a year and resulted in the housing association having to pay for sound consultants and the building of a sound box around the heat pump.
Key findings
- Air source heat pumps are the most common ZDEH choice among the case studies.
- High cost was the main reason why ground source heat pumps were not chosen for many of the projects.
- Planning permission needs to be taken into consideration from the outset, as this can result in changes or delays to projects.
Building types
The eight case studies included a wide range of properties built between 1950 and 2008, with the majority from the 1960s, 1990s, and early 2000s. Building types included multi-storey blocks, cottage flats (or four-in-a-blocks), bungalows, and terraced houses. In many cases, the buildings had already received fabric improvements such as external wall insulation, cavity wall insulation, and loft insulation, reducing heat loss enough to make air source heat pumps a viable option. In some cases, fabric improvements took place as part of the projects alongside ZDEH installations.
Most of the case studies encompassed buildings of a similar type and age, which meant that challenges associated with particular building types did not arise. The exception to this was the Hebridean 100 project, which included a wide variety of building types and ages. Despite this, Hebridean Housing Partnership did not report any challenges associated with the installations.
Maryhill Housing Association was able to install individual air source heat pumps in their seven-storey blocks by utilising the drying areas inside the buildings. A similar solution is unlikely to be available in other multi-storey blocks, but other alternatives exist, such as a shared air source heat pump system.[11]
Pilot projects
Multiple social landlords spoke positively about testing the proposed measures on one pilot building before carrying out installations in the rest of the buildings.
In one of the projects, air source heat pumps had already been installed in one block of flats before the landlord applied for funding for the remaining blocks. Another landlord, who did not take this approach, expressed that, in hindsight, it would have been beneficial, even if it had resulted in increased project costs and timelines. In particular, for projects with several large buildings, it was felt that piloting the installations in one building could help make the process smoother and less disruptive for the tenants.
Key findings
- ZDEH systems were installed across many different building types; none of the social landlords reported challenges associated with particular building archetypes.
- In projects involving large buildings, social landlords indicated that it is helpful to deliver at least one building as a pilot building, to better understand what challenges arise.
Impact evaluation
The aim of impact evaluation in the context of a retrofit project is to establish to what extent the aims of the project have been achieved, i.e. to provide evidence of the changes that have taken place as a result of the measures installed. The case studies show a wide variety of approaches to evaluating the impact of the projects. Overall, very little data is currently available either because it has not been collected or because collection is still ongoing. As a result, limited conclusions can be drawn on the outcomes of the projects. Despite this, the different approaches provide insights into the challenges and considerations relating to evaluation work. This section outlines the data that was collected. For a discussion on the findings of the evaluation work see section 8.1.
Data collection
Different aims and motivations (see section 5) affected what evaluation data was collected. EPCs were the form of data most commonly collected across the case studies. For the case studies that emphasised the importance of regulatory compliance, EPCs were considered the main focus of the evaluation work. Improvement in EPC ratings may reflect changes beyond the heating system, including the installation of other energy efficiency measures.
Pre- and post-install surveys were carried out by some of the social landlords, but in most cases, the response rates were low. This limits the ability to carry out a full impact evaluation.
Three projects have been collecting temperature and humidity data via sensors. This data is being collected over a period of at least 12 months to cover weather changes throughout the year, and the collection is still ongoing for two of the projects.
None of the case studies had energy bills or meter reading data that could be included in this research. This data can only be provided by the tenants, which makes it difficult to collect consistently across multiple properties. One social landlord navigated this challenge by collecting data during the annual heat pump servicing. This comprised heat pump and electricity meter readings as well as a satisfaction survey.
Usefulness of data
The social landlords had different perspectives on the importance and usefulness of collecting impact evaluation data. One social landlord explained that data collection was not a high priority on their project since they were confident that heat pumps were a viable option, having collected more evaluation data on previous projects. They highlighted the obvious benefits of heat pumps compared to other forms of electric heating. This landlord noted that future projects where properties are changing from gas central heating to heat pumps will likely require more impact evaluation work to ensure the change does not impact the residents negatively.
Another social landlord explained that collecting impact evaluation data was not a high priority for their limited resources and viewed this type of data as more beneficial to the Scottish Government than to the housing association and their tenants. On smaller projects, some of the social landlords felt that they knew what they needed to know from verbal feedback from their tenants. A majority of the social landlords in the case studies shared positive but anecdotal feedback from their tenants and considered a lack of complaints as a positive indicator.
Different factors drive these perspectives. Planning and delivering robust impact evaluation requires staff time, skills, knowledge, equipment, and funding. It also requires the foresight to plan in advance of the project to gather the necessary pre-installation data. This is particularly challenging since resources are limited for many social landlords. With time restrictions on meeting energy efficiency targets, EPCs become a key focus for many social landlords since it is how their performance is measured.
Key findings
- Social landlords prioritised impact evaluation to different degrees.
- EPCs are the most consistently available source of data across the case studies.
- Some social landlords carried out tenant satisfaction surveys, but overall response rates were low.
- Three case studies collected comprehensive data including from sensors, but for two projects data collection is not yet complete.
Key findings: Project delivery
Tenant engagement
The social landlords displayed care and experience in engaging with their tenants before and during the installation works. There were several different strategies taken, including:
- Carrying out pre-installation surveys
- Employing tenant liaison officers
- Demonstrating the heating system
- Hosting tenant engagement sessions
Tenant project approval
Some of the projects started from the point of tenants being unhappy with their existing heating system. Two of the social landlords surveyed their tenants and found concerns about heating and affordability.
Another landlord hired a consultant to carry out a phone survey with tenants, which focused on attitudes towards decarbonisation and climate change. The results showed that tenants were concerned about climate change and, as a result, were on board with the decarbonisation plans but were mainly concerned about the disruption of the work. The consultant also provided a liaison officer responsible for dialogues with the tenants.
“We didn’t want to just spring [the project] on them. They felt like they were being taken on that [decarbonisation] journey and that they were being listened to.” – Social landlord
A common strategy across the social landlords was to organise tenant engagement sessions, typically hosted in local community spaces. For most of the larger-scale projects, information was sent out in letters and on their websites, while smaller-scale projects were able to have one-to-one conversations with residents about the benefits and cost savings of the projects.
One of the larger projects involving several hundred properties found that they were unable to get in touch with some of the tenants, despite multiple attempts to make contact through letters and via housing officers. Conversely, another landlord found that since their tenants already knew they wanted a heat pump, few turned up to the consultation events.
Example flats
Several social landlords found that demonstrating the new heating system helped their tenants to feel more confident about the installation.
In one of the projects, the heat pump installer and manufacturer attended tenant engagement days, where they displayed the heat pumps and how they operated. The housing association found it helpful that information was provided by a third party, rather than from themselves as the landlord.
By chance, Grampian Housing Association had a void property that they decided to use as a space to demonstrate the installations that would be carried out. This helped tenants understand how the commercial air source heat pump network would work. Such heating system demonstrations were also helpful to residents who did not speak English as their first language.
Mixed tenure
The main focus of all eight case studies was on social housing tenants. Three of the projects also included buildings containing some privately owned properties. Of these, two included large building blocks.
In these case studies, private owners were hesitant to be involved due to the costs of installation. In one project, all five owner-occupiers declined to have air source heat pumps installed on the grounds of cost. In another project, external building works were completed for all properties, including the privately owned ones, but they declined any internal work, which would have been at their own expense.
Budget
Most of the case studies did not have a specific budget for tenant engagement, and the social landlords absorbed most of the tenant engagement costs as staff costs. As a result, the cost of tenant engagement was largely unknown in most instances.
There were two exceptions where external tenant liaison officers were used. Grampian Housing Association had this work carried out by an external consultant, and North Lanarkshire Council had a basic level of tenant engagement included it as part of the work carried out by the contractor who carried out the installations.
Key findings
- The social landlords had many different and often creative ways of engaging with tenants.
- Seeing the new heating system in person before installation can help residents feel more confident about the project.
- Some social landlords found it beneficial to have a third-party organisation involved in the dialogues with tenants or in demonstrating the heating system.
- Mixed-tenure projects remain a challenge. There were no examples of projects which resulted in the installation of ZDEH systems in privately owned properties.
Heating system installation
Location of heating system
The installation of air source heat pumps could present challenges related to the location of the heat pump and its pipework. Due to the layout of the properties, the multi-storey flats in Maryhill Housing Association ended up with significant pipework going across the walls of the properties, which some residents have been unhappy about. The social landlords felt that, on reflection, a better solution would have been to put the pipework under the floors, or at floor level so they are not in the line of sight.
There are also circumstances where the installer and the resident may have different opinions about the optimal location for the heating system. For example, the space selected by contractors might already be used by residents for storage or drying. Some social landlords navigated those situations by installing additional storage space or by paying the contractor the extra cost of placing the heating system elsewhere in the home.
In one of the projects, some of the new water tanks had to be put in a different location to the old ones due to size differences. In these cases, storage space was installed where the old water tank cupboard was located. Actions or adjustments such as these resulted in higher levels of satisfaction from the residents.
Redecoration
Three of the case studies mentioned the need for redecoration of the properties after the new heating system installations, and these cases provided some form of decoration allowance for tenants. These costs cannot be funded as part of grant schemes, and so would have been covered by the social landlords.
One of the social landlords reported that residents were unhappy with the impacts on the property after installation, such as lines where the carpet had been cut when new radiators had been fitted. The landlord gave an allowance for carpet replacements but not for other costs, under the reasoning that some things, such as wallpaper, had been installed at the tenant’s own risk.
Another of the social landlords who had provided a decoration allowance, said they would do this differently in future projects. They had found that the decoration allowance, which was given as cash, was sometimes spent on other things besides redecorating the property.
Unexpected costs
Several of the case studies experienced costs related to the project that they had not been able to plan for. These were different in each of the cases and are highlighted here to inform future projects.
Gas meter removal
Grampian Housing Association experienced a challenge around meters after installing commercial heat pumps. It turned out that the energy supplier charged a high cost for the removal of the gas meters. This was important because without the removal, standing charges were building up for the tenants. The housing association found that this cost could not be covered by the funding. Since removal is charged per meter, this led to a significant extra cost. Grampian Housing Association was the only case study that previously had gas heating and therefore was the only case to encounter this issue.
Grid infrastructure
In one rural property, the social landlord encountered a challenge around connecting the solar PV and battery storage to the electricity grid. The Distribution Network Operator sought a significant financial contribution to improve the infrastructure of the local electricity network to enable the connection. The issue of who will pay this cost has not yet been resolved.
Planning permission
Grampian Housing Association experienced a significant additional cost to install an acoustic enclosure around their commercial air source heat pumps to address the planners’ concerns about potential noise levels. Since they did not expect this cost at the start of the project, it was not covered by the grant funding. This issue also caused significant project delays.
Key findings
Examples of areas that may incur costs include:
- Gas meter removal
- Changes to the built environment required for planning permission
- Improvements to the electricity grid when installing solar PV
Key findings: Post project
Tenant support
Metering
It is often necessary to change the meter when a new heating system has been installed, and this proved to be a challenge in several of the case studies. Many of the properties had had electric storage heating with a dual rate electricity meter, which has lower rates at night when the heater is charging but higher costs during the day. Changing to an air source heat pump required having a single rate meter installed, to avoid disproportionately high costs for heating the home during the day.
Since energy accounts are a matter between householder and supplier, residents have to contact the supplier individually to request a meter change. This can be a slow and difficult process[12].
After their tenants had experienced these challenges, one social landlord contacted the company that supplied the majority of the properties to facilitate quicker installation of smart meters. In a different project, the contractor supported tenants in-person to speak with their supplier and ensure they got the correct meter. This was beneficial for both the residents and the housing association.
Using the new heating system
A common challenge with air source heat pumps was enabling residents to use them correctly and efficiently. Heat pumps work best when they maintain a constant temperature. This is different from gas boilers. which are typically operated for a few hours at a time, giving a shorter burst of heat, or storage heaters which heat up overnight and gradually release this heat during the day. One social landlord felt that they needed to shift residents’ mindsets around how and when to heat their homes.
Some of the social landlords made different heating controls available to support tenants in controlling their heating. In one project, this took the form of an app. The landlord explained that the app makes it is easier to adjust the temperature than the heat pump controls. This enables householders to set the temperature to be slightly lower when they are not in the house, and warmer when they are at home. The downside is that some demographics, especially older residents, may be unable to use the app, due to lack of access to a smartphone or the internet, or challenges with IT literacy.
In two of the case studies, the social landlords did not have dedicated resources to support their tenants in how to use the heat pumps efficiently. In one of the cases, a third party had been contracted to carry out tenant support for both meter change and use of the system, but for unclear reasons it did not go ahead. As a result, the social landlord is in the process of carrying out engagement, which is ongoing.
Key findings
- Meter changes can be more challenging and time consuming than expected, and difficult for some tenants to undertake without support.
- For many households, a new heating system may not be intuitive and require getting used to a very different way of heating the home.
- Ensuring ease of use of the new heating system for tenants is likely to result in higher levels of satisfaction.
Project results
As discussed in section 6.5, the available impact evaluation data is limited due to either not having been collected or collection not yet being complete. This section gives an overview of the high-level outcomes across the projects, where possible.
EPC ratings
All social landlords with data saw improvements in their properties’ EPC ratings as a result of the projects. Before the installations, all properties fell within band E, D, or C, with the majority in band D. After the measures had been installed, all properties achieved band C or B, with the exception of three solid wall houses whose EPC ratings decreased from band D to band E. It is unknown why this was the case and may have been the result of an assessment error.
The average improvement in SAP scores varied across projects depending on the building type, previous heating system, and whether other measures were installed. The most significant SAP score increase took place in Queens Cross Housing Association’s project. Before the project, a sample property[13] was in EPC band E, while all properties post-project achieved band C or B, depending on the number of exposed walls.
Affordability
All case studies faced the challenge that the heating system changes coincided with a period of significant energy price increases. As a result, many tenants have experienced higher energy costs despite their new heating system being cheaper to run per kWh. Since energy consumption data was not available for any of the projects, it is difficult to calculate the counterfactual (i.e. what would the energy costs have been if a new heating system had not been installed).
Tenant satisfaction
It has not been possible to draw definitive conclusions on the residents’ satisfaction with their new heating systems due to a lack of representative data. All social landlords reported that many of their tenants were happy with their new heating system. Most of the information was anecdotal, and several social landlords saw the lack of complaints as a success in itself.
“The thing with tenants is, if nothing’s going bad, you don’t hear from them.” – social landlord
Where tenant feedback was available, the negative comments primarily related to high energy costs or issues with understanding their heat pump and controlling the temperature. The positive comments related to feeling warmer and more comfortable, and finding the system easier to use. Some tenants felt positive about their new heating system despite high bills, as they took this to be a result of the wider energy price increases rather than a result of the new heating system.
Hebridean Housing Partnership was the only project where comprehensive tenant satisfaction data was available at the time of writing. Their survey, which was carried out as part of their annual heat pump service, reported a 95% satisfaction rate.
Key findings
- EPC ratings improved across all projects.
- The majority of properties achieved an EPC B or C rating after the installations.
- It has been difficult to assess to what degree the affordability has changed due to increased energy costs.
- Many social landlords anecdotally reported that their tenants feel positive about the heating system change, but there is limited data available to quantify this.
Conclusions
Social landlords in Scotland are in the process of improving their housing stock to meet future needs. Many are making use of Scottish Government funding, which has been made available for this purpose.
Most of the case studies included in this research have installed air source heat pumps. Compared to ground source heat pumps and heat networks, air source heat pumps have lower capital costs and require less involvement and responsibility from the housing provider, which makes them a more attractive choice for many social landlords. Some social landlords and tenants have experienced challenges around the operation of the air source heat pumps, including access to maintenance engineers.
The buildings in these case studies do not represent Scotland’s many older or ‘hard-to-treat’ buildings. Rather, many of the projects that have been completed so far involve buildings that were easier to upgrade, such as those that were ‘heat pump ready’ or only required cavity wall insulation.
The majority of the properties in this research switched from electric storage heating. The social landlords found that this necessitated a significant change in tenants’ heating patterns and behaviours, which was identified as a key challenge related to air source heat pumps. Doing this successfully requires a level of support for the tenants. The nature of heat pumps offers the benefit of more consistent temperatures. However, the constant use needed to efficiently achieve this, could be putting use of the heating system beyond the reach of those in fuel poverty. This is likely to prove more challenging when moving properties away from gas central heating.
Limited collection of impact evaluation data is a significant barrier to quantifying how the projects have impacted tenants. Without such data, the social landlords cannot determine whether the original aims of their project, such as increasing affordability and comfort, have been met. Some project data will become available in 2024. This research highlights that impact evaluation work is a long process, and the most useful data is collected consistently over a number of years.
Overall, the majority of the social landlords were satisfied with the outcomes of their projects and the installation process. Despite the lack of formal impact evaluation in some cases, many anecdotally described an encouraging response from their tenants and perceived the lack of complaints as a positive result. However, this absence of complaints does not necessarily guarantee satisfaction or that there would not be more to learn through seeking feedback directly.
Lessons for future social housing energy efficiency and heating projects
Lessons for social landlords:
- Tenant engagement: Consider a mixed-method approach to engage and support a range of residents, such as face-to-face events, ongoing support and opportunities to see and use the technology in-situ.
- Impact evaluation: This should be planned from the outset of the project to truly understand the impact of the project on tenants, its success in achieving its aims and how it might be improved for next time. The methodology should provide a before and after picture, and include temperature and humidity assessments, energy consumption data and EPC data.
- Multiple buildings: In projects involving large or multiple buildings, delivering at least one building as a pilot helps identify and address any challenges. Rolling the installations out in one building helps to reduce disruption and focus tenant support.
- Project management and costs: If you plan to procure a project manager, involving them from the outset means that they can support with application writing. It should be noted that there may be a cost to this, which should be taken into account. Consider aspects such as planning permission requirements, meter changes and electricity grid upgrades at an early stage to avoid unexpected costs.
Appendix / Appendices
Methodology
Case study selection criteria
The following lays out the criteria by which the case study selection was made.
|
Priority |
Criteria |
Reasoning |
|
1 |
Evaluation Reports |
Aimed to select case studies that had data available to provide information about the impact of the project. |
|
2 |
ZDEH Solution |
Providing case studies with a mix of ZDEH solutions will be useful for a wide range of social landlords. |
|
3 |
Funding sources |
We want to highlight that a range of funding sources are available but are aware that these can change, so focused on examples most relevant to social landlords. |
|
4 |
Archetypes |
It is key to have a range of housing types represented so that the case studies are relevant for social landlords with diverse properties. |
|
5 |
Landlord type |
A range of social landlords will help engage varied groups and increase the relatability and therefore impact of the case studies. |
|
6 |
Other measures |
Providing insights into other measures will help landlords to consider the energy efficiency of the whole property. |
|
7 |
Delivery agents and installers |
To ensure a non-biased view of delivery and the challenges associated. |
|
8 |
Project costs |
By prioritising criteria such as a range of housing type and solutions used, we will collate data on varied project costs. |
|
9 |
Location |
Aimed to include a diverse range of locations to represent the diverse urban and rural install experience, as this can impact the associated challenges. However, other aspects such as housing type will be prioritised, as we expect the range of case studies to be applicable to different locations in Scotland overall. |
Overview case study selection process and limitations
A list of potential case studies was compiled based on an online search, which included publicly available funding reports. A call for case studies was shared by the Scottish Federation of Housing Associations on their social media and via their newsletter and an email to their decarbonisation group. Scottish Government also sent out emails to their distribution lists. This resulted in a list of 23 projects which met the research requirements. Eight projects were finally selected based on the selection criteria.
Finding projects with robust evaluation data was a high priority, and it proved to be a significant challenge. Detailed information about the projects’ approach to impact evaluation was not available before the interviews, and each interviewee had a different perspective on what robust evaluation data includes. Additionally, many of the projects have only recently been completed, and data collection is still ongoing in the projects with the most comprehensive evaluation approach.
The case studies cover a limited range of heating systems with an overweight of air source heat pumps. Many examples of other heating systems, such as district heating and ground source heat pumps, were primarily found in new build housing which was out of scope of the research.
Finding examples of projects that include mixed tenures was also challenging as there were few examples that met the research criteria. As a result, the conclusions drawn in this area are limited.
Several of the social landlords had changes to their staff since the project was completed. In some cases, this meant that interviewees were unfamiliar with certain aspects or stages of the project, limiting what information they could pass on.
Interview topic guide
Section 1: Background of the project
1. Can you start by giving me an overview of the project?
Prompts:
- What measures were installed?
- How many properties had measures installed?
- What property archetypes were included? (detached, four-in-a-block, high rise)
- Were all households tenants of the housing association, or were other tenure types included?
2. What motivated your organisation to develop the project?
- Did you complete any (other) energy efficiency upgrades around the same time as this project?
3. How did you determine what measures you wanted to install?
- In particular, why this ZDEH technology?
- Did the archetype of the properties factor into the decision?
- What heating type was in place before?
- Had the properties had any other recent energy efficiency retrofit work done?
4. Can you give a rough timeline of the project?
- I.e. start date, finish date, when did tenant engagement start, when were installs completed
5. What is the current status of the project?
Section 2: Project delivery and practicalities
6. Did you have any challenges associated with delivering the proposed number of installs?
- Did you take any steps to mitigate these issues? If yes:
- What did you do?
- How effective was this?
7. How did you decide on an appropriate contractor for installing the measures?
- Did you have contractors involved in other parts of the project, such as impact evaluation?
8. What approach did you take to engaging with the tenants?
- Would you say it was successful?
- What was the tenants experience of the project overall?
- Can you give an approximate cost of these engagement activities?
Section 3: Financial considerations
9. Did you receive any funding to deliver the project?
- How was the process to access that funding?
- Do you have recommendations for other social landlords regarding funding and the application process?
10. What was the overall cost of the project?
Did you have other funding sources, or was the rest covered entirely by your organisation?
11. Do you know how much of that was associated with the cost of purchasing the equipment, and of installing the measures?
- Did the equipment and installation costs vary based on property size or building archetype? If so, how?
- If mixed-tenure present: Were there any cost variations as a result of the mixed-tenure nature of the scheme?
12. What other costs were there?
- Was there a budget for:
- Tenant engagement activities?
- Monitoring and evaluation?
Section 4: Project impacts
13. Who carried out the evaluation work?
- What was the cost of evaluation?
- Was the cost of evaluation considered when deciding whether to evaluate the project or not?
14. What kind of impact evaluation data was collected as part of the project?
- What was the sample size for each of these methods?
- Was this collected both before and after?
- Did the before and after periods include heating seasons?
15. How did the energy efficiency of the properties change as a result of the decarbonisation project?
- What evidence do you have to support this?
- What was the impact of the measures on the SAP score?
16. Do you know what the impact of the project has been on energy use?
- Were you able to calculate an average change in kWh per property?
- What was the impact of this on tenant fuel bills?
17. Do you have any figures on the carbon savings that resulted from the project?
- If yes, how was this calculated?
18. Do you know what the impact of the measures were on temperature and humidity of the properties?
- Were there any trends seen across the properties?
- Did you calculate average temp and humidity changes that we report in the case study?
19. What was the householders’ experience pre and post installation?
Section 5: Recommendations for future projects and other social landlords
20. What challenges did you experience during the project?
- Were these centered around any particular project stages?
- Were there specific challenges associated with the archetype, tenure, or location of the buildings?
- How did you overcome these challenges?
21. What were the most successful aspects of the project?
- What factors were behind these successes?
22. Do you feel that the project has met its aims? Why/why not?
23. If you were to carry out a similar project in the future, is there anything you would do differently?
Historic funding schemes
UK Social Housing Decarbonisation Fund Demonstrator
Three Scottish projects included. The current fund is England-only.
Non-domestic Renewable Heat Incentive
Now closed. One project applied but did not get it due to mistake on application.
© Published by Changeworks, 2024 on behalf of ClimateXChange. All rights reserved.
While every effort is made to ensure the information in this report is accurate, no legal responsibility is accepted for any errors, omissions or misleading statements. The views expressed represent those of the author(s), and do not necessarily represent those of the host institutions or funders.
NB. As set out in the Heat in Buildings Strategy, the Scottish Government is progressing work on the reform of EPCs. A consultation on this topic closed in October 2023. The reform proposes to introduce new metrics that, among other things, separate out fabric efficiency and cost, and carbon emissions. ↑
Scottish Government (2023) Social housing net zero standard: consultation ↑
Climate Change Committee (2023) Letter: Reform of domestic EPC rating metrics to Patrick Harvie MSP ↑
Scottish Government (2023) Energy Performance Certificate (EPC) reform: consultation ↑
This research focuses on specific criteria therefore this case sample is not representative of the success and outcomes of the SHNZHF overall. The SHNZHF was originally part of the LCITP. The SHNZHF is an ongoing programme whereas the LCITP has closed. ↑
This research focuses on specific criteria therefore this case sample is not representative of the success and outcomes of the LCITP overall. ↑
Formerly ‘Energy Efficient Scotland: Area Based Schemes’ or EES:ABS ↑
Scottish Government (2023) Area-Based Schemes ↑
Scottish Government (2023) Scotland’s Heat Network Fund: application guidance ↑
European Heat Pump Association (2023) Heat pumps and high rises: Case studies from across Europe ↑
Ofgem (2023) Ofgem review reveals that customer service standards of energy suppliers must improve ↑
Given the standard nature of the flats, only one pre-install EPC was provided by the social landlord for analysis. ↑
DOI: http://dx.doi.org/10.7488/era/4430
Executive summary
Aims
Understanding the impacts of climate change on target fish stocks is of critical importance to supporting and future-proofing the fishing industry and marine economy.
This project used a literature review, alongside expert engagement, to discuss the predicted effects of climate change on fish stocks, the likely effects on the Scottish fishing industry and to provide recommendations to fill information deficits and inform policy.
Key findings
The Scottish marine ecosystem and the fisheries it sustains face a dynamic and uncertain future due to a changing climate:
- Climate change and ocean acidification is expected to have ecosystem-level impacts, which will likely result in distribution and ecological changes to key commercial species in Scottish waters.
- As the distributions of commercial species shift geographically, and weather becomes less predictable, fishing grounds increase or decrease in importance.
- Climate change stresses could impact the value and utility of traditional Maximum Sustainable Yield (MSY) assessments, which indicate the maximum quantity of fish that can be caught sustainably.
- Area-based management tools, including single species-protection Marine Protected Areas (MPAs), may become ineffective as conservation and management tools in the long term. This is due to changing distributions, abundances and life histories.
- Limiting the pressure from disruptive fishing methods may increase resilience of inshore ecosystems, such as maerl beds and estuaries, to the impacts of climate change.
- Redistribution of commercial species around Scotland may lead to new opportunities for the industry. However, the supporting network of the industry, such as consumers and supermarkets, needs to work in step to support diversification.
- Ways of strengthening current modelling could be explored. For example, by the factoring in of scenarios such as those relating to ecosystem changes or interactions between increasing temperature and ocean acidification.
Recommendations
Future policies may require increased focus on adaptability and flexibility, to achieve successful management of Scottish fisheries. We propose five steps that will contribute to achieving this.
- Baseline monitoring: Further research and data monitoring would build a greater understanding of the impacts of climate change in the region and of the capacity for Scottish fisheries to adapt.
- Risk assessment: Risk assessments conducted at a local level would identify the most significant threats to individual fisheries under various climate change scenarios. This would enable local fisheries to identify their level of exposure and vulnerability to climate change, to prioritise adaptive capacity at both ecological and socio-economic levels.
- Trigger points: The outputs of modelling and risk assessments could inform a trigger-based approach system for fast implementation and to tackle food availability and security issues. Triggers may be based around ‘tipping points’ identified by risk assessments. Reaching a trigger would activate a pre-determined sequence of actions.
- Stock assessment and Maximum Sustainable Yield (MSY): Factoring climatic and other environmental variables into MSY calculations and stock assessments will likely increase fisheries resilience through increasing the ability to forecast and provide more accurate reference points to inform quotas.
- Collaboration: Aligning and coordinating fisheries policy with other policies that may impact fisheries management directly or indirectly (eg MPA management) is important to track the dissemination of knowledge and informed actions and decisions. Relationships alongside international foundations will also help to manage shared seas and fish stocks in partnership. Finally, there is a role for supermarkets, retailers and others in educating consumers as the industry adapts to new target species.
Glossary / Abbreviations table
Explanation | Abbreviation | Explanation | |
|
Boreal |
Northern species |
MSY |
Maximum Sustainable Yield |
|
C |
Celsius |
Mt |
Metric Tonne |
|
CFP |
Common Fisheries Policy |
NAO |
North Atlantic Oscillation |
|
CO2 |
Carbon Dioxide |
NCMPA |
Nature Conservation Marine Protected Area |
|
Eurytherma |
Temperature tolerant species |
nm |
Nautical mile |
|
FMAC |
Fisheries Management and Conservation Group |
NTZ |
No-take zone |
|
FMSY |
The rate of fishing mortality consistent with achieving MSY |
Phenology |
Life events of organisms |
|
GVA |
Gross Value Added |
RIFG |
Regional Inshore Fisheries Group |
|
HAB |
Harmful Algal Bloom |
SCCAP |
Scottish Climate Change Adaption Plan |
|
HPMA |
Highly Protected Marine Area |
SNAP |
Scottish National Adaptation Plan |
|
JFS |
Joint Fisheries Statement |
SST |
Sea Surface Temperature |
|
km |
Kilometre |
TAC |
Total Allowable Catch |
|
Lusitanian |
Southern species |
TSR |
Temperature Size Rule |
|
MCFs |
Marine Capture Fisheries |
UKCRA3 |
UK Climate Change Risk Assessment 2022 |
|
MPAs |
Marine Protected Areas |
UKFAs |
UK Fisheries Administrations |
Introduction
Background and context
The implications of climate change are already apparent in Scotland’s marine environment; warming seas, reduced oxygen, ocean acidification and rising sea levels are affecting marine ecosystems and the impacts are expected to become more frequent and severe in the coming decades (Baudron et al., 2020; Stoker et al., 2020; Townhill et al., 2023). Increased sea temperatures and other impacts, such as increased water acidity and ocean acidification, are predicted to influence fish and shellfish communities and the wider marine community (Cheung et al., 2021; Findlay et al., 2022). Overall, climate change related impacts are projected to alter the viable habitat for several species and add pressure to target fish populations. Therefore, understanding the impacts of climate change on target fish stocks is of critical importance to supporting and future-proofing the fishing industry and marine economy. As Scotland’s fisheries enter a new phase with a renewed focus on responsible and sustainable management, as outlined in the Fisheries Act and Scotland’s Fisheries Management Strategy (Scottish Government, 2020), it is essential to develop new policies to ensure that Scotland’s fisheries are climate resilient.
Climate change risks and opportunities
The latest UK Climate Change Risk Assessment (HM Government, 2022) (UKCCRA3) has a Summary for Scotland which identifies sixty-one risks and opportunities from climate change in Scotland. Two of the risks identified to natural environment are particularly relevant to the marine sector and have direct implications for fisheries management in Scotland.
N14
Risks to marine species, habitats and fisheries from changing climatic conditions, including ocean acidification and higher water temperatures, requires action.
N15
Opportunities to marine species, habitats and fisheries from changing climatic conditions.
The Scottish Government has a statutory duty to respond to the risks identified in UKCCRA3, and consequently, there is a requirement to examine the risks posed by climate change to the Scottish fishing industry and the marine habitats on which it depends, and to identify ways to reduce, mitigate and manage these risks.
Project aims
The Future Fisheries Management Strategy – 2020-2030 (FFM Strategy) has set out the commitment for Scotland to manage responsible and sustainable fisheries into the future (Scottish Government, 2020). Additionally, the Climate Change Committee’s most recent assessment of progress in adapting to climate change in Scotland – Is Scotland climate ready? (2022) – concludes that progress has stalled. It calls for time-bound quantitative targets for accountability with adaptation needed to be embedded across all government activity. It emphasised the role of improved monitoring and evaluation, with some changes in climate-related risks currently not sufficiently known or understood. To inform how adaptation could be incorporated into fisheries policies going forward this research aims to answers five main questions:
- How will climate change modify the distribution and productivity of key commercial fish species (mackerel, herring, haddock, monkfish (or anglerfish), cod, hake, whiting and saithe)?
- How will climate change impact the fisheries of these target species and consequently their resilience?
- How do the projected changes compromise the delivery of policy outcomes to:
- Reach Maximum Sustainable Yield (MSY) within a stock;
- Implement area-based management tools by application of fisheries management measures for existing Marine Protected Areas (MPAs) and key biodiversity locations outside of these sites; and
- Limit inshore activity to current levels?
- To what extent will distribution shifts provide access to new commercial species for exploitation, and how can this be maximised?
- How should policy action be designed to not only reduce risk and exposure to risk, but also avoid maladaptation and lock-in?
- This research prioritises the development of appropriate climate change monitoring, research, and evaluation objectives which should be included in fisheries management decisions going forward. It also considers what amendments to policies might be required in order to include climate variables into fisheries metrics, and tools to aid adaptation within these policies to support commercial fisheries respond to the risks and opportunities outlined in the Scottish Climate Change Adaptation Programme (SCCAP).
Methodological approach
The overall approach in this research follows a three-phase plan using a desk-based literature review, engagement with experts and analysis of the results (Figure 1).

The literature review was based on a broad body of peer-reviewed journal articles, government studies, non-governmental organisation reports, and other technical reports. Any sources that met the inclusion criteria were then subject to a robustness check for quality, significance and overall confidence. The review outcome was prioritised according to the following inclusion criteria:
- Date of publication: sources published from 2010 onwards were included.
- Topic relevance: Literature sources were required to cover, at a minimum, one of the key words or search terms.
- Region: Priority was given to sources from Scotland, the North Sea, and the UK. Sources based in the Northeast Atlantic and Europe were given second priority followed by sources based in the North Atlantic, and the Arctic Ocean. Sources with a general global context and sources from other countries with adjacent seas were also included at the lowest priority level.
- Species: To answer research Q1 and Q2, studies with only the commercial species of interest were included.
An online workshop was also conducted by the project team with the aim of gaining insight to the questions posed through engaging with experts and discussing the outcome of the literature review. Input from the attendees was logged and used to inform this report.
Further details of these steps, search terms, key words and species of interest can be found in Appendix A: Methodological approach.
Key findings
Changes in distribution and productivity of key commercial fish species
Scottish waters are currently exhibiting warming trends with increases to sea surface temperature (SST) higher than the global average. Several species have exhibited changes in range and distribution over the last 30 years due to these climate change impacts. The timing of life events is also changing. It is predicted future warming could result in mismatched spawning, causing greater ranges and longer larval phases. As distributions shift, and changes to life cycles occur, food availability and species interactions are altering. These shifts have been identified as a major threat to Scottish fisheries by experts. These changes resulting in ecosystem mismatches, are leading to lower body mass of adult fish and overall declines in productivity. It is of key importance that fisheries management incorporates understanding of these issues into future strategy.
The waters surrounding the British Isles are currently seeing extreme warming with increases to sea surface temperature (SST) of over 1 ○C above the global average during the last 25 years (Pinnegar et al., 2017; Townhill et al., 2023). Along with these changes in temperature, changes in the frequency of severe weather events, mixing of the water column, and the altering of seawater chemistry through ocean acidification and reduced oxygen levels are also impacting the marine environment (Cheung et al., 2012). As found throughout the literature, these recorded changes in climate are already shifting species distribution, altering major life events such as spawning and hatching and changing the productivity levels of marine organisms (Payne et al., 2021).
Plankton
In order to fully assess the impact of climate on commercial fish stocks, understanding its impacts on plankton is vital, as these micro-organisms form the base of all marine ecosystems. Changes in plankton communities affect all higher trophic levels, including shellfish, fish, and seabirds (Holland et al., 2023). As Scotland strives to achieve ‘Good Environmental Status’ plankton will play a large role as ‘model organisms’ in measuring environmental changes, as they are dependent on solar energy, temperature, water stratification and dissolved nutrients (Edwards et al., 2020). The recent assessment of coastal and shelf pelagic habitats in the Greater North Sea as ‘not good’, under the current definition, and a general decrease in zooplankton and phytoplankton abundance and/or biomass over the last 60 years is cause for concern (OSPAR, 2023).
At a global and regional scale, many species of plankton have been observed to be exhibiting changes in life cycles in the northeast Atlantic due to rises in SST, altered stratification and nutrient levels (Holland et al., 2023). Along with these changes in life cycle and SST, altered Northeast Atlantic Oscillation (NAO) index (a physical phenomenon resulting in fluctuation of atmospheric pressure over the North Atlantic Ocean impacting weather conditions) and the increase of harmful algal blooms (HABs) have also been found to be leading factors in plankton distribution shifts (Pitois, et al., 2012; Bresnan et al., 2013). These changes in climate and life cycles have led to dominant plankton species such as the copepod crustacean Calanus finmarchicus declining in biomass by 70% since the 1960s and shifting northward in distribution at up to 22 km a year (Edwards et al., 2013; Olin et al., 2022). As these shifts and declines in biomass continue to occur, key fish species may also adapt by shifting distributions to match those of their prey.
3.1.2 Commercial fish
Like plankton, climate change is considered a leading cause of fish distribution shifts in Scottish waters. A study conducted by Simpson et al. (2013) found 72% of the most abundant fish species in UK waters exhibited climate induced shifts. Baudron et al. (2020) identified that 19 observed species all exhibited changes in range and distribution over a 30-year period. Globally, these shifts have been observed to be trending in a poleward direction (Engelhard et al., 2014; Nunez-Riboni et al., 2019). Engelhard et al. (2014) observed that cod and haddock exhibited major shifts over the last century. Pelagic fish species are estimated to move up to 600 km and demersal fish species an average of 223 km through to 2050 (Townhill et al., 2023; Pinnegar et al., 2013). At the same time, species have also been observed moving into deeper water to adapt to impacts of climate change (Pinnegar et al., 2017). As species distributions shift, this brings new challenges to fisheries management as fish are subject to changes in prey availability and predator-prey interactions. The recent expansion of more hake into the North Sea increasing competition with saithe for food and resources is a prime example of the challenges such shifts can present (Cormon et al., 2016). These distributional shifts were identified as a major threat to the Scottish fishing industry by experts during the workshop.
Depth and habitat suitability are two notable limiting factors to species ability to shift distributions in response to climate change. Demersal fish are generally limited by the suitability of the seabed for spawning, foraging and as a nursery. This typically results in smaller distributional shifts northward than are observed in pelagic species (Simpson et al., 2013). While pelagic species can shift northward more easily and have been found to respond quickly to changes in temperature over much of their lifecycles, some also spawn at specific localities that promote access to suitable nursery areas for hatched larvae (Baudron et al., 2020). Herring are a prime example of these possible constraints as they are demersal spawners (Wright et al., 2020).
As life events such as spawning may be constrained by habitat suitability, they may also alter through climate induced changes (Hughes et al., 2014). It has been predicted that future warming could result in earlier spawning causing a greater dispersal distance (+70%) and longer larval duration (+22%), although another study has shown the opposite effect where warming delays spawning in Scottish waters for sandeel (Wright et al., 2017). Nevertheless, larval recruitment to nursery grounds is likely to be affected (Wright et al., 2020). Species such as mackerel and cod have been observed supporting this prediction as they have been found altering their spawning times and locations (Jansen et al., 2011; Bruge et al., 2016). A study conducted by McQueen and Marshall (2017) estimated cod spawning periods have shifted at a rate of 0.9 weeks per decade in the Irish Sea, and between 0.8 and 1 week per decade in the northern North Sea.
3.1.3 Productivity
Food availability can impact fish recruitment through larval mortality, as suggested by a series of studies. These cascading effects on marine food-webs can exert bottom-up effects on the ecosystem impacting low trophic levels such as copepods and forage fish to higher trophic levels including marine mammals and seabirds (Pitois, et al., 2012). Historically abundant species such as C. finmarchicus are particularly important food sources for larval fish as they are a direct line to growth and survival in the first year of life (Nunez-Riboni et al., 2019; Olin et al., 2022). Species such as C. helgolandicus are also currently expanding from the south, quickly becoming an important copepod prey item for higher trophic species in the North Sea (Régnier, et al., 2017).
As changes in plankton life events and biomass occur, trophic mismatch may occur, leading to failed fish recruitment (Edwards et al., 2011). Declines in European cod and ecologically important sandeel stocks are often correlated to the mismatch of plankton blooms and larval hatching (Brander et al., 2010; Kristiansen et al., 2014). Studies carried out off the east coast of Scotland have observed trophic mismatch from both the timing of copepod production and sandeel hatch dates correlated with changing rates of SST (Régnier, et al., 2017). A second study carried out by Régnier, et al., (2019) found the average difference in hatching and egg production between sandeels and copepods to be 19.8 days on average. This gap is projected to increase as SST continues to increase. Low levels of first year herring have also been found to be correlated to this trophic mismatch (Clausen et al., 2017). As many marine organisms are ectothermic, temperature plays an important role in regulating physiological rates such as metabolic, growth and maturation. Changes in temperature can lead to variation in mortality distribution and phenology (Régnier, et al., 2019).
Food availability and body size are two of the main driving factors for fish growth (Baudron et al., 2011). A global decline of 14%–24% between 2000 and 2050 in adult size for most fish species due to warming oceans was predicted by Cheung et al. (2015). This phenomenon is known as the temperature size rule (TSR) (Ikpewe et al., 2021). Achieving maximum body size is essential for ecological performance (Simpson et al., 2011). It is unclear whether larger juvenile sizes would compensate for declines in adult sizes. These alterations in the ability to reach growth requirements are likely to have long-lasting consequences on fish population dynamics pertaining to age-size structure, egg size, reproduction, overwintering mortality rates, and ultimately, recruitment (Huang et al., 2021). Physiological stress leading to extra energy expenditure and growth reduction will in turn lower overall production (Prokešová et al., 2020). Loss of ecosystem productivity was identified as one of the greatest threats to fisheries during expert engagement.
Cumulative impacts resulting from the changing ocean climate is generally considered to be a significant threat for fisheries amongst experts. While temperature is a main factor in fish growth and recruitment, oxygen supply can also limit the maximum body size of fishes (Forster et al., 2012; Townhill et al., 2017). The increased metabolic rate associated with higher temperatures results in an increased requirement for oxygen; the lower oxygen content of warm water adds an additional constraint (Breitburg et al., 2018). Physical phenomena such as the NAO has also been identified as a driver in growth rates and recruitment directly and indirectly. NAO affects many physical mechanisms, including wind speed and direction, differences in air temperature and rainfall, heat content, sea surface temperature, gyre circulation, mixed layer depth, salinity, high-latitude deep water formation, and sea ice cover. These mechanisms impacted by NAO can have adverse impacts on the abundance, recruitment, catchability, and body condition of fish stocks (Báez et al., 2021).
Furthermore, ocean acidification may contribute to decreased recruitment, growth, and survival of stocks; as temperatures continue to rise, some species may become more vulnerable (Cheung et al., 2012; Edwards et al., 2020). It is important to note that while decreases in growth and productivity are recorded, trends may not be reflecting the level of resilience from species to species. A study conducted by Kaschner et al. (2010) looking at key commercial fish species found boreal (northern) species including cod and haddock to have a lower temperature optimum compared to the temperate species saithe and whiting. Haddock had the greatest reduction of adult body size in response to warming, however they also showed the quickest reversal of this reduction once temperatures started to decrease. This is one example of how temperature induced stress may be adapted differently from one species to another leading to different rates of long-term impacts. The observed decreases in productivity and changes in distribution will plausibly lead to future decreases in total catch value and weight (Jones et al., 2015; Kühn et al., 2023). Due to the dynamics of the current ecosystems, it is vital that more attention is given to detecting quick changes in productivity and shifts, to allow a response before these undesirable effects are irreversible (Ojea et al., 2021). Globally, adapted fisheries management could successfully help to control the productivity and distribution challenges of stocks under climate change pressure (Gaines et al., 2018).
Impacts of climate change on fisheries and industry resilience
Changes to distribution and productivity could impact fisheries through loss of abundance and decreases in landings. As fish distributions shift, access may also be limited as distances travelled from ports to fish increase and stocks cross political jurisdiction boundaries. Fishing effort may also be limited as climate continues to change weather patterns and extreme weather, such as storms, increase in frequency. The discussed impact on recruitment will affect fishing effort, leading to lower catch per unit effort (and thus a higher effort to achieve a given catch). Industry resilience could be impacted by these changes. Adaptation at an ecological and socioeconomic level is needed to help increase overall resilience.
The implications of depleting stock abundance can be detrimental to marine ecosystems and societies relying on the marine environment for food and economic stability (Simpson et al., 2011; Ikpewe et al., 2021). As key commercial fish species shift northward in distribution to more suitable water temperatures, and productivity levels fluctuate, some previously abundant stocks are decreasing in Scottish waters (Pinnegar et al., 2013). These shifts in distribution and productivity must be addressed as the abundance of key commercial fish communities deplete. As stocks deplete, the resilience of fisheries is also damaged due to a reduction in genetic and generational diversity (Cheung et al., 2012; Ojea et al., 2021). Although building the resilience of fisheries in the face of the outlined challenges is difficult, there are ways to aid resilience to stocks of key commercial fish species (Ojea et al., 2021).
3.2.1 Impacts to fisheries
As discussed in Section 3.1, key species such as cod and mackerel are predicted to shift out of Scottish waters in large numbers as temperatures rise over the next 30 years. While there may be a decrease of landings in cold water species, these shifts also open opportunities for emerging fisheries (Cheung et al., 2012; Townhill et al., 2023). Warm water species shifting north will instigate new challenges and opportunities for Scottish fisheries, as outlined in Case Study 1. As abundance of some species decrease or increase, quotas will need to be reassessed according to current availability of stocks in Scottish waters. Emerging species will be discussed in more detail through Section 3.4.
- Access to resources is another factor to consider when analysing impacts on fisheries from climate induced changes. For example, experts indicate that if climate change were to increase the frequency and intensity of storms, it could result in a decrease in available fishing effort days, reducing the ability of fishing boats to access stocks (Cheung et al., 2012). Further losses to fisheries will be seen in the form of quality of landings as body size and productivity of major stocks decrease. As fish distributions shift, access may also be limited as distances travelled from ports increase and stocks cross political boundaries where quotas may vary (Gullestad et al., 2020; Maureaud et al., 2020; Pinsky et al., 2020). Experts highlight the ripple effect of the dispute on the industry considering the example of mackerel fisheries. A past dispute between Northern European countries outlined by Pinnegar et al. (2017) provides a model example of the challenges transboundary shifts present; an apparent shifting of mackerel from out of Norwegian waters between 2009 and 2011 resulted in disagreements over allowed catches by Norwegian vessels in EU waters as Iceland and the Faroe Islands both laid claim to increased quotas for mackerel. The mobility of fleets could be seen as a pivotal tool for long term fisheries adaptation to climate induced shifts in ecosystems. Despite this increasing adaptive capacity, there will likely be trade-offs between factors such as increasing fuel costs and greenhouse gas emissions, with a potential requirement for vessel changes. It should also be noted that distribution changes are not currently reflected in fisheries agreements for shared stocks, as experts highlighted during the engagement, stressing the importance of addressing quota distribution. These challenges may require transformational change in the management system of international agreements regarding relative stability and fishing quotas (Ojea et al., 2021).
Case Study 1: Emerging Scottish hake fishery impacts as an example of shifting distributions and emerging fisheries challenges and opportunities
Hake is a good example of the problems that can be caused by the mismatch between fisheries allocations and current fish stock distributions. Within the CFP of the EU, fishing opportunities are allocated in such a way as to ensure the relative stability of the fishing activities of each Member State for each stock concerned. However, relative stability and total allowable catch (TAC) use a fixed allocation based largely on historical catch records for each country in 1973–1978. When these relative stability allocations were devised, hake landings in the North Sea were negligible. As a result, relative stability allocates only 3% of the TAC to the North Sea. However, the North Sea now has 34% of the entire hake stock, which led to massive discarding of hake that couldn’t be returned to port. Scottish fleets landed 3,035 tonnes of hake in the North Sea. In 2011, with 2,678 tonnes of this coming from quota swaps, yet they still discarded 4,993 tonnes (Baudron et al., 2020). As evidence mounts for changes in the distribution of commercial fish, up-to-date data is crucial if fish stocks are to be managed sustainably. Collaborating with scientists, policymakers, and stakeholders to develop adaptive management approaches that consider the changing distribution of fish species can help optimise the exploitation of new commercial species.
Resilience in fisheries
Climate related challenges presented to Scottish fisheries impact the level of resilience. Overall, the resilience of fisheries can be looked at through two lenses: an ecological lens, understood to entail the ability of ecosystems or species to recover after a disturbance; or a socio-economic lens, stated to include the capacity to adapt in case of stress or change along with institutional resilience, as the capacity of a natural resource governance system to absorb a disturbance while maintaining its major structures and functions (Ojea et al., 2021). Both sides are equally important to consider building a comprehensive understanding of the implications of climate change on Scottish fisheries.
While there are challenges with fisheries resilience such as genetics and age diversity (as discussed previously), recovery time is also a determining factor in a species’ ability to incorporate a pattern of resilience (Ojea et al., 2021). There are many ways species can adapt to build resilience as climate changes. Resilient species can adapt to environmental fluctuations through incorporating broader environmental niches, adult range and distribution shifts, habitat diversity and dietary flexibility (Mason et al., 2021). Although species are characterised by the ability to adapt to changing environments to survive (natural selection) it is important to consider how quickly this evolution and adaptation may take place relative to rate of climate related changes. Failure to adapt can often result in a collapsed fishery as highlighted in Case Study 2.
From a socio-economic point of view, autonomous adaptation has played, and will continue to play a vital role in the fishing industry as highlighted during the expert engagement workshop. Nevertheless, it was pointed out that there are certain management challenges to consider as climate change may impact the resilience of fisheries in many ways. For instance, many aspects of resilient-friendly fishing practices can be damaging from an ecological perspective. An example of this is fishermen utilising a ‘crop rotation’ style of fishing: as fish stocks in certain areas deplete, fishermen are able to respond to the change and move to a new area until that area is depleted. While this cycle does build socio-economic resilience, it does so at the cost of ecological resilience. As this cycle repeats, areas may not recover well, setting up stocks for continued failure. Such practices eventually create a unique management challenge that will need support to incentivise fishermen to adopt more sustainable methods. Baudron et al. (2020) noted that beyond productivity and recruitment, fishing is one of the main factors impacting the abundance of commercial fish species. This is further supported by Brander et al. (2010) suggesting that reducing fishing pressure can become a strategy to reduce the impacts of climate change. In addition, an important factor impacting fisheries resilience is overexploitation (Ojea et al., 2016), this should be considered in strategies aiming to build further resilience through introducing new policies to ensure sustainable fishing practices are enforced and to create opportunities for fishermen to seek diversification and alternate income sources. As highlighted by experts during the workshop, controlling fishing pressure is vital as stocks can respond to factors like lower fishing mortality, that can potentially override climate effects, in turn, providing temporary relief from climate change and ensuring resilience.
Case Study 2: Alaskan snow crab fishery as an example showing how climate can quickly destabilise a strong fishery if a species cannot adapt to changes in a timely manner
Fisheries management in Alaska is considered some of the most effective in the world; nevertheless, despite this highly regarded management system collapse is still a threat. The eastern Bering Sea snow crab fishery in Alaska worth 150 million USD provides a prime example of how fast climate can destabilise a large fishery. Three years after an all-time high of abundance in 2018, the snow crab stock collapsed in 2021 with more than 10 billion crabs disappearing from the eastern Bering Sea shelf. Several observations suggested that temperature and population density were the two key variables resulting in the collapse. The collapse is recorded as one of the largest global reported losses of motile marine macro fauna resulting from marine heatwaves. The caloric requirements for snow crabs nearly double as temperatures rise from 0°C to 3°C. This, coupled with a limited foraging area, suggest that starvation likely played a role in the collapse. This example of a collapsing snow crab population suggests that considering environmental influence in estimates of biomass used to set catch limits can be important but does not resolve the standing question of how to consider environmental change in management targets. The example also highlights the importance of adaptive capacity of species as there continues to be uncertainty for future warming trends.
Climate change impact on delivering policy outcomes
Reaching Maximum Sustainable Yield (MSY) within a stock
The effects of climate change on maximum sustainable yield (MSY) vary by region, depending on factors like water temperature and local hydrodynamics. Some areas may experience more negative impacts on MSY due to climate change and ocean acidification, leading to declines in fish yields during certain seasons. Fish populations may also become more vulnerable to short-term natural climate variability in the presence of other stressors such as overfishing. Climate change could increase trophic mismatch which leads to a decline in recruitment and therefore MSY. These factors highlight the complexity introduced when considering MSY in light of climate change effects which calls for a review of traditional MSY approaches.
Future biological, physiological, and geographical shifts due to climate change pose significant challenges to achieving maximum sustainable yield (MSY) within fish stocks. MSY is a theoretical concept in fisheries management, which aims to find the balance between harvesting a renewable resource and maintaining its sustainability for future generations (Rindorf et al., 2017). MSY represents the highest yield that can theoretically be taken from a stock in the long term without risk to stock sustainability. MSY can be determined through either surplus production models or age-structure models. The former uses catch and effort or abundance data, while the latter considers factors like growth, maturation, selectivity, mortality rates, and recruitment to determine optimal harvest levels. MSY-based fisheries management revolves around the management of fishing mortality, and hence the FMSY index (the rate of fishing mortality consistent with achieving MSY) is central.
Winter et al. (2020) highlights the role of the Allee effect, which describes the decline in growth rate at a small population density, in worsening the impact of human-induced stressors including fishing and climate change on fish stocks through the promotion of hysteresis (a phenomenon where the response of fish populations to environmental changes exhibits a lag or delay in its trajectory). Hysteresis can lead to a collapse in population and recovery failure, which can be irreversible. Climate change has the potential to strengthen density dependent interactions such as Allee effects, where growth rate declines at a small population density, which could increasingly challenge fisheries management (Winter et al., 2020).
Increases in water temperature due to climate change can affect the growth rates and maturation of juvenile fish, leading to a lower maximum size-at-age, as discussed previously (Marshall et al., 2019; Hunter et al., 2019). Baudron et al. (2011) discusses the implications of a warming North Sea for the growth of haddock. Baudron et al. (2014) shows that as temperatures increase, fish tend to have smaller body sizes, which can lead to a decrease in yield-per-recruit of these stocks by an average of 23%. Although this suggests that undertaking stock projections including environmental drivers such as temperature could affect perception of the stock status and improve the accuracy of yield forecasts, this would only be the case where projections of environmental drivers were reliable with a clear causal link between a specific driver and metrics such as fish recruitment, growth and mortality, which often is not the case. Thus, hysteresis is a reason why it may not be appropriate to build environmental variables explicitly in stock assessment models due to the use of potentially inaccurate timings of impacts.
As discussed in Section 3.1, water temperature changes can also alter fish distribution and migratory patterns, encouraging certain species to shift to cooler waters, thereby increasing the complexity of sustainable stock management (Marshall et al., 2019; Bahri et al., 2021). Spawning times are also affected by SST which in turn impacts the survival of eggs and larvae, and ultimately the size of the adult population (Bahri et al., 2021). Changes in climate can also affect the productivity of marine ecosystems, which can in turn affect the abundance and distribution of fish stocks (Marshall et al., 2019). Pinnegar et al. (2013) states that long-term climate change may make MSY more difficult to achieve by reducing the overall carrying capacity (the maximum population that a given ecosystem can sustainably support over the long term), which means that the stock may not be sustained at levels observed in previous years. Additionally, extensive fishing can cause fish populations to become more vulnerable to short-term natural climate variability, making them less able to buffer against the effects of poor year classes. A predictive study by Régnier et al. (2019) found that projected warming scenarios could increase the trophic mismatch between predator and prey, leading to a decline in recruitment (the number of young fish that enter the population each year). Further studies have found evidence that climate change can affect recruitment, which is predicted to hinder the ability of fisheries to attain MSY of the stock (Kühn et al., 2023).
According to a paper by Van Leeuwen et al. (2016), the effects of climate change and ocean acidification on MSY is dynamic and varies according to the site’s hydrodynamic regime (the prevailing patterns of water movement, including currents, tides, and circulation). The paper studied three sites in the central and southern North Sea with varying hydrodynamic regimes: seasonal thermal stratification, permanently mixed, and large inter-annual variability. Based on the models, under a medium emissions climate change scenario, the site characterised by large interannual variability was predicted to decrease in yield, especially in winter. This was primarily due to the impacts of ocean acidification on the benthic system due to its role in passing carbon to higher trophic levels. The remaining two sites, one with seasonal thermal stratification and the other with permanently mixed waters, showed an increase in fisheries yield in response to the stressors. This demonstrates that sites with varying hydrodynamic regimes will show differing responses to climate change and ocean acidification and ultimately represent different trends in fisheries harvest.
All these factors can make it more difficult to sustainably harvest fish at the same level as was previously possible and therefore hinder the ability to achieve MSY within a commercial fish stock. These complexities call for proactive and adaptive management approaches to sustainably exploit fisheries resources under changing climatic conditions (Marshall et al., 2019; Bastardie et al., 2022). Regenerating degraded stocks to levels that are higher than those required to generate MSY would help populations become sufficiently large and diverse as to be more resilient to climate change (Kemp et al., 2023). This is because larger and more diverse populations are better able to adapt to changing environmental conditions. Therefore, it is important to manage fisheries in a way that allows fish stocks to regenerate to levels higher than those required for MSY. Similarly, Bastardie et al. (2022) suggests that the risk of losing an entire stock due to climate change is greater than the risk of losing a small portion of it.
As highlighted during the workshop, FMSY is often treated in policy as a simplified and specific numerical goal that assumes constant conditions, predictable fish population dynamics, and no external factors affecting the ecosystem. In reality, FMSY is a dynamic and variable metric that is regularly updated whenever there is a significant change to a stock assessment which serves to account for ongoing climate change. It may be used as a reference point to guide the allowable catch limits for a particular fishery, to prevent overfishing and promote sustainability by capping the maximum allowable catch based on the calculated MSY value. Ecosystems are dynamic, and fish populations are influenced by various factors, including climate change, habitat alteration, predation, and fishing practices. These factors can cause fluctuations in fish abundance and distribution. Therefore, the use of MSY may not be appropriate in all situations and could be adapted to the specific ecological and environmental context.
Overall, the impacts of climate change on fish populations leads to a requirement for a fundamental re-evaluation of traditional fisheries management practices. Policies that treat MSY as a static, numerical target may no longer be sufficient in the face of changing ecosystems and climates (Travers-Trolet et al., 2020). To adapt to these new complexities and uncertainties, a proactive and adaptive approach is essential. Reframing fisheries policy can provide resilience against the unpredictability of climate change, and as global demand for resources and food security grows, understanding and applying these principles become increasingly vital for a sustainable future.
Area-based management tools
Area-based management tools including areas closed to fishing (either temporarily or permanently) or MPAs can provide refuge for fish populations, protection for nursery areas, and regenerate degraded habitats. However, the efficacy of these tools as an effective conservation measure varies across species. Whilst suited to sessile species, their effectiveness as a fisheries management tool is species specific. Climate change, in time, may also alter the effectiveness of area-based management as tools due to stock distribution shifts. Hence, area-based management where the objective is to increase biodiversity may be more resilient with time.
There are a number of locations in Scottish waters where fishing closures are enacted, on particular species, or at particular times of year (eg spawning periods). Global evidence suggests that area-based management tools, such as marine protected areas (MPAs) and other examples of marine spatial planning, may have varying levels of effectiveness for highly mobile species in a world increasingly affected by climate change, with some no longer being optimally located. Grafton et al. (2023) states that climate change is one of the key drivers of risks for marine capture fisheries (MCFs) and poses critical risks for important natural capital stocks. The projected changes in fish distribution resulting from climate change pose complex challenges for the implementation and success of closed areas in achieving conservation objectives (Grafton et al., 2023). Climate change can potentially alter the effectiveness of these areas by causing shifts in the distribution of target species, which may move beyond the boundaries of the protected area (Pinnegar et al., 2017). This can make technical measures such as area closures less effective in protecting target species, especially for highly mobile species such as many commercial fish. Another way in which climate change affects the efficacy of area-based management tools is by interacting with non-climatic drivers, such as overfishing and the seabed abrasion associated with some fishing activity, which increases vulnerability to climate change and potentially weakens ecosystem resilience (Hoppit et al., 2022). Nevertheless, there is evidence that using MPAs as an approach to promote resilience, especially in key, early life stages, helps to buffer marine communities against the impacts of climate change and is of vital importance (Wilson et al., 2020; Grafton et al., 2023).
Case Study 3: Sandeels in Scottish waters and the North-west Orkney MPA
Although is rare for MPAs to be designed specifically for the conservation of commercial fish species in Scotland, the North-west Orkney Nature Conservation (NC) MPA is an example where sandeels are protected primarily due to its role as a key prey species for marine mammals and seabirds (JNCC, 2021). Despite this MPA being no longer directly relevant to the commercial fishing industry due to the recent closure of sandeel fisheries, the protection of sandeels has an indirect impact on commercial fisheries as Atlantic cod, haddock and whiting are among the species which prey upon sandeels. Regular larval surveys have been taking place within the MPA and the results indicated that persistent numbers of sandeel larvae are exported from this MPA thus replenishing surrounding populations (JNCC, 2021).
Case Study 4: Scotland’s first no-take zone in the Firth of Clyde in Lamlash Bay, Isle of Arran (designated in 2008)
Scotland’s first fully protected marine reserve was established within the Firth of Clyde in Lamlash Bay, Isle of Arran in 2008, with the goal of regenerating the local marine environment and enhancing commercial shellfish and fish populations (Howarth et al., 2012). In the summer of 2010, the University of York in conjunction with the Community of Arran Seabed Trust (COAST), conducted various underwater surveys in order to determine how the area was responding to its protection. They found that, since the site was designated a no-take zone (NTZ), there has been a substantial increase in biodiversity along with the size, age and density of many commercially important species (Stewart et al., 2020). This case study has been used on many occasions as evidence for increasing the levels of protection in UK waters and the success of this MPA has been recognised at an international level.
As highlighted by these case studies, area-based management tools such as MPAs can play an indirect role in fisheries management by providing a refuge for fish and shellfish populations and their key early life-stages, by protecting and regenerating degraded critical habitats (Wilson et al., 2020; Kemp et al., 2023). They can also enhance the resilience of ecosystems to climate change by protecting and regenerating ecosystem complexity (Kemp et al., 2023). Indirectly, MPAs can support fisheries through a phenomenon known as the spill over effect, which occurs when the impacts of these protected areas extend beyond their boundaries and into the surrounding fishing areas, although this is not the primary goal of MPAs (Stobart et al., 2009). From an ecological standpoint, spill over effects result from an increase of fish biomass within the protected area due to a reduction of mortality which can subsequently ‘spill over’ into the surrounding area via the migration of adults, or the dispersion of eggs or larvae. These protected areas serve as reservoirs for reproduction, as the larvae and juveniles produced within them disperse to adjacent areas, replenishing populations in the surrounding fishing grounds. All these factors carry economic benefits, as evidence suggests they translate into the potential for increased catch for fishermen. Despite the increased abundance of fish due to the positive effects of area-based management and MPAs on fish stocks, it is important to note that fishermen may face limitations in terms of what and how much they can catch due to already established quotas. This highlights the necessity of adaptive and dynamic management strategies that allow for changes to be made at a fast enough rate for fishermen to reap the rewards (Pinnegar et al., 2017).
Area-based management tools are generally static in nature and are rarely designed to consider ecological responses to climate change. As previously stated, climate-induced changes in ocean conditions and extreme events challenge MPA resilience, emphasising the importance of designing flexible, proactive, and climate-resilient MPAs (Hopkins et al., 2016; Schmidt et al., 2022). Ensuring the benefits of MPAs for fisheries, the wider ecosystem, and associated ecosystem services, while avoiding maladaptation and promoting sustainability, is essential (Brooker et al., 2018). Management is typically slow to adapt to these changes by modifying long-held management rules in the face of climate change (Pinnegar et al., 2017), an observation that was reflected in the engagement workshop.
While there are obvious advantages to having well informed and well managed area-based management tools implemented throughout Scottish waters, Wilson et al. (2020) states that there are barriers to adopting climate change adaptation strategies, such as a lack of scientific studies evaluating different adaptation strategies and shortcomings in current governance structures. Additionally, decisions about area-based management implementation have the potential to increase the tension between conservation, economic consideration, energy production, fisheries, and infrastructure (Hoppit et al., 2022).
This indicates that the role and impact of MPAs in supporting commercial fisheries can vary widely depending on local factors, and their effectiveness may not be universally applicable across all fisheries. Therefore, other area-based management tools should be considered in conjunction with MPAs in order to promote resilience in commercial fisheries against climate change. Although, it is acknowledged that MPAs often have alternative objectives beyond fish resilience and commercial fish stocks, for example in supporting seabird populations.
In light of these findings, adapting to changes in climate are of critical importance and there are developing areas where this can be informed through data driven modelling. The development of habitat suitability modelling techniques can help predict the potential impact of climate change on the natural distribution of species, which can inform the management of MPAs (Pinnegar et al., 2017). These models look at current tolerated temperatures by certain species and predict distribution shifts, if it is known how the environment may change in the future. Previous models have predicted that commercially important species over the next 50 years are likely to continue to shift, and in the north-east Atlantic specifically (Cheung et al., 2010; Lindegren et al., 2010; Cheung et al., 2011).
Overall, there is an intricate relationship between area-based management tools such as MPAs, climate change and the role of policy. While area-based management can offer benefits to fisheries by acting as sanctuaries for fish populations and safeguarding habitats critical for the life cycle of commercial fish, their effectiveness may be influenced by climate change-induced shifts in species distribution and other local factors such as size of the area and current management strategies. As climate change poses a significant risk to MCFs and crucial natural capital stocks, the need for adaptive and climate resilient area-based management strategies become evident. Additionally, tensions between sectors highlights the intricacy and complexity of policy and decision making that is involved. In the face of climate change, it is critical that tailored, flexible, and science-based policy frameworks are implemented to ensure the success of area-based management tools in promoting both ecological resilience and sustainable fisheries.
Limiting inshore activity to current levels
The intended policy to limit inshore activity to current levels will not be compromised by climate change, but may rather help to address the challenges posed by reducing the pressure on inshore fish stocks and ecosystems, while also protecting seabed habitats. Climate change is projected to have many effects on commercial fish species, including those that are currently fished inshore or utilise the inshore environment at some point in their life cycle. These effects include changes in habitat suitability, distribution, and productivity. Disruptive fishing methods, such as trawling and dredging, can damage seabed habitats important for inshore fish and shellfish. Therefore, limiting the pressure from disruptive fishing methods may increase resilience of inshore ecosystems to the impacts of climate change.
In August 2021, the Scottish Government set out its intention to consult on applying a cap to fishing activity in inshore waters that will limit activity to current levels and set a ceiling from which activities that can disrupt the seabed may be reduced as evidence becomes available. This is now part of a wider package of inshore measures which are currently being developed in collaboration with stakeholders with an immediate focus on improving inshore fisheries management, by helping to transition to more agile, localised systems of management, that make more regular use of scientific advice to balance environmental, social and economic outcomes.
The commercial shellfish species harvested in the inshore region are exposed to risks from climate change. Research conducted on the scallop fishery off the Isle of Man indicated a positive correlation between seawater temperature during spawning season and the number of young scallops produced each year. Additionally, adult scallops in warmer years had larger gonads, indicating higher egg production (Cheung et al., 2012). While king scallops seem to be relatively resilient to CO2-induced ocean acidification, their allocation of resources between tissue and shell production varies seasonally in response to this stressor (Cameron et al., 2019). As well as this, climate change has the potential to increase likelihood of HABs, resulting in shellfish harvesting area closures (Bresnan et al., 2013). Therefore, although climate change may lead to an improvement in scallop recruitment around the UK, there is a risk that the productivity of the fishery may decrease, or that the fishery will have to be closed due to potential impacts on human health.
Nephrops, which are in the colder segment of their thermal range in Scotland, are anticipated to not exhibit any major changes under the temperature projections (Serpetti et al., 2017). Studies suggest that increased marine temperature has caused an earlier shift in their larval phenology, however so far this has had minimal effects on larval retention and advection distance overall (McGeady et al., 2021). Populations of Nephrops found off the west coast of Scotland are supplemented by larvae exported from western Irish Sea Nephrops populations, which may be important for recruitment when native larval retention is low (McGeady et al., 2021). However, habitat suitability for Nephrops populations along the west coast of Scotland may decrease in the future due to climate change (Townhill et al., 2023). Therefore, although Nephrops populations are exhibiting adaptability to the effects of climate change, as evidenced by the limited impact on larval retention and advection, the potential decline in habitat suitability along the west coast of Scotland raises concerns about the long-term persistence of these populations.
Fishing effort within the inshore region ranges from low-impact fishing methods using divers to handpick scallops, static gear such as creels and pots to target crab and lobster, to more disruptive mobile gear methods such as dredging and trawling (Davies et al., 2021). Within the Scottish territorial sea, otter trawls for Nephrops and shrimp, and dredges for scallops and mussels appear to have the highest averaged inshore fishing intensity between 2010 and 2020 (ICES, 2021; Figure 2). However, bottom trawling and dredging were identified in Scotland’s Marine Assessment as one of the most widespread and direct pressures across Scottish waters (Moffat et al., 2020).
Many commercial species at risk from climate change will utilise the coastal benthic environment at some point during their life cycle, likely as nursery or spawning areas (Wright et al., 2020). It is crucial to identify points in a species’ life cycle where they are most susceptible to the impacts of climate change to minimise human pressures on struggling stocks (Wright et al., 2020). For example, Atlantic herring, a commercially important species which is projected to have a decrease in habitat suitability in the UK due to climate change (Townhill et al., 2023), has been recorded as utilising a variety of coastal benthic environments as spawning grounds around Scotland, including live maerl beds, kelp, sea firs, and broken mollusc shell beds (Frost and Diele, 2022). However, bottom trawling and dredging activities can alter the physical and biological characteristics of these benthic environments, putting them at risk (Ryan and Bailey 2012; Frost and Diele, 2022).
Disruptive fishing methods also put pressure on inshore ecosystems that are at risk from climate change. Scottish maerl beds, which play a crucial role not only in the spawning of herring but also in supporting other economically significant fish and shellfish including gadoid species and scallops, are highly susceptible to environmental changes, with estimated projections suggesting an 84% decline due to climate change scenarios (Kamenos et al., 2004a; Kamenos et al., 2004b; Simon-Nutbrown et al. 2020; Frost and Diele, 2022). As well as this, fjords and estuaries have been found to contain habitats with large organic carbon reservoirs and high organic carbon accumulation potential (Epstein and Roberts, 2023). Preserving organic carbon reservoirs has been recognised as a critical aspect of climate change mitigation. Trawling and dredging of the seabed may contribute to the disruption of benthic organic carbon reservoirs, with one study suggesting that 7.9 Mt year-1 of carbon is disturbed by mobile bottom fishing gear within 3 nm of the UK (Epstein and Roberts, 2023). However, this disturbance of seabed organic carbon does not necessarily equate to the loss of organic carbon from the sediment as further research is still required to determine its end fate (Epstein et al., 2022). Therefore, maintaining coastal ecosystems through limiting disruptive fishing methods can be essential to provide a refuge for both species and ecosystems at risk of climate change, and may help to preserving stores of organic carbon.
Overall, the projected changes in climate do not compromise the delivery of the intended policy outcomes, as the intention to limit inshore fishing to current levels in light of the emerging evidence could become an important step in protecting inshore fish stocks and ecosystems from the impacts of climate change. Through preventing an increase in fishing pressure, and setting a ceiling on disruptive fishing methods, the policy will help towards a sustainable inshore fishery, while limiting impacts on essential inshore seabed habitats. This will provide refuges for both species and ecosystems that are at risk of climate change, while also building resilience to projected climate change scenarios.

Data sources: ICES, 2021; Marine Scotland, 2023
Figure 2: Scottish Inshore Fishery Effort Average (2010 – 2020)
Maximising access to new commercial species
Climate change is leading to a redistribution of fish species in the waters around Scotland, creating new opportunities for commercial fisheries whose traditional species may no longer be available. Species such as anchovy and seabass are projected to become more abundant in Scottish waters. Fishermen may be able to exploit new commercial species that become available in their waters, but they will need to adapt their operations and diversify their targets. There are also several constraints that inhibit UK suppliers from benefiting from these potential opportunities; domestic consumer preferences in the UK are generally for a limited range of species. Supermarkets can play a major role in this transition by educating consumers about new local commercial species and offering them a wider range of sustainable seafood options. Another constraint is that many of the new commercial species will need to be exported to markets where there is already an established demand. In order to capitalise on these potential emerging opportunities, Scotland needs to establish market access early for these new species.
New commercial species
As discussed in Sections 3.1 and 3.2, climate change is leading to distribution changes in commercial fish species in the Northeast Atlantic. While some species will experience a decrease in suitable habitat as a result of future climate change, many species may see an increase in suitable habitat (Townhill et al., 2023; Wright et al., 2020; Serpetti et al., 2017), and will therefore expand into areas where they can be targeted for exploitation by commercial fisheries in Scotland.
There have already been distributional shifts in species with warm water affinity in the UK, with observed increases in abundance of Lusitanian (southern) species being recorded during warmer periods, with coinciding decreases in the abundance of colder water boreal species. One of the primary reasons for this is that temperature is a constraint on marine ectothermic organisms, which affects critical biochemical and physiological rates such as oxygen demand, behaviour and development. Within the past three decades, a significant increase in the spatial occurrence of a number of fish species has been recorded. Presence-absence analysis conducted in the Northeast Atlantic found that of the 35 fish species observed with typically southerly distributions, 94% showed significant increases in spatial occurrence in the seven northernmost International Council for the Exploration of the Sea (ICES) divisions, including anchovy, horse mackerel, anglerfish, hake, megrim, blue whiting, mackerel, pollack, saithe and Norway pout. These increases were particularly pronounced for the two southernmost species, horse mackerel and anchovy, which were observed in six of the seven northernmost ICES divisions (Baudron et al., 2020). This increase in some Lusitanian species may be due to the growth of existing local populations. For instance, warmer temperatures may have allowed more anchovies to survive the winter, leading to an expansion of their range and an increase in their abundance in the southern and central North Sea (Wright et al., 2020). The occurrence of species with typically southerly distributions into new locations is positively correlated with sea-surface temperature (Montero-Serra et al., 2015). Seabass populations expanded into the UK in the 1990s and early 2000s during periods where there were warmer temperatures, however this expansion was halted due to over-fishing and two consecutively cold winters in 2009/10 and 2010/11 (Wright et al., 2020). However, sea surface temperature may be just one of several contributory factors. For example, mackerel distribution is also influenced by density-dependent factors, as mackerel have been recorded using areas of lesser habitat suitability in years when the stock size was large, suggesting that mackerel may also expand into new areas in response to competition for resources (Brunel et al., 2018).
Ecological models can give us a good indication of what is likely to happen under different emissions scenarios, giving an insight into possible futures for the marine environment. This information can be useful to inform decision-making and to develop strategies to mitigate future risks and maximise opportunities. However, it is important to remember that these models are a predictive tool to examine possible futures. Obtaining current, up-to-date data, is essential for understanding how ecosystems are responding to change, and for validating these predictions. Townhill et al. (2023) modelled the future suitability of habitat for 49 fish and shellfish species that are commercially important for the period 2030 to 2050 and 2050 to 2070, based on data from 1997-2016, in the waters surrounding the United Kingdom. The study used an ensemble of five ecological niche models, using climate projections based on three different future carbon emissions trajectories from two sources: the A1B (medium) emissions scenario from the Coupled Model Intercomparison Project (CMIP) 3 Special Report Emissions Scenarios (SRES) dataset, and the CMIP5 Representative Concentration Pathway (RCP) 4.5 (medium emissions, high mitigation) and 8.5 (high emissions, low mitigation) projections. The findings of this research indicate that waters around Scotland may become more suitable for commercial species, including but not limited to; blue whiting, brill, anchovy, hake, seabass, sprat, John dory, pollack, poor cod, pouting, red gurnard, sole, surmullet, tub gurnard, turbot, and witch (Townhill et al., 2023). More information, and model outputs for this study based around Scotland, can be viewed in Appendix B. Another modelling study, by Fernandes et al. (2016), who utilised the RCP 2.6 (low emissions) and an RCP 8.5 scenarios in their study, found that Scotland showed an increase in the potential catch of pelagic species under both low emissions and higher emissions scenarios up to 2050, but this effect was reversed thereafter for the high emissions scenario. Species that are eurythermal (thermally tolerant), or those belonging to the colder segment of their thermal range, such as mackerel, horse mackerel and Nephrops, will not exhibit any changes under the temperature projections (Serpetti et al., 2017). One such thermally tolerant species, whiting, is predicted to increase strongly under rising temperature scenarios, as it has a higher optimum temperature than other species, while certain predators, such as cod and grey seals, are predicted to decline (Serpetti et al., 2017). These projected distribution shifts may provide access to new commercial species for exploitation by fishermen whose traditional catch is no longer as plentiful. This has already been seen to an extent in the development of summer squid fisheries in the Moray Firth due to increased squid abundance (van der Kooij et al., 2016). Monitoring and tracking the distribution shifts of fish species can provide valuable information for fisheries management and help identify areas where new commercial species may become available (Serpetti et al., 2017).
Maximising access to new commercial species
Climate change is causing fish populations to migrate to new areas, potentially creating opportunities for harvesting new commercial species in the waters surrounding Scotland. However, several factors can hinder access to these new resources.
Quota systems can act as an obstacle to maximising access to new commercial species due to the inflexibility of quota systems that are based on historical data and agreements between nations. For example, under the EU’s Common Fisheries Policy (CFP), TAC quotas are set annually based upon advice from ICES and political negotiations among member states, with the aim of maintaining relative stability of fishing activity for each country and fish stock. Since the departure of the UK from the EU and therefore the CFP, the basis of setting quotas is still based on stock advice provided by ICES, with the process of agreeing and sharing quotas requiring negotiation and arrangements between the UK and its neighbours. However, the relative stability fixed allocation keys, which vary depending on the species stock, have remained unchanged for many species since 1983, raising concerns about their representativeness and effectiveness in a changing environment (Harte et al., 2019). Therefore, as evidence mounts for changes in the distribution of commercial fish, up-to-date data is crucial if fish stocks are to be managed sustainably. Collaboration between fisheries scientists, policymakers, and stakeholders to develop adaptive management approaches that consider the changing distribution of fish species can promote both access to new resources and the long-term sustainability of these fisheries (Serpetti et al., 2017; Baudron et al., 2020).
Another constraint is the domestic consumer preference for a limited range of traditional species (Pinnegar et al., 2013). Large quantities of the fish traditionally consumed in the UK, such as cod, is derived from imports from countries further north, such as Iceland and Norway, whilst the majority of fish caught in the UK, including Nephrops and mackerel, is exported to southern European countries such as Spain and Portugal (Pinnegar et al., 2017). This feature of the UK fisheries market was also emphasised at the expert workshop. In 2021, Scottish fisheries landed 185,140 tonnes of mackerel with a value of £210 million, and 22,505 tonnes of Nephrops with a value of £70 million (Scottish Government, 2022). Total UK exports of mackerel for the same year was 55,922 tonnes with a value of £96 million, primarily exported to The Netherlands and other EU countries, but also China (SeaFish, 2023). For Nephrops, 24,141 tonnes were exported with a value of £111 million in 2021, primarily exported to France and Spain (SeaFish, 2023). Supermarkets provide around 88% of fish products in the UK by volume and value, and their influence is potentially enough to orchestrate mass scale change in the habits of the public. Pinnegar et al. (2017) reported that Sainsbury’s 2011 “switch the fish” campaign to challenge customers to try an alternative finfish species, including some of those that are more reflective of current climatic conditions in waters around the UK and Ireland, resulted in a significant increase in seabass sales of 57% and pollack sales of 15%. These campaigns may need to be expanded to provide sustainable seafood and avoid climatic maladaptation.
New commercial species that may become available due to climate change may need to be exported to markets where there is already an established demand. These include markets for anchovy, brill, John dory, pouting, seabass, sole, sprat, and turbot, all of which had less than 200 tonnes landed in Scotland in 2021 with a value of less than £1 million. By comparison, in 2021, Scotland’s total anchovy landings were around 1 tonne, whereas the Spanish fishery landed 49,582 tonnes, valued at over €84 million (EUMOFA, 2023; Scottish Government, 2022). Similarly, 30 tonnes of seabass were caught in Scottish waters in 2021, worth approximately £246,000, while French fisheries caught 2,516 tonnes, valued at €36.5 million (EUMOFA, 2023; Scottish Government, 2022). For Scotland to capitalise on these potential emerging opportunities, market access should be established early, as many of the species projected to increase their distribution in Scotland are commercially valuable within foreign markets.
Summary of key findings
The review of literature presented above illustrates a dynamic and uncertain future for the Scottish marine ecosystem and the fisheries it sustains, under the influence of a changing climate. Nevertheless, some key messages are apparent and recurring.
- There are expected to be ecosystem-level impacts due to climate change, which will likely result in distribution and ecological changes to key commercial species in Scottish waters;
- As the distributions of commercial species shift geographically, fishing grounds increase or decrease in importance and weather becomes less predictable, impact on the Scottish fishing industry is inevitable;
- Climate changes stresses could result in impacts on the value and utility of traditional MSY assessments, and a review of these may be required;
- Climate change, in time, may alter the effectiveness of area-based management tools due to fish species motility and therefore, protected sites where the objective is to increase biodiversity may be more resilient with time;
- Limiting the pressure from disruptive fishing methods may increase resilience of inshore ecosystems to the impacts of climate change;
- Redistribution of commercial species around Scotland may lead to new opportunities for the industry, but the supporting network of the industry (consumers, supermarkets etc.) needs to work in step to support diversification.
These findings point to a series of fisheries management challenges:
- The monitoring of productivity and distribution of commercially and ecologically important species;
- Transformational changes in management systems of international and local agreements regarding food stability, the introduction of new commercial species, and fishing quotas;
- The review of traditional MSY approaches, to ensure MSY and carrying capacity targets are met in the face of climate challenges;
- The use of area-based management tools to help buffer marine communities against climate change through increasing biodiversity;
- The management of fishing pressure to be adaptive and flexible going forward as fish populations may become more vulnerable in the presence of stressors such as overfishing or less resilient fishing practices;
- Changes in the habits of consumers, through supermarket campaigns, may also be needed to promote sustainable local seafood and avoid climatic maladaptation as well.
These key finding and challenges inform the following section discussing options for adaptation and development of future policy.
Current policy
Current strategies
Current strategies for fisheries management in Scotland incorporate scientific advice from organisations such as ICES on the status of fish stocks in the North Atlantic and the sustainable use of marine resources. Scotland, like other European countries, relies on ICES assessments to inform fisheries management decisions and many commercial stocks are jointly managed with other Coastal States.
The Marine Directorate is responsible for the management of fishing vessels in Scotland through implementing rules and policies in relation to sustainable harvest and protecting the marine environment. At a UK level, the Marine Directorate works with a number of other organisations and governmental departments including the Department for Environment Food and Rural Affairs (Defra), the Marine Management Organisation (MMO) and Seafish. Marine Directorate uses ICES advice in order to inform quotas and implement fishing limits.
Scotland’s Fisheries Management Strategy 2020-2030, also known as the Future Fisheries Management (FFM) Strategy, is a strategy implemented by the Scottish Government which outlines the approach to managing Scottish fisheries from 2020 to 2030 as part of the Blue Economy Action Plan. The FFM Strategy sits broadly within Scotland’s National Marine Plan (NMP) framework. It encompasses issues such as ecosystem-based management, spatial management and MPAs, recycling of gear, climate change mitigation and adaptation plans, and stakeholder collaboration and community involvement. The FFM Strategy complements the objectives set out in the UK Fisheries Act (2020) and subsequently the input into the Joint Fisheries Statement (JFS).
There are systems in place for co-management within the Marine Directorate where groups such as the Fisheries Management and Conservation Group (FMAC) and the Regional Inshore Fisheries Groups (RIFGs) are consulted both formally and informally to gain insight into the issues that stakeholders face and encourage buy in.
The Scottish National Adaptation Plan (SNAP), formerly Scottish Climate Change Adaptation Programme (SCCAP), is a five-year programme that aims to help prepare and adapt Scotland for climate change. Public consultation on the SNAP for 2024 – 2029 has recently been opened by the Scottish Government (Scottish Government, 2024). With a focus on five outcomes (i) Nature Connects; ii) Communities; iii) Public Services and Infrastructure; iv) Economy, Industry and Business; v) International Action), it is hoped that this programme will help fulfil the aims in relation to Scottish fisheries.
Challenges and barriers
Future policies may require increased focus on adaptability and flexibility in order to achieve successful management of Scottish fisheries.
As fish stocks shift distributions, it is possible that shifts across international boundaries can occur as previously discussed. Effective management requires collaboration and coordination with neighbouring countries. International agreements and cooperation may be challenged by varying interests and priorities. Another challenge is the introduction of new species moving into Scottish waters that may not have established markets causing issues with domestic consumer preferences. This may increase the need to export which does not align with Scotland’s goals in relation to emissions and is less sustainable. Due to the growing variability of weather patterns as a result of climate change, there is also potential for challenges to arise in ability of fishermen to access fish stocks and meet effort-day targets.
Some species at the margin of their distribution are more vulnerable to exploitation (Rindorf et al., 2020). As such, knowledge of fish distribution is key to understand and manage these resources. Knowledge gaps surrounding this area of research is also a barrier. Due to changes in distribution, established MPAs for specific species may also be less beneficial to the target species in light of climate change.
This review has highlighted the importance of adaptability and flexibility in the fisheries management system.
Recommendations and conclusions
Recommendations for policy development, implementation, and monitoring
Following from the key findings of the literature review, here we recommend ideas for policy development, including methods for implementation and monitoring that will allow commercial fisheries management to become more adaptable in an uncertain future and address potential challenges the fishing industry might face. These recommendations and actions aim to enable effective, resilient and adaptable management by encouraging a balanced, realistic approach that reflects actual environmental changes rather than worst case scenarios or global fisheries predictions.
Baseline monitoring programmes
The types of habitats and related fisheries need to be further understood for specific fisheries and sectors within Scotland to enable better understanding of the capacity for adaptation and how best to support the industry in future. Therefore, research needs to be prioritised to fill significant evidence gaps or reduce uncertainty in the current level of understanding to assess the need for additional action. Further discussion of data gaps and suggested future research can be found in Section 5.2.
Risk / vulnerability assessments
As part of policy implementation and monitoring, climate risk assessments enable preparation and prioritisation. At a national level, a climate vulnerability assessment of Scotland’s marine environment and economy (Winne et al. 2022), identified and evaluated methodologies and suggested how to strengthen and enhance vulnerability assessments. Risk or vulnerability assessments conducted at a local level could identify the most significant threats to individual fisheries under various future climate change scenarios, which would enable local fisheries to identify their level of exposure and vulnerability to climate change to prioritise adaptive capacity at both ecological and socio-economic levels. The assessment outputs would result in comparative and risk-equivalent advice (eg prioritising restoration of key habitats such as nursery or spawning habitats for commercial fish species).
Trigger points
The outputs of modelling, alongside outputs from risk assessments, may be used to inform a trigger-based approach system for fast implementation of actions and to tackle the issues around food availability and security. Triggers may be based around ‘tipping points’ identified by risk assessments and reaching such a trigger would activate a pre-determined sequence of actions.
Using indicative metrics (ie thresholds or targets) such as physical parameters eg temperature, monitoring data (eg egg counts) or catch metrics (MSY or bycatch levels) could be used to enable fishing fleets to adapt to maximise the potential access to new commercial species without over or under compensating. Similarly bycatch levels could be used to understand distribution shifts of new species. A multitude of metrics could be used to set triggers on a local scale, either as a single trigger point, a ‘limit’ of acceptable change or several triggers as part of a fishery’s adaptive pathway (eg a trigger ‘to plan’ and potentially another trigger ‘to act’ to base an intervention response on) as part of its strategy. A trigger-based system is already adopted by ICES using reference points such as MSY Btrigger, a pre-determined trigger level for spawning stock biomass, as a metric.
Set triggers would force the review of data to ensure robust informative action, which would also increase flexibility and adaptability. It would require that a level of planning and research has been implemented, which would allow management decisions to be based on sound knowledge and understanding, rather than on transient global or political pressures.
Dynamic MSY reference points
Striving to regenerate stocks will strengthen the resilience of the stock to short-term stresses, promote genetic diversity within populations, and allow for a buffer in a changing climate. Pretty Good Yield (PGY) has been proposed in the past to account for uncertainty of estimation and implementation of MSY. The aim is to manage fishing mortality within certain boundaries of FMSY. MSY is modelled using population parameters such as mortality rates and recruitment and does not directly consider environmental variables. Instead, any significant change to a stock assessment also leads to a revision in FMSY, and Scottish Government scientists suggest that these regular revisions serve to account for ongoing climate change. A better understanding of climate change processes may allow for climatic and other environmental variables to be explicitly factored into MSY calculations and stock assessments. This will likely further increase fisheries resilience through improving the ability to forecast and provide more accurate reference points to inform quotas. Due to the unpredictability and rate of climate change, the use of historical trends may not be sufficient going forward.
Collaboration with stakeholders and co-management
Co-management is an increasingly important asset to help reduce barriers to management that are generally perceived as top-down. Using this more inclusive method of management, taking into account the perspectives of different stakeholders and ensuring their needs are represented will encourage buy in to new policies and success of initiatives. Co-management strategies are already in place, as discussed in Section 4.1, with the FFM Strategy having a strong focus on co-management at both local and national levels. Continuing to build on these relationships, strengthen the framework and increase trust will support the recommended policy changes. However, it will be important to consolidate the definition of co-management incorporating what it means for all stakeholders to ensure policy, industry and science are using the same definition and are working towards the same goals. Utilising the skills and practical knowledge of fishermen and incorporating that into policy is a key factor in moving forward with fisheries management in general, but also in the context of climate change. Another strategy to aid policy implementation and monitoring involves emphasis on international collaboration. Exploring partnerships with neighbouring countries and international organisations will be vital to help address shared challenges.
Aligning and coordinating fisheries policy with other policies that may impact fisheries management directly or indirectly (eg MPA management) is of vital importance to track the dissemination of knowledge and informed actions and decisions. Relationships alongside international foundations will also help to manage shared seas and fish stocks in partnership.
The policy suggestions above would result in various tools which could be used by the industry and communicated with marine stakeholders. The tools would require information to be fed from these stakeholders into those systems (eg fishermen observing changes in species or size and alerting fisheries policy) to be effective, creating a virtuous circle between stakeholders, policymakers and the industry. Supermarkets are just one of these stakeholders, who play a major role in increasing demand for new commercial species by educating consumers about new commercial species and supplying new domestic consumer preferences to the market.
Sustainable fishing practices
There are many methods that can be adopted to help aid the sustainability of fishing practices in Scotland. As fish stock distributions shift, the distance travelled from ports may increase, potentially resulting in increased fuel use and increased emissions. Continually exploring and implementing environmentally conscious fishing practices such as the use of fishing gear with lower environmental impact (ie reduced seabed impact, or reduced bycatch) could result in a more resilient ecosystem which should help support fishing activities through higher ecosystem biomass. Utilising seasonal closures where appropriate (for example, in specific areas during critical spawning periods), along with measures in and around known nursery areas can allow fish populations to reproduce without disturbance, building the resilience of the stock for mutual environmental and industry benefit.
Research requirements
Key gaps
As climate change in Scottish waters progresses, it is important that future policies account for a complete picture of the marine ecosystem to ensure effective fisheries management measures are put in place that are resilient, flexible and adaptive. Ecologically, changes to plankton and fish distribution shifts may need to be evaluated on a larger scale to inform fishing quotas and management strategies accordingly. Monitoring and tracking the distribution shifts of fish species will also be important for future fisheries management as well as a basic knowledge of the distribution of commercial and non-commercial fish species and areas important to specific life-stages (eg spawning and nursery areas).
In order to improve understanding of the impacts discussed in Section 3, additional information is required to develop knowledge gaps in several areas. Filling these gaps will allow policymakers to continue to make informed decisions to help develop the best possible solutions. Knowledge gaps at the species level could be prioritised to better understand the links between climate warming, plankton, fisheries and top predators (eg marine mammals and seabirds) in more detail to allow for more accurate predictions of future ecosystems (Edwards et al., 2011). Filling these gaps will allow ecosystem-based management decisions to build overall strength in the ecosystem in turn strengthening stock resilience. Other areas to explore may include studying trade-offs between temperature induced changes in body size of individuals occurring at different life stages (Ikpewe et al., 2021), or identifying points in a species’ life cycle where they are most susceptible to the impacts of climate change to minimise human pressures on struggling stocks. Both are vital pieces of information that could help increase productivity and recruitment in stocks.
To further strengthen the adaptive capacity of Scottish fisheries, understanding the rates of genetic adaptation of individual species could be developed to aid in identifying possible future trends. Currently, there is not sufficient research into the variability in projected maximum catch potential and changes in MSY across different regions and scenarios of climate change (Travers-Trolet et al., 2020). Further gaps in knowledge include understanding specific mechanisms through which climate change might affect MSY, such as changes in fishing mortality rates and ecosystem dynamics; effectiveness of different management strategies in mitigating the negative effects of climate change on MSY; effects of climate change on pelagic nutrient supply, such as nitrification rates, and how these impacts translate to changes in fish biomass and fisheries yield (van Leeuwen et al., 2016), and finally; impacts of stresses induced by climate change on stock trajectory (Bastardie et al., 2022). There is a growing need for monitoring programs and pilot studies to support policymakers with scientific evidence regarding the effects of different warming scenarios on MSY, and to align research needs with policy ambition.
The effectiveness of applying caps to limit inshore fishing should be discussed further to make the most informed decisions. Along with discussing cap limits, the specific impacts of climate change on area-based management are not well understood and require further investigation. Potential interactions between climate change and other stressors, such as pollution or overfishing, which can cause compounding effects on MPAs and the species/ecosystems they are supposed to protect, are not yet fully understood or quantified. There is also uncertainty around the ability of MPAs to protect and restore ecosystems (and in turn, supporting fish stocks) under changing climate conditions due to distribution shifts of stocks, with previously established species vacating designated areas, and new species possibly favouring alternative locations. As with the example of the North-west Orkney NCMPA for the conservation of sandeel, removing a cause of mortality (ie fishing) from an area where climate change effects are identified as high, can allow some buffering effects and improve resilience to climate change. This highlights the requirement for the development of adaptive management strategies in this area. Identifying the range of different policy levers already available to deal with the issues climate change presents would be beneficial. As an example, quota swapping at both the national and sub-national level is a method used already to deal with shifting stocks. Making use of lessons learned from other countries and utilising best practices will be important.
Data and modelling
Enhanced research and monitoring data could result in better understanding of the capacity for Scottish fisheries to adapt. For example, more data at the local scale would help develop understanding of the effects on MSY to inform quotas relevant to the area and differentiate local trends from national or global trends. These could be incorporated as part of the Joint Fisheries Statement Fisheries Management Plans (FMPs). Any monitoring programs will need to be done in accordance with FFM Strategy regulatory and monitoring framework.
It is important to use recent data and model future changes in fish distribution and/or size to give true representation of what is a priority and realistic view of current stocks. The types of modelling recommended include investigating the effects of various climate change scenarios and habitat suitability modelling as described in Section 3.3.2. ICES is developing whole-ecosystem modelling and forecasting methodology to provide advice on climate change impacts (ICES, 2023). Data collected can be fed into these models and projections will be used to inform things such as local trigger points, MSY, TAC and stock assessments. At this stage the focus should be on preparation and gathering of data that can be fed into the models, in preparation for when the capability becomes available in the future. This further research and data collection would also be valuable to inform climate risk assessments for important commercial species so knowledge can be disseminated within the Marine Directorate and to fishermen more easily. Increasing and improving the data base will inform a range of tools and management strategies to address the threat of climate change; one of which would be the use of risk assessments.
Increased research in local regions could result in a stronger evidence base to inform ecological models. The outputs from these models under different climate scenarios may result in more accurate local future projections which could be used to develop actions to inform policy and feed into risk assessments. Examples of these informative actions could include data-driven harvest strategies for species for which new target markets are emerging and the inclusion of environmental variables in stock projections, if further research suggests this will lead to improvements.
Gaps pertaining to modelling and data also need to be met in order to form a complete picture for fisheries policy and adaptation. Models currently do not factor in all possible scenarios, such as changes in the planktonic food web or interactions between increasing temperature and ocean acidification. Incorporation of more data could increase the robustness of models and reduce uncertainty of outputs. For example, the use of a multi-decadal data set with multiple sources for plankton distribution and phenology would be useful in informing distribution shifts and monitoring productivity of the ecosystem as a whole (Holland et al., 2023).
Future research
Here we suggest potential future research topics which may help to fill the gaps identified through this literature review and enhance wider understanding of the key driving factors behind the expected changes in fish stocks and the fishing industry.
Species distribution and ecology
A key research area is to refine knowledge of current distributions of both commercial and non-commercial fish species as well as areas relevant to key parts of their life cycle (eg spawning and nursery areas) to identify where management measures are necessary and determine margins. Additionally, studying distribution shifts to identify areas where new commercial species may become available will be beneficial. Further to this, research into biodiversity implications of climate induced shifts, including, for example, the northward shift of the copepod crustacean C. finmarchicus.
Lifecycle and physiological changes of species (eg early spawning effects and dietary changes with temperature, as seen in the Alaskan Snow Crab in Case Study 2) as well as food chain linkages and multispecies interactions within area closures and MPAs (eg plankton shifts). Finally, research into habitat suitability for Nephrops on the west coast of Scotland would be greatly beneficial given its importance for the region.
Fishing industry
Comparing projected species moving into UK waters against the potential market in the UK, could indicate levels of risk and highlight where markets may need to be further developed. In this case, using a combination of predictive data such as habitat suitability models and evidence of abundances from ICES should provide more robust estimates. Using habitat suitability models alone are unlikely to be robust enough. For example, habitat suitability for haddock was expected to decrease around Scotland from some studies (eg Townhill et al., 2023), but according to ICES abundance estimates, haddock has increased dramatically in recent years. This is also the case for cod and whiting, which raises the need for caution when utilising the predictive power of ecosystem-based fisheries models.
Another potential study stemming from this review could be to investigate the extent to which fishermen have had to alter their fishing practices in recent years as a direct or indirect result of climate change effects. Factors that may be affected could include whether they have had to change or diversify where they fish, invest in different gear types, or whether they have noticed new species in bycatch. A study of this nature would be valuable and would be in line with the increasing desire for co-management among policymakers, industry, and scientists. Obtaining this direct input from the industry is key for informing policy.
Another research area directly relevant to the fishing industry would be to continue to research and implement the use of more environmentally friendly gear types and the corresponding potential benefits on the marine environment, including reduced catch of non-target species and age-groups and reduced seabed disturbance. And finally, we recommend further research into how climate induced shifts in fish stocks away from ports will affect the distances travelled by fishing vessels and therefore fuel use and resulting emissions.
Ultimately, the greater the knowledge base and understanding of our marine environment, the more informed decision making and planning can be, leading to more effective fisheries management. While this report suggests potential areas for focus, marine and fisheries scientists will be best placed to drive future research efforts for maximum environmental and industry benefit.
References
Báez, J.C., Gimeno, L. and Real, R., 2021. North Atlantic Oscillation and fisheries management during global climate change. Reviews in Fish Biology and Fisheries, 31, p.319-336.
Bahri, T., Vasconcellos, M., Welch, D.J., Johnson, J., Perry, R.I., Ma, X. and Sharma, R. eds., 2021. Adaptive management of fisheries in response to climate change: FAO fisheries and aquaculture technical paper No. 667 (Vol. 667). Food & Agriculture Org.
Bastardie, F., Feary, D.A., Brunel, T., Kell, L.T., Döring, R., Metz, S., Eigaard, O.R., Basurko, O.C., Bartolino, V., Bentley, J. and Berges, B., 2022. Ten lessons on the resilience of the EU common fisheries policy towards climate change and fuel efficiency-A call for adaptive, flexible and well-informed fisheries management. Frontiers in Marine Science, 9, p.947150.
Baudron, A. R., Needle, C. L., and Marshall, C. T. 2011. Implications of a warming North Sea for the growth of haddock Melanogrammus aeglefinus. Journal of Fish Biology, 78(7), p.1874-1889.
Baudron, A.R., Brunel, T., Blanchet, M.A., Hidalgo, M., Chust, G., Brown, E.J., Kleisner, K.M., Millar, C., MacKenzie, B.R., Nikolioudakis, N. and Fernandes, J.A., 2020. Changing fish distributions challenge the effective management of European fisheries. Ecography, 43(4), p.494-505.
Baudron, A.R., Needle, C.L., Rijnsdorp, A.D. and Marshall, C., 2014. Warming temperatures and smaller body sizes: synchronous changes in growth of North Sea fishes. Global Change Biology, 20(4), pp.1023-1031.
Brander, K.M., 2010. Cod Gadus morhua and climate change: processes, productivity and prediction. Journal of Fish Biology, 77(8), p.1899-1911.
Breitburg, D., Levin, L.A., Oschlies, A., Grégoire, M., Chavez, F.P., Conley, D.J., Garçon, V., Gilbert, D., Gutiérrez, D., Isensee, K. and Jacinto, G.S., 2018. Declining oxygen in the global ocean and coastal waters. Science, 359(6371), p.eaam7240.
Bresnan, E., Davidson, K., Edwards, M., Fernand, L., Gowen, R., Hall, A., Kennington, K., McKinney, A., Milligan, S., Raine, R. and Silke, J., 2013. Impacts of climate change on harmful algal blooms. MCCIP Science Review 2013: 236-243
Brooker, E., Devenport, E., Hopkins, C.R., Hennige, S., Roberts, J.M. and Duncan, C., 2018. Scotland as a case study for how benefits of marine ecosystem services may contribute to the commercial fishing industry. Marine Policy, 93, pp.271-283.
Bruge, A., Alvarez, P., Fontán, A., Cotano, U., and Chust, G. 2016. Thermal niche tracking and future distribution of Atlantic mackerel spawning in response to ocean warming. Frontiers in Marine Science, 3, p.1-13.
Brunel, T., van Damme, C.J., Samson, M. and Dickey‐Collas, M. 2018. Quantifying the influence of geography and environment on the northeast Atlantic mackerel spawning distribution. Fisheries Oceanography, 27. P.159–173.
Buxton, C.D., Hartmann, K., Kearney, R. and Gardner, C., 2014. When is spillover from marine reserves likely to benefit fisheries?. PloS One, 9(9), p.e107032.
Cameron, L.P., Reymond, C.E., Müller-Lundin, F., Westfield, I., Grabowski, J.H., Westphal, H. and Ries, J.B., 2019. Effects of temperature and ocean acidification on the extrapallial fluid pH, calcification rate, and condition factor of the king scallop Pecten maximus. Journal of Shellfish Research, 38(3), pp.763-777.
Cheung, W.W., Frölicher, T.L., Lam, V.W., Oyinlola, M.A., Reygondeau, G., Sumaila, U.R., Tai, T.C., the, L.C. and Wabnitz, C.C., 2021. Marine high temperature extremes amplify the impacts of climate change on fish and fisheries. Science Advances, 7(40), p.eabh0895.
Cheung, W.W., Pinnegar, J., Merino, G., Jones, M.C. and Barange, M., 2012. Review of climate change impacts on marine fisheries in the UK and Ireland. Aquatic Conservation: Marine and Freshwater Ecosystems, 22(3), pp.368-388
Cheung, W.W., Dunne, J., Sarmiento, J.L. and Pauly, D., 2011. Integrating ecophysiology and plankton dynamics into projected maximum fisheries catch potential under climate change in the Northeast Atlantic. ICES Journal of Marine Science, 68(6), pp.1008-1018.
Cheung, W.W., Brodeur, R.D., Okey, T.A. and Pauly, D., 2015. Projecting future changes in distributions of pelagic fish species of Northeast Pacific shelf seas. Progress in Oceanography, 130, pp.19-31.
Cheung, W.W., Lam, V.W., Sarmiento, J.L., Kearney, K., Watson, R.E.G., Zeller, D. and Pauly, D., 2010. Large‐scale redistribution of maximum fisheries catch potential in the global ocean under climate change. Global Change Biology, 16(1), pp.24-35.
Clausen, L.W., Rindorf, A., van Deurs, M., Dickey‐Collas, M. and Hintzen, N.T., 2017. Shifts in North Sea forage fish productivity and potential fisheries yield. Journal of Applied Ecology, 55(3), p.1092-1101.
Colléter, M., Gascuel, D., Albouy, C., Francour, P., de Morais, L.T., Valls, A. and Le Loc’h, F., 2014. Fishing inside or outside? A case studies analysis of potential spillover effect from marine protected areas, using food web models. Journal of Marine Systems, 139, pp.383-395.
Cormon, X., Kempf, A., Vermand, Y., Vinther, M. and Marchal, P., 2016. Emergence of a new predator in the North Sea. 2016. ICES Journal of Marine Science, 73(5), P. 1370–138. https://doi.org/10.1093/icesjms/fsw050
Davies, B.F., Holmes, L., Rees, A., Attrill, M.J., Cartwright, A.Y. and Sheehan, E.V., 2021. Ecosystem Approach to Fisheries Management works—How switching from mobile to static fishing gear improves populations of fished and non‐fished species inside a marine‐protected area. Journal of Applied Ecology, 58(11), pp.2463-2478.
Edwards, M., Atkinson, A., Bresnan, E., Helaouet, P., McQuatters-Gollop, A., Ostle, C., Pitois, S. and Widdicombe, C., 2020. Plankton, jellyfish and climate in the North-East Atlantic. MCCIP Science Review, 2020, pp.322-353.
Edwards, M., Bresnan, E., Cook, K., Heath, M., Helaouet, P., Lynam, C., Raine, R. and Widdicombe, C., 2013. Impacts of climate change on plankton. MCCIP Science Review, 2013, pp.98-112.
Edwards, M., M. Heath and A. McQuatters-Gollop, 2011. Plankton in MCCIP Annual Report Card 2010-11, MCCIP Science Review, p.10.
Engelhard, G.H., Righton, D.A. and Pinnegar, J.K., 2014. Climate change and fishing: a century of shifting distribution in North Sea cod. Global Change Biology, 20(8), p.2473-2483.
Epstein, G., Middelburg, J.J., Hawkins, J.P., Norris, C.R. and Roberts, C.M. (2022) The impact of mobile demersal fishing on carbon storage in seabed sediments. Global Change Biology 28, 2875-2894.
Epstein, G. and Roberts, C.M., 2023. Does biodiversity‐focused protection of the seabed deliver carbon benefits? A UK case study. Conservation Letters, 16(1), p.e12929.
EUMOFA (European Market Observatory for Fisheries and Aquaculture Products) 2023. Fishery Landings Comparison between countries. https://eumofa.eu/data#landingsTab
Fernandes, J.A., Papathanasopoulou, E., Hattam, C., Queirós, A.M., Cheung, W.W., Yool, A., Artioli, Y., Pope, E.C., Flynn, K.J., Merino, G. and Calosi, P., 2016. Estimating the ecological, economic and social impacts of ocean acidification and warming on UK fisheries. Fish and Fisheries, 18(3), pp.389-411.
Findlay, H.S., Artoli, Y., Birchenough, S.N.R., Hartman, S., León, P. and Stiasny, M., 2022. Ocean Acidification around the UK and Ireland. MCCIP Science Review 2022.
Forster, J., Hirst, A.G. and Atkinson, D., 2012. Warming-induced reductions in body size are greater in aquatic than terrestrial species. Proceedings of the National Academy of Science. 109, p.19310–19314. https://doi.org/10.1073/pnas.1210460109
Frost, M. and Diele, K., 2022. Essential spawning grounds of Scottish herring: current knowledge and future challenges. Reviews in Fish Biology and Fisheries, 32(3), pp.721-744.
Gaines, S.D., Costello, C., Owashi, B., Mangin, T., Bone, J., Molinos, J.G., Burden, M., Dennis, H., Halpern, B.S., Kappel, C.V. and Kleisner, K.M., 2018. Improved fisheries management could offset many negative effects of climate change. Science Advances, 4(8), p.eaao1378.
Grafton, R.Q., Squires, D. and Steinshamn, S.I., 2023. Towards resilience-based management of marine capture fisheries. Economic Analysis and Policy, 77, pp.231-238.
Gullestad, P., Sundby, S. and Kjesbu, O.S., 2020. Management of transboundary and straddling fish stocks in the Northeast Atlantic in view of climate-induced shifts in spatial distribution. Fish ,21. P.1008–1026. https://doi.org/10.1111/faf.12485
Harte, M., Tiller, R., Kailis, G. and Burden, M., 2019. Countering a climate of instability: the future of relative stability under the Common Fisheries Policy. ICES Journal of Marine Science, 76(7), pp.1951-1958.
HM Government, 2022. UK Climate Change Risk Assessment 2022. Presented to Parliament pursuant to Section 56 of the Climate Change Act 2008. https://www.gov.uk/government/publications/uk-climate-change-risk-assessment-2022
Holland, M.M., Louchart, A., Artigas, L.F., Ostle, C., Atkinson, A., Rombouts, I., Graves, C.A., Devlin, M., Heyden, B., Machairopoulou, M. and Bresnan, E., 2023. Major declines in NE Atlantic plankton contrast with more stable populations in the rapidly warming North Sea. Science of The Total Environment, 898, p.1-11.
Hopkins, C.R., Bailey, D.M. and Potts, T., 2016. Scotland’s Marine Protected Area network: reviewing progress towards achieving commitments for marine conservation. Marine Policy, 71, pp.44-53.
Hoppit, G., Schmidt, D.N., Brazier, P., Mieszkowska, N. and Pieraccini, M., 2022. Are marine protected areas an adaptation measure against climate change impacts on coastal ecosystems? A UK case study. Nature-Based Solutions, 2, p.100030.
Howarth, L.M., 2012. Exploring the fishery and ecological effects of Lamlash Bay no-take zone. Science report for Community of Arran Seabed Trust.
Huang, M., Ding, L., Wang, J., Ding, C. and Tao, J., 2021. The impacts of climate change on fish growth: A summary of conducted studies and current knowledge. Ecological Indicators, 121, p.106976.
Hughes, K.M., Dransfeld, L. and Johnson, M.P., 2014. Changes in the spatial distribution of spawning activity by north-east Atlantic mackerel in warming seas: 1977–2010. Marine Biology, 161. P.2563–2576. http://dx.doi.org/10.1007/s00227-014-2528-1
Hunter, A., Speirs, D.C. and Heath, M.R., 2019. Population density and temperature correlate with long-term trends in somatic growth rates and maturation schedules of herring and sprat. PloS One, 14(3), p.e0212176.
ICES, 2021. Data for OSPAR request on the production of spatial data layers of fishing intensity/pressure. Data outputs. Dataset. https://doi.org/10.17895/ices.data.8294
ICES, 2023. Integrated Ecosystem Assessments Steering Group. https://www.ices.dk/community/groups/Pages/IEASG.aspx
Ikpewe, I.E., Baudron, A.R., Ponchon, A. and Fernandes, P.G., 2021. Bigger juveniles and smaller adults: Changes in fish size correlate with warming seas. Journal of Applied Ecology, 58(4), p.847-856.
Jansen, T., and Gislason, H., 2011. Temperature affects the timing of spawning and migration of North Sea mackerel. Continental Shelf Research, 31(1), p.64-72.
JNCC, 2021. North-West Orkney MPA. https://jncc.gov.uk/our-work/north-west-orkney-mpa
Jones, M. C., Dye, S. R., Pinnegar, J. K., Warren, R., and Cheung, W. W., 2015. Using scenarios to project the changing profitability of fisheries under climate change. Fish and Fisheries, 16(4), p.603-622.
Kamenos, N.A., Moore, P.G. and Hall-Spencer, J.M., 2004a. Nursery-area function of maerl grounds for juvenile queen scallops Aequipecten opercularis and other invertebrates. Marine Ecology Progress Series, 274, p.183-189.http://www.int-res.com/abstracts/meps/v274/p183-189/.
Kamenos, N.A., Moore, P.G. and Hall-Spencer, J.M., 2004b. Small-scale distribution of juvenile gadoids in shallow inshore waters; what role does maerl play?. ICES Journal of Marine Science, 61(3), pp.422-429. https://doi.org/10.1016/j.icesjms.2004.02.004
Kaschner, K., J. Rius-Barile, K. Kesner-Reyes, C. Garilao, S.O. Kullander, T. Rees, T. and Froese, R., 2010. AquaMaps: Predicted range maps for aquatic species. World wide web electronic publication. https://www.aquamaps.org/
Kemp, P.S., Subbiah, G., Barnes, R., Boerder, K., O’Leary, B.C., Stewart, B.D. and Williams, C., 2023. The future of marine fisheries management and conservation in the United Kingdom: Lessons learnt from over 100 years of biased policy. Marine Policy, 147, p.105075.
Kristiansen, T., Stock, C., Drinkwater, K.F. and Curchitser, E.N., 2014. Mechanistic insights into the effects of climate change on larval cod. Global Change Biology, 20(5), p.1559-1584.
Kühn, B., Kempf, A., Brunel, T., Cole, H., Mathis, M., Sys, K., Trijoulet, V., Vermard, Y. and Taylor, M., 2023. Adding to the mix–Challenges of mixed‐fisheries management in the North Sea under climate change and technical interactions. Fisheries Management and Ecology, 30, p.360-377.
Lindegren, M., Möllmann, C., Nielsen, A., Brander, K., MacKenzie, B.R. and Stenseth, N.C., 2010. Ecological forecasting under climate change: the case of Baltic cod. Proceedings of the Royal Society B: Biological Sciences, 277(1691), pp.2121-2130.
Marine Scotland, 2023. National Marine Plan Interactive. https://marinescotland.atkinsgeospatial.com/nmpi/
Marshall, C. T., Baudron, A. R., Fallon, N. G. and Spencer, P., (2019). FIS workshop on Global synthesis of climate impacts on fish distribution and growth and implications for Scottish fisheries: FIS028. A Study Commissioned by Fisheries Innovation Scotland (FIS), https://fisorg.uk/
Mason, J.G., Woods, P.J., Thorlacius, M., Guðnason, K., Saba, V.S., Sullivan, P.J. and Kleisner, K.M., 2021. Projecting climate-driven shifts in demersal fish thermal habitat in Iceland’s waters. ICES Journal of Marine Science, 78(10), p.3793-3804.
Maureaud, A., Frelat, R., Pécuchet, L., Shackell, N., Mérigot, B., Pinsky, M.L., Amador, K., Anderson, S.C., Arkhipkin, A., Auber, A. and Barri, I., 2020. Are we ready to track climate‐driven shifts in marine species across international boundaries? ‐A global survey of scientific bottom trawl data. Global Change Biology, 27(2), p.220-236.
McQueen, K. and Marshall, C. T., 2017. Shifts in spawning phenology of cod linked to rising sea temperatures, ICES Journal of Marine Science, 74 (6). P.1561–1573. https://doi.org/10.1093/icesjms/fsx025
McGeady, R., Lordan, C. and Power, A.M., 2021. Shift in the larval phenology of a marine ectotherm due to ocean warming with consequences for larval transport. Limnology and Oceanography, 66(2), pp.543-557.
Moffat, C., Baxter, j., Berx, B., Bosley, K., Boulcott, P., Cox, M., Cruickshank, L., Gillham, K., Cox, A., Haynes, V., Roberts, A., Vaughan, D., and Webster, L., 2020. Scotland’s Marine Assessment 2020. Scottish Government.
Montero‐Serra, I., Edwards, M. and Genner, M.J., 2015 Warming shelf seas drive the subtropicalization of European pelagic fish communities. Global Change Biology, 21, p.144–153.
Núnez-Riboni, I., Taylor, M. H., Kempf, A., Püts, M., and Mathis, M., 2019. Spatially resolved past and projected changes of the suitable thermal habitat of North Sea cod (Gadus morhua) under climate change. ICES Journal of Marine Science, 76(7), p.2389-2403.
Ojea, E., Pearlman, I., Gaines, S.D. and Lester, S.E., 2016. Fisheries regulatory regimes and resilience to climate change. Ambio, 46, pp.399-412.
Ojea, E., Fontán, E., Fuentes-Santos, I. and Bueno-Pardo, J., 2021. Assessing countries’ social-ecological resilience to shifting marine commercial species. Scientific Reports, 11(1), p.22926.
Olin, A.B., Banas, N.S., Johns, D.G., Heath, M.R., Wright, P.J. and Nager, R.G., 2022. Spatio-temporal variation in the zooplankton prey of lesser sandeels: species and community trait patterns from the Continuous Plankton Recorder. ICES Journal of Marine Science, 79(5), p.1649-1661.
OSPAR, 2023. Pelagic Habitats Thematic Assessment. In: OSPAR, 2023: Quality Status Report 2023. OSPAR Commission, London. Available at: https://oap.ospar.org/en/ospar-assessments/quality-status-reports/qsr-2023/thematic-assessments/pelagic-habitats/
Payne, M.R., Kudahl, M., Engelhard, G.H., Peck, M.A. and Pinnegar, J.K., 2021. Climate risk to European fisheries and coastal communities. Proceedings of the National Academy of Sciences, 118(40), p.e2018086118.
Pinnegar, J.K., Buckley, P. and Engelhard, G.H., 2017. Impacts of climate change in the United Kingdom and Ireland. Climate Change Impacts on Fisheries and Aquaculture: A Global Analysis, 1, p.381-413. https://doi.org/10.1002/9781119154051.ch12
Pinnegar, J.K., Cheung, W.W., Jones, M., Merino, G., Turrell, B. and Reid, D., 2013. Impacts of climate change on fisheries. MCCIP Sci Rev, 2013, p.302-317.
Pinsky, M.L., Fenichel, E., Fogarty, M., Levin, S., McCay, B., St. Martin, K., Selden, R.L. and Young, T., 2020. Fish and fisheries in hot water: What is happening and how do we adapt?. Population Ecology, 63(1), p.17-26.
Pitois, S.G., Lynam, C.P., Jansen, T., Halliday, N. and Edwards, M., 2012. Bottom-up effects of climate on fish populations: data from the Continuous Plankton Recorder. Marine Ecology Progress Series, 456, p.169-186. https://doi.org/10.3354/meps09710
Prokešová, M., Gebauer, T., Matouˇsek, J., Lundov´a, K., ˇCejka, J., Zuskov´a, E. and Stejskal, V., 2020. Effect of temperature and oxygen regime on growth and physiology of juvenile Salvelinus fontinalis × Salvelinus alpinus hybrids. Aquaculture, 522, p. e735119. https://doi.org/10.1016/j.aquaculture.2020.735119
Régnier, T., Gibb, F.M. and Wright, P.J.,2017. Importance of trophic mismatch in a winter- hatching species: evidence from lesser sandeel. Marine Ecology Progress Series, 567, p.185-197.
Régnier, T., Gibb, F.M. and Wright, P.J., 2019. Understanding temperature effects on recruitment in the context of trophic mismatch. Scientific Reports, 9(1), p.15179.
Rindorf, A., Gislason, H., Burns, F., Ellis, J.R. and Reid, D., 2020. Are fish sensitive to trawling recovering in the Northeast Atlantic? Journal of Applied Ecology, 57(10), pp.1936-1947.
Rindorf, A., Mumford, J., Baranowski, P., Clausen, L.W., García, D., Hintzen, N.T., Kempf, A., Leach, A., Levontin, P., Mace, P. and Mackinson, S., 2017. Moving beyond the MSY concept to reflect multidimensional fisheries management objectives. Marine Policy, 85, pp.33-41.
Ryan M, R. and Bailey D, M, 2012. Trawling and dredging in the Clyde sea area: history, impacts and prospects for Recovery. University of Glasgow
Schmidt, D.N., Pieraccini, M. and Evans, L., 2022. Marine protected areas in the context of climate change: key challenges for coastal social-ecological systems. Philosophical Transactions of the Royal Society B, Biological Sciences, 377(1854), p.20210131.
Scottish Government, 2020. Scotland’s Fisheries Management Strategy 2020-2030. https://www.gov.scot/publications/scotlands-future-fisheries-management-strategy-2020-2030/
Scottish Government, 2022. Scottish Sea Fisheries Statistics 2021. https://www.gov.scot/publications/scottish-sea-fisheries-statistics-2022/
Scottish Government, 2024. Climate change – national adaptation plan 2024 to 2029: consultation. https://www.gov.scot/publications/public-consultation-scottish-national-adaptation-plan-2024-2029/pages/3/
SeaFish, 2023. UK Seafood Trade and Tariff Tool. https://public.tableau.com/app/profile/seafish/viz/SeafishTradeandTariffTool/Overview
Serpetti, N., Baudron, A.R., Burrows, N.T., Payne, B.L., Helaouet, P., Fernandes, P.G. and Heymans, J.J., 2017. Impact of ocean warming on sustainable fisheries management informs the Ecosystem Approach to Fisheries. Scientific Reports, 7(1), p.134-138.
Simon-Nutbrown, C., Hollingsworth, P.M., Fernandes., T.F., Kamphausen, L., Baxter, J.M. and Burdett, H.L., 2020 Species distribution modelling predicts significant declines in coralline algae populations under projected climate change with implications for conservation policy. Frontiers in Marine Science 7, p.1–14. https://doi.org/10.3389/fmars.2020.575825
Simpson, S. D., Blanchard, J. L., and Genner, M. G., 2013. Impacts of climate change on fish. MCCIP. 2013: p. 113-124.
Simpson, S. D., Jennings, S., Johnson, M. P., Blanchard, J. L., Schön, P. J., Sims, D. W., and Genner, M. J., 2011. Continental shelf-wide response of a fish assemblage to rapid warming of the sea. Current Biology, 21(18), p.1565-1570.
Stewart, B.D., Howarth, L.M., Wood, H., Whiteside, K., Carney, W., Crimmins, É., O’Leary, B.C., Hawkins, J.P. and Roberts, C.M., 2020. Marine conservation begins at home: how a local community and protection of a small bay sent waves of change around the UK and beyond. Frontiers in Marine Science, 7, p.76.
Stobart, B., Warwick, R., González, C., Mallol, S., Díaz, D., Reñones, O. and Goñi, R., 2009. Long-term and spillover effects of a marine protected area on an exploited fish community. Marine Ecology Progress Series, 384, pp.47-60.
Stoker, B., Turrell, W.R., Robinson, K., Howes, E., Buckley, P.J., Maltby, K. and Matear, L., 2020. Marine Climate Change Impacts: Report Card 2020.
Townhill, B.L., Couce, E., Tinker, J., Kay, S. and Pinnegar, J.K., 2023. Climate change projections of commercial fish distribution and suitable habitat around north western Europe. Fish and Fisheries, 24(5), pp.848-862.
Townhill, B.L., Pinnegar, J.K., Righton, D.A. and Metcalfe, J.D., 2017. Fisheries, low oxygen and climate change: how much do we really know?. Journal of Fish Biology, 90(3), p.723-750.
Travers-Trolet, M., Bourdaud, P., Genu, M., Velez, L. and Vermard, Y., 2020. The risky decrease of fishing reference points under climate change. Frontiers in Marine Science, 7, p.568232.
Van der Kooij, J., Engelhard, G. H., and Righton, D. A., 2016. Climate change and squid range expansion in the North Sea. Journal of Biogeography, 43, p. 2285–2298. https://doi.org/10.1111/jbi.12847
Van Leeuwen, S.M., Le Quesne, W.F. and Parker, E.R., 2016. Potential future fisheries yields in shelf waters: a model study of the effects of climate change and ocean acidification. Biogeosciences, 13(2), p.441-454.
Wilson, K.L., Tittensor, D.P., Worm, B. and Lotze, H.K., 2020. Incorporating climate change adaptation into marine protected area planning. Global Change Biology, 26(6), p.3251-3267.
Winter, A.M., Richter, A. and Eikeset, A.M., 2020. Implications of Allee effects for fisheries management in a changing climate: evidence from Atlantic cod. Ecological Applications, 30(1), p.e01994.
Winne, S., Pritchard, A., Kennedy, S., and O’Gorman, S., 2022. Review of climate vulnerability assessment of Scotland’s marine environment and marine economy. https://www.climatexchange.org.uk/projects/review-of-climate-vulnerability-assessment-of-scotlands-marine-environment-and-marine-economy/
Wright, P.J., Orpwood, J.E. and Boulcott, P., 2017. Warming delays ovarian development in a capital breeder. Marine Biology, 164, pp.1-9.
Wright, P.J., Pinnegar, J.K. and Fox, C.J., 2020. Impacts of climate change on fish, relevant to the coastal and marine environment around the UK. MCCIP Science Review 2020, 354–381.
Appendices
Appendix A: Methodological Approach
|
Key Words |
Key species |
|
Fisheries and Scotland and climate risk resilience policy and climate change |
Cod |
|
Climate change and distribution shifts and Scotland and cod or herring |
Haddock |
|
Climate change and distribution shifts and Scotland and hake or mackerel |
Hake |
|
Climate change and distribution shifts and Scotland and blue whiting or haddock |
Herring |
|
Monkfish or angler fish and climate change and UK |
Mackerel |
|
Climate change and distribution shifts and Scotland and saithe |
Nephrops |
|
Climate change and distribution shifts and Nephrops |
Monkfish (or anglerfish) |
|
Climate change and Scotland and sandeels or plankton |
Saithe |
|
Blue economy or marine economy and fisheries and Scotland and climate change |
Whiting |
|
MPA and fisheries and Scotland and climate risk resilience policy or climate change | |
|
Climate change and Scotland and fisheries and plankton and bottom up control | |
|
Ocean acidification and climate change and fisheries and Scotland | |
|
Climate change and Scotland and risk to marine habitats or marine species | |
|
Shifting commercial species or sustainable fisheries management and climate risk resilience policy and Scotland | |
|
Maladaptation and Lock In and UK |
Overall, 212 documents were identified with potential relevance to the current study. These sources were reassessed in line with the inclusion criteria by CXC and BMT and rated accordingly. A spread of this literature covering multiple regions and years is broken down in Figure 1. Following the literature ratings, a list of 150 of the identified sources were given priority for the purpose of this report following screening.
As a note, studies were assessed against the aims of this paper, not against the authors own aims. Many of the studies assessed, while partially relevant to our study, focused on specific aspects of fisheries, such as environmental impacts or future distribution predictions. As such, there are identified limitations of each source with respect to how each source aligns with this paper’s assessment parameters and research questions.
Figure 1: Number of literature sources included as part of the study by region and year
Scoring was done for each source according to their quality based on five questions: (a) what is the sample/study population, (b) research design and methodology of the source, (c) interpretation of the results, (d) limitations of the study, and (e) level of uncertainty. The significance was then calculated based on the year of publication (5%) study type (observed or predictive) (5%) relevance of the paper (75%) and the number of research questions answered (15%). Sources were given a score for significance of High (<75%) Medium (75-60%) or Low (>60). The level of confidence was then calculated using the scores from quality and significance and the formula C=f(QS,).
An online workshop was conducted by the project team on 7th September 2023 a total of nineteen delegates from the fishing industry, regulatory and advisory bodies, and research community were invited; of these, nine attended the workshop, representing the following organisations: Scottish Government, CEFAS, JNCC, SEPA, University of Aberdeen, University of the Highlands and Islands, Seafish and the Scottish Whitefish Producers Association. The workshop was run over four hours, with discussion of the five main questions posed as the focus of this study.
Appendix B: Predictive habitat suitability maps
The data presented below regarding habitat suitability for economically significant fish species in the UK are derived from modelling outputs produced by Townhill et al. (2023). While predictive models may not forecast the future with absolute precision, they offer valuable insights into potential outcomes under various emissions scenarios, aiding in the understanding of potential future developments in the marine environment. This information is instrumental in guiding decision-making and formulating strategies to mitigate risks and optimize opportunities.
The authors selected 49 species for habitat suitability analysis, consulting with scientists and policymakers. The species list includes those currently of commercial importance in the UK, as well as some warm-water species significant in France and Spain but not yet in the United Kingdom. The term ‘habitat suitability’ refers to bathymetry and environmental hydrographic conditions (temperature and salinity) that are suitable for each species, excluding bottom substrate characteristics (due to insufficient regional data) and local species interactions within communities (eg food availability). The study utilized data from the training period of 1997 to 2016 to determine the current habitat suitability of each species, and models were run to calculate 20-year averages from 2010 to 2070.
Climate projections were based on three different future carbon emissions trajectories from two sources: the A1B ‘medium’ emissions scenario from the Coupled Model Intercomparison Project (CMIP) 3 Special Report Emissions Scenarios (SRES) dataset, and the CMIP5 Representative Concentration Pathway (RCP) 4.5 (medium emissions, high mitigation) and 8.5 (high emissions, low mitigation) projections. The A1B model, used in the IPCC Fourth Assessment Report (AR4), envisions rapid economic growth, a global population peaking at 9 billion in 2050, technological advancements, and global convergence in income and lifestyle. The Representative Concentration Pathways (RCPs) was used in the IPCC Fifth Assessment Report (AR5) in 2014. RCP 4.5 is considered an intermediate scenario, while RCP 8.5 is a basis for a worst case climate change scenario thought to be very unlikely, but still possible as feedbacks are not well understood.
Despite using the same datasets and geographic regions in the modelling, habitat suitability outputs for the training period (1997-2016) differed between the RCP and A1B scenarios. The authors employed a comprehensive approach, utilizing multiple models and climate change scenarios. While there were variations in the magnitude of change among models, and certain models performed better for specific species, overall trends in habitat suitability and abundance were consistent across models and climate scenarios. This underscores the importance of employing an ensemble approach, using multiple modelling techniques with diverse climate scenarios to address the uncertainties in climate change projections. The ensemble approach, incorporating five different models, resulted in varying averaged habitat suitability projections for this period, with only Area Under the Curve (AUC) values exceeding 0.7 included in the outputs.


Understanding the impacts of climate change on target fish stocks is of critical importance to supporting and future-proofing the fishing industry and marine economy.
This project used a literature review, alongside expert engagement, to discuss the predicted effects of climate change on fish stocks, the likely effects on the Scottish fishing industry and to provide recommendations to fill information deficits and inform policy.
Key findings
The Scottish marine ecosystem and the fisheries it sustains face a dynamic and uncertain future due to a changing climate:
- Climate change and ocean acidification is expected to have ecosystem-level impacts, which will likely result in distribution and ecological changes to key commercial species in Scottish waters.
- As the distributions of commercial species shift geographically and weather becomes less predictable, fishing grounds increase or decrease in importance.
- Climate change stresses could impact the value and utility of traditional Maximum Sustainable Yield (MSY) assessments, which indicate the maximum quantity of fish that can be caught sustainably.
- Area-based management tools, including single species-protection Marine Protected Areas (MPAs), may become ineffective as conservation and management tools in the long term. This is due to changing distributions, abundances and life histories.
- Limiting the pressure from disruptive fishing methods may increase resilience of inshore ecosystems, such as maerl beds and estuaries, to the impacts of climate change.
- Redistribution of commercial species around Scotland may lead to new opportunities for the industry. However, the supporting network of the industry, such as consumers and supermarkets, needs to work in step to support diversification.
- Ways of strengthening current modelling could be explored. For example, by the factoring in of scenarios such as those relating to ecosystem changes or interactions between increasing temperature and ocean acidification.
For further details, please read the report.
If you require the report in an alternative format, such as a Word document, please contact info@climatexchange.org.uk or 0131 651 4783.