
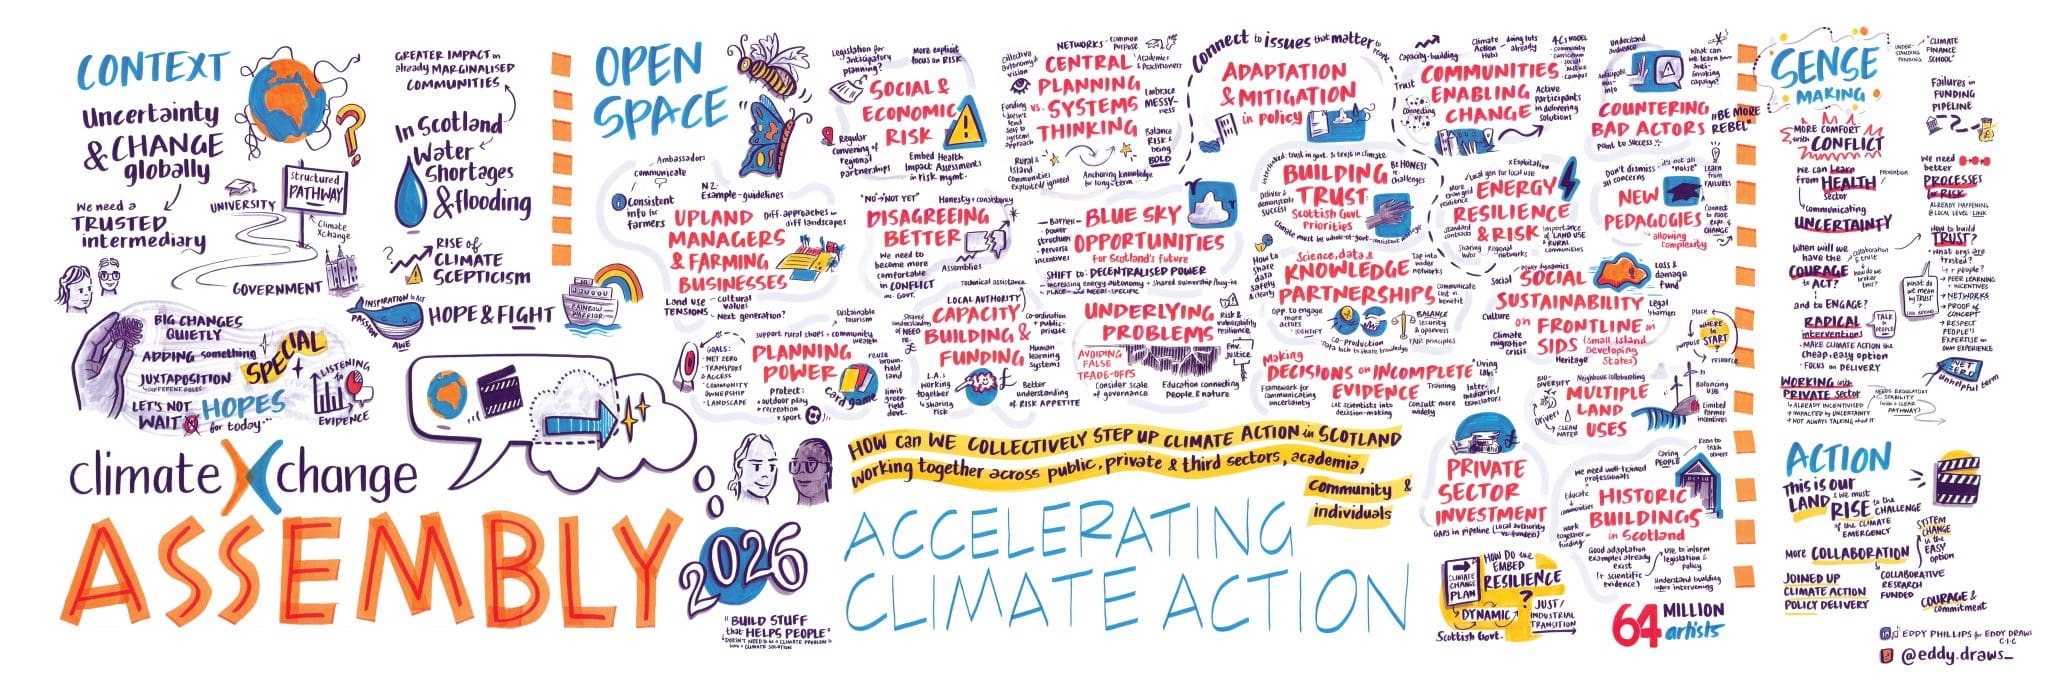
Collaboration, communication, trust and courage were the watchwords of the ClimateXChange Assembly 2026. When we invited climate-focused researchers, public and third sector leaders, and Scottish Government policy makers to our event in February, we challenged attendees to hold bold conversations focused on how we can accelerate climate action in Scotland. Multiple themes emerged from those conversations, but these four concepts were a consistent refrain from the stage and the tables at Dynamic Earth in Edinburgh.
We subtitled our event Accelerating Climate Action. The aim was to explore how we use our knowledge, research and evidence to initiate, scale up and advance climate initiatives. Scotland has ambitious climate targets and plans yet progress on cutting emissions and adapting to the changing climate has been slow.
An Open Space approach
To explore different ways to increase the pace and scale of climate action, we wanted to try something different. So, working with event facilitators 64 Million Artists, we structured the day as an Open Space. The Open Space model is a methodology where participants create their own agenda of parallel discussions on the day around a central question. It is designed to allow a group of people to tackle complex, urgent issues in a creative and engaging way.
This was the central question anchoring our session:
How can we collectively step up climate action in Scotland – working together across public, private and third sectors, academia, communities, and individuals?
In Open Space everyone is welcome to suggest a topic and host a discussion. Once the session is underway, participants are welcome to move between different discussions as they choose. Moving between discussions is actively encouraged in Open Space with the guidance that if you are neither learning nor contributing to the discussion you’re in then you should move on. The methodology is designed to make the best use of the interests, skills and experience of participants.
To kick-start the Open Space process and provide some examples of possible conversations, we had identified six experts to host an Open Space discussion based on their specialism and interest. They were:
- Elliot Ross, Executive Director, Just Transition Commission: “What practical processes would help deliver accurate early warning on critical social and economic risks arising from emissions reduction measures? How can we move from a reactive approach to a strategic, anticipatory one?”
- Dr. Mark Wilkinson, Co-Director of Climate-Positive Farming Initiative, James Hutton Institute: “How can Scottish upland land managers and farm businesses achieve net-zero emissions and protect natural assets without compromising their financial viability?”
- Tuisku (Snow) Kolu, Public Policy Advisor, British Academy: “Can we disagree better? How can national and local governments sustain public support during periods of polarisation and contestation on climate action?”
- Tara Schmidt, Executive Director of Transition Finance Scotland, Sustainable Finance Advisor (CERG): “What funding, coordination, technical assistance and capacity building is needed to help local authorities and regional agencies turn climate ideas into investible project pipelines?”
- George Tarvit, Director, Sustainable Scotland Network: “Central Planning versus Systems Thinking – what forms of leadership, collaboration and coordination are needed to turn national climate plans into local climate delivery at scale and pace?”
- Jeff Pyrah, Senior Planner (Forward Planning), Cairngorms National Park Authority: “Planning power: how can a card game inform policy? Creating planning policy to address the climate emergency in the Cairngorms National Park”
Following short provocations from these six hosts, we invited the remainder of the Assembly’s 100 or so participants to suggest additional topics that they saw as critical for inclusion. In total, 14 further questions were offered, spanning a broad spectrum of approaches to accelerating climate action in Scotland. They were:
- “How do we tackle underlying causes to avoid false trade-offs?”
- “How can we incorporate climate change mitigation and adaptation into all policies?”
- “What are some blue-sky scenarios for Scotland’s climate action/change futures?”
- “If climate action has to win public trust in the next two years, what should the Scottish Govt. prioritise?”
- “What science data knowledge partnerships can accelerate climate action?”
- “How do we make big decisions based on incomplete evidence – accelerating uptake and impacts of science and research?”
- “How do we campaign to step up climate action when we are being beaten by bad faith actors who are better funded and highly sophisticated? How do we plan and execute contested campaigns?”
- “How can communities be active participants in the delivery of climate/transition solutions?”
- “Climate risk and resilience for the future energy system – how, what, when?”
- “What are the hurdles to attracting private sector investments in Scottish climate projects?”
- “What is multi-functional land use and how do we get it?”
- “How can we do more to support Small Island Developing States on the frontlines in a socially sustainable manner?”
- “What public pedagogies are needed to counterbalance an immersive media environment that actively produces ignorance of complexity?”
- “How should historic and existing buildings have a central pole in the mitigation of climate change?”
Such a diverse range of conversations naturally produced myriad reflections, insights, ideas – and further questions. Nonetheless, overlapping and interacting themes emerged that, for the participants who joined us, straddle the issues of how we cut emissions and adapt to a changing climate. Those we have included below are in no way an exhaustive list of the rich discussions from the day.
To help draw together themes and find connections between the Open Space conversations, we convened a sense-making panel of leaders and experts. Panel members included:
- Tuisku (Snow) Curtis-Kolu, Public Policy Advisor, British Academy
- Stefanie O’Gorman, Director of Sustainable Economics, Ramboll
- Elliot Ross, Executive Director, Just Transition Commission
- Prof. Pete Smith, Science Director, ClimateXChange
- Clare Wharmby, Co-Director, Scottish Climate Intelligence Service
- Dr. John Wincott, Chair, Sustainable Scotland Network
Collaboration at national, regional and local level
The need for collaboration was brought up in several conversations, often centred on bringing people and communities into the conversations, and involve them in actions, that affect them.
“Climate action happens in places – that means collaboration at national, regional and local level.” – Assembly participant
Participants felt:
- A place-based, person-centred approach would help create a shared sense of ownership of both problems and solutions, helping to build buy-in for action to be taken
- The structural barriers that prevent local authorities and communities from building partnerships need to be removed
- Local communities have strong visions for what they want – they should be active participants in the delivery of climate solutions
The discussion that asked how communities can be active participants in the delivery of climate solutions, highlighted the need for “deliberative democratic processes to help communities connect, design, plan and deliver” climate action on their own terms. Participants also pointed to Climate Action Hubs as doing work to facilitate this already and called for more support for local organisations.
The issues were identified as recurring challenges for climate policy and attendees called for more targeted engagement at community level and research into effective methods of place-based climate action.
Sharing knowledge and data
A lack of collaboration across disciplines and sectors was identified as hindering climate action. Attendees across the discussion tables said that better sharing of learning, knowledge and expertise would help close the gap between the intentions of climate policy and effective action.
Examples included:
- More data sharing among key partners involved in climate action and decision making, particularly around critical infrastructure for power, water and transport
- Ensuring regular contact and knowledge exchange between academia and policymakers in government – including a call for policymakers to champion experts’ contributions as part of the policy process
- Sharing experience and learning from evidence-based decision making other policy spheres, such as in medicine and in public health, where behaviour change has been successful
- Climate data and evidence needs to be delivered and communicated across the whole of government and be part of inter-departmental collaboration.
Those taking part in the discussion on data sharing highlighted living labs as an example of collaborative and novel ways to share data – as well as creating trusted demonstrators of what works (or doesn’t). Participants also highlighted initiatives such as the Climate Ready Infrastructure Scotland Forum as opportunities to foster science and data partnerships.
Communicating a future that people can see themselves in
Multiple discussions during the Open Space centred on how to garner better public support for climate action. For a lot of attendees and panellists, the solution lies in better communication.
The need to reframe how we talk about climate action was brought up repeatedly, with participants suggesting we need to focus on how the changes we make will improve people’s lives. The need to change framing and narrative included a call to combat the negative messaging and misinformation from bad actors and critical media. It was suggested, not just in terms of championing positive messages, but that climate action needs to be presented as the most straightforward, obvious thing to do.
“Stop talking about climate change and start talking about making people’s lives better.” Assembly attendee
There were also calls for more inspiring messaging from the Scottish Government to rally the public – instilling passion to build a better Scotland rather than deficit framing. As one participant put it, “communicating a future that people can see themselves in.” However, in doing so government and other public sector bodies must be honest about what needs to happen without over-promising and to ensuring consistent messaging across departments.
Uncertainty and imperfection
A common theme was also that it is important to communicate the idea that getting something partly right is better than paralysis. Participants felt it was particularly important to consider how to frame imperfect climate solutions.
This notion is linked to another discussion, focused on how to make decisions based on incomplete evidence, which also considered the challenges around communicating uncertainty. Medicine and health care was highlighted as an evidence-based discipline which successfully quantifies and communicates uncertainty in its policy development. Both conversations highlighted the need to create an environment were trying and failing, and uncertainty around both evidence and outcome, are discussed openly with the public and in the media.
Building trust and championing trusted voices
Creating collaborations and communicating for better public support overlap with the need to build trust. Several conversations concluded the need to increase trust between the public and government is crucial to galvanise action.
Attendees highlighted that honest communications and collaborating better with the people and communities affected by climate action – making their voices and concerns heard – is important to build trust in government and in climate policies.
“Trust is built on respect – people are experts in their own lives – we need to listen and change what we do and how we say things.” Assembly panellist
Several conversations – both the Open Space and subsequent panel discussion – highlighted the importance of finding people and organisation that already have trust. Attendees felt trusted voices would be instrumental in combatting negative messages and helping to build support for climate action.
As one of our sense-making panellists put it: “Farmers don’t trust scientists and the government but they trust other farmers.” They also highlighted the value of peer-to-peer learning and amplifying demonstrations of successful early climate action.
This sentiment of learning from early adopters was echoed in conversations around how to inspire action in households. Another panellist said: “People exist in networks of trusts, trusting neighbour who has converted to heat pump more than a social media message, for example.”
Having – and inspiring – courage to take action
The idea of courage came up in several Open Space discussions and few words were uttered more often by the sense-making panel. This reflects the challenge to be bold that we put to attendees ahead of the Assembly.
The courage to be unpopular was discussed during the Open Space sessions with one of the conversations focused on ways we can learn to disagree better in climate policy. Participants in this discussion called for policymakers to be more willing to “ruffle some feathers” and move away from the need for total consensus before action is taken while engaging openly with sceptics.
Tasked with making sense of the 20 different conversations held during the morning, afternoon panellists quickly drew connections between the calls for collaboration, communication and trust, and the need for courage.
Oen of our panellists pointed out courage is linked to trust, suggesting we need to build trust with people and communities in order to inspire the courage needed to make difficult choices together.
“If we keep doing what we’ve always done, we’ll always get what we’ve always got. Can we have the courage to do what we know is the right thing?” Assembly pannelist
There was also a call for more courage from our political leaders, with one expert saying Scotland often has the political will and the power – but not the courage – to take action. Adding that it is inevitable that some interventions will be unpopular but we will need to do them anyway.Courage is necessary in the response to the complexity of cutting greenhouse gas emissions and supporting Scotland to adapt in a fair and just way.
Evidence for action
Adopting the Open Space format and embracing the ‘messiness’ of 20 concurrent conversations was part of ClimateXChange’s response to that complexity. We wanted to leverage the individual and collective expertise and knowledge of attendees across multiple issues, but also their creativity. The aim was help us all to advance change, in our many different roles in creating a sustainable future for Scotland.
As Scotland’s centre of expertise on climate change, ClimateXChange commissions research and analysis to support the Scottish Government as it develops policies on reducing emissions, adapting to the impacts of climate change and enabling a just transition to net zero. As well as responding to policymakers’ questions and requests for evidence, we identify upcoming evidence needs.
This latter role relies on our ability to bring together a room (or rooms) full of passionate and knowledgeable researchers, sector experts and policymakers willing to commit their time, share their experience and engage in bold conversations. The need for evidence gathering to further the case for climate action was central to many discussions on the day and we are developing future research based on some specific topics, e.g. options for systematic uncertainty analysis.
“We are facing both extraordinary opportunities, as well as unprecedented challenges, as we navigate the transition to an electrified future, improve our environment, and build effective societal resilience. The role of high-quality evidence to support effective decision-making will be more important than ever.” Andy Kerr, Director-General Net Zero, Scottish Government
Now what?
The response to the event from attendees was overwhelmingly positive and the enthusiasm with which people participated was essential to success of the day’s conversations. And those conversations will continue.
Before we closed the Assembly we gifted every person a blank postcard and asked them to write themselves a message, including one pledge about what they are going to do from here and one reminder to themselves about the day. These messages have been posted to every participant’s home and we hope they help to keep the momentum from the event going.
A month after our event, the finalised Climate Change Plan: 2026–2040 was published by the Scottish Government.
Many of the ambitious proposals set out will need to be thoroughly evidenced before those plans can become action. ClimateXChange will continue to invite bold conversations to collectively step up climate action in Scotland, informed by research and expertise.
We would like to thank all those who joined us on the day and contributed their knowledge and insights.
In particular, we would like to thank everyone who suggested a topic for the Open Space and our afternoon panellists.
We are also very grateful to the team at 64 Million Artists with whom we collaborated on this event. Thank you for helping us to create an open, interactive and engaging experience that led to truly meaningful conversations and ideas.
Collaboration, communication, trust and courage were the watchwords of the ClimateXChange Assembly 2026.
When we invited climate-focused researchers, public and third sector leaders, and Scottish Government policy makers to our event in February, we challenged attendees to hold bold conversations focused on how we can accelerate climate action in Scotland. Multiple themes emerged from those conversations, but these four concepts were a consistent refrain from the stage and the tables at Dynamic Earth in Edinburgh.
We subtitled our event Accelerating Climate Action. The aim was to explore how we use our knowledge, research and evidence to initiate, scale up and advance climate initiatives. Scotland has ambitious climate targets and plans yet progress on cutting emissions and adapting to the changing climate has been slow.
The response to the event from attendees was overwhelmingly positive and the enthusiasm with which
people participated was essential to success of the day’s conversations. And those conversations will continue.
We would like to thank all those who joined us on the day and contributed their knowledge and insights.
In particular, we would like to thank everyone who suggested a topic for the Open Space and our afternoon panellists.
We are also very grateful to the team at 64 Million Artists with whom we collaborated on this event. Thank you for helping us to create an open, interactive and engaging experience that led to truly meaningful conversations and ideas. And a special thank to Eddy Phillips.
For a detailed run through of the conversations and ideas from the Assembly, please read our report.
CXC Assembly 2026 podcast
Want to hear more from the conference? Listen to our special podcast episode recorded live on the day.
Research completed February 2026
DOI: https://doi.org/10.7488/era/6994
Executive summary
Aims
Grassroots sport plays a key role in health and wellbeing and is at the heart of many communities in Scotland. Risks from climate disruption, including increased flooding, coastal erosion, heavy rainfall and heatwaves, have the potential to impact the grassroots sport sector. This could reduce the Scottish population’s access to sport and the health and wellbeing benefits this brings, as well as make the Scottish Government’s targets for physical activity more difficult to achieve. However, the influence of grassroots sports offers a powerful vehicle for engaging new audiences on climate change issues and helping communities build resilience. To date, research into climate impacts on grassroots sport in Scotland has been limited, as has the policy response.
This report aims to help to fill this gap, by reviewing information on the current and projected climate risks to grassroots sports in Scotland and understanding the current adaptation response to these risks, as well as where further adaptation may be needed and factors that can enable this. This report also aims to understand the role that sport can play in building community resilience and how grassroots sports organisations can best be engaged to support climate action. Evidence gaps and lessons for policy are highlighted.
Key findings
Climate change impacts on grassroots sport
Extreme weather is already impacting Scottish sport, and the frequency and severity of extreme events is expected to worsen due to climate change. Some extreme events like flooding and heavy rainfall have always been an issue for the sector, but new hazards like heatwaves are emerging. Long term changes in climate will also have an impact. For example, the warming climate in Scotland is reducing the amount of snow cover available for winter sports and coastal sports assets, such as links golf courses, are being affected by sea level rise.
- Although the specific impacts of climate change vary by sport, the key risks that all sports face, particularly those played outdoors, are:
Rising costs due to factors such as increased insurance premiums, maintenance needs, damage to facilities and costs relating to contingency measures for extreme events.
Reduced participation due to factors such as greater health risks, reduced access to facilities and frustration with increased disruption and cancellation.
Assessing the scale of impact of climate change and extreme weather on grassroots sport in Scotland is difficult because there is currently very little data available to assess cancellation of sports events and other impacts. Without this data, it will also be difficult to understand future trends in participation and costs due to both climate change and other factors.
Climate disruption will not affect all places and participants equally. Increasing costs for grassroots sport could price some participants out, particularly in deprived areas of Scotland which already have higher levels of inactivity. Some rural economies that rely on visitors participating in snow sports, outdoor sports or golf may also face wider risks to livelihoods if sport participation is impacted.
Adapting grassroots sports to the future climate
Advice from the Climate Change Committee could not be clearer, at a minimum, the UK must be prepared for reaching 2°C of global warming above pre-industrial levels in the next 25 years.
Action is already being taken to protect the grassroots sector. For example, artificial pitches are allowing more sport to be played during inclement weather and some governing bodies are providing guidance to sports participants to keep them safe during extreme events. However, actions are often not explicitly recognised as adaptation and are often not designed with the future climate in mind. Some typical actions may have trade-offs, for example artificial pitches can be a significant source of microplastic pollution. There is currently very limited join up between sports policies and climate adaptation policies in Scotland.
A key barrier to adaptation action in Scottish sport is a lack of knowledge about climate impacts and the action needed to address them in the sports sector. There is generally a strong will to protect grassroots clubs for future generations and protect the environment, but a lack of knowledge about what action is most effective. A lack of clear, consistent messaging about what action needs to be taken and why may compound this problem. Partnership working with organisations who hold this knowledge can be a powerful way of overcoming this barrier and building capacity. Examples of this are highlighted by several case studies in this report.
Public engagement on climate through sport
Personal experience with extreme weather events directly influences risk perception and grassroots sports participants, particularly those playing outdoors, are having these experiences. However, in many cases, these experiences are not perceived to be linked to climate change, rather they have “always happened”.
Currently, there are very few examples of sport being used as an engagement tool for building community resilience or awareness of climate risks in Scotland. However, with the right knowledge and support, sports clubs are well placed to act as trusted messengers to build awareness of climate risk within the wider community, potentially reaching people who are less engaged with other networks delivering this information. There are numerous examples of sport being used as a tool to engage people on emissions reduction or other environmental issues and these may provide a blueprint for future engagement on climate resilience.
Lessons for policy
- Training is needed to increase knowledge and awareness of climate impacts, and where further adaptation action is needed, across all levels of the Scottish sports landscape. While some training for sports organisations is already available, uptake can be low due to resource and capacity constraints. Sportscotland currently have a centralised training platform for governing bodies of sport which could possibly be used to provide training on climate impacts and adaptation. Governing bodies can then cascade learnings to grassroots clubs through existing networks.
- Improved data collection is needed to understand the scale and trends in climate impacts on Scottish grassroots sport. A first step towards achieving this could include supporting Scottish governing bodies of sport to collect data on events they are directly involved with, and building up to more comprehensive systems, learning from organisations such as Scottish Rugby who are already collecting regular data.
- Specific inclusion of sports in national and local adaptation planning and risk assessment. Given that local authority risk assessments and adaptation plans often flow directly from national level work, explicit inclusion of sport in national level adaptation planning, such as the Scottish National Adaptation Plan, would signal a need for involvement of sports bodies in adaptation planning at the local level as well. In England, Sport England are in the process of commissioning a climate change risk assessment for the sport sector. This will provide an evidence base to support this as well as learnings that can be applied in Scotland.
- Develop the role of grassroots sports organisations in building community resilience. This could be achieved by building partnerships between community sports organisations and community climate organisations, such as climate hubs, to deliver information and action in the wider community. This could help to build knowledge of climate impacts within the sports organisations, as well as expanding the reach of climate organisations by using the sports organisations as trusted messengers in wider parts of the community. Support, such as dedicated programmes or forums, would likely be required to develop these partnerships given that many of these organisations are volunteer led and have limited capacity.
- Alignment of sports facilities funding with adaptation goals to avoid long-term, maladaptive decisions. In the short term, funding streams (such as local authority climate funding) should be identified that can support preparation for and recovery from climate risks and advertised to the grassroots sport sector, including examples of measures that could be taken. Following storms and flood events, Sport England advertise their funding to grassroots sports groups explicitly to help them recover but there has so far been no equivalent to this in Scotland. Although national circumstances differ, a similar approach of identifying how existing funding streams could be advertised to support preparation for and recovery from extreme events when needed could be explored. In the longer term, criteria for facility funding applications and other long term decision making across the sector should be reviewed to ensure climate resilience needs are formally and consistently considered so that facilities are prepared for the future climate, and potentially costly retrofits are not required.

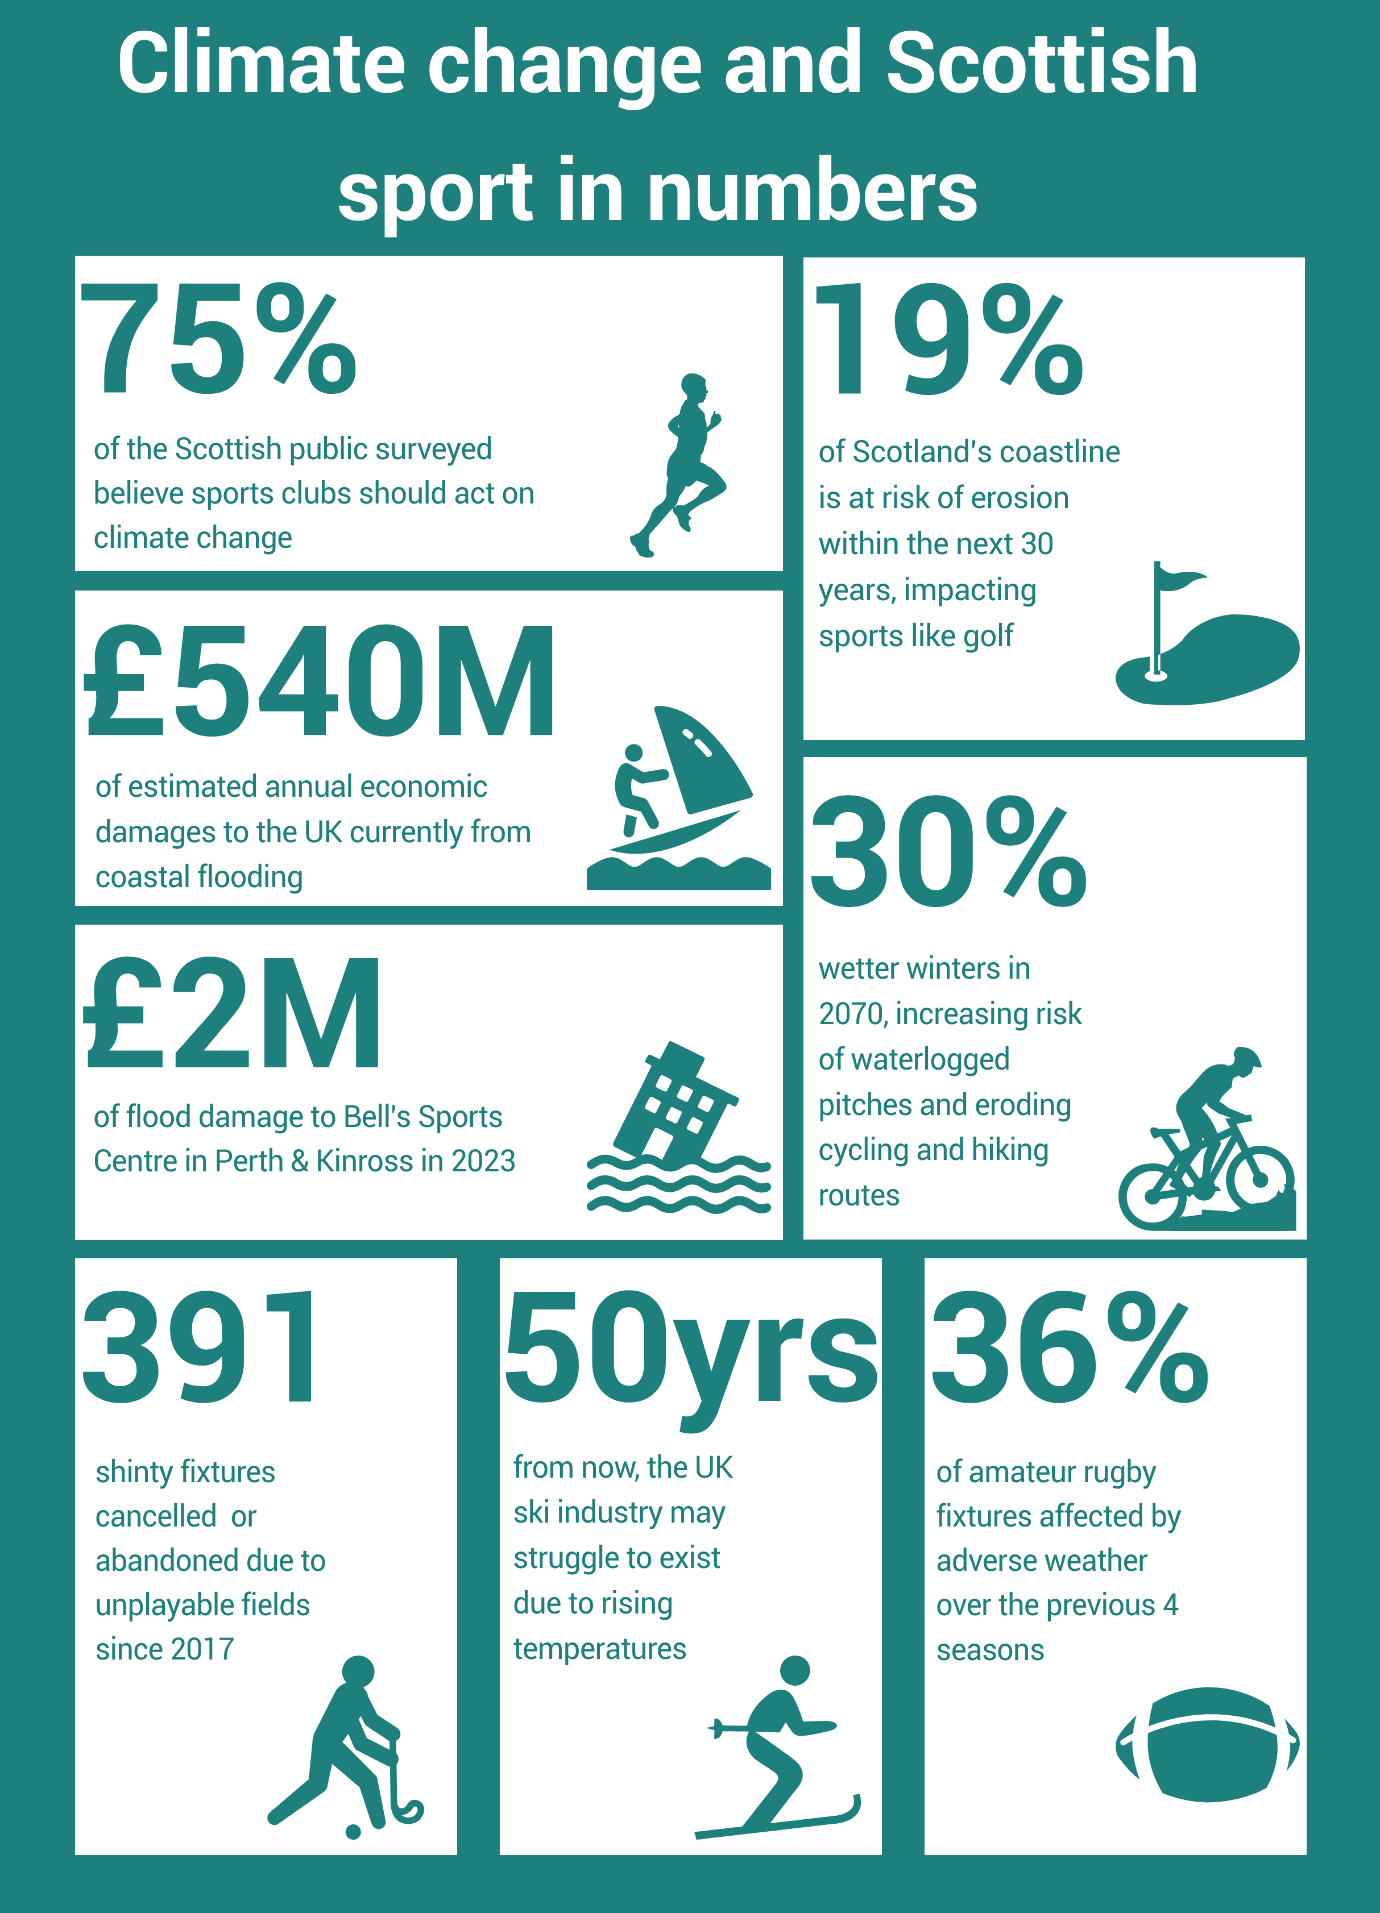
Figure 1‑1: A summary of key facts and figures relating to climate change and sport in Scotland. Further context and references for these can be found within the main body of this report.
Glossary / Abbreviations table
Definitions sourced from the Intergovernmental Panel on Climate Change glossary (Reisinger et al., 2023) and adapted for the context of this report.
Introduction
Sport is a cornerstone of Scottish culture. Scotland has over 550 golf courses (VisitScotland, 2025) and football and rugby are popular. The Scottish Highlands are one of the few places in the UK where outdoor sports on natural snow can be enjoyed and sports such as curling, shinty and the highland games are a unique part of Scotland’s heritage. However, the importance of sport goes far beyond national identity.
The benefits of sport for individuals include improved physical and mental health, social connections and development of skills including leadership and communication. Sport also contributes to the Scottish economy. In 2021, sport (defined broadly as including professional, grassroots, spectating and production of sports goods) contributed a direct impact of £3.8 bn, accounting for 2.5% of Scotland’s total gross value added (DCMS, 2024). Grassroots sport is an integral part of the national sporting landscape: fostering talent development that feeds the professional sport pipeline and the Scottish economy, promoting physical activity, improving wellbeing, and bringing communities together.
Climate change poses a threat to the continued enjoyment of and participation in grassroots sport across Scotland, and hence threatens the many benefits sport brings to people, communities and the economy. For example, in Scotland, climate change is expected to make extreme rainfall and flooding events more common, causing more disruption to sporting events and damage to facilities. Heatwaves and drought events are also likely to become more frequent and intense in the summer, resulting in further damage to facilities and risks to participants’ health and wellbeing (Duncan and McLaughlin, 2021; Adaptation Scotland and Met Office Research, 2025).
Climate change comes against a wider backdrop of challenges to sport in Scotland, including increasing costs, lack of access to high quality facilities and inequality of participation across demographics and geographies (Sported, 2023; Collins, 2024). Climate change is likely to make many of these challenges worse and grassroots sport will need to take action to prepare and build resilience, as well as to take advantage of any new opportunities, if it is to thrive in Scotland into the future. As well as building resilience for itself, the grassroots sport ecosystem is well placed to help raise wider awareness of climate impacts and how to build resilience more broadly because of its place at the heart of communities across the country.
To date, research into the climate impact on the sports sector as a whole, but particularly grassroots sport, in Scotland has been limited, as has the policy response. This report aims to help to fill this gap, by reviewing information on the current and projected climate risks to the grassroots sector in Scotland, understanding the current adaptation response to these risks, and barriers and enablers for any further adaptation that may be needed. This report also aims to start building an evidence base around the role that sport can play in building community resilience and how grassroots sports organisations can best be engaged to take climate action.
During the course of this work, a wide range of input from organisations, including Scottish Governing Bodies of sport (SGBs) and grassroots clubs, has been sought. These organisations have provided crucial input to this study and shared knowledge. It is hoped that this process and the resulting report will help to start a conversation that will build understanding of the risks and provide an opportunity for the grassroots sector to build climate resilience.
Policy context
Policies for supporting sport and encouraging physical activity are devolved to the Scottish Government within the UK. Sportscotland is the national agency for sport in Scotland and is responsible for delivering the Scottish Government’s goals for sport. Delivery of sport and physical activities also involves a wide range of other organisations, including local authorities, which provide and manage many sports facilities, and governing bodies for specific sports. The overall landscape of organisations involved in Scottish sport is complex as shown in Figure 3‑1.
Statutory duties relating to grassroots sport in Scotland are limited to requirements for local authorities to provide appropriate facilities for recreational and sports activities and guidance for sportscotland in distributing National Lottery funding (Collins, 2024). However, a range of strategies and delivery plans at the national level aim to achieve a more active Scotland and to realise the health, wellbeing and wider benefits that come with that. These include the Scottish Government’s physical activity delivery plan, A More Active Scotland, which aims to reduce physical inactivity in adults and teenagers by 15% by 2030 (Scottish Government, 2018) and ‘Sport for life’, sportscotland’s corporate strategy for meeting the vision of ‘an active Scotland where everyone benefits from sport’(sportscotland, 2025b).
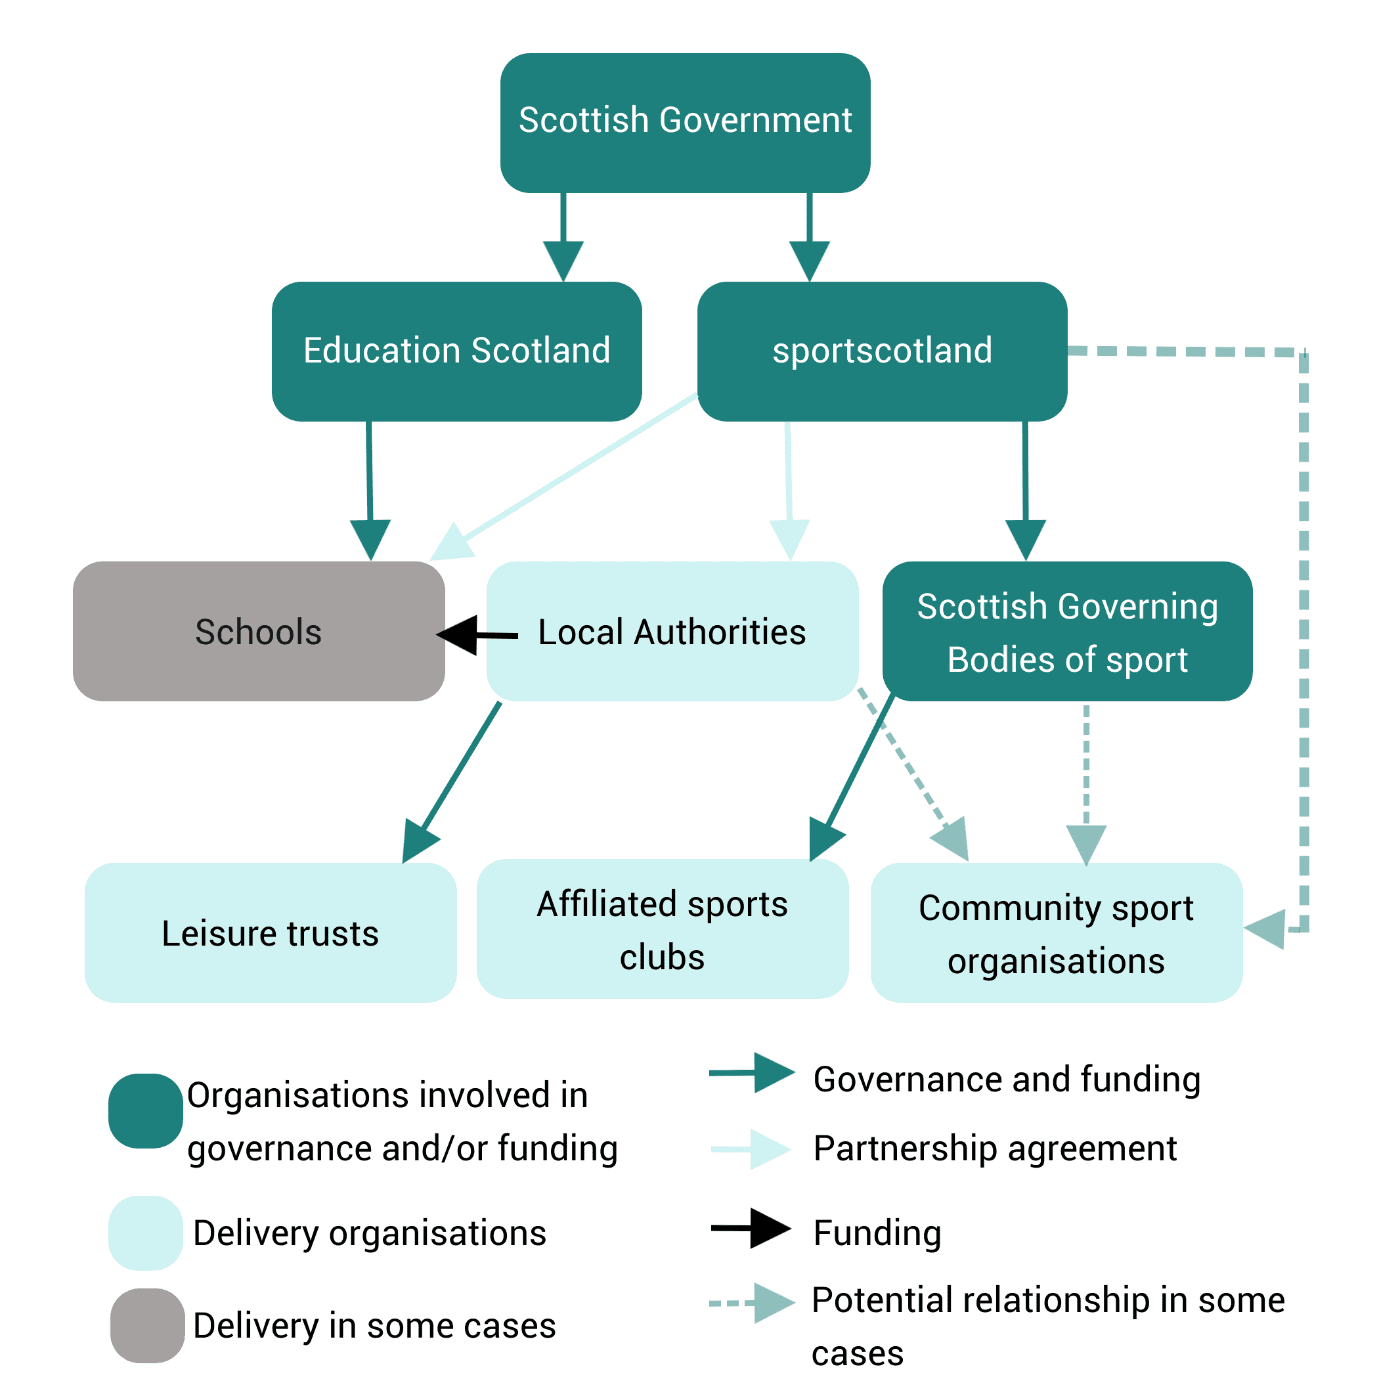
Figure 3‑1: Simplified diagram of some of the key types of organisations involved in grassroots sports governance, funding and delivery and relationships between them in Scotland. The diagram is not exhaustive and other organisations such as tertiary education providers may also be involved in grassroots sports provision. Key relationships are captured but there may be additional or different relationships operating in some circumstances. Relationships shown are those specifically relevant to sport so, for example, the relationship between Scottish Government and Local Authorities is not explicitly shown because although funding is provided to Local Authorities, this is not specifically ringfenced for sport. Diagram adapted from Collins, 2024.
There is currently limited interaction between climate adaptation policy and sports policy in Scotland. At the national level, the third Scottish National Adaptation Plan (SNAP3) sets out the actions that the Scottish Government and its partners will take to respond to the impacts of climate change (Scottish Government, 2024). The plan does not explicitly consider sports organisations as part of this response although there is a strong emphasis on the role of communities and the need for community knowledge and connection to support locally led climate change adaptation. The actions in SNAP3 aim to address the climate risks identified for Scotland in the UK’s third climate change risk assessment (CCRA3) (Betts, Haward and Pearson, 2021). The risks to sport are also not explicitly considered by this risk assessment although the impacts of relevant hazards such as heat and flooding on communities are considered more generally, as well as risks to cultural heritage and opportunities for health and wellbeing from higher temperatures (Kovats and Brisley, 2021).
Below the national level, there is no statutory requirement for local government or other community and grassroots organisations to conduct organisation or local authority (LA) level climate change risk assessments or adaptation planning in Scotland. Although LAs are required to deliver their functions in a way that supports delivery of the national adaptation plan and the National Planning Framework does acknowledge synergies between the benefits of blue and green infrastructure for both adaptation and sports activities (Scottish Government, 2023a).
However, public bodies, including sportscotland and LAs, are required to report on their compliance with their statutory climate change duties, covering emissions mitigation, adaptation and sustainability (The Climate Change (Duties of Public Bodies: Reporting Requirements) (Scotland) Order, 2015). Public bodies’ climate change reporting by sportscotland on climate risk and adaptation is currently limited (sportscotland, 2025a). Very few published examples of local authorities explicitly involving grassroots sports organisations in their climate change risk assessments or adaptation planning have been identified in this study, although this was not a focus of the work.
Methodology
The scope of climate action in this study
Sports activities contribute to greenhouse gas emissions and other environmental impacts, such as pollution from pitch infills and excess waste due to use of disposable plastics. While work to reduce these impacts is already underway in many sports organisations in Scotland, and is important and necessary, the current project focuses on the impact that climate change has on grassroots sport, rather than the impact that grassroots sport has on climate change. Impacts from climate change are already being seen. This means that, alongside continued action to reduce greenhouse gas emissions and other environmental impacts, it is important that grassroots sports organisations understand the climate risks that may affect them and how they can act to reduce these risks to their facilities, clubs, participants and the wider community. Actions taken to address these risks are often referred to as ‘adaptation’, the process of adjusting to the actual or expected climate and its effects (Calvin et al., 2023). Well-designed adaptation action can help build resilience, the ability to anticipate, cope with and recover from hazardous events (Mehryar, 2022). This will ensure that grassroots sports clubs and activities continue to thrive in Scotland long into the future.
Scope of grassroots sport in this study
The focus of the current study is on grassroots sport. There is no commonly agreed definition of grassroots sport in Scotland, although a recent briefing for the Scottish Parliament used a definition of community sport defining: “[Activities that] are low threshold and financially accessible, and organised locally, in specific – often urban – neighbourhoods. The activities are not usually high level or competitive in nature.” (Van der Veken, Lauwerier and Willems, 2020; Collins, 2024)
For the purpose of this study, we consider grassroots sport to include community-based sports and physical activity initiatives where participation is recreational and at a non-professional level. We include sports in both urban and rural settings, for both adult and child participants. We consider ‘sport’ in this study to include the broad range of recreational physical activities which have recognised governing bodies in Scotland, although not all of these are addressed explicitly in this work.
Research approach
Data collection for this study was conducted between September 2025 and December 2025 by Aether, working with a steering group including the CXC research lead and representatives from Scottish Government. The approach to this study consisted of 3 key elements: literature review, stakeholder interviews and case study analysis. The methodology was designed to provide a broad evidence base from which further research priorities and future policy actions can be informed.
The literature review aimed to provide a framework of sports, climate impacts, adaptation actions and engagement activities that would set the scope of the review and inform a protocol for stakeholder interviews. The protocol is provided in Appendix B. This protocol was used to conduct semi-structured interviews with key stakeholders, including SGBs, local authorities, leisure facility providers and grassroots clubs, to validate and expand upon the literature review. Any reference to interviewees or interviews in this report refers to information gathered from these interviews, but this has been anonymised aside from in specific cases where permission from interviewees to include information as part of specific case studies was secured. From these sources, six case studies were drawn and discussed with stakeholders to illustrate the climate impacts that have affected sport in Scotland in recent years. The case studies also illustrate how organisations have taken action and effectively responded to these. The aim of presenting these case studies is to support knowledge sharing between organisations and showcase good practice that could provide lessons for wider action elsewhere. A graphical overview of the case studies is provided in Figure 4‑1.
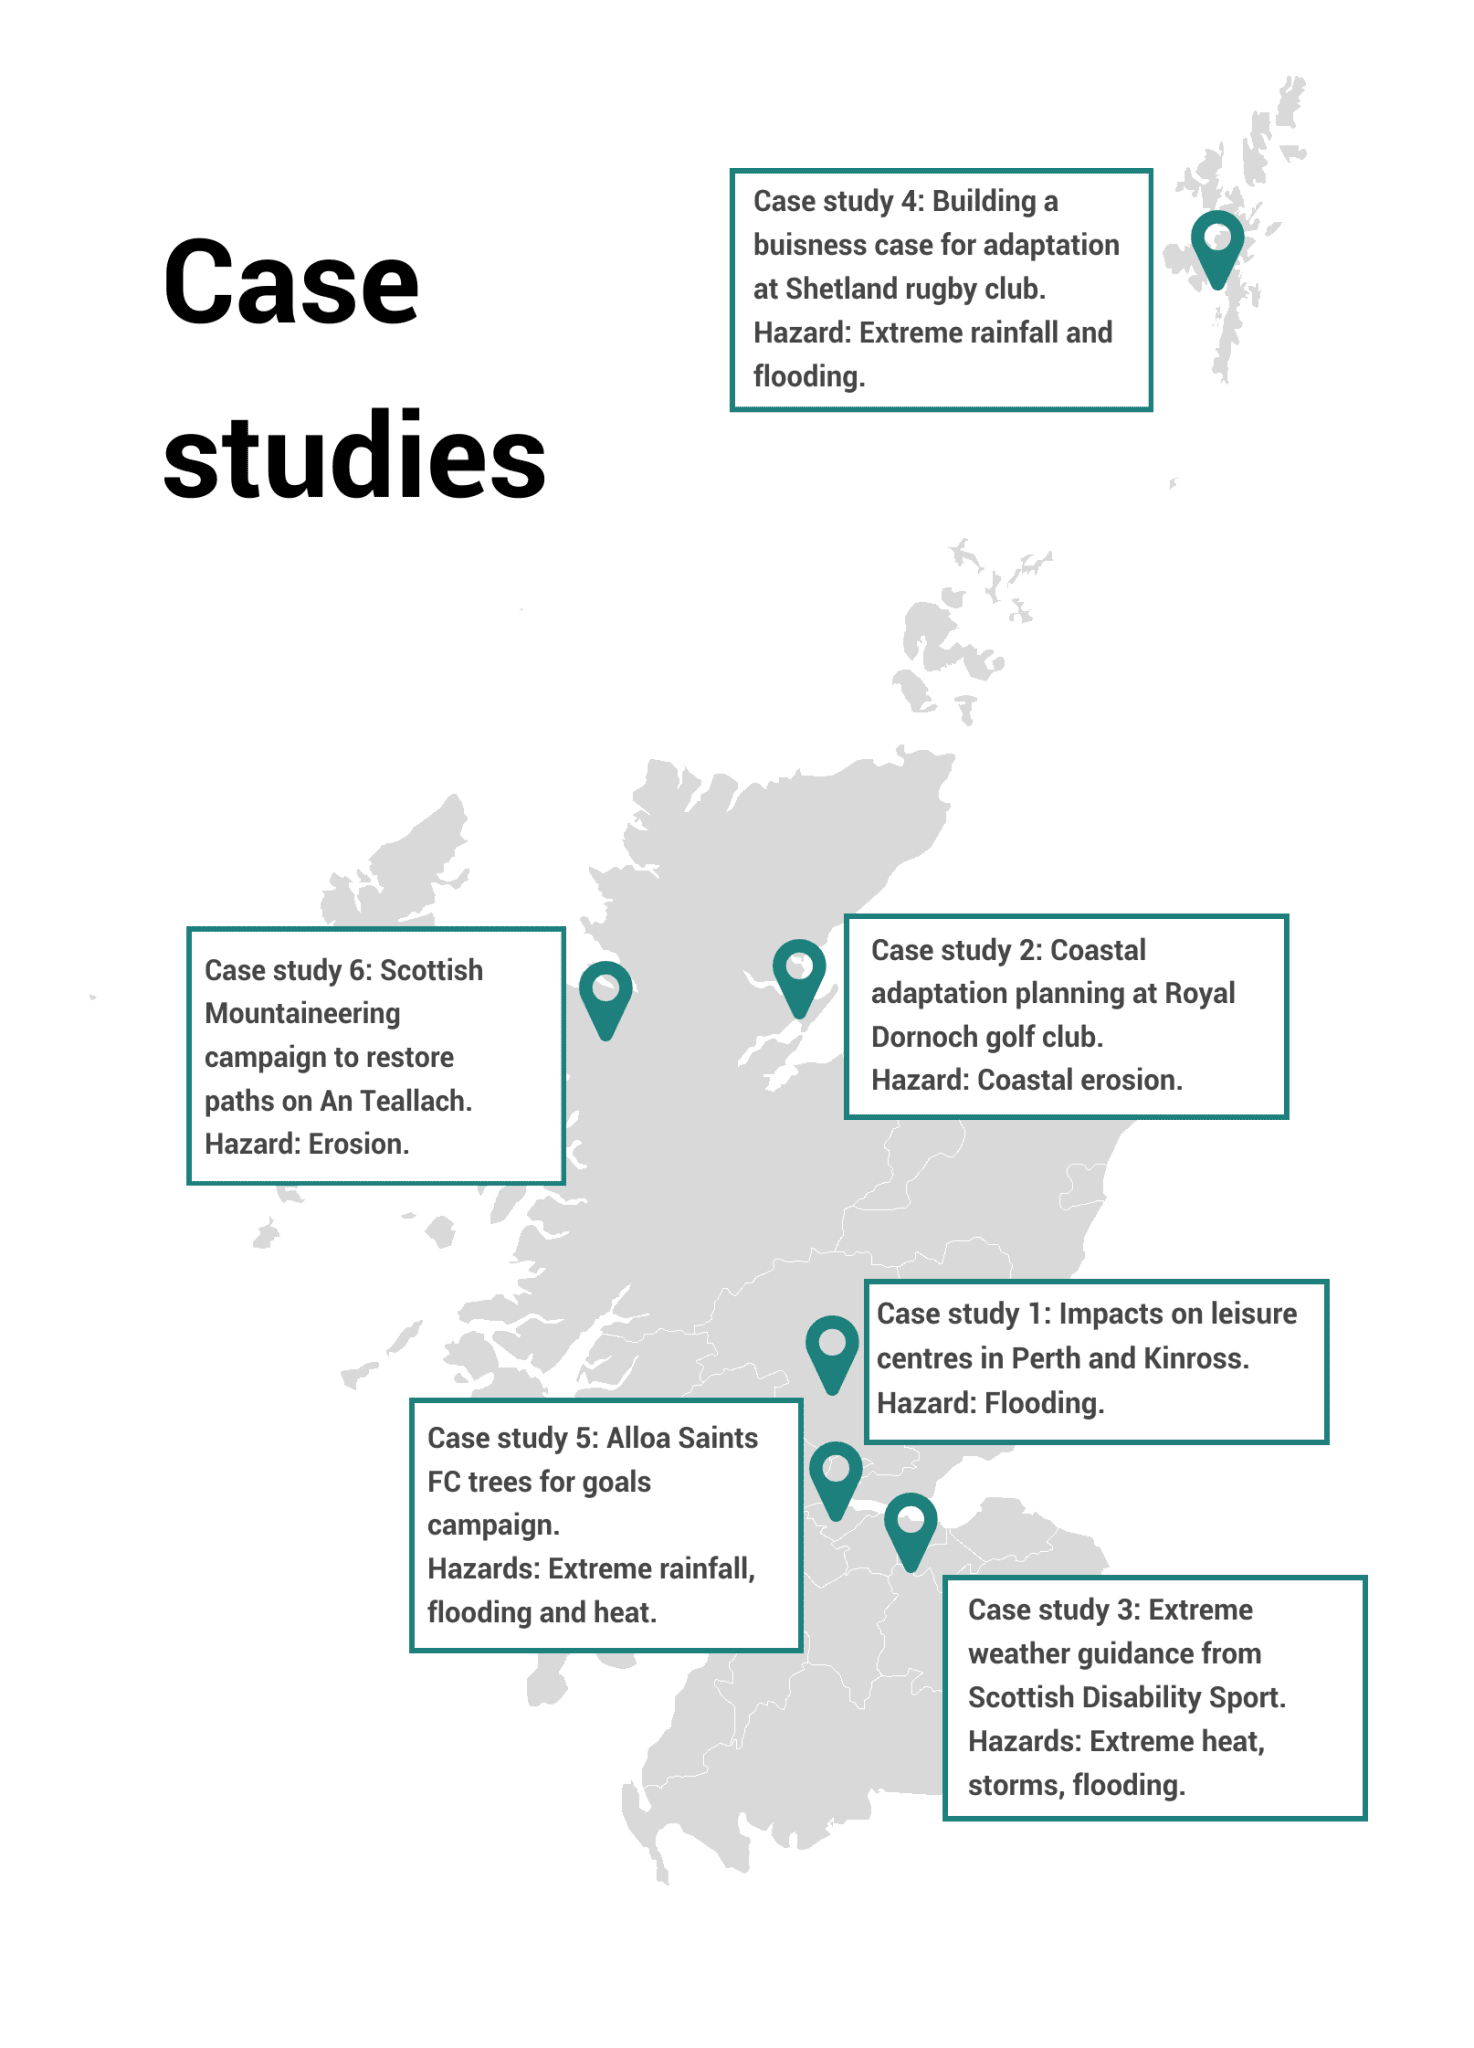
Figure 4‑1 A map summarising the locations of case studies presented in this report and the climate hazards they relate to.
Limitations of the approach
This study aims to provide a broad review of climate impacts, adaptation actions, and opportunities to engage communities on climate change via grassroots sports. It is not a comprehensive assessment of climate risk, nor a comprehensive review across the entire grassroots sport landscape in Scotland. Literature relating specifically to climate change impacts on grassroots sports in Scotland was limited. Hence, some of the evidence presented was collected in other countries or for professional sports and is assumed to apply more broadly. A summary of evidence gaps is presented in section 8.2.
The stakeholders who have input to this work via interviews do not represent the full range of sports, geographies, participants and organisations present in Scottish sport. Response rates were generally lower from grassroots organisations and local authorities than from SGBs, so they are less well represented in the information collected. There may also be some response bias towards organisations or interviewees who are already more engaged in climate issues.
Climate change impacts on grassroots sport
How will climate change affect Scotland?
As global temperatures rise, Scotland is projected to encounter warmer, wetter winters and hotter, drier summers. This will be accompanied by rising sea levels leading to more coastal erosion and flooding, as well as more frequent and intense extreme weather events (Sniffer, 2023). These extreme events include:
Extreme rainfall events that can lead to flooding, in both summer and winter,
Drought and extended dry periods in the summer,
Heatwaves in the summer,
Wildfires resulting from hotter, drier summer conditions.
2025 was the warmest year on record for the UK (Met Office, 2026a). All of the UK’s ten warmest years on record have occurred since 2002, whilst none of the ten coldest years have occurred since 1963 (Met Office, 2019). The last three years (2022-2024) have been in the UK’s top-five warmest on record and the period 2015-2024 was 10% wetter than 1961-1990 (Kendon et al., 2025). However, 1st October 2024 – 30th September 2025 was the driest hydrological year in eastern Scotland since 1976 (SEPA, 2025).
Hotter, drier summers increase the risk of wildfires with 13 wildfire warnings issued in Scotland in 2025 (the most in recent times) with a Highlands blaze described as the worst in Scotland’s history (BBC News, 2025).
These climate trends are expected to intensify over the coming decades. Met Office data suggests that the number of summer days exceeding maximum temperatures of 25°C in Glasgow could increase from 4 per year (baseline period 1981-2000) to 8-14 per year if 2°C of global warming takes place (Met Office, 2026b). The Climate Change Committee (CCC) have advised that , at a minimum, the country must be prepared for reaching 2°C of global warming in the next 25 years (Climate Change Committee, 2025).
Warmer winters will also result in reduced snow cover in the Scottish mountains. The 2024 snow patch survey of Scotland’s highest mountains recorded only 90 snow patches surviving into July – the third lowest total on record – compared with over 2,000 in 1986 (BBC News, 2024b). Long-term observations in the Cairngorms National Park show a declining trend in snow cover over recent decades, with modelling forecasting further reductions in snow cover as warming continues and accelerates (Rivington et al., 2019).
Climate change is also causing sea levels to rise, resulting in increased coastal flooding and erosion. Around Scotland, the mean sea level has risen by approximately 19.5cm from the start of the 20th century and is expected to rise by 12-18cm by 2050 and 23-54cm by 2080. This will result in 19% of Scotland’s coastline being at risk of erosion within the next 30 years (Sniffer, 2021; Adaptation Scotland and Met Office Research, 2025). Annual average economic damages from coastal flooding in the UK are currently estimated to be around £540 million (Haigh et al., 2025).
How will climate change affect grassroots sport?
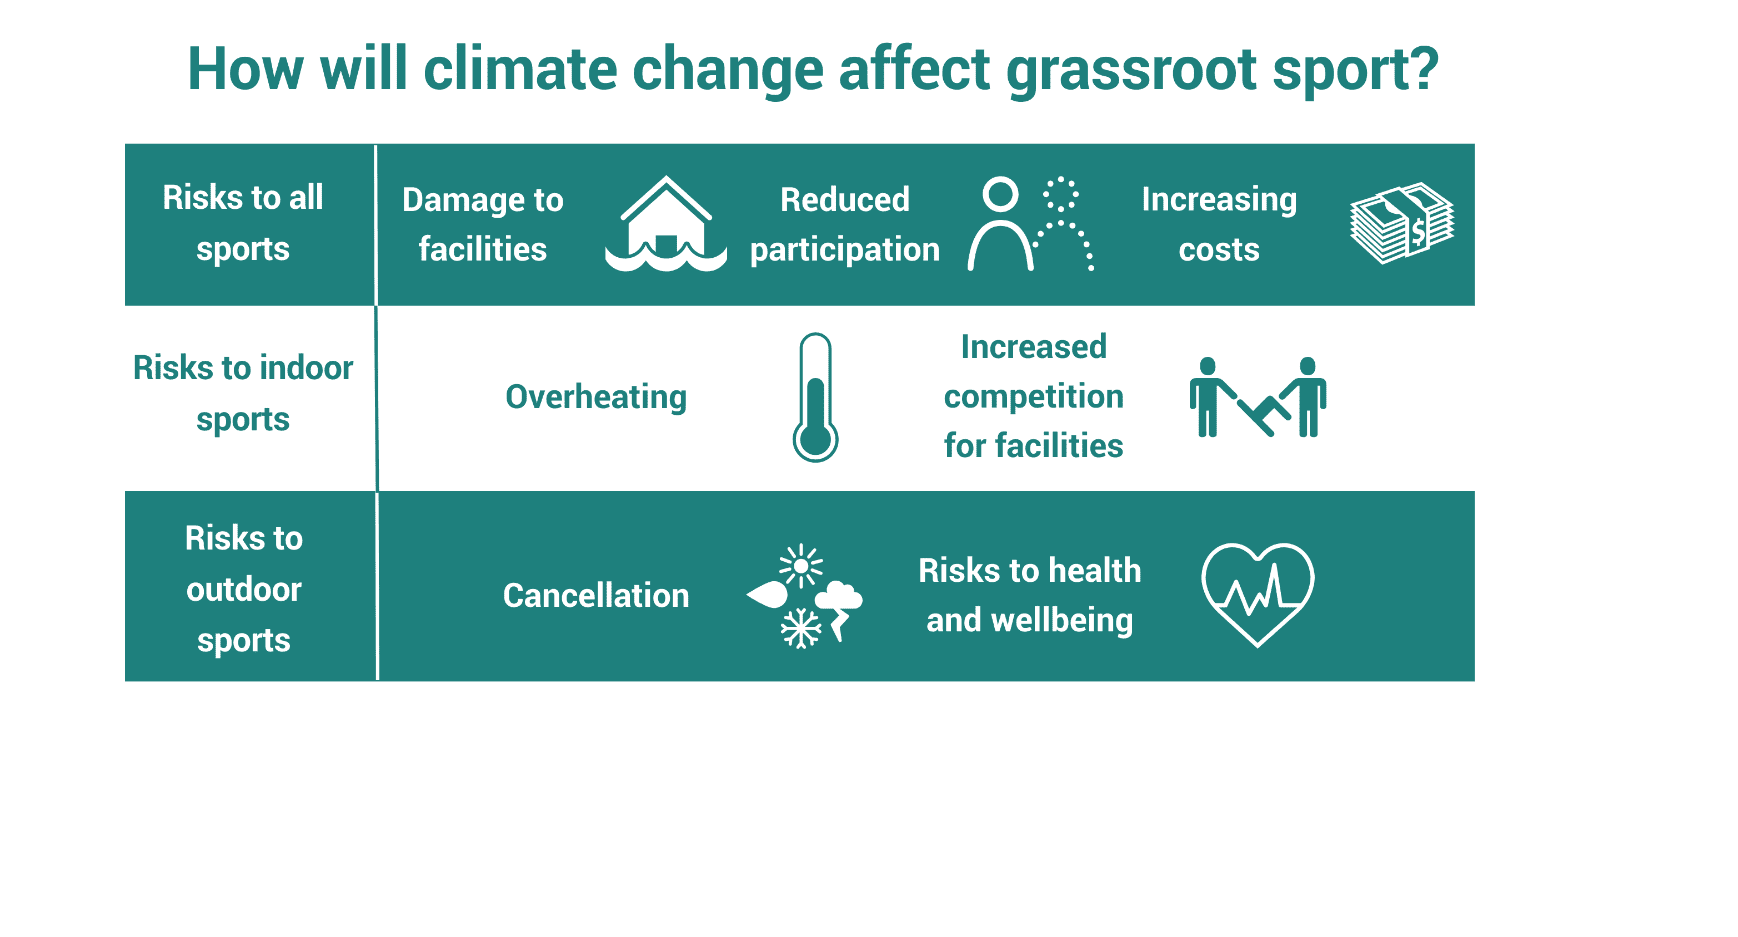
Figure 5‑1: A summary of the ways in which climate change can impact Scottish sports and how these impacts may differ between indoor and outdoor sports.
The impacts of climate change on sport, and their severity, are varied depending on location and type of sport. The severity and nature of these impacts will also depend on other trends in sport such as levels of participation amongst different groups, the level of funding available for facility maintenance and popularity of different sports. A summary of some key impacts is illustrated in Figure 5‑2. In general, for all sports, there are two key categories of negative outcomes resulting from climate change:
- Reduced participation: Sports clubs rely on regular engagement, but frequent event disruptions and cancellations due to extreme weather lead to declining involvement from players as well as coaches, referees, umpires, and other officials. Ultimately, this reduces income to clubs and weakens club viability (Department for Culture, Media & Sport (DCMS), 2025). A lack of accessible or suitable facilities, which is likely to be exacerbated by climate impacts, may also reduce participation (Orr et al., 2021; The Scottish Parliament, 2023). For some sports, increased actual or perceived health and injury risks associated with factors such as wetter or drier ground may also play a role in participation (Orr et al., 2021; Oyama et al., 2023; Department for Culture, Media & Sport (DCMS), 2025). For individuals, reducing participation in sports and physical activity is likely to have negative impacts on both physical and mental health. Physical inactivity is already estimated to cost the NHS in Scotland more than £77m per year (Meir and Scott, 2025).
- Increased costs and reduced income: Adapting and maintaining facilities able to withstand adverse weather conditions can incur financial costs to clubs and sporting bodies. For example, modelling has estimated an annual cost of £320 million to the grassroots sports sector in England alone due to the impact of adverse and extreme weather events on maintenance needs, repair costs and event cancellation. This number is likely to rise with increasing climate change impacts (Department for Culture, Media & Sport (DCMS), 2025, 2025). Interviewees for this work highlighted factors such as increased insurance costs, increased maintenance costs, and the loss of revenue due to cancelled or abandoned events as key factors influencing costs. Many also stated that contingency measures, such as renting indoor facilities at short notice during extreme weather events, have significant costs for grassroots clubs. People living in the most deprived areas of Scotland are already much less likely to participate in sport (Meir and Scott, 2025), and this inequality may be exacerbated if costs of running and participating in sport increase further (see section 5.4).
Both increased costs and reduced participation in sport pose risks to the long-term sustainability of grassroots sports clubs, which may close if they become financially unviable or do not have enough participation. This could reduce the opportunities to improve health and wellbeing through physical activity across communities in Scotland. One interviewee noted that “climate change is impacting the growth of the sport” in Scotland due to reduced access to facilities.
For certain sports and locations, such as snow sports affected by diminishing snow cover and coastal links golf courses exposed to coastal erosion, the impacts of climate change may pose an existential threat to the viability of some sports or clubs in Scotland. The following sections examine how these location-specific impacts influence participation levels and financial sustainability.
What are the specific risks to different types of sport?
Outdoor sports
In general, outdoor sports and participants are more exposed to climate hazards than indoor sports, although indoor facilities can also experience the impacts of climate change (Orr et al., 2021), as discussed in section 5.3.2 below. Figure 5-2 summarises some of the outdoor sport specific risks discussed in this section.
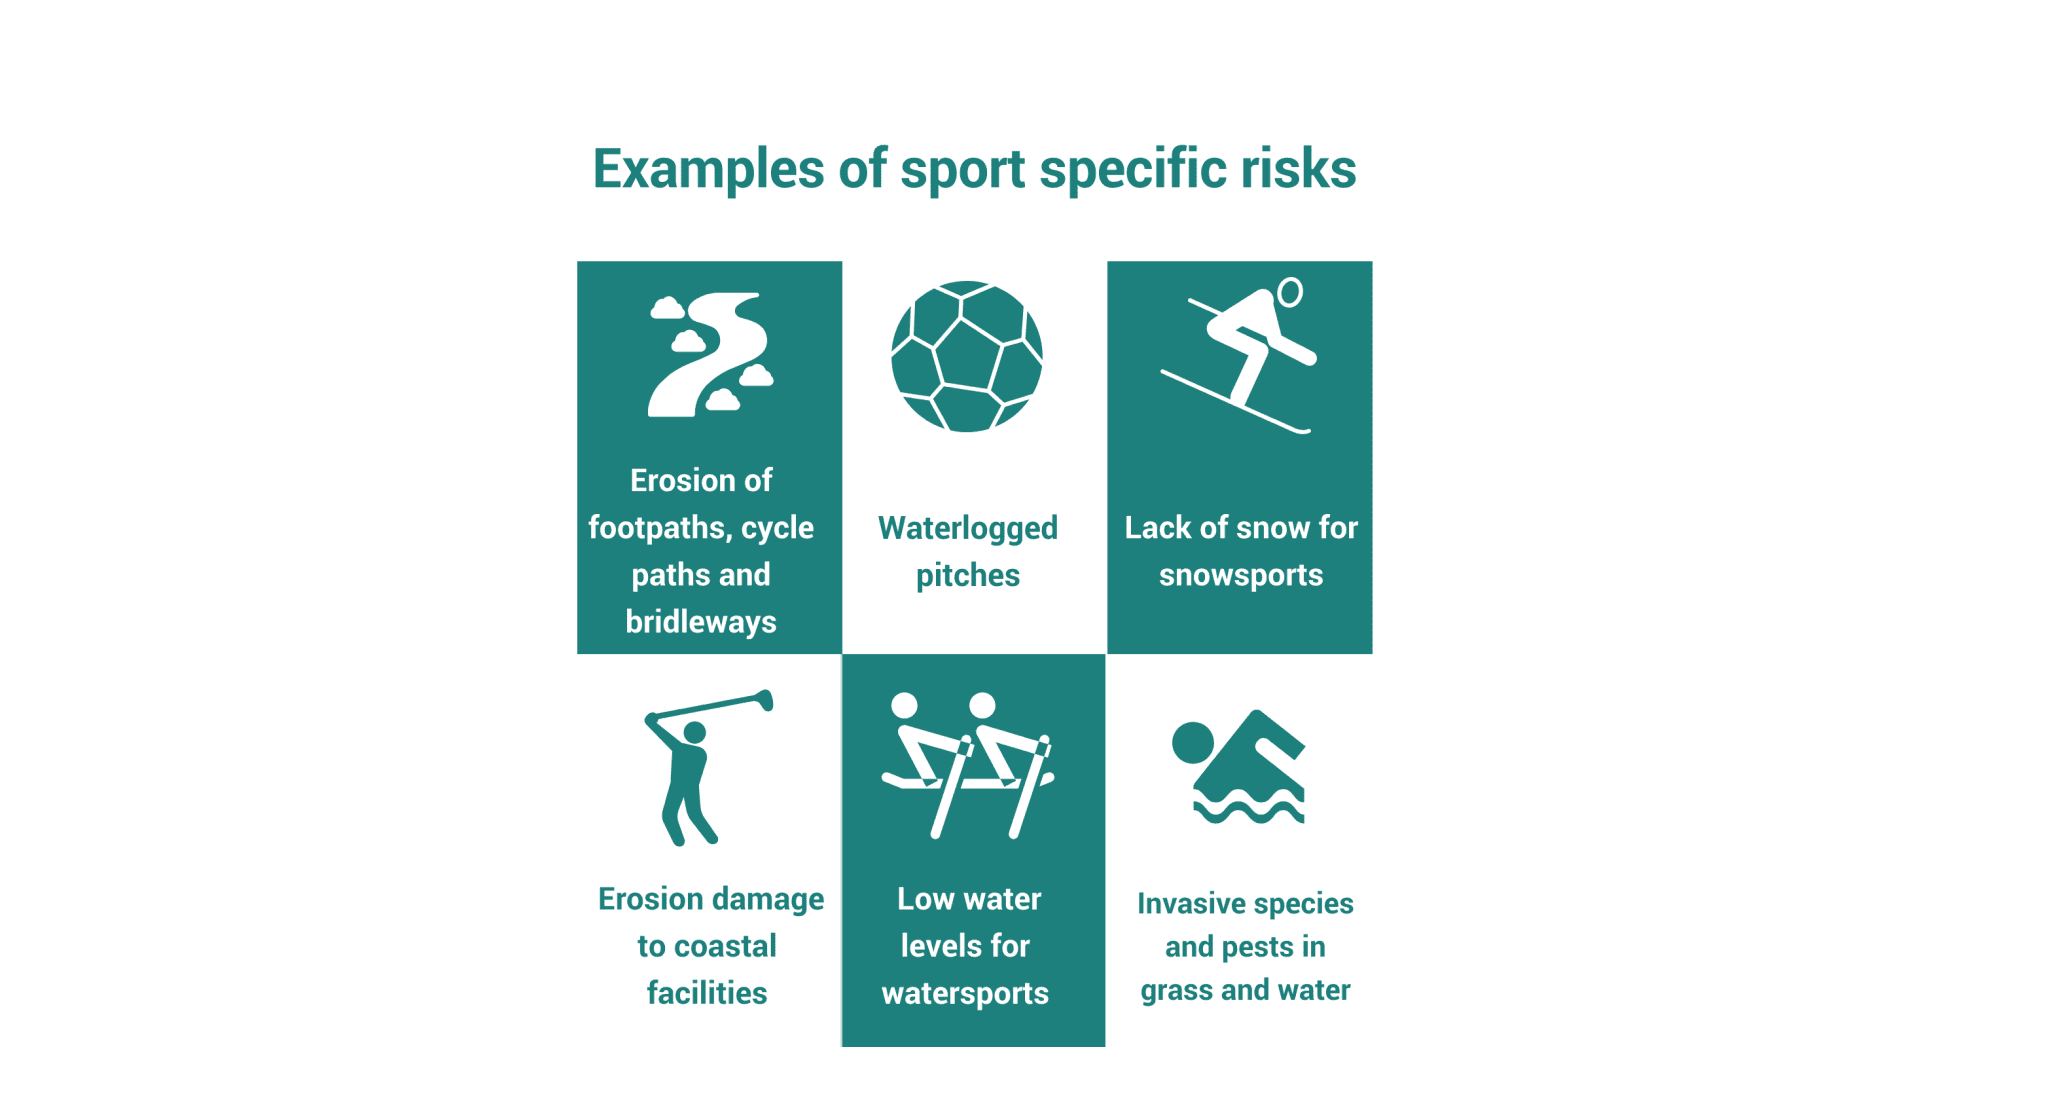
Figure 5-2: A summary of some of the specific risks to different types of outdoor sport identified in this report.
Cancellations or postponements due to extreme weather
Cancellations due to extreme rainfall episodes, flooding, cold spells and storms were consistently raised as a key issue for grassroots sport by interviewees. Many outdoor grass pitches become easily waterlogged, rendering them unusable, sometimes permanently. Other surfaces may be liable to flooding in some locations during periods of heavy rainfall (Duncan and McLaughlin, 2021; Sniffer, 2021). One interviewee noted that “pitches and training facilities can be out for days or even weeks” due to bad weather and “drainage systems seem to get more overwhelmed than they used to”. Winter rainfall is expected to increase across Scotland with climate change, but the most significant increases are expected in the west of the country (Arnell et al., 2021). Cancellations and waterlogging can be affected by a range of factors, such as maintenance and participation levels, as well as by the weather and hence long-term data collection is needed to understand the impact of climate change alongside these other factors.
Since 2017, approximately 9% of shinty (Camanachd in Scottish Gaelic) fixtures (391 matches), and the 2019 Camanachd Cup Final, were either cancelled or abandoned due to unplayable fields (Camanachd Association, email communication, December 2025). Additionally, over the previous 4 Scottish rugby seasons, 36% of scheduled fixtures were affected by adverse weather and 13% of games were cancelled (Scottish Rugby Union, email communication, November 2025). No further examples of systematic data collection on cancellation and disruption were identified through this research. Further data collection is needed to establish a baseline and allow trends in cancellations due to different factors to be better understood.
Hot, dry weather and drought episodes can also lead to cancellations as this can harden grass playing surfaces, leading to health and safety related cancelations (Bryan et al., 2020). Although this has historically been less of an issue in Scotland than wet weather and flooding, both drought risk and summer temperatures are expected to increase under future climate change. Equestrianism is also affected by dry conditions; ensuring appropriate moisture levels is essential for animal and rider welfare (Environment Agency, 2025). During periods of significant dry weather, water saving measures, such as hosepipe bans, could be imposed which could prevent irrigation of sports grounds. Although there has not been a hosepipe ban imposed in Scotland since 1995 (Davies, 2025), 1st October 2024 – 30th September 2025 was the driest hydrological year in eastern Scotland since 1976 (SEPA, 2025).
Many interviewees highlighted issues around managing postponements and rescheduling, including facility availability, participant availability, and costs. One interviewee noted that for their sport “the Scottish outdoor calendar is already shorter than the English due to wet weather, but climate change threatens to shorten it further.” Even where sports facilities are not directly affected, cancellations may also result from disruptions to transport systems required for participants to travel to facilities (see section 5.5).
Health and wellbeing impacts on sports participants
Climate change poses risks to the health and wellbeing of sports participants in a range of ways. High temperatures during summer can increase the risk of heat stress, dehydration, and cardiovascular strain (particularly among young children and older adults). Individuals with some pre-existing health conditions are also more vulnerable to these risks. Higher temperatures may also affect performance and decision making of sports participants (Winter et al., 2023; Public Health Scotland, 2025).
Interviewees generally perceived the current risk of heat to be low in Scotland, although there have been a few incidences of runners suffering from heat stroke in hill races over the last few years. In both 2019 and 2023, runners collapsed due to heat exhaustion during the Junior Home International races, resulting in two runners being hospitalised in 2019 (scottishathletics, email communication, Nov 2025). Increased awareness of heat risks, to reduce the risk of underestimating them during sports activities, will be required as heatwaves become more common and intense in Scotland in the future. Met Office data suggests that the number of summer days exceeding maximum temperatures of 25°C in Glasgow could increase from 4 per year (baseline period 1981-2000) to 8-14 per year if 2°C of global warming takes place (Met Office, 2026b).
Warmer, sunnier conditions also raise the risk of vector-borne diseases (illnesses that are transmitted to humans through living organisms such as mosquitoes or ticks), such as Lyme disease, and UV, increasing the risks of short-term sunburn and heat illnesses, and long-term skin cancer risks (Claerhout et al., 2006; Li et al., 2016; WHO, 2024). These risks may be more pronounced for sports participants spending more time outdoors, and particularly in countryside areas in the case of vector borne diseases.
Wildfire smoke also poses a significant threat to human health, primarily through respiratory effects. It can also reduce visibility, heightening the risk of accidents for sports like mountain biking (Winter et al., 2023). In 2025, a wildfire in the Highlands was described as the worst in Scotland’s history, and wildfire risk is expected to increase as summers become hotter and drier (BBC News, 2025).
Bryan et al. (2020) explored the impacts of drought on recreation and health in the UK. They identified that low water levels associated with drought could reduce accessibility and increase danger associated with inland water sports due to hazards such as rocks becoming exposed and concentration of microbes and other harmful pollutants increasing. Warm, dry weather could increase opportunities for land and coastal based sports activities. However, Bryan et al. (2020) also noted the higher risk of injury when sports grounds are hard due to drought and that warm weather can also increase the risk of heat illness outlined above. Interviewees supported these findings, suggesting that hard pitches and reduced access to water sports were likely to be issues during drought periods.
For water sports taking place inland or at sea, there are additional specific safety concerns that may be exacerbated by climate change. Coastal flooding, erosion, and storms inflict damage on sailing and boat club assets and increase safety concerns over water sports in the UK (Simpson, 2013). High water levels in rivers due to heavy rainfall can increase danger to paddle sports as water flows faster and more debris and pollutants may enter the water (Go Paddling, 2024). The growth of algal blooms in Scottish inland waters is expected to increase under climate change. Currently, algal blooms directly cost the Scottish economy at least an estimated £16.5 million annually[1] and have the potential to cause significant damage to human health if encountered through swimming and water sports (May et al., 2024). Blue-green algae has resulted in postponements and cancellations of sporting events, including the Swim Loch Tay event in 2021 (Hamilton, 2021).
Damage to sports facilities and environments
Different types of sports facility, or environments where sports take place, may be damaged by climate change impacts. In some cases, this results in increased maintenance costs or can even pose a risk to the existence of the sport. For example:
- Damage to grass pitches. Grass requires sufficient water to recover from use and wear, however, both insufficient and excessive water can be detrimental to pitch condition and increase maintenance costs. Good pitch condition is essential for creating safe, high quality, and suitable playing surfaces for sports such as tennis, hockey, rugby, and cricket, where consistent ball pace and bounce is critical (James, 2012).
- Lack of snow for snow sports. Goggins et al. (2018) suggested the UK ski industry may struggle to exist within 50 years, as a result of rising winter temperatures and a lack of snow cover. Cairngorm mountain is predicted to experience a decline in snowfall over the next 20 years, alongside an increased risk of avalanches with rapidly changing conditions (Duncan and McLaughlin, 2021; BBC News, 2024b). This reduces the frequency and reliability of conditions suitable for snow sports, potentially shortening the winter sport season and increasing injury risk.
- Erosion damage to coastal facilities. Sports clubs located on the coast may be damaged by coastal erosion and rising sea levels. Montrose Golf Club, one of Scotland’s oldest golf clubs, lost 7 meters of their course to the sea in a single year (McLaughlin, 2024). Similar impacts are discussed further in 6.1.1.1 Case study 2.
- Low water levels in inland water bodies. Inland, under drought conditions, the rivers and lochs relied on for water sports can experience significantly low water levels (Bryan et al., 2020). This can lead to higher risk of sports participants disturbing the local environment and higher health risks to participants as lower water levels can result in lower water quality (Paddle UK, 2022).
- Erosion and flooding damage to footpaths, cycle paths and bridleways. Extreme rainfall and wind, combined with rising sea levels in coastal locations, is accelerating erosion and flooding of footpaths, cycle paths, and bridleways. A resulting growth in the frequency of landslides and mudslides increases risk to user safety (Winter et al., 2023). One interviewee discussed the need for yearly route changes for one of their sports events due to path erosion.
- Invasive species and pathogens. Pathogens are organisms such as bacteria, fungi, or viruses that cause disease and invasive species are non-native organisms that cause harm in a new environment (Balloux and Van Dorp, 2017; NOAA, 2024). Escalated maintenance demands and associated costs for outdoor facilities with outbreaks of invasive species was highlighted in the interviews. Warmer, wetter conditions allow outbreaks and arrivals of non-native species, pests, and diseases in the UK, which can degrade playing surfaces, damage natural environments, and restrict access to recreational areas (Sniffer, 2021).
Indoor sports
Indoor sports can also be impacted by climate change, particularly where buildings are not well adapted. With rising temperatures, the risk of overheating in buildings is predicted to increase (Sniffer, 2021). Many indoor community sports activities (including yoga and dance) are held in old buildings, where air circulation and insulation are poor, leading to high energy costs for heating and cooling (Temple, 2024; Zhang, Li and Li, 2025). As with outdoor facilities, indoor facilities can suffer damage from storms, extreme rainfall and flooding, as illustrated by 5.3.2.1 Case study 1. During extreme weather, interviewees noted that outdoor sports often relocate indoors to avoid cancellation which drives competition, and hence prices, for renting indoor facilities (see section 5.3.1.1). One interviewee said “there is no capacity to move everyone inside at the grassroots level”.
Case study 1: Impacts on leisure centres in Perth and Kinross
Sport: indoor sports
Climate hazard: flooding
What was the challenge?
Located alongside the River Tay, Perth is prone to heavy rainfall and consequently increasingly susceptible to substantial flood events. The local council’s climate risk assessment identifies that leisure facilities lie in future flood zones, with floods posing significant risks to accessibility, finances, and insurability (Perth and Kinross Council, 2023).
In August 2020, severe flooding impacted both Bell’s Sports Centre and Perth Leisure Pool:
Bell’s Sports Centre’s overnight flooding caused damage to one sports hall and the circulation areas, which required extensive repairs and replacement of a six-court hall floor (Ogston, 2023). Following this event, the centre could no longer access insurance for surface water flooding, leaving the organisation vulnerable to future events.
Perth Leisure Pool suffered severe flooding that damaged the plant room, electrics, and filtration systems (Chalmers, 2020). The flooding caused extensive damage, disrupted services, and created long-term operational and financial pressures.
In October 2023, Bell’s Sports Centre again experienced serious flooding. There was a delay in closing nearby flood gates which may have led to property damage (BBC News, 2023; Chalmers, 2024). Water levels reached halfway up the fire exit doors, causing extensive damage to the main hall, squash courts, and a new 100-station gym (Anderson, 2024b; Perth & Kinross Council, 2024). Electrical sockets and gym equipment were damaged and repair costs reached around £2 million (Ogston, 2023).
What action was taken?
Prior to this, for less serious flood events, localised flood mitigation measures, such as deploying sandbags, identifying water entry points, and improving roof drainage and pipework had been taken and the leisure centres engaged with the council and relevant agencies to monitor weather alerts and prepare for potential flooding.
After the 2020 floods, extensive repairs were carried out at both facilities, including replacing sports hall floors and repairing filtration systems (Perth & Kinross Council, 2024). Following the 2023 flood, around 90% of activities were transferred to alternative venues.
What was the impact?
Perth Leisure Pool was closed for 14 months, with reconstruction taking 12 months and costing more than £1 million (Anderson, 2022). Although first-floor areas reopened weeks after the 2023 flood at Bell’s Sports Centre, the centre was permanently closed in August 2024 due to repair costs and ongoing operating losses (BBC News, 2024a). National and regional sporting events previously held at Bell’s have since moved to other cities in Scotland (Anderson, 2024a). The council has committed £74 million to a new leisure centre in Perth, expected within five to six years, to replace Bell’s, as well as making plans to develop the Bell’s site into an unheated, indoor sports pitch and event space.
Key lesson learned:
- The need for changing action with a changing risk profile. The leisure centres had measures to respond to flooding in place, but these were overwhelmed in 2019 and 2023. Perth and Kinross Council admitted a delay in closing the North Inch flood gates may have led to property damage from flooding in 2023, but have developed improvement plans following this incident (BBC News, 2023; Chalmers, 2024).
Which participants and places are most affected by climate risk?
Sports participants with different characteristics are affected by climate risk in different ways. For example, young children, older people and people with pre-existing health conditions are most vulnerable to health issues due to extreme heat conditions which could be exacerbated by participation in physical activity (SGSA, 2025).
As recognised in section 5.2, climate change is likely to increase costs for grassroots sports and these costs may be passed on to participants, leading to a barrier to participation, particularly for lower income households. People living in the most deprived areas of Scotland are already much less likely to participate in sport (Meir and Scott, 2025) and this inequality could increase if the costs of participation increase (Department for Culture, Media & Sport (DCMS), 2025). Furthermore, grassroots sports in more deprived areas may be more likely to lack the capacity to adapt to climate change due to pre-existing inequalities (Meir and Scott, 2025), while more deprived areas are often at higher risk of the wider negative impacts of climate change as well (Scottish Government, 2024). One interviewee noted that one club, in an area of high deprivation, was seeing increased costs due to an increasing need to hire artificial pitches to avoid waterlogging. Due to a lack of external support or funding, these costs were passed on to participants. This was affecting children playing for the club as families raised concerns about the costs of training.
Exposure to specific risks also varies across urban and rural areas. For example, rural communities may be more impacted by transport system failure limiting access to sports participation (see section 5.5), but exposure to heat risks may be higher in urban areas due to urban heat island effects (Kovats and Brisley, 2021). Some interviewees also noted some differences in regional impacts, with the west of Scotland generally facing wetter weather and more storms. Interviewees highlighted that for some rural communities, activities such as snow sports and other outdoor recreation are a key part of the rural economy and climate change could threaten livelihoods as well as access to physical activity (Scottish Government, 2023b). One interviewee highlighted that reskilling workers affected by these risks is not explicitly included in the Scottish Tourism Strategy, Just Transition Plan or SNAP3.
Animals and wildlife involved in sports are also vulnerable to climate impacts. For sports involving animals, animal welfare issues may also be exacerbated by climate change. For example, horses can also suffer from heat stress and dry, hard ground can exacerbate the risk of injury and discomfort, impacting joint and hoof health (Kang et al., 2023).
How do risks to other sectors affect sport?
Sports participants rely on wider infrastructure and supply chains to provide the services and products they need for their sports. For example, interviewees for this work stressed that “transport network resilience is just as important as the resilience of the pitches”, as many sports participants are reliant on public transport to attend sports events. CCRA3 recognises more action is needed to address climate risk to transport (CCRA3, 2021). Interviewees noted the wider disruptions and impacts caused when events are cancelled due to participants being unable to travel. This is a greater issue for the Scottish Islands where ferries to the mainland can be cancelled or delayed due to extreme weather.
Transport system failure can also impact emergency service access to sports events. One interviewee stated that one of their sport’s major annual events had to be cancelled the night before the event due to a flood warning that covered roads in the area. Emergency services informed them that they would be unable to have safe access to the event, hence putting the participants at risk and invalidating public indemnity insurance. The cost of this cancellation was approximately £40,000.
Another example of risks to other sectors impacting sport is climate impacts on supply chains increasing the price or reducing the availability of equipment. For example, during winter, hay is used to feed horses but there have been growing concerns over hay shortages across the UK following recent dry summers and unpredictable weather (Mott, 2025). Farmers and suppliers have been forced to import hay from Europe, and the demand is driving an increase in prices that affects equestrianism (Carr, 2025).
Joined up approaches to national and local climate risk assessments which include grassroots sport alongside other sectors could help address these risks. Perth and Kinross Council are one of the few local authorities who have been identified through this work as including any aspect of grassroots sport (specifically flood risk to leisure centres) in their local climate change risk and opportunity assessment (Perth and Kinross Council, 2023). The climate resilience section of their climate action plan does not explicitly address this risk but does include a range of broader flood management measures to protect the local area (Perth and Kinross Council, 2021).
What are the opportunities for grassroots sport?
Alongside the risks and negative impacts, some aspects of projected climate change may create certain conditions that could support participation in grassroot sport in Scotland. Primarily, longer summers and warmer water has the potential to increase the season length for a range of sports including golf and water sports (Simpson, 2013). This may allow clubs to schedule activities over a broader calendar window which could support improved participation. However, this in itself may bring additional risks if less experienced participants underestimate the risks associated with mountain or water sports in better weather and do not take sufficient precautions (Boyle, 2025).
It is important to note that any benefits attributed to future climate conditions do not ‘balance out’ negative impacts. Adaptation is needed to manage these negative impacts for any benefits to be realised.
Opportunities for grassroots sport to play a role in raising community awareness of climate change and building resilience for themselves as well as the wider community in the face of climate change impacts are discussed in section 7.
Adapting grassroots sport to the future climate
What can be done to reduce the risks?
Action can and is being taken to reduce the risks posed to grassroots sports by climate change in Scotland. Adaptation action to reduce the risks identified in section 5 can broadly be split into four categories:
Policies and planning,
Reducing the risks to participants in sport through education and behaviour change,
Ensuring contingency measures are in place for events and
Making improvements or changes to facilities to ensure they can cope with changes in climate and extreme events.
Examples of these actions are discussed throughout this section. As shown in Figure 6‑1, enablers such as funding, leadership and knowledge need to be in place for these measures to be implemented.
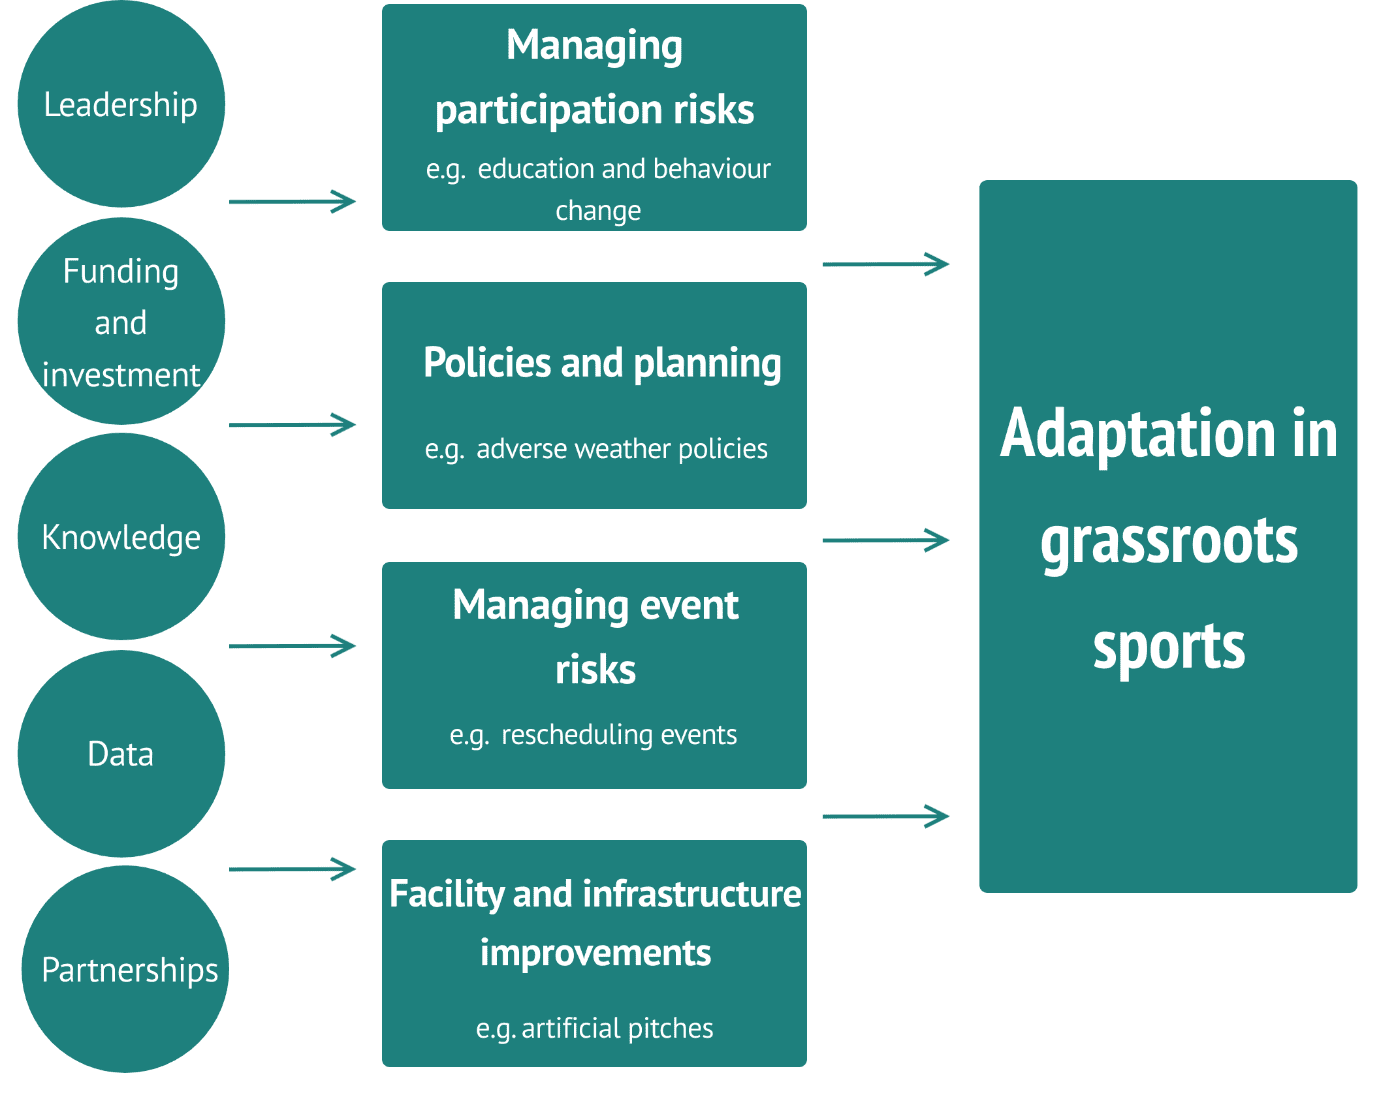
Figure 6‑1: Summary of measures that can deliver grassroots sport and the enablers that support these measures.
Policies and planning for climate change
Organisational policies and plans are a key mechanism to guide responses to adverse and extreme weather events for all sports (Orr et al., 2021; Mabon, 2022). Policies and plans may be implemented at different levels of governance, including at the club level or governing body level, and help to embed a consistent response with clear roles and responsibilities.
Examples of the kinds of policies and plans an organisation might have include:
Policies that provide guidance on how to respond to impacts from extreme weather.
Policies around event/season scheduling that may be adapted.
An adaptation plan (potentially supported by an evidence base from a climate change risk assessment) setting out resourcing and plans for the organisation’s long-term response to climate change.
Many of the adaptation responses that a policy may recommend are outlined in the following sections, but they could include providing structured guidance on when events should be cancelled, or adjusted, and clarifying when extra breaks may be required. For example, sportscotland has implemented an emergency response policy that covers major fires, floods, gale force winds, and external hazards both inside and outside facilities (sportscotland, 2023). Interviews highlighted that many sports groups in Scotland do disseminate weather risk policies and these policies are utilised in decision making. However, their use is often based on personal discretion and interpretation.
Extreme heat guidance, which should ideally involve a temperature threshold above which the policy applies, is a key policy identified in the literature for responding to health and wellbeing risks to participants during heatwaves (Orr et al., 2021; SGSA, 2025). Although the risk of extreme heat is lower risk in Scotland than in other parts of the UK, heatwaves already impact sport participant health and safety in Scotland and participants may underestimate the danger, as discussed in Section 5. The average number of heatwaves per year in Scotland is projected to be around 4 times higher in the period 2030-2060 than it was in 1981-2010, so the associated risk will increase (Arnell et al., 2021). Very few governing bodies and clubs in Scotland were found to have specific policies surrounding extreme heat, and there was a general perception amongst interviewees that heat is not a significant issue in Scotland. There are though, some examples of heat being considered in sport policies. For example, Disability Sport Scotland integrates heat as part of their inclement weather policy (see 6.1.3.1 Case study 3).
Policies may also relate to adjusting season or session timings. Interviewees also highlighted altering season timings as a possible response to a changing climate. There is some precedent for changing season timings to account for the weather. In Scotland, the children’s football season already runs from March to November to take advantage of the best weather and longer daylight hours, although for older players a traditional winter season is observed (UEFA, 2012; Scottish Youth Football Association, 2024). Scottish women’s football was also previously played in a summer season, from 2009 to 2020 when it reverted to a winter season following the COVID-19 pandemic (Reynolds, 2013; Cairney, 2020). Additionally, other sports groups have condensed the season to a shorter period of time. However, interviewees noted that this can have negative impacts, with a condensed season reducing recovery time which was anecdotally attributed to increasing injury rates.
In addition to policies that help manage current response, planning and identifying risks is important to help to prepare for future climate risks (Orr and Inoue, 2019). In general, longer term adaptation planning in response to climate change was uncommon amongst Scottish sport groups. One interviewee noted that long term climate impacts are rarely considered, as management practices tend to be localised and taken at a small scale, rather than instituted by a governing body. One exception is the Coastal Change Adaptation Planning (CCAP) discussed in 6.1.1.1 Case study 2 below.
Case study 2: Coastal change adaptation planning at Royal Dornoch golf club
Sport: Golf
Climate hazard: Coastal erosion, storm impacts, coastal flooding
What was the challenge?
Coastal erosion is posing a significant threat to Royal Dornoch’s golf courses, and many other links courses in Scotland. In 2010, erosion began to affect the club’s second course, the Struie, largely due to the shallow beach and the loss of a salt marsh, which allowed waves to erode the coastline more aggressively (Hampton, 2025). The impact of Storm Babet in 2023 further highlighted the severity of the problem, as it caused the loss of 5–10 metres of previously recovered coastline on the Championship Course. The amount of erosion was measured against stakes in the ground that had been in place for over 20 years to provide evidence of coastal change.
What action was taken?
Learning from previous erosion events along the coastline was key to informing the response. To counter the erosion in 2010, the club initially used old Christmas trees to create a barrier, later replacing them with chestnut fencing designed to break up wave energy. This approach proved effective, enabling the salt marsh to regenerate toward the sea and preventing the course from needing to be rerouted. Building on this success, Royal Dornoch continues to work with St. Andrews University, NatureScot and Dornoch Academy on saltmarsh restoration (Hampton, 2025).
Building on this experience, the club is now developing a Coastal Change Adaptation Plan (CCAP) (Hampton, 2025). The aim of this work is to analyse and model erosion patterns to anticipate how the coastline may change over the coming decades. The club’s desire to develop the CCAP was partly borne out of discussion with a club member who had expertise in the area of coastal change and hence encouraged forward planning, and this led to a broader focus on monitoring the entire coastline, not just the areas currently affected.
What was the impact?
The CCAP is expected to improve monitoring and data collection, allowing informed action to be taken. This will build up an evidence base and dataset to inform future decision making and allow proactive risk mitigation. Additionally, the club’s experience in 2010 demonstrated that the course could be protected in response to erosion without resorting to hard engineering solutions, offering a less costly approach with more co-benefits.
Key lessons learned:
1. Benefits of nature-based solutions: Supported more affordable mechanisms for reducing erosion rates, alongside supporting local biodiversity.
2. Capacity building through partnerships: Engagement and collaboration with a knowledgeable club member, and others including St. Andrews University, NatureScot, and Dornoch Academy helped to build capacity for adaptation work. Partnership working can also help with sharing good practice more widely if partners disseminate learnings through their networks, as NatureScot have in this case (Maynard, 2025). This could allow similar approaches to be used in other places.
3. Developing an evidence base: By planning for their future evidence needs through the CCAP, the club will build up data that helps them make decisions on how best to protect the club’s facilities for decades to come. Developing a detailed CCAP may not be possible for other sports groups due to capacity or financial constraints. However, alternative simple data collection methods, such as the use of stakes to measure erosion, could be readily implemented as an initial step towards improved monitoring.
Reducing the risks to participants in grassroots sport
Educating participants, providing them with appropriate information and raising awareness of actions that individuals can take is key to helping participants keep themselves safe in light of the risks posed by climate change (SGSA, 2025). Communicating extreme weather plans and educating individuals can help to establish expectations, manage health and safety risks, and improve long term participation (SGSA, 2025). For example, advice was published on the Loch Ness marathon website suggesting how runners should reduce speed in different temperatures, as well as other ways to cope with hot weather (Clyne, 2025).
Communicating risk and promoting safe behaviour amongst sports participants is not unique to the challenges posed by climate change. It already takes place in many sports, particularly for mountain sports and snow sports that are inherently higher risk. Similar channels and approaches may be used for communicating the changing risk profile that climate change brings. One instance of this is the “Think Winter” campaign which involves winter specific safety messaging delivered through a multi-organisational mountain safety group (Mountaineering Scotland, 2026). Interviewees highlighted that this campaign aims to use consistent messaging to reach those with less awareness of the weather and necessary safety precautions, such as those who are new to mountain sports and holiday makers. Assessing how well these communication mechanisms reduce participant risk is challenging, particularly given the changing risk profile, fluctuating levels of engagement in the sport over time, and improvements in emergency responses.
Weather forecasts play a key role in helping people to understand risk from weather and extreme events, particularly in water sports, mountain sports and snow sports (England Athletics, 2025; SGSA, 2025). A survey was conducted among individuals who use mountain facilities, many of which were involved in some form of mountain/snow sport, in which 98% of respondents said that use of a weather forecast was important to their decision making during mountain activities (Kelly and Smith, 2015). Evidence of using weather forecasts was identified in other outdoor sport groups during interviews, as a method of monitoring conditions to inform if sports events should go ahead. Interviewees also highlighted using weather warnings to guide safety measure implementation and cancellation if needed. One interviewee also noted the importance of early warning for flooding, saying “It is vital that flood prediction modelling is accurate to avoid unnecessary cancellation and associated costs.”
Reducing the risks to grassroots sports events
A key response in reducing the risk to events identified in the literature involves changing timings, locations or rescheduling events (Department for Culture, Media & Sport (DCMS), 2025; SGSA, 2025). A study identified that around 20% of observed adaptation mechanisms for grassroots sport in England involve altering session timings (Department for Culture, Media & Sport (DCMS), 2025). Interviewees discussed adjustments to scheduling in cases where there was expected extreme weather, as well as the potential for avoiding scheduling of events in winter/autumn due to wetter conditions. Rerouting or changing the venues of events was also discussed. Interviewees raised examples such as planning and providing pre-checked contingency routes for courses, permanently moving venues due to the impacts of wet weather on the ground, or changing course location or route. However, if rescheduling or rerouting needs to take place at short notice, it can be costly for event organisers and frustrating for event participants.
Insurance, including public liability insurance and cancellation insurance, is key to providing financial protection to events under increasing climate risks. There has been an increase in cancellation insurance premiums for events, which has been linked to rising costs and fees throughout different sectors (Joelle, 2020). Anecdotally, an interviewee noted that the cost of cancellation insurance is already high, and that they had observed a cost increase of 10-15% each year in recent years. Hence, although this insurance is effective in protecting organisations from cancellation costs, the cost of insurance is likely to become an increasing burden on clubs.
No examples of subsidies or other assistance relating to insurance or reinsurance relevant to the grassroots sports sector in Scotland were identified in this work. Further work is needed to discern the impact of increasing insurance costs on grassroot clubs and the scale of this alongside other increasing costs. Given the position of Edinburgh as a hub for the UK insurance sector and existing partnerships between the sports sector and the financial sector (such as Barclay’s sponsorship of the top four tiers of women’s football in Scotland (Freeman, 2024)), there may be opportunities for further work in Scotland on the impact of financial products on communities in relation to climate change and also opportunities for the financial sector to support engagement with sports organisations on climate change.
Case study 3: Extreme weather guidance for events from Scottish Disability Sport
Sport: outdoor sports
Climate hazard: extreme heat, wildfires, storms, flooding
What was the challenge?
Scottish Disability Sport is the national governing body for sports involving individuals of all ages and abilities with physical, sensory, or learning disabilities. Athletes with diverse and individual conditions are often particularly vulnerable to extreme weather events, which are increasing in frequency under climate change. This makes it essential for governing bodies such as Scottish Disability Sport to anticipate, manage, and mitigate these risks when organising events and competitions.
What action was taken?
Scottish Disability Sport have developed an inclement weather policy for use by event organisers and considerations relating to weather events are also included in their general wellbeing and protection policy.
The wellbeing and protection policy provides general guidance for routine checking of weather forecasts, while the inclement weather policy involves specific guidance surrounding rain, winter weather, hot weather and thunder and lightning, as well as how the guidance should be communicated when inclement weather is experienced (Scottish Disability Sport, 2026).
Communication methods have been developed for disseminating advice and decisions made from these policies. These have been effective in reaching participants to provide guidance and cancellation information. Channels have been set up to communicate any decisions and clear roles and responsibilities for individuals, and social media has been used to reach participants quickly.
The hot weather policy states that training programmes should be reviewed if projected temperatures exceed 35°C (Scottish Disability Sport, 2026). The hot weather policy also flags that at 29°C the body can no longer readily dissipate heat, noting that this is dependent on humidity, and that exceedance of 32°C is considered hot weather (Scottish Disability Sport, 2026). These thresholds are relatively high, and risks from heat can be experienced at lower temperature thresholds. Public Health Scotland has identified that the risk of heat related death to the Scottish population starts to increase at 18.2°C (Public Health Scotland, 2025). However, incorporating a defined temperature threshold at any level was not identified in other policies during this work. Thresholds or trigger points have been identified throughout the literature as a critically important response to the risks posed by extreme heat, as they provide a quantifiable point at which action should be taken (Orr et al., 2021; SGSA, 2025). Further work may be needed to identify the most appropriate thresholds for different sports and contexts.
What was the impact?
The policies have been implemented at events including annual summer camps in the Highlands. The policy prompted the organisation to respond to cold conditions by providing foil blankets and handwarmers, while in dry and warm conditions there was cancellation of BBQs to reduce fire risk, the provision of extra suncream, shaded areas, and heightened awareness of heatstroke risks. The Junior Athletics Championships, held in June, have faced highly variable conditions across years, including gale-force winds, hailstorms, torrential rain, and intense sun, requiring the implementation of the inclement weather policy to pause events when necessary. Overall, these policies have saved individuals and groups wasted journeys and have supported more efficient decision making so cancellations can be made earlier, reducing frustration from attendees which could otherwise risk engagement. Staff and volunteers also feel that these policies provide structure and a clear procedural approach. These policies therefore encouraged awareness and action in a variety of instances of inclement weather, increasing participant safety.
Key lessons learned:
1. Guidance provided for different weather events, including heat: Clear tailored policies are provided for different forms of inclement weather, with guidance on action to be taken.
2. Effective communication of actions, with clear roles and responsibilities: Clear roles are provided in the inclement weather policy, and information is disseminated to participants following action from the policy.
3. Heat policies with specific thresholds are useful for ensuring participant safety and are likely to become more necessary in Scotland in the near future as the climate changes.
Reducing the risks to facilities and places in grassroots sport
Managing grass pitches and surfaces
Managing grass pitches appropriately for field sports can reduce the risks from a changing climate. Adaptive measures can include irrigation, using drainage systems to prevent waterlogging and selecting climate resilient grass species (Bone, 2023). Although, some of these measures are likely to be prohibitively expensive for grassroots clubs, and limits may be placed on irrigation by hosepipe bans and other water scarcity measures under serious drought conditions. The Ground Manager’s Association provides comprehensive guidance for managing sports pitches during drought and, in England and Wales, runs a pitch advisory service that offers expert advice to clubs, local authorities and schools to improve the quality of their pitches in general (Grounds Management Association, 2025). Of the grassroots organisations who have taken up recommendations from the pitch advisory service, 86% have improved the quality of their pitches (Joyeux 2021).
In golf, greenkeeping has become increasingly important in addressing climate-related challenges (Reesink Turfcare, 2024) . However, interviewees identified that many clubs face capacity issues, often relying on volunteers. These capacity issues create operational challenges, with workforce shortages being a current concern for the greenkeeping profession (Dorsey, 2025; Tennant, 2025).
Shifting to artificial surfaces
In some cases, clubs have opted to replace grass pitches with artificial pitches and surfaces to avoid waterlogging in adverse weather and as a way to increase participation and prevent cancellations. For example, in cricket artificial grass surfaces are often used to mitigate the effects of the weather and allow play when conditions mean it is difficult to maintain grass (sportscotland, 2006). In general, decisions to install artificial pitches are not made with climate change in mind and are not specifically thought of as an adaptation measure by clubs. Generally decisions are driven by a desire to improve pitch quality and increase capacity. While grass pitches can only be used for a limited number of hours each week to avoid damage, artificial pitches can have up to 80 hours of use per week and hence present significant benefits for access and participation (Scottish FA, 2016; Sport England, 2025).
Third and fourth generation (3G/4G) artificial pitches are a common choice, however, these have some disadvantages:
Up front cost of installation is high, although there may be opportunities to generate revenue by renting the pitch out given higher usage is possible (Scottish FA, 2016). Opportunities to generate revenue are likely to be context dependent, for example there may be less potential in rural areas, and further research is needed to understand the impact of contextual factors.
Pitch surfaces on average need to be replaced every 10 years, although can last up to 13 years, adding to the cost and creating waste (Football Foundation, 2026).
Although artificial pitches can handle more rainfall, interviewees noted that they still have the capacity to flood and are not truly ‘all-weather’. Typically, artificial pitches are designed to provide highly efficient drainage so to reduce flood risk on the pitch (Scottish FA, 2026). A North American study identified that although synthetic turf fields can manage stormwater and provide sufficient drainage when designed correctly, damage due to flooding or improper maintenance can reduce these abilities (Procopio and Bonventre, 2022).
A Swedish study found that replacing grass fields with artificial fields can reduce biodiversity and pollution reduction benefits associated with soil processes, although the extent of this is context dependent. The study also noted that these could be offset to some degree by tree planting or green roofing in the surrounding area (Lozano and Ferguson, 2021).
Artificial pitches are more abrasive and therefore cause more grazes and friction burns than grass, although studies have found that overall injuries are no more likely on artificial turf than on grass for amateur players (Kuitunen et al., 2023).
A recent report found that artificial pitches are the main source of intentionally added microplastic pollution in the UK (Economics for the Environment Consultancy and UK Centre for Ecology & Hydrology, 2025). Following similar findings in Europe, the EU have introduced legislation phasing out the sale of products that intentionally release microplastics (Amis, 2023). Concerns were raised by interviewees regarding the environmental impact of artificial pitches due to the presence of microplastics. Sustainable infills that can provide an alternative to microplastics are being explored, with a trial of biodegradable corn infills being used as part of pitch resurfacing in Glasgow (Glasgow Life, 2025). Corn infills were also used in 6.2.5.1 Case Study 4.
Overall, artificial pitches can offer an opportunity to support higher levels of participation but may not be suitable for all local contexts and additional measures may need to be implemented to manage environmental impacts. In some cases, improved management of grass surfaces (as discussed in section 6.1.4.1) may offer a more suitable or accessible alternative.
Using artificial snow and other options for snow sports
In mountain and snow sports, artificial snow can be generated in response to reduced natural snowfall (McKenzie, 2025). The use of artificial snow is water and energy intensive and therefore costly (Loughborough University London et al., 2022; François et al., 2023; Symons, 2024). Additionally, only relatively small areas of the mountains can be covered with artificial snow and hence use of artificial snow at large scales may be unfeasible, especially with decreasing water availability expected with climate change (Loughborough University London et al., 2022).
Other adaptation strategies for snow sports providers include diversifying activities offered, such as trail running and hiking, to mitigate the risks to businesses and local economies (Hopkins and Maclean, 2014; Symons, 2024). In interviews, an alternative option discussed was increasing the provision of good quality artificial slopes in Scotland to increase the sport’s capacity. Encouraging further use of artificial slopes, and expanding these where possible could help to maintain participation (Scottish Government, 2023b). However, there are gaps in provision of artificial slopes in some areas of Scotland (Scottish Government, 2023b).
Managing footpaths, cycle paths and bridleways
Sports like running, walking and cycling often occur across large areas such as parks, pavements, roads or the countryside that are publicly maintained. Managing and maintaining routes in public open spaces to prevent erosion, or providing alternative routes after erosion has occurred, is key to maintaining access to these spaces. Options to protect footpaths from erosion include reducing gradients to slow the rate of erosion due to surface water, alongside installing additional drainage (Dolphin, 2025). One instance of providing an alternative route following erosion of a common walking route was identified in the Cairngorms where a ranger realigned a path uphill after a riverside path was damaged by 2 large floods in 2014 and 2015. The new route was safe from river erosion and flooding, meaning access could be maintained (Dolphin, 2025). Further action to protect footpaths is illustrated in 7.3.1.2 Case study 6.
Developing indoor facilities
Throughout interviews, the use of indoor facilities by outdoor sports in poor weather was highlighted as an adaptation response. Although this protects participants from risks associated with adverse weather conditions, there are a number of caveats. For example, lots of clubs moving inside simultaneously can increase the demands on facilities and drive up prices. Additionally, indoor spaces were identified to be generally more expensive, particularly when used as a last-minute response to worse weather.
Investment in facility heating and cooling to manage the impacts of extreme cold and heat, and drainage infrastructure or other flood protections to mitigate the risks form extreme precipitation and flooding may be needed to further protect indoor activities (Orr et al., 2021; Department for Culture, Media & Sport (DCMS), 2025).
From interviews, the focus on building or retrofitting facilities tended to be on improving heating rather than cooling, due to the cold weather impacts currently typical in Scotland. One instance was identified where waterproofing a basement of a sports outdoor centre, as well as the use of gabion cages for reinforcement to prevent subsidence of land around the building, had been undertaken at a site near a river where flooding is becoming more frequent.
What resources and support are needed?
As shown in Figure 6‑1, implementation of these measures is contingent on enablers being in place, details of key enablers for increasing capacity for climate adaptation action in grassroots sport are outlined with examples of where these already exist in Scotland.
Data
Improved data on weather related impacts, participation trends and cancellations can help inform adaptation decisions and make climate impacts evident to sports participants and clubs. Very limited data on climate impacts on sport in Scotland is publicly available or collated by SGBs. Many interviewees noted that they would be interested in collecting data on cancellations, however had not implemented this due to a lack of capacity. Data could help justify investment in facilities for climate adaptation (e.g. synthetic pitches) by presenting the frequency and impact of adverse weather. Many grassroots clubs use web applications (such as Spond, Pitchero and Teamer) for managing fixtures and communication and so providers of these applications may hold data that could be used to better understand cancellation and postponement in some sports.
For example: Scottish Rugby gather information on postponements and cancellations via reporting by club fixture secretaries. This is collated in their centralised, in-house data management system and tagged with the relevant reason for cancellation or postponement.
Skills and knowledge
Confidence in knowledge of climate change impacts, how to act on them, and how to communicate this, is key to implementing adaptation actions (Department for Culture, Media & Sport (DCMS), 2025). For instance, improving understanding could help clubs identify when and where funding may be needed to adapt to climate change and how to communicate this need for action. Without understanding of climate change impacts, increasingly worse weather being experienced may not be linked to a need for climate adaptation actions.
Interviewees were typically able to identify some climate change risks of relevance to them, but often missed some key risks, especially extreme heat. One interviewee asked for signposting to further resources so they could increase their knowledge. Some interviewees also showed less confidence distinguishing adaptation actions from actions to reduce greenhouse gas emissions, highlighting a knowledge gap. Interviewees also emphasised that, with many grassroots organisations being run by volunteers, capacity to undertake training or build knowledge on climate issues is often very limited.
Interviewees also mentioned that in some cases, specific skills and knowledge may be required for successful implementation of adaptation. For example, skills such as greenkeeping and farriering are needed to maintain golf courses and ensure horse welfare respectively in the face of increasing climate impacts. There are already shortages of these skills in some areas of Scotland (Murray, 2023; Tennant, 2025).
For example: Keep Scotland Beautiful provide climate emergency training to the sport sector in Scotland. Part of this is to help understanding of how Scotland’s sport sector will be impacted by climate change (Keep Scotland Beautiful, 2025). However, capacity has been a barrier to widespread uptake of this climate emergency training across Scottish sport organisations.
Funding and investment
Funding routes need to be available for climate adaptation and clearly promoted to clubs as a way to improve their facilities to decrease the risks associated with worsening weather (Department for Culture, Media & Sport (DCMS), 2025).
For example: An investment partnership established between sportscotland, Glasgow City Council and Glasgow Warriors was supported by Scottish Rugby and scottishathletics to fund a synthetic playing surface, alongside improvements to existing athletics facilities, with the aim of reducing the risk of postponement and cancellation due to poor weather conditions (Sport First, 2016). Although Glasgow Warriors are a professional rather than grassroots team and this specific case was a response to current pitch conditions rather than preparations for climate change, the multisport partnership is an approach to developing investment that could also be used elsewhere, as illustrated further in 6.2.5.1 Case study 4.
Leadership and governance
Many interviewees talked about leadership, at club, local authority and governing body level, as important to prioritise adaptation, improve capacity, support action and develop partnerships. Many clubs are reliant on volunteers or do not have any dedicated roles relating to climate change (Department for Culture, Media & Sport (DCMS), 2025).
Partnerships
Strong partnerships between clubs, local authorities and governing bodies are key to enabling adaptation action and knowledge sharing on climate change issues. Lack of facility ownership can prevent adaptation of facilities, however, strong partnerships could serve to reduce the impact of this barrier to climate adaptation (Department for Culture, Media & Sport (DCMS), 2025).
Case study 4: Building a business case for grassroots adaptation at Shetland Rugby club
Sport: Rugby
Climate hazard: Extreme precipitation and flooding
What was the challenge?
Shetland Rugby club was experiencing regular flooding issues on their grass pitch (Shetland News, 2024). Over the last decade, flooding has become more frequent on Shetland. This has caused the loss of eight weeks of training time in the past year for Shetland Rugby club. Historically, Shetland has not supported an outdoor sports season during the winter months due to adverse weather conditions and limited daylight. This has resulted in most sporting activity moving indoors, leading to increased competition and higher costs for indoor spaces. The growth of rugby has highlighted the need for a facility capable of sustaining increased usage while remaining resilient during a period in which the impacts of climate change have intensified.
What action was taken?
The Sport and Leisure department at Shetland council led a proposal for an outdoor artificial pitch to be used for both football and rugby. This proposal was prompted by consistent discussions about the flooding issues on the grass pitch, and anecdotal observations of changes in flooding over the years. Met Office data and resources from Adaptation Scotland were used to support these observations. According to this data, winters in Scotland over the last decade have been 19% wetter than the 1961-1990 average and further increases in rainfall of 8-12% are predicted between now and 2050. These statistics were used within the proposal to make the case that flooding was expected to worsen on Shetland, and hence new facilities would be required to allow grassroots sports to continue and grow.
The proposal was developed via collaboration between the Council and multiple other sporting organisations in Shetland, including Shetland Rugby and Shetland Football. A partnership was established between interested groups, and several rounds of meetings and discussions were arranged to coordinate funding. This collaboration benefited from the shared agreement on the end goal of an artificial pitch.
What was the impact?
Ultimately, funding for the project was provided by a range of sources: Shetland Islands Council, the Scottish Football Association, sportscotland, Scottish Rugby Union, Shetland Football and Shetland Rugby. The total cost was about £1.46M. The pitch uses an infill material made of biodegradable corn to avoid the negative environmental impacts of rubber infill discussed in section 6.1.4.2 (Kerr, 2025).
Shetland Council were able to coordinate an approach to support both Shetland Rugby and Football by recognising the impacts of increasingly worse weather on the grass pitch. The new pitch has the potential to increase participation by reducing cancellation rates, improving engagement through the winter and improving playing conditions. Anecdotally, feedback from players on the new pitch so far has been extremely positive. The development of the new pitch will not only enable the continued progression of rugby but will also provide opportunities for a wider range of outdoor sports to operate throughout the winter season.
Key lessons learned:
1. Understanding climate impacts on the club: The community observed that flooding issues on the pitch were increasing over time, and this was linked to freely available historic and projected climate change data.
2. Coordination and partnership approach to funding: This ensured that the proposal for the artificial pitch met the needs of sporting organisations and groups across Shetland. The council took a leadership role which facilitated coordination of the different sporting organisations on Shetland, and several rounds of meetings supported development and coordination of the multiple funding sources.
Public engagement on climate through sport
What are the perceptions of climate risk and adaptation within grassroots sports?
Perceptions of climate risk
In a Keep Scotland Beautiful study, it was found that more than 75% of people in Scotland believe sports clubs and sport governing bodies should work to reduce emissions and climate change impacts. More than half agreed that sports clubs (58%), sport governing bodies (60%) and sports players (50%) should use their platform to encourage climate action (Keep Scotland Beautiful, 2023). However, only 39% of respondents to a survey of youth participants in Scottish grassroots sports, said their group’s activities were impacted by climate change in the past six months (Sported, 2024). This suggests that whilst there is a general awareness of climate change amongst sports fans, people may not be attributing their lived experience to impacts of climate change.
It is recognised that personal experience with extreme weather events directly influences risk perception (Van der Linden, 2014). For many outdoor sports, interviewees cited personal experiences of climate impacts disrupting their sports when talking about climate risks. However, interviewees also commented that, in Scotland, impacts from extreme weather events are an accepted day to day reality of participating in grassroots sports. Whilst extreme weather events are increasing in severity and frequency, one interviewee noted impacts such as event cancellations and waterlogged pitches “have always happened”. As such, some interviewees did not perceive significantly increased risks from the changing climate. Interviewees also noted that damage to infrastructure and equipment during extreme weather events was often attributed to a long-term lack of maintenance rather than climate change.
As discussed in section 6.2.1, data collection relating to climate risk is very limited for grassroots sports. Therefore, perceptions are largely anecdotal and based on lived experience. Overall, perceptions around the level of risk varied by type of hazard. Interviewees frequently cited the impact of flooding on sporting activities and event delivery as a key risk. The impact of extreme heat and drought was cited much less frequently overall, and only in instances where hot dry weather had recently led to event postponement or cancellation.
Perceptions and understanding of adaptation
When talking about taking action on climate impacts, the majority of interviewees referred to ‘sustainability’ rather than climate adaptation. Sustainability was interpreted holistically, in an environmental sense but also including financial sustainability and ensuring sport’s and club’s longevity. Developing a sustainability policy addressing these issues was generally viewed as something a club ought to do. However, the usual focus of sustainability action currently is on reducing carbon footprint, with little acknowledgment of climate risk. Where adaptation action has been undertaken, such as through introduction of artificial pitches or extreme weather policies, it was often not explicitly recognised as such.
Interviewees generally noted that there is willingness to take action to manage climate risk and adapt, but a lack of knowledge around effective measures and capacity to implement these. Even at the elite level, athlete activists have reported uncertainty around ‘correct’ climate actions and messaging to share with sporting audiences (Knowles, Scott and Rutty, 2023). Interviewees also noted a lack of clarity around the roles and responsibilities of clubs and other sporting bodies in terms of delivering adaptation action. This uncertainty directly affects their ability to provide clear, simple messaging to participants around climate adaptation and create buy-in for action. One club was cautious to provide messaging around climate impacts, in case information changed in the future. As acknowledged in section 6.2, this lack of knowledge also means organisations are less confident on how to use funding to deliver measures that will help adapt to climate impacts. Discussions about climate change must include an acknowledgement of people’s capacity for response in order to avoid being disempowering and patronising (Orr and Inoue, 2019).
At the global level, the United Nations Framework Convention on Climate Change (UNFCCC) has responded to the increasing perception of climate risks in sport, establishing a Sports for Climate Action Framework (United Nations Climate Change, 2022). The framework aims to align sports with a 1.5°C climate-safe future and help sports adapt to the impacts of climate change through partnerships and collaboration, as well as to leverage the platform of sports to engage communities, fans and global audiences on climate action. It should be noted that the CCC have advised that , at a minimum, the UK must be prepared for reaching 2°C of global warming in the next 25 years, rather than preparing for a 1.5°C future (Climate Change Committee, 2025). Commonwealth Games Scotland and Snowsport Scotland are signatories of the Sports for Climate Action Framework, as well as a number of UK and Great Britain wide sports organisations. The framework provides guidance on actions signatories should take and also provides training on climate risk, mitigation and adaptation. This study did not assess level of engagement with the Sports for Climate Action Framework, so the influence of these resources on sporting organisations’ perceptions and understanding of adaptation, is unknown.
How can sports communities be effectively engaged on climate change?
Hooks for engaging with sporting communities
Sport is core to many people’s lives and has a uniting power to bring people together (European Climate Pact, 2024). This means sport can be used as a hook to engage communities on climate issues, raise awareness and influence behaviours. A number of specific hooks for engagement with sports audiences have been identified and are summarised in Figure 7‑1:
- Sporting identity: Many sports participants consider sport to be a core part of their personal identity, identifying themselves as ‘hikers’, ‘footballers’ or ‘skiers’. Hence, personalising communication to appeal to these groups, may help to galvanise support for adaptation action and pitch engagement in terms of what is most important and actionable for individuals and clubs. Previous work has found that behaviour is effectively influenced when messages align with individual values and worldviews of the target audience (Bolderdijk et al., 2013).
- Concern for future generations: A number of interviewees noted that many sports participants are passionate about introducing their children to the sport they love. In some cases, families may even move to a specific area to improve access to their sport. A study in North America noted that legacy is an important driver for engagement. Not being able to pass on a sport to future generations, in particular younger family members can mean participating in sports feels less meaningful for current participants if there is a perceived likelihood that the activity may only be available to this generation (Protect Our Winters, 2020). Interviewees reported that more generally, grassroots sports may use messaging relating to ‘protecting the club’ to motivate people to take action to ensure that their clubs, which may have existed for many generations already, will also be around for future generations to enjoy and to continue their legacy.
- Focus on practical implications including disruption and cost: In the interviews, messages around impacts on access, maintenance, health and safety and cost were viewed as key for mobilising action for both sporting participants and sporting organisations, particularly where these impacts are already being felt. Messaging around addressing rising costs due to climate change was a particularly compelling hook, as increasing costs of maintenance and repairs are being passed on to players through membership or event fees, raising the point of entry. Previous work in England has acknowledged that there is a risk of grassroots sports becoming “increasingly elitist” as rising costs due to climate change reduce accessibility (Department for Culture, Media & Sport (DCMS), 2025). Sporting clubs and organisations are facing significant wider challenges around the availability of facilities and spaces, as well as the costs of running, owning, and maintaining such venues (Sported, 2024). Hence, action on climate risk may not be seen as a priority. Several organisations noted messages which focus on cost savings, and direct benefits for participants, are key.
- Appreciation of the environment: In some cases, particularly for sports taking place in more rural areas or in the Scottish mountains, interviewees identified pride in the Scottish environment and a general appreciation and care for the environment to be a motivating factor.
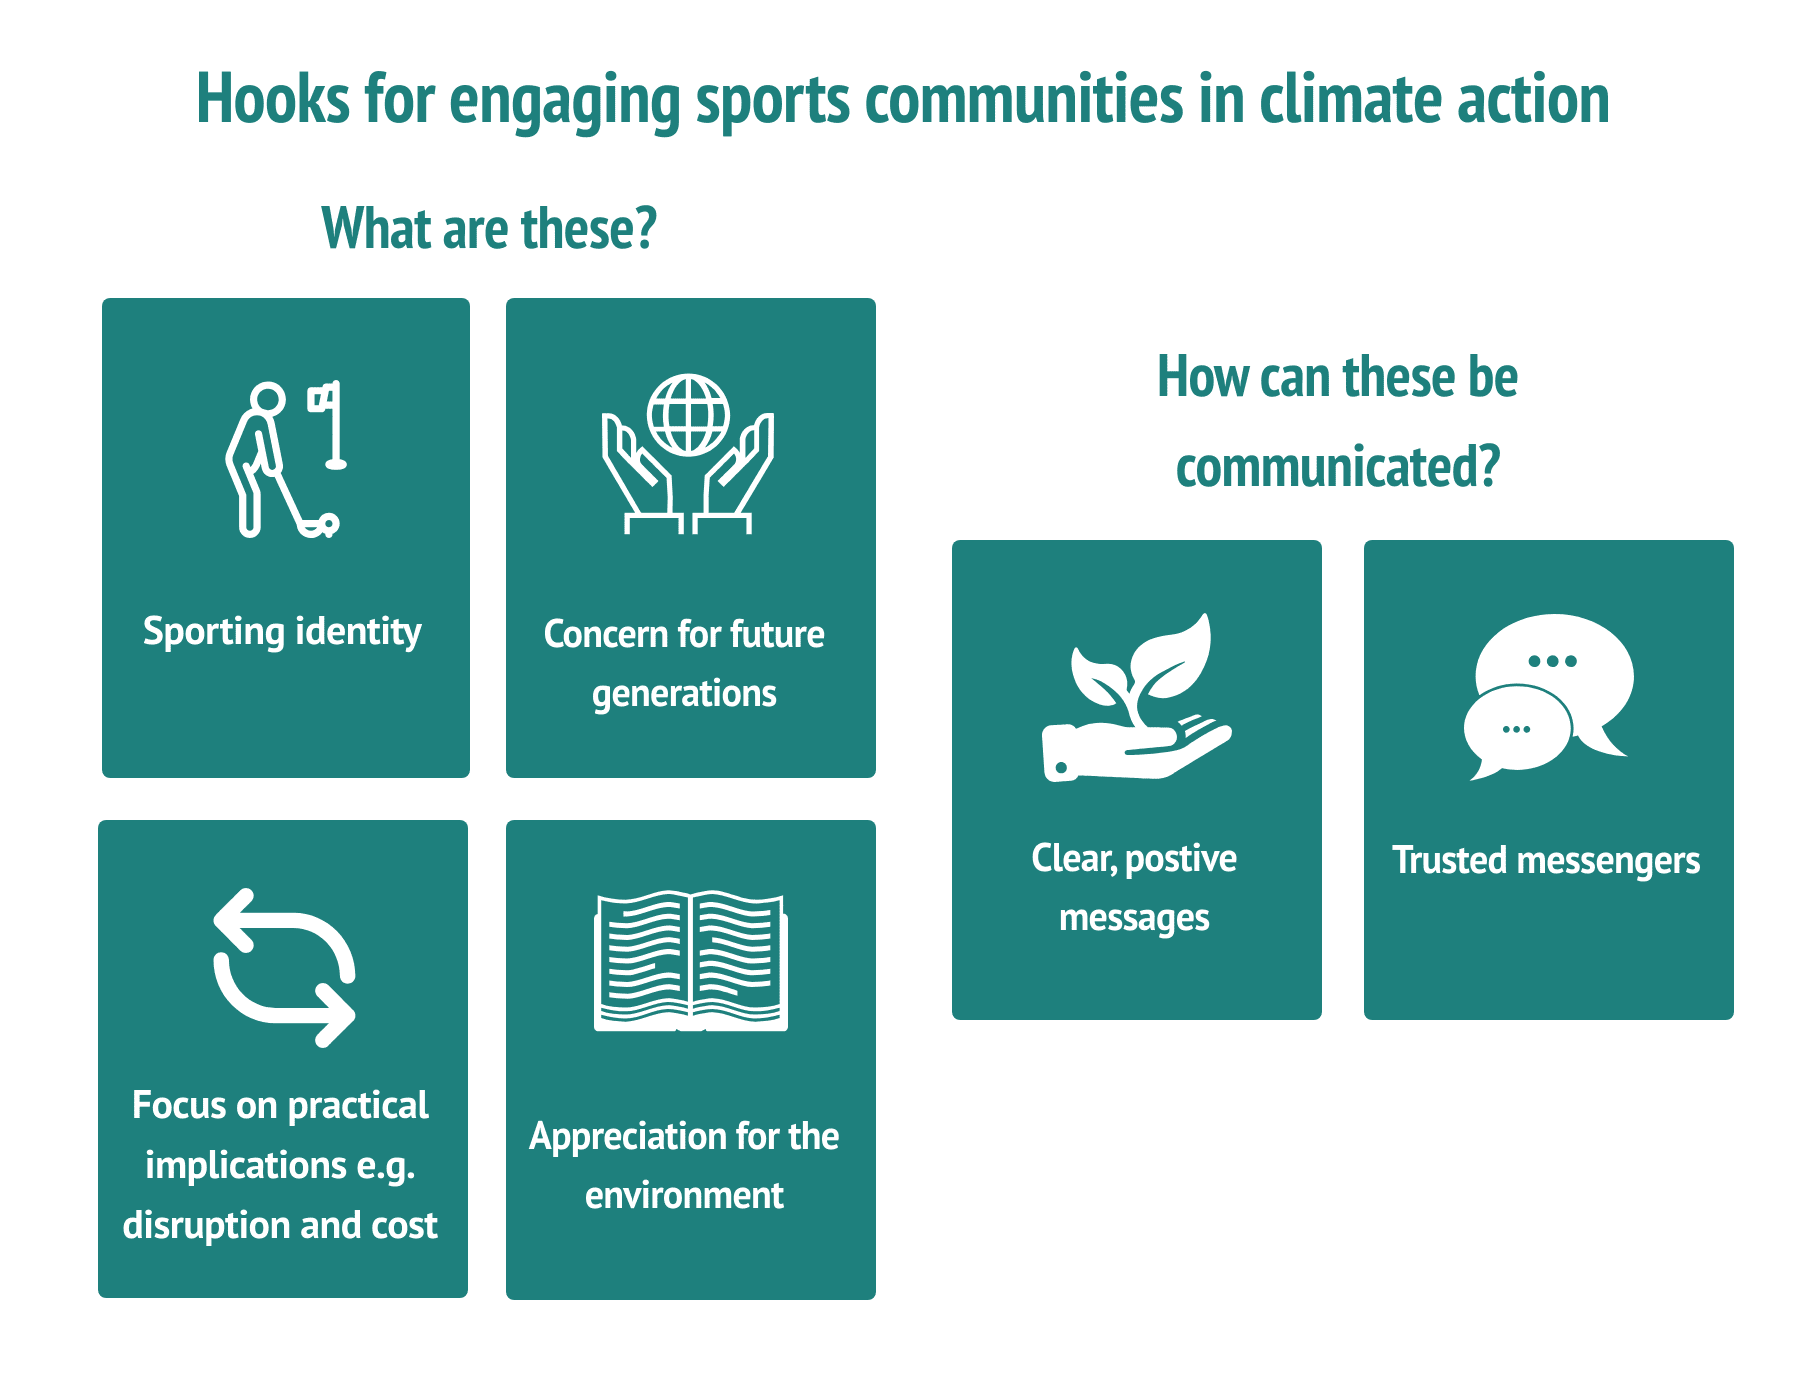
Figure 7‑1: Summary of hooks identified for engaging sports communities on climate issues.
Trusted messengers
The role of the trusted messenger is vital for engagement. A trusted messenger is an individual or organisation that has influence and credibility within a community, be that sporting or geographic. They foster genuine connections, and use their shared experiences, interests, values and deep community bonds, to inspire action (Purpose, 2025). Individuals who take on leadership roles within sporting communities, such as elite athletes or coaches and captains at grassroots level, build trust around climate messaging and legitimise action, as well as being able to reach wider audiences (Sport Positive, UN Sports for Climate Action and CAST, 2024). Interviewees noted that “role models are vital” and trusted messengers can share powerful, personal stories about the climate impacts they are seeing, how the impacts are affecting them, and inspire change. The global Adapt2Win campaign is an example of where professional athletes are using their platform as role models and trusted messengers and emphasising impacts on sport to call for climate adaptation action (Adapt2win, 2025). England football player Beth Mead is part of this campaign and has highlighted her experience of extreme heatwaves leading to cancellations of professional level football matches (Mead, 2025).
Trusted messengers from sports organisations can also support engagement with members of the community who are engaged with sports organisations, but not with other groups that typically share messaging around climate change. One interviewee stated that broad environmental NGOs have less impact in sports communities as they are less aligned with the values of the people involved. A study in North America supported this view, finding that traditional environmental and climate change messaging often fails to resonate with the outdoor sports community (Protect Our Winters, 2020). Another interviewee mentioned that a club member with expertise in climate change acted as a trusted messenger in their sports club when speaking with other members and hence helped to build support and acceptance for adaptation measures. This led to partnerships between the club and local schools to raise awareness of the adaptation measures in the wider community. Another interviewee mentioned that organisations like Local Authorities may not have a good understanding of some parts of the community’s interests, whereas local sports clubs often do and hence can tailor their messaging.
Clear, positive messaging
Providing clear, positive messages that emphasise opportunities for action is important for engagement (Football for Future and Common Goal, 2025). One interviewee highlighted that the use of positive messaging during an in-person energy efficiency event, fostered community engagement for climate action. The event, hosted in partnership with Home Energy Scotland, raised awareness of energy efficiency measures grassroots sports participants can take, and tailored messages around tackling fuel poverty. Advice was focused around making climate action practical and solution-oriented, recognising the community’s limited time and budget. It was noted in an interview, when it comes to sharing climate messages the “more normal the wording, the better”. Another interviewee highlighted lessons from government messaging during the COVID-19 pandemic, noting that the coherent, simple messaging with clear actions for individuals attached, and a clear purpose, was easy to communicate to the sports community.
Engagement is effective when an understanding of climate impacts is coupled with the reality of everyday lives, and an understanding of what climate change means in practice for places (Climate Outreach, 2023). People are most interested in what they can do to make a difference, and this is best communicated through relatable, personal actions (Protect Our Winters, 2020). Applying this approach to engage with grassroots clubs around climate adaptation measures, could unlock opportunities for climate resilience to become embedded within communities. An example of where this has been used effectively for community engagement through sport is illustrated in 7.2.2.3 Case study 5.
Case study 5: Alloa Saints Youth FC trees for goals
Sport: Football
Climate hazard: Extreme precipitation, flooding and heat
What was the challenge?
Alloa Saints Youth Football Club has been experiencing the effects of climate change. Heavier, more frequent rainfall is leading to waterlogged grass pitches and increased seasonal flooding. Artificial pitches are becoming increasingly expensive to hire for training and matches, so training costs for young players are increasing. This affects participation rates, especially against the backdrop of generally increased cost of living. Parts of Alloa are within the most deprived 5% of areas in Scotland (Scottish Government, 2020).
What was done?
The Forth Climate Forest approached Alloa Saints Youth Football Club with the opportunity to take up the ‘Trees for Goals’ initiative. For every goal scored, one tree was planted by the club, from the beginning of the 2024 season until National Tree Week (ending 1st December 2024). This initiative was a partnership between Forth Valley Climate Action Hub, The Conservation Volunteers Scotland and Forth Climate Forest (Youth Football Scotland, 2024).
The aim of the project was to teach young players that community sports can have a real impact on tackling climate change and biodiversity loss. Planting trees can be an effective measure for climate adaptation, providing shading and flood protection. The Trees for Goals initiative supports the Forth Climate Forest’s goal, to plant 16 million trees in Clackmannanshire, Falkirk and Stirling within the next decade (University of Stirling, 2024).
What was the impact?
Through the scheme, 1,200 trees have been planted in Sauchie Meadow, an area which was previously empty field land. Forth Climate Forest identified locations where planting more trees would create benefit for people and wildlife (University of Stirling, 2024). Linking tree planting as a long-term solution to climate impacts the community is already experiencing helped to raise awareness.
Key lessons learned:
1. Use of simple and positive messaging: ‘For every goal, one tree is planted’ is an effective mission statement which creates buy-in for the community. A 6-year old player commented “that’s a tree” when they scored a goal.
2. Partnership working: Working with an existing campaign enabled Alloa Saints FC to focus on engagement and participation rather than establishing mechanisms for delivery or funding, as well as benefit from the knowledge and expertise of wider organisations.
3. Physical act of tree planting: Taking tangible action allows people to feel positive about contributing to solutions. To maximise these benefits, planning and coordination is needed to ensure timing and communication of activities is tailored to the community’s needs.
How is sport being used for engagement?
Sport is a powerful vehicle for driving positive change as it transcends cultures, borders and generations (International Olympic Committee and United Nations Climate Change, 2019). Sport has a history of empowering local communities to become agents of change (Football for Future and Common Goal, 2025), notably shifting social norms around food poverty and gender equality and connecting sectors (UNFCCC Sports for Climate Action, 2025).
The majority of examples of sport being used for engagement on climate change identified through this work are related to reducing emissions and climate mitigation, with relatively few examples of sport being used as a tool to raise awareness of climate risk and adaptation. This likely reflects the wider climate action landscape in the UK, where mitigation action has historically had a higher profile than adaptation. As discussed in section 7.1.2, a lack of knowledge is currently a barrier to clubs and governing bodies driving adaptation action and engagement within communities themselves. Specifically, examples of climate impacts on grassroots sports clubs leading to action and awareness amongst the wider community have not been identified. Examples of initiatives that supported sports participants to engage in adaptation related action are illustrated in Section 7.3.1.1 Case study 5 and Section 7.3.1.2 Case study 6.
Although the following examples of sport being used for climate change engagement are primarily focused on reducing emissions, pollution or litter, they illustrate the breadth of initiatives underway in Scotland and similar approaches could be used to support engagement on risk and adaptation in future.
Surfers against Sewage are a charity involved in raising awareness around climate change and pollution. They are active throughout Scotland. They are supported by a range of sports including swimming, kayaking and surfing, and often run events to raise awareness for issues affecting their sports (Goldblatt, 2025).
Protect Our Winters UK, based in Edinburgh, brings together winter and outdoor sports participants to protect cold environments. They take a systemic focus and seek to educate, advocate and collaborate for climate action, connecting with sporting organisations to widen support. They connect lived experiences of climate impacts with potential future climate risks, and highlight the need to consider these at the national consultation level (Protect Our Winters, 2020).
The Scottish Football Association have partnered with Zero Waste Scotland to provide a guide on how Scottish football clubs can become more environmentally sustainable. They reach out to clubs to encourage them to think about sustainability and climate change, promote stories, as well as funding resources. Ayr United delivered education in schools on climate change through their academy (Mabon, 2022)
The Pledgeball initiative involves fans making a climate related pledge linked to their club via the Pledgeball website. Pledges include things like walking or cycling for short journeys or eating more vegetarian meals. Pledgeball shows fans how they can take action themselves, makes fans actions visible to each other, raises the awareness of the impact of collective action, and links fans’ existing values as supporters of their club to climate change (Allan, 2025).
Case study 6: It’s up to us – Scottish mountaineering campaign to restore paths
Sport: Mountaineering, hiking
Climate hazard: Extreme precipitation, flooding and snowmelt leading to footpath erosion
What was the challenge?
High rainfall and flooding events are increasing in frequency and severity, due to climate change. Footpath erosion of mountain paths in Scotland is worsening due to this extreme weather and the cumulative effect of increased levels of participation in hillwalking. Many of Scotland’s mountain paths have become badly eroded and are in desperate need of repair for the safety of users and the integrity of the fragile mountain habitat. The upland path network provides access to Scotland’s mountains and so underpins the hill tourism industry. The majority of visits to upland areas involve the use of a path. With most European funding no longer available post-Brexit and no UK government funding, most mountain paths are at risk of not receiving the essential maintenance required to keep them fit for purpose (Outdoor Access Trust for Scotland, 2025).
What action was taken?
The Outdoor Access Trust for Scotland and Mountaineering Scotland created the ‘It’s Up to Us’ campaign in 2023. The three-year partnership aims to raise £300,000 to repair the badly eroded hill path from Dundonnell on An Teallach, one of Scotland’s most iconic mountains in the Northwest Highlands (Outdoor Access Trust for Scotland, 2025).
The campaign seeks to raise awareness of the need for investment in repair, maintenance and restoration of mountain paths that are being affected by increasing extreme weather events. The messages in the campaign have been particularly effective, as they leverage national pride for Scottish mountain environments, appeal to ‘hill-goers’, and emphasise values of stewardship and nature as a right for all. Mountain paths are depicted to be integral to physical and mental wellbeing and connection with nature and Scotland’s wild places. The campaign raises the profile of challenges facing land managers in Scotland in finding funding for path repair and maintenance on privately owned land. The simple, direct message ‘it’s up to us’ acts as a compelling call to action; without financial support from hill-goers and further investment by government, the paths are at significant risk. Engaging with stakeholders and Government, the campaign also aims to develop a framework for a long term, sustainable fund for maintenance of upland paths.
What was the impact?
Contributions from the general public so far have totalled approximately £47,000 which is significantly more than was raised for the previous Mend our Mountains campaign in 2018. An additional £7,700 has come from clubs, £17,000 from corporate donations, as well as £33,000 from other major donors, including Cotswolds Outdoors as a lead sponsor. As of December 2025, the campaign is almost at the funding target of £300,000. The campaign has also incorporated several volunteer days and a team of volunteers forming for other joint initiatives for path maintenance.
Key lessons learned:
1. Engaging with wider stakeholders increases impact, including the Scottish Government, stakeholder agencies and organisations, outdoor businesses, and all path users.
2. Investing in social media and communications strategy upfront to reach a wider audience and potentially inspire action beyond the locality of the Scottish mountains.
Developing a funding microsite and campaign video and updating social media regularly with new videos and content, has generated online interest. Use of magazines, TV and newspapers have effectively generated sustained public engagement in the campaign. Focusing on platforms the sports community uses, was particularly effective.
Conclusions
Overview of key findings
Climate change is already impacting grassroots sport in Scotland and many of these impacts are expected to worsen in the coming decades. Different sports are impacted in different ways and to different degrees, but for all sports considered, it is expected that climate change impacts could reduce participation in sport and physical activities and increase costs. Increased cancellations and postponements, risks to health and wellbeing and transport disruption, may contribute to reduced participation whilst factors such as increased maintenance and repair need as well as insurance price increases contribute to higher costs. These impacts will not be distributed evenly, with sport potentially becoming more inaccessible to deprived areas which already experience lower levels of physical activity. Although climate change poses substantial challenges for sport, warmer, drier summers may allow longer participation windows for some outdoor activities if the risks are managed.
Adaptation actions can be taken to reduce the risks from climate change as well as harness the opportunities. These include educating participants to change their behaviour in extreme weather, adapting facilities to maintain high quality playing surfaces under flood and drought conditions, and putting severe weather policies in place. Currently, actions that may be effective in adapting grassroots sport to climate change are rarely explicitly planned with the future climate in mind and may be implemented for other reasons or to deal with current weather impacts. The key barrier to more strategic approaches across the grassroots sports sector is knowledge, and the capacity to build this, with more guidance needed on future climate risk and effective adaptation actions. Improved knowledge and skills across the sector would support more systematic monitoring of climate impacts, leadership by SGBs on adaptation, and more effective investment in building resilience.
Given the key role of grassroots sport within communities, improved knowledge and understanding of adaptation would also allow leadership by sports organisations on building resilience within communities. Currently, there is limited join up between community adaptation and sports organisations in Scotland. Sports participants are experiencing some of the risks climate change poses via extreme weather but do not always link these experiences to climate change, as there is some perception that they have always occurred. In general, the sports community has the will to act on these risks but may not know how to do so or have capacity to do so. By using athletes, coaches and sports clubs as trusted messengers to deliver clear, positive messages, grassroots sports could play a role in empowering communities to build resilience, particularly as sports clubs may have reach into areas of the community who may be less engaged with climate change messaging more generally. There are numerous examples of sport being used as a tool to engage people on emissions reduction or other environmental issues and these may provide a blueprint for future engagement on resilience.
Evidence gaps
Data relating to climate impacts on sport in Scotland and action being taken to adapt and respond to these is not systematically collected or readily available. This means it is difficult to understand the scale of the impacts and how this is changing over time, as well as monitoring where additional adaptation measures might be needed. There are some examples of individual clubs developing data collection at the local level but limited examples at larger scales. Although it is not usually possible to attribute cancellations directly to climate change, data provides a baseline from which future trends in cancellations can be understood and acted upon. Further exploration of data owned by fixture management apps could provide valuable insights into the scale of weather and climate impacts on cancellation and postponement.
There is limited evidence available on the specific adaptation options available for sport in Scotland, and their effectiveness under different circumstances. In many cases, actions currently being taken, such as building new artificial pitches or providing extreme weather guidance, are not explicitly recognised as playing a role in adapting to the future climate. Evaluating the efficacy of actions is difficult because there are often many factors affecting outcomes. This makes it difficult for organisations to understand what actions they can and should take to prepare for the future climate, the scale at which these actions should be taken and to build business cases to finance these actions. There are also currently limited mechanisms available to share learning and examples of good practice to support the scaling up of successful actions.
Most engagement between sports organisations and climate issues relates to reducing emissions rather than adapting to the impacts of climate change. This means that less evidence is available regarding the role of sports organisations and the climate impacts they experience in building community resilience or supporting community understanding of climate risk and what works well for achieving this, although relevant lessons can be applied from engagement with wider sustainability initiatives.
The limitations of this study outlined in section 4.4 mean that there may also be sport specific risks or adaptation measures that have been missed by this study due to a lack of literature or stakeholder engagement.
Lessons for policy
Based on this work, a number of lessons for policy around grassroots sport and adaptation in Scotland have been identified. These are listed below with the first two recommendations being the highest priority to build capacity for taking on the other recommendations.
- Training is needed to increase knowledge and awareness of climate impacts, and where further adaptation action is needed, across all levels of the Scottish sports landscape. While some training for sports organisations is already available, uptake can be low due to resource and capacity constraints. Sportscotland currently have a centralised training platform for SGBs which could possibly be used to provide training on climate impacts and adaptation. SGBs can then cascade learnings to grassroots clubs through existing networks.
- Improved data collection is needed to understand the scale and trends in climate impacts on Scottish grassroots sport. A first step towards achieving this could include supporting SGBs to collect data on events they are directly involved with, and building up to more comprehensive systems, learning from organisations such as Scottish Rugby who are already collecting regular data.
- Specific inclusion of sports in national and local adaptation planning and risk assessment. Given that local authority risk assessments and adaptation plans often flow directly from national level work, explicit inclusion of sport in national level adaptation planning, such as the Scottish National Adaptation Plan, would signal a need for involvement of sports bodies in adaptation planning at the local level as well. In England, Sport England are in the process of commissioning a climate change risk assessment for the sport sector. This will provide an evidence base to support this as well as learnings that can be applied in Scotland.
- Develop the role of grassroots sports organisations in building community resilience. This could be achieved by building partnerships between community sports organisations and community climate organisations, such as climate hubs, to deliver information and action in the wider community. This could help to build knowledge of climate impacts within the sports organisations, as well as expanding the reach of climate organisations by using the sports organisations as trusted messengers in wider parts of the community. Support, such as dedicated programmes or forums, would likely be required to develop these partnerships given that many of these organisations are volunteer led and have limited capacity.
- Alignment of sports facilities funding with adaptation goals to avoid long-term, maladaptive decisions. In the short term, funding streams (such as local authority climate funding) should be identified that can support preparation for and recovery from climate risks and advertised to the grassroots sport sector, including examples of measures that could be taken. Following storms and flood events, Sport England advertise their funding to grassroots sports groups explicitly to help them recover but there has so far been no equivalent to this in Scotland. Although national circumstances differ, a similar approach of identifying how existing funding streams could be advertised to support preparation for and recovery from extreme events when needed could be explored. In the longer term, criteria for facility funding applications and other long term decision making across the sector should be reviewed to ensure climate resilience needs are formally and consistently considered so that facilities are prepared for the future climate, and potentially costly retrofits are not required.
References
Adapt2win (2025) Adapt2Win: A Global Call for Climate Adaptation Action. Available at: https://adapt2win.org (Accessed: 11 February 2026).
Adaptation Scotland and Met Office Research (2025) Climate change trends and projections. Available at: https://adaptation.scot/scotland-and-climate-change/climate-change-trends-and-projections/ (Accessed: 28 October 2025).
Amis, C. (2023) ‘Landmark Decision – Intentionally-added microplastic restrictions are to be adopted by the EU Fidra’, Fidra, 22 May. Available at: https://www.fidra.org.uk/pitch-in/intentionally-added-microplastics-restriction/ (Accessed: 22 December 2025).
Anderson, K. (2022) ‘£85 million proposal to replace Perth Leisure Pool could make quite a splash at council meeting’, Daily Record, 18 February. Available at: https://www.dailyrecord.co.uk/news/local-news/85-million-proposal-replace-perth-26264277 (Accessed: 8 January 2026).
Anderson, K. (2024a) ‘Councillor wants to see national sports competitions brought back to Perth’, Daily Record, November. Available at: https://www.dailyrecord.co.uk/news/local-news/councillor-wants-see-national-sports-34161672 (Accessed: 2 January 2026).
Anderson, K. (2024b) ‘Leisure facilities to be removed from Bell’s Sports Centre by August 31’, Daily Record, 17 May. Available at: https://www.dailyrecord.co.uk/news/local-news/leisure-facilities-removed-bells-sports-32829519 (Accessed: 8 January 2026).
Arnell, N.W. et al. (2021) ‘Indicators of climate risk in the UK at different levels of warming’, Environmental Research Communications, 3(9), p. 095005. Available at: https://doi.org/10.1088/2515-7620/ac24c0.
Balloux, F. and Van Dorp, L. (2017) ‘Q&A: What are pathogens, and what have they done to and for us?’, BMC Biology, 15(1), p. 91. Available at: https://doi.org/10.1186/s12915-017-0433-z.
BBC News (2023) ‘Flood gate closure delay may have led to Perth property damage’, BBC News, 22 November. Available at: http://bbc.co.uk/news/uk-scotland-tayside-central-67450336 (Accessed: 10 February 2026).
BBC News (2024a) ‘Closure confirmed for Bell’s Sports Centre in Perth’, BBC News, 16 May. Available at: https://www.bbc.co.uk/news/articles/cw4d4q1pjzxo (Accessed: 8 January 2026).
BBC News (2024b) ‘Reduced mountain snow patches point to climate change’, BBC News, 2 July. Available at: https://www.bbc.com/news/articles/c29dx3nyer2o (Accessed: 30 September 2025).
BBC News (2025) ‘First September warning of extreme wildfires for five years’, BBC News, September. Available at: https://www.bbc.co.uk/news/articles/cx2re2172y4o#:~:text=The%20alert%20is%20the%2013th,and%20urged%20%22extreme%20caution%22. (Accessed: 23 December 2025).
Betts, R.A., Haward, A.B. and Pearson, K.V. (2021) Introduction. In: The Third UK Climate Change Risk Assessment Technical Report. London: Prepared for the Climate Change Committee. Available at: https://www.ukclimaterisk.org/publications/technical-report-ccra3-ia/ (Accessed: 17 December 2025).
Bolderdijk, J.W. et al. (2013) ‘Values Determine the (In)Effectiveness of Informational Interventions in Promoting Pro-Environmental Behavior’, PLoS ONE, 8(12). Available at: https://journals.plos.org/plosone/article?id=10.1371/journal.pone.0083911 (Accessed: 12 November 2025).
Bone, A.T. (2023) How Might Climate Change Affect Different Sports Pitches? Available at: https://www.atbone.co.uk/news/how-might-climate-change-affect-different-sports-pitches/ (Accessed: 14 October 2025).
Boyle, J. (2025) ‘Mountain rescue teams warn of increase in accidents all year round’, The Sunday Post, 24 August. Available at: https://www.sundaypost.com/fp/huge-rise-in-rescues-as-global-warming-makes-mountains-seem-more-inviting/ (Accessed: 9 January 2026).
Bryan, K. et al. (2020) ‘The health and well-being effects of drought: assessing multi-stakeholder perspectives through narratives from the UK’, Climatic Change, 163(4), pp. 2073–2095. Available at: https://doi.org/10.1007/s10584-020-02916-x.
Cairney, J. (2020) ‘SWPL set for expansion as league scraps relegation for this season’, The Herald, 12 October. Available at: https://www.heraldscotland.com/sport/18788760.swpl-set-expansion-league-scraps-relegation-season/ (Accessed: 11 February 2026).
Calvin, K. et al. (2023) IPCC, 2023: Climate Change 2023: Synthesis Report. Contribution of Working Groups I, II and III to the Sixth Assessment Report of the Intergovernmental Panel on Climate Change [Core Writing Team, H. Lee and J. Romero (eds.)]. IPCC, Geneva, Switzerland. First. Intergovernmental Panel on Climate Change (IPCC). Available at: https://doi.org/10.59327/IPCC/AR6-9789291691647.
Carr, B. (2025) ‘Horse sanctuary struggling with soaring hay prices’, BBC News, 9 December. Available at: https://www.bbc.co.uk/news/articles/cx2dxw2gp30o (Accessed: 2 January 2026).
CCRA3 (2021) ‘Transport Briefing’. UK Climate Risk. Available at: https://www.ukclimaterisk.org/wp-content/uploads/2021/06/CCRA3-Briefing-Transport.pdf.
Chalmers, R. (2020) ‘BREAKING NEWS: Flood-damaged Perth Leisure Pool to remain closed for 12 months’, Daily Record, 16 October. Available at: https://www.dailyrecord.co.uk/news/local-news/breaking-news-flood-damaged-perth-22856227 (Accessed: 8 January 2026).
Chalmers, R. (2024) ‘“More robust” flood scheme is pledged for Perth following review’, Daily Record, 2 February. Available at: https://www.dailyrecord.co.uk/news/local-news/more-robust-flood-scheme-pledged-32024416 (Accessed: 11 February 2026).
Claerhout, S. et al. (2006) ‘Pathways involved in sunburn cell formation: deregulation in skin cancer’, Photochemical & Photobiological Sciences, 5(2), pp. 199–207. Available at: https://doi.org/10.1039/b504970a.
Climate Change Committee (2025) ‘CCC letter to Minister Hardy – advice on the UK’s adaptation objectives’. Available at: https://www.theccc.org.uk/publication/letter-ccc-letter-to-minister-hardy-advice-on-the-uks-adaptation-objectives/ (Accessed: 11 February 2026).
Climate Outreach (2023) ‘Talking climate at the grassroots: what works and what’s tough’, Talking climate at the grassroots: what works and what’s tough. Available at: https://climateoutreach.org/talking-climate-grassroots/ (Accessed: 1 August 2026).
Clyne, F. (2025) Loch Ness Marathon – Running in the Heat. Available at: https://www.lochnessmarathon.com/training-zone/training-tip-6/ (Accessed: 4 November 2025).
Collins, D. (2024) ‘Sport in Scotland: An Overview of Legislation, Governance, Policy and Funding’, SPICe Briefing [Preprint]. Available at: https://bprcdn.parliament.scot/published/2024/5/3/80d33c81-8d78-48b9-a5e7-193dc8169b9d/SB%2024-22.pdf (Accessed: 17 December 2025).
Davies, D. (2025) ‘Why no hosepipe bans in Scotland?’, SPICe Spotlight, 9 April. Available at: https://spice-spotlight.scot/2025/09/04/why-are-there-no-hosepipe-bans-in-scotland/ (Accessed: 14 January 2026).
DCMS (2024) Sport Satellite Account for the UK 2024: Key findings. Available at: https://www.gov.uk/government/publications/sport-satellite-account-for-the-uk-2024-research-into-a-new-measure-for-estimating-the-value-of-sport/sport-satellite-account-for-the-uk-2024-key-findings (Accessed: 9 December 2025).
Department for Culture, Media & Sport (DCMS) (2025) Exploring the financial implications of climate change on grassroots sport. Available at: https://www.gov.uk/government/publications/exploring-the-financial-implications-of-climate-change-on-grassroots-sport/exploring-the-financial-implications-of-climate-change-on-grassroots-sport (Accessed: 26 September 2025).
Dolphin, B. (2025) Navigating the climate crisis. Available at: https://www.ramblers.org.uk/navigating-climate-crisis (Accessed: 30 October 2025).
Dorsey, K. (2025) ‘Battling staff shortages in golf’s “invisible” profession’, The Herald, 12 September. Available at: https://www.heraldscotland.com/news/25460447.bigga-tackles-shortages-golfs-invisible-profession/ (Accessed: 7 January 2026).
Duncan, T. and McLaughlin, C. (2021) ‘COP26: How is climate change affecting Scottish sport?’, BBC Sport, 2 November. Available at: https://www.bbc.com/sport/scotland/59078464 (Accessed: 26 September 2025).
Economics for the Environment Consultancy and UK Centre for Ecology & Hydrology (2025) Option appraisal for intentionally added microplastics. Defra. Available at: https://sciencesearch.defra.gov.uk/ProjectDetails?ProjectId=21802 (Accessed: 22 December 2025).
England Athletics (2025) Recommendations for running events in hot weather. Available at: https://www.englandathletics.org/news/recommendations-for-running-events-in-hot-weather/ (Accessed: 14 October 2025).
Environment Agency (2025) Drought prospects for spring 2026. Available at: https://www.gov.uk/government/publications/drought-prospects-for-spring-2026 (Accessed: 22 December 2025).
European Climate Pact (2024) ‘Sport – a key player in climate action?’, Sport – a key player in climate action? Available at: https://climate-pact.europa.eu/articles-and-events/pact-articles/sport-key-player-climate-action-2024-07-26_en (Accessed: 12 November 2025).
Football for Future and Common Goal (2025) Fields of Change. Available at: https://online.flippingbook.com/view/671377101/66-67/ (Accessed: 1 August 2026).
Football Foundation (2026) 3G Pitch Replacement. Available at: https://footballfoundation.org.uk/support-article/3g/pitch/replacement (Accessed: 6 January 2026).
François, H. et al. (2023) ‘Climate change exacerbates snow-water-energy challenges for European ski tourism’, Nature Climate Change, 13(9), pp. 935–942. Available at: https://doi.org/10.1038/s41558-023-01759-5.
Freeman, T. (2024) ‘Barclays becomes new title sponsor for Scottish Women’s Football national leagues’, Scottish Women’s Football, 1 August. Available at: https://scotwomensfootball.com/latest-news/barclays-becomes-new-title-sponsor-for-scottish-womens-football-national-leagues/ (Accessed: 11 February 2026).
Glasgow Life (2025) ‘Glasgow Life Sport football pitches to receive £850,000 refresh’, Glasgow Life, 5 February. Available at: https://www.glasgowlife.org.uk/news/glasgow-life-sport-football-pitches-to-receive-850-000-refresh (Accessed: 9 February 2026).
Go Paddling (2024) ‘What Rising River Levels Means for Paddlers’, Go Paddling, 13 February. Available at: https://gopaddling.info/blog/tips-and-advice/what-rising-river-levels-means-for-paddlers/ (Accessed: 11 February 2026).
Goggins, D. et al. (2018) Game changer I: How climate change is impacting sports in the UK. 1. Available at: https://static1.squarespace.com/static/58b40fe1be65940cc4889d33/t/5a79bac853450a7495861454/1517927115822/Game+Changer.pdf (Accessed: 1 December 2025).
Goldblatt, D. (2025) Sports’ response to the climate crisis. Available at: https://www.playthegame.org/themes/sport-and-climate-change/sports-response-to-the-climate-crisis/ (Accessed: 30 September 2025).
Grounds Management Association (2025) Managing Sports Pitches During Drought. Available at: https://www.thegma.org.uk/news/managing-sports-pitches-during-drought/ (Accessed: 14 January 2026).
Haigh, I.D. et al. (2025) ‘Climate change impacts on coastal flooding, relevant to the coastal and marine environment around the UK and Ireland’, MCCIP Science Review 2025, p. 24pp. Available at: https://doi.org/10.14465/2025.reu02.cfl.
Hamilton, L. (2021) ‘Toxic algae forces cancellation of Loch Tay swim event’, 5 September. Available at: https://www.thecourier.co.uk/fp/news/perth-kinross/2509244/toxic-algae-forces-cancellation-of-loch-tay-swim-event/ (Accessed: 22 December 2025).
Hampton, N. (2025) Mapping out coastal changes to manage risk. Available at: https://royaldornoch.com/2025/07/24/mapping-out-coastal-changes-to-manage-risk/ (Accessed: 6 January 2026).
Hopkins, D. and Maclean, K. (2014) ‘Climate change perceptions and responses in Scotland’s ski industry’, Tourism Geographies, 16(3), pp. 400–414. Available at: https://doi.org/10.1080/14616688.2013.823457.
Intergovernmental Panel on Climate Change (IPCC) (ed.) (2023) ‘Climate Change Information for Regional Impact and for Risk Assessment’, in Climate Change 2021 – The Physical Science Basis: Working Group I Contribution to the Sixth Assessment Report of the Intergovernmental Panel on Climate Change. Cambridge: Cambridge University Press, pp. 1767–1926. Available at: https://doi.org/10.1017/9781009157896.014.
International Olympic Committee and United Nations Climate Change (2019) Sports for Climate Action: Sustainability Essentials. Available at: https://stillmed.olympics.com/media/Document%20Library/OlympicOrg/IOC/What-We-Do/celebrate-olympic-games/Sustainability/sustainability-essentials/SUSTAINABILITY-ESSENTIALS-ISSUE-2.pdf (Accessed: 8 January 2026).
James, I. (2012) Managing sports surfaces in drought conditions. Cranfield University: Centre for Sports Surface Technology. Available at: https://sportengland-production-files.s3.eu-west-2.amazonaws.com/s3fs-public/drought-report.pdf?VersionId=.pE53SWN8onQN5mzdH_wtjuy6ec0MRyM (Accessed: 22 December 2025).
Joelle, S. (2020) ‘Are Event Cancellation premiums on the rise?’, Insure Our Event, 27 January. Available at: https://insureourevent.co.uk/event-premiums-on-the-rise/ (Accessed: 6 January 2026).
Joyeux, D. (2021) ‘Pitch Perfect Engineering’, Ingenia, December, pp. 18–23.
Kang, H. et al. (2023) ‘Heat stress in horses: a literature review’, International Journal of Biometeorology, 67(6), pp. 957–973. Available at: https://doi.org/10.1007/s00484-023-02467-7.
Keep Scotland Beautiful (2023) Scots support sports clubs implementing environmental measures. Available at: https://www.keepscotlandbeautiful.org/news/2023/nov/scots-support-sports-clubs-implementing-environmental-measures/ (Accessed: 28 October 2025).
Keep Scotland Beautiful (2025) Sport | Climate Training | Keep Scotland Beautiful. Available at: https://www.keepscotlandbeautiful.org/climate-emergency-training/accredited-training/sector-based/sport/ (Accessed: 26 October 2025).
Kelly, N. and Smith, S. (2015) Mountain Weather Service: Research and Appraisal Full Report: Sep 2015. sportscotland. Available at: https://sportscotland.org.uk/media/ojcauhnh/mountain-weather-service-research-and-appraisal-final-full-report-nov-2015.pdf (Accessed: 2 December 2025).
Kendon, M. et al. (2025) ‘State of the UK Climate in 2024’, International Journal of Climatology, 45(S1), p. e70010. Available at: https://doi.org/10.1002/joc.70010.
Kerr, B. (2025) ‘New “North Loch Park” synthetic pitch to formally open on Friday’, Shetland Islands Council, 12 October. Available at: https://www.shetland.gov.uk/news/article/3871/new-north-loch-park-synthetic-pitch-to-formally-open-on-friday- (Accessed: 12 February 2026).
Knowles, N., Scott, D. and Rutty, M. (2023) ‘Climate change versus winter sports; can athlete climate activism change the score?’, International Review for the Sociology of Sport, 59(3). Available at: https://journals.sagepub.com/doi/full/10.1177/10126902231209226 (Accessed: 12 November 2025).
Kovats, S. and Brisley, R. (2021) Health, Communities and the Built Environment. Available at: https://www.ukclimaterisk.org/publications/technical-report-ccra3-ia/chapter-5/ (Accessed: 5 December 2025).
Kuitunen, I. et al. (2023) ‘Incidence of football injuries sustained on artificial turf compared to grass and other playing surfaces: a systematic review and meta-analysis’, eClinicalMedicine, 59, p. 101956. Available at: https://doi.org/10.1016/j.eclinm.2023.101956.
Li, S. et al. (2016) ‘Modelling the seasonality of Lyme disease risk and the potential impacts of a warming climate within the heterogeneous landscapes of Scotland’, Journal of The Royal Society Interface, 13(116), p. 20160140. Available at: https://doi.org/10.1098/rsif.2016.0140.
Loughborough University London et al. (2022) Slippery slopes: How climate change is threatening the Winter Olympics. Available at: https://library.olympics.com/Default/doc/SYRACUSE/1568540/slippery-slopes-how-climate-change-is-threatening-the-winter-olympics-madeleine-orr-et-al?_lg=en-GB (Accessed: 2 December 2025).
Lozano, J.E. and Ferguson, S. (2021) Ecosystem services for compensation of artificial turf systems. Research Institute of Industrial Economics. Available at: https://www.ifn.se/media/sq0b0gti/2021-ferguson-lozano-ecosystem-services-for-compensation-of-artificial-turf-systems.pdf (Accessed: 10 February 2026).
Mabon, L. (2022) ‘Football and climate change: what do we know, and what is needed for an evidence-informed response?’, Climate Policy, 23(3). Available at: https://www.tandfonline.com/doi/abs/10.1080/14693062.2022.2147895 (Accessed: 30 September 2025).
May, L. et al. (2024) Mitigating Climate Change Impacts on the Water Quality of Scottish Standing Waters. UK Centre for Ecology & Hydrology. Available at: https://www.researchgate.net/publication/379144715_Mitigating_Climate_Change_Impacts_on_the_Water_Quality_of_Scottish_Standing_Waters (Accessed: 22 December 2025).
Maynard, C. (2025) ‘Green Shores: Scotland’s longest running coastal restoration project’, Scotland’s Nature, 10 July. Available at: https://scotlandsnature.wordpress.com/2025/07/10/green-shores-scotlands-longest-running-coastal-restoration-project/ (Accessed: 11 February 2026).
McKenzie, S. (2025) ‘Glencoe Mountain ski resort to keep making snow until May’, BBC News, 3 April. Available at: https://www.bbc.co.uk/news/articles/cpq7d2rypn2o (Accessed: 22 December 2025).
McLaughlin, C. (2024) ‘The golf courses disappearing into the sea’, BBC News, 3 April. Available at: https://www.bbc.co.uk/news/articles/cqljjg1zq31o (Accessed: 22 December 2025).
Mead, B. (2025) ‘Beth Mead: ‘If we don’t adapt to climate change, football becomes a privilege, not a right‘’, The Guardian, 19 November. Available at: https://www.theguardian.com/football/2025/nov/19/beth-mead-climate-change-football (Accessed: 10 February 2026).
Mehryar, S. (2022) ‘What is the difference between climate change adaptation and resilience?’, Grantham Research Institute on climate change and the environment, 9 December. Available at: https://www.lse.ac.uk/granthaminstitute/explainers/what-is-the-difference-between-climate-change-adaptation-and-resilience/ (Accessed: 9 January 2026).
Meir, D. and Scott, D. (2025) Getting the inactive active: Barriers to physical activity and their potential policy solutions. The Scottish Parliament. Available at: https://bprcdn.parliament.scot/published/2025/1/10/c1a1038a-6254-45be-b329-edba530b47e1/SB%2025-03.pdf (Accessed: 5 January 2025).
Met Office (2019) Top ten UK’s hottest years all since 2002. Available at: https://www.metoffice.gov.uk/about-us/news-and-media/media-centre/weather-and-climate-news/2019/state-of-the-uk-climate-2018 (Accessed: 1 December 2007).
Met Office (2026a) ‘2025 is double-record breaker: UK’s warmest and sunniest year on record’, Met Office, 1 February. Available at: https://www.metoffice.gov.uk/about-us/news-and-media/media-centre/weather-and-climate-news/2026/2025-is-double-record-breaker-uks-warmest-and-sunniest-year-on-record (Accessed: 11 February 2026).
Met Office (2026b) Climate Report for Glasgow City. Local Authority Climate Explorer. Met Office. Available at: https://www.reports.esriuk.com/view-report/b8eb3cee8f764147a2cfcd69cf36238f/S12000049 (Accessed: 11 February 2026).
Mott, M. (2025) ‘Animal charities warn of “panic” over hay shortage’, BBC News, 8 October. Available at: https://www.bbc.co.uk/news/articles/c1476e4ky64o (Accessed: 2 January 2026).
Mountaineering Scotland (2023) It’s Up to Us – Saving Scotland’s Mountain Paths. Available at: https://www.mountaineering.scot/its-up-to-us-path-campaign (Accessed: 12 November 2025).
Mountaineering Scotland (2026) ThinkWINTER | Mountaineering Scotland. Available at: https://www.mountaineering.scot/safety-and-skills/thinkwinter (Accessed: 6 January 2026).
Murray, B. (2023) ‘Concerns shortage of farriers in certain regions will hit horse welfare’, Horse & Hound, September. Available at: https://www.horseandhound.co.uk/news/concerns-shortage-of-farriers-in-certain-regions-will-hit-horse-welfare-837799 (Accessed: 2 January 2026).
NOAA (2024) What is an invasive species? Available at: https://oceanservice.noaa.gov/facts/invasive.html (Accessed: 9 February 2026).
Ogston, G. (2023) ‘Bell’s Sport Centre flood damage repairs could reach £2m’, BBC News, 22 November. Available at: https://www.bbc.co.uk/news/uk-scotland-67496241 (Accessed: 9 January 2026).
Orr, M. et al. (2021) ‘Impacts of climate change on organized sport: A scoping review’. Available at: https://doi.org/10.1002/wcc.760.
Orr, M. and Inoue, Y. (2019) ‘Sport versus climate: Introducing the climate vulnerability of sport organizations framework’, Sport Management Review, 22(4), pp. 452–463. Available at: https://doi.org/10.1016/j.smr.2018.09.007.
Outdoor Access Trust for Scotland (2025) ‘It’s Up to Us…to step up and save our mountain paths’, It’s Up to Us…to step up and save our mountain paths. Available at: https://www.outdooraccesstrustforscotland.org.uk/its-up-to-us-to-step-up-and-save-our-mountain-paths/ (Accessed: 12 November 2025).
Oyama, T. et al. (2023) ‘Validation of upper thermal thresholds for outdoor sports using thermal physiology modelling’, Temperature: Multidisciplinary Biomedical Journal, 11(1), pp. 92–106. Available at: https://doi.org/10.1080/23328940.2023.2210477.
Paddle UK (2022) ‘Paddling in Low Water Levels’, Go Paddling, 16 August. Available at: https://gopaddling.info/blog/tips-and-advice/paddling-in-low-water-levels/ (Accessed: 14 January 2026).
Perth & Kinross Council (2024) BELL’S SPORTS CENTRE. 24/151. Strategic Lead – Economy, Development & Planning, Perth & Kinross Council. Available at: https://shorturl.at/Bl4Zr (Accessed: 8 January 2026).
Perth and Kinross Council (2021) Climate Resilience. Perth and Kinross council. Available at: https://www.pkclimateaction.co.uk/climate-resilience (Accessed: 11 February 2026).
Perth and Kinross Council (2023) Climate Change Risk and Opportunity Assessment. 4. Available at: https://www.pkclimateaction.co.uk/files/PKC_CCROA_2024_V2-1.pdf (Accessed: 19 December 2025).
Procopio, N. and Bonventre, J. (2022) ‘Synthetic Turf Impacts on Storm Water and Flood Resilience, and Potential for Heat Island and Heat-stress Effects’. Available at: https://dep.nj.gov/wp-content/uploads/dsr/synthetic-turf-memorandum-june2022.pdf (Accessed: 10 February 2026).
Protect Our Winters (2020) Motivating Lifestyle Driven Advocacy. Available at: https://protectourwinters.org/wp-content/uploads/2020/06/POW_NeimandReport_v11.pdf (Accessed: 1 August 2026).
Public Health Scotland (2025) Heat impacts on health in Scotland: Deaths 2005-2024. Available at: https://publichealthscotland.scot/media/35610/20251017-health-impacts-from-heat-in-scotland_final.pdf (Accessed: 2 December 2025).
Purpose (2025) ‘The Power of Trusted Messengers: Beyond Traditional Influence’, The Power of Trusted Messengers: Beyond Traditional Influence. Available at: https://www.purpose.com/the-power-of-trusted-messengers-beyond-traditional-influence/ (Accessed: 1 July 2025).
Reesink Turfcare (2024) Acclimatising to our changing climate: How is climate change impacting turf management strategies? Available at: https://www.reesinkturfcare.co.uk/insider-knowledge/acclimatising-to-our-changing-climate-how-is-climate-change-impacting-turf-management-strategies/ (Accessed: 7 January 2026).
Reisinger, A. et al. (2023) ‘Annex I: Glossary’, in Climate Change 2023: Synthesis Report. Contribution of Working Groups I, II and III to the Sixth Assessment Report of the Intergovernmental Panel on Climate Change. Geneva, Switzerland: Intergovernmental Panel on Climate Change, pp. 119–130. Available at: https://www.ipcc.ch/report/ar6/syr/annexes-and-index/.
Reynolds, T. (2013) ‘Scottish football season: Should it be moved to the summer?’, BBC Sport, 2 May. Available at: https://www.bbc.co.uk/sport/scotland/22337539 (Accessed: 11 February 2026).
Rivington, M. et al. (2019) ‘Snow Cover and Climate Change in the Cairngorms National Park: Summary Assessment’. Available at: https://cairngorms.co.uk/uploads/documents/cxc-snow-cover-and-climate-change-in-the-cairngorms-national-park_1-Published.pdf (Accessed: 27 October 2025).
Scottish Disability Sport (2026) ‘Policies & Procedures -’. Available at: https://scottishdisabilitysport.com/policies-procedures/ (Accessed: 11 December 2025).
Scottish FA (2016) Watt gives expert view on pitch debate. Available at: https://www.scottishfa.co.uk/news/watt-gives-expert-view-on-pitch-debate/ (Accessed: 22 December 2025).
Scottish Government (2018) A More Active Scotland: Scotland’s Physical Activity Delivery Plan. Available at: https://www.gov.scot/binaries/content/documents/govscot/publications/strategy-plan/2018/07/active-scotland-delivery-plan/documents/00537494-pdf/00537494-pdf/govscot%253Adocument/00537494.pdf.
Scottish Government (2020) ‘Scottish Index of Multiple Deprivation 2020’. Available at: https://www.gov.scot/collections/scottish-index-of-multiple-deprivation-2020/ (Accessed: 23 December 2025).
Scottish Government (2023a) National Planning Framework 4. Available at: https://www.gov.scot/publications/national-planning-framework-4/ (Accessed: 14 January 2026).
Scottish Government (2023b) Snowsports sector 2022 – economic, social, and cultural impact: research. Available at: https://www.gov.scot/publications/economic-social-cultural-impact-scotlands-snowsports-sector-2022/pages/2/ (Accessed: 6 January 2026).
Scottish Government (2024) Scottish National Adaptation Plan. Available at: https://www.gov.scot/publications/scottish-national-adaptation-plan-2024-2029-2/pages/3/ (Accessed: 15 October 2025).
Scottish Youth Football Association (2024) Supplementary and playing rules 2024-2025. 15. Scottish Youth Football Association. Available at: https://www.seryfa-online.info/sites/default/files/Form%20Downloads/Supplementary%20Playing%20Rules%202024-2025.pdf (Accessed: 11 February 2026).
Scottish FA (2026) ‘Stadia 3G construction installation guidelines’. Available at: https://www.scottishfa.co.uk/media/2367/stadia-3g-construction-installation-guidelines.pdf (Accessed: 9 February 2026).
SEPA (2025) Autumn water situation report 2025. Available at: https://beta.sepa.scot/water-scarcity/water-scarcity-seasonal-reports/autumn-water-situation-report-2025/ (Accessed: 22 December 2025).
SGSA (2025) ‘Planning for extreme heat at sports grounds’, SGSA. Available at: https://sgsa.org.uk/document/planning-for-extreme-heat-at-sports-grounds/ (Accessed: 30 September 2025).
Shetland News (2024) ‘New 3G pitch could “lift the ceiling” for rugby and football in Shetland’, Shetland News, 13 December. Available at: https://www.shetnews.co.uk/2024/12/13/new-pitch-lift-ceiling-rugby/ (Accessed: 7 January 2026).
Simpson, M. (2013) ‘Impacts of climate change on tourism (and marine recreation)’, MCCIP Science Review 2013, p. 13 pages. Available at: https://doi.org/10.14465/2013.ARC29.271-283.
Sniffer (2021) Evidence for the third UK Climate Change Risk Assessment (CCRA3) Summary for Scotland. Available at: https://www.ukclimaterisk.org/publications/summary-forscotland-ccra3-ia/ (Accessed: 2 November 2025).
Sport First (2016) Scotstoun Stadium Development on Track. Available at: https://sportfirst.sportscotland.org.uk/articles-archive/green-shoots-all-over-again/index.html (Accessed: 23 October 2025).
Sport Positive, UN Sports for Climate Action and CAST (2024) What’s Stopping Us? Applying psychology to accelerate climate action in sport. Available at: https://www.sportpositive.org/wp-content/uploads/2024/11/Whats-stopping-us-Applying-psychology-to-accelerate-climate-action-in-sport_FINAL.pdf (Accessed: 12 November 2025).
Sported (2024) Issues facing grassroots sport and the communities and young people it serves. Sported UK. Available at: https://sported.org.uk/wp-content/uploads/2025/10/Winter-2024-Pulse-Scotland.pdf (Accessed: 12 November 2025).
Sported, C. (2023) ‘Cost of living pressures putting grassroots sport at risk – Sported’, 11 May. Available at: https://hub.sported.org.uk/cost-of-living-pressures-putting-grassroots-sport-at-risk/ (Accessed: 27 November 2025).
Sport England (2025) Position statement on 3G pitches. Available at: https://www.sportengland.org/how-we-can-help/facilities-and-planning/planning-for-sport/position-statement-on-3g-pitches (Accessed: 6 January 2026).
sportscotland (2006) National Audit of Scotland’s Sports Facilities Summary Report. Available at: https://sportscotland.org.uk/media/1eafzgtq/golf_facilities_final_report-1.pdf (Accessed: 2 December 2025).
sportscotland (2023) Emergency Response Policy. sportscotland. Available at: https://sportscotland.org.uk/media/vq1ngblq/emergency-response-policy.pdf (Accessed: 2 December 2025).
sportscotland (2025a) Reports – Sportscotland. Available at: https://sustainablescotlandnetwork.org/reports/sportscotland (Accessed: 17 December 2025).
sportscotland (2025b) Sport For Life. Available at: https://sportscotland.org.uk/about-us/sport-for-life (Accessed: 18 December 2025).
Symons, A. (2024) Can artificial snow help Europe’s ski resorts survive climate change?, euronews. Available at: http://www.euronews.com/green/2024/04/03/snowball-effect-is-artificial-snow-a-long-term-solution-for-ski-resorts-in-a-warming-world (Accessed: 24 October 2025).
Temple, N. (2024) ‘New research shows community buildings falling behind in energy efficiency race’, Social Investment Business, September. Available at: https://www.sibgroup.org.uk/new-research-shows-community-buildings-falling-behind-in-energy-efficiency-race/ (Accessed: 8 January 2026).
Tennant, B. (2025) ‘Addressing the skills shortage in greenkeeping and grounds management’, Pitchcare, 29 July. Available at: https://www.pitchcare.com/blogs/news/addressing-the-skills-shortage-in-greenkeeping-and-grounds-management-1 (Accessed: 7 January 2026).
The Climate Change (Duties of Public Bodies: Reporting Requirements) (Scotland) Order (2015) The Climate Change (Duties of Public Bodies: Reporting Requirements) (Scotland) Order 2015. Statute Law Database. Available at: https://www.legislation.gov.uk/ssi/2015/347/contents (Accessed: 17 December 2025).
The Scottish Parliament (2023) Female participation in sport and physical activity. 7. The Scottish Parliamentary Corporate Body. Available at: https://digitalpublications.parliament.scot/Committees/Report/HSCS/2023/10/9/44f3cbcf-b4f5-429b-822d-93fdd1e60353-1 (Accessed: 24 October 2025).
UEFA (2012) Small is beautiful for Scottish player development. Available at: https://www.uefa.com/news-media/news/01ef-0f86237adb6a-4f3f0043d25a-1000–small-is-beautiful-for-scottish-player-development/ (Accessed: 11 February 2026).
UNFCCC Sports for Climate Action (2025) Sport industry invites governments to team up and harness the power of sport to take climate action to the next level, p. 7. Available at: https://unfccc.int/documents/651331 (Accessed: 1 August 2026).
United Nations Climate Change (2022) Sports for Climate Action Framework. 2. United Nations. Available at: https://unfccc.int/sites/default/files/resource/Sports_for_Climate_Action_Declaration_and_Framework.pdf (Accessed: 1 June 2026).
University of Stirling (2024) Forth Climate Forest annual review 2024. Available at: https://www.stir.ac.uk/about/scotlands-international-environment-centre/forth-climate-forest/annual-review-2024/ (Accessed: 12 November 2025).
Van der Linden, S. (2014) ‘On the relationship between personal experience, affect and risk perception: The case of climate change’, European Journal of Social Psychology, 44(5), pp. 430–440.
Van der Veken, K., Lauwerier, E. and Willems, S.J. (2020) ‘How community sport programs may improve the health of vulnerable population groups: a program theory’, International Journal for Equity in Health, 19(1), p. 74. Available at: https://doi.org/10.1186/s12939-020-01177-5.
VisitScotland (2025) Scottish Golf & the Best Golf Courses in Scotland. Available at: https://www.visitscotland.com/things-to-do/outdoor-activities/golf (Accessed: 9 December 2025).
WHO (2024) Vector-borne diseases. Available at: https://www.who.int/news-room/fact-sheets/detail/vector-borne-diseases (Accessed: 9 February 2025).
Winter, D. et al. (2023) Downhill from here: How Climate Change threatens cycling as we know it. Available at: https://drive.google.com/file/d/1neIbFM8yxElveFvnXY91H8id5Ke6-p_o/view (Accessed: 2 December 2025).
Youth Football Scotland (2024) ‘Alloa Saints score for the environment with “Trees for Goals” initiative’. Available at: https://www.youthfootballscotland.co.uk/alloa-saints-score-for-the-environment-with-trees-for-goals-initiative/ (Accessed: 12 November 2025).
Zhang, W., Li, L. and Li, Y. (2025) ‘Natural Ventilation and Energy Consumption Research for Dry Sports Halls Within National Fitness Centers in Cold Regions—Case Study of Qingdao’, Buildings, 15(5), p. 734. Available at: https://doi.org/10.3390/buildings15050734.
Appendices
Initially, a framework was developed, categorising sports and climate hazards into broad groups and identifying wider factors influencing climate risk to ensure broad coverage of relevant issues when searching through the literature. Sports were categorised based on the environment in which the sport occurs as this affects the climate hazards it is exposed to. Climate hazards were categorised by grouping IPCC climate impact drivers for Europe (Intergovernmental Panel on Climate Change (IPCC), 2023) into broader categories that were relevant to Scotland and this project. Hazards included were: extreme heat, long-term trends in precipitation and temperature, flooding, drought, wind and storms, snow and mountain conditions, sea level rise and coastal erosion, wildfire and air pollution.
This work aims to provide information that is relevant to a wide range of sports and hence, to facilitate knowledge sharing and identify common issues and solutions between different activities, sports were grouped into seven typologies when considering impacts and adaptation measures:
- Field sports – Sports typically played on grass, including football, rugby, golf and cricket.
- Outdoor court sports – Sports played outdoors but typically on a court or other specialist surface or facility, including tennis, netball, some equestrian activities and some athletics activities.
- Water sports – Outdoor sports played on water, such as open water swimming, sailing, canoeing and paddle boarding.
- Coastal sports – Sports with facilities or infrastructure based along the coastline, including links golf courses, surfing and windsurfing.
- Mountain and winter sports – Sports such as climbing and hillwalking that take place on mountainous terrain and snow sports such as skiing and snowboarding.
- Open space sports – Sports and activities such as running, walking and cycling that can take place in the wider environment and do not require specific facilities.
- Indoor sports – Sports such as pool swimming, badminton, basketball and gymnastics which typically take place indoors.
These typologies are broadly based on the environments in which sports are played as these environments strongly determine the climate risks that participants and facilities in each sport are exposed to. Typically, sports within each type will experience similar impacts of climate change and hence can share learnings and knowledge about how to manage these. The full range of organisations who have supported this work, who cover a range of sports across the categories above, are listed in Appendix D.
Alongside this we also included additional considerations such as factors affecting exposure to climate hazards (such as location or geography), factors affecting vulnerability (such as demographics) and cascading risks (such as transport failure impacting access to sports).
The key questions posed by CXC and the Scottish Government for this work were:
How are grassroots sporting organisations in Scotland currently experiencing climate change and what are the likely future impacts according to the latest projections?
How can grassroots sports best adapt and thrive in Scotland in a changing climate and what type of resources and support do they need to do so? What good practice already exists?
What opportunities are there for public engagement on climate change as it relates to sport and how can this be integrated into how sports organisations respond to climate impacts?
What opportunities does climate change and its related impact on grassroots sports offer as a vehicle for public engagement and communication on climate change?
Using the framework outlined above, we disaggregated these into more specific questions relating to climate hazards, adaptation and engagement to guide searches of the literature.
We searched the academic and grey literature, initially focusing on literature from the last five years, as well as sports organisation websites and news articles, using a combination of key terms to address each question as well as snowballing from existing key references. Literature from this search was supplemented by recommendations of further literature from stakeholders during the interview phase of the work. This allowed for identification of a broad range of findings across climate risks and adaptation actions relevant to sport. These were then narrowed down to identify any UK and Scotland specific information and examples where possible, although as noted in section 4.4, these were limited.
The search approach means that the literature reviewed may not be comprehensive, is potentially biased towards studies cited in other recent work and keyword searches may not have picked up some sources, particularly where different sports or disciplines use different or specific language. The initial literature review was heavily supplemented with grey literature, media articles and publications from SGBs as signposted by the stakeholder interviews. Hence, the literature presented in this report may be biased towards the sports represented by interviewees.
An interview protocol was prepared to cover the main research questions for the project. The interviews followed a semi-structured format and were tailored to each interviewee’s knowledge base and expertise. In some cases, impacts and adaptation measures identified as most important for each sport via the literature review were asked about explicitly. An overview of the interview protocol is shown below.
Key question | Optional follow up questions |
Intro What facilities and activities do your organisation oversee at the grassroots level? |
|
Impacts How does weather and climate affect your sport(s) at grassroots level? Can you give some examples? Have you seen any changes in these impacts over time, how might you expect them to change in the future?
|
|
Adaptation What measures are your organisation taking to address and prepare for these kinds of weather and climate events and changes? What are the barriers to taking these measures? What is needed to make them happen? |
|
Engagement Is your organisation involved in public/community engagement activities around climate change or other social or environmental issues? |
|
We would like to thank the following organisations for providing input to this work:
Aberdeen Grammar RFC
Alloa Saints FC
Camanachd Association
Dundee City Council
Durty Events
Horse Scotland
Keep Scotland Beautiful
Live Active
Mountaineering Scotland
Parkrun
Protect our winters
Royal Dornoch golf club
RYA Scotland
scottishathletics
Scottish Disability Sport
Scottish Football Association
Scottish Golf
Scottish Rugby Union
Shetland Rugby
Snowsport Scotland
Sport England
sportscotland
Tennis Scotland
University of Edinburgh
Verture
How to cite this publication:
Wright, S, Clements, L, Sidhu, N, Chalmers-Arnold, I, Riggall, J. (2026) ‘A scoping study on the impact of climate change on grassroots sport in Scotland’, ClimateXChange. DOI https://doi.org/10.7488/era/6994
© The University of Edinburgh, 2026
Prepared by Aether on behalf of ClimateXChange, The University of Edinburgh. All rights reserved.
While every effort is made to ensure the information in this report is accurate as at the date of the report, no legal responsibility is accepted for any errors, omissions or misleading statements. The views expressed represent those of the author(s), and do not necessarily represent those of the host institutions or funders.
This work was supported by the Rural and Environment Science and Analytical Services Division of the Scottish Government (CoE – CXC).
ClimateXChange
Edinburgh Climate Change Institute
High School Yards
Edinburgh EH1 1LZ
+44 (0) 131 651 4783
Reflecting increased water treatment costs, and reductions in tourism and property values. ↑
Grassroots sport plays a key role in health and wellbeing and is at the heart of many communities in Scotland. Risks from climate disruption, including increased flooding, coastal erosion, heavy rainfall and heatwaves, have the potential to impact the grassroots sport sector. This could reduce the Scottish population’s access to sport and the health and wellbeing benefits this brings, as well as make the Scottish Government’s targets for physical activity more difficult to achieve.
To date, research into climate impacts on grassroots sport in Scotland has been limited, as has the policy response.
This report aims to help to fill this gap, by reviewing information on the current and projected climate risks to grassroots sports in Scotland and understanding the current adaptation response to these risks, as well as where further adaptation may be needed and factors that can enable this.
Key findings
- Extreme weather is already impacting Scottish sport, and the frequency and severity of extreme events is expected to worsen due to climate change.
- The specific impacts of climate change vary by sport, but all sports, particularly those played outdoors, face rising costs and reduced participation as result of extreme weather events.
- There is currently very little data available to assess cancellation of sports events and other impacts making it difficult to understand future trends.
- Climate disruption will not affect all places and participants equally. People living in deprived areas will be affect more by rising costs and rural economies that rely on visitors participating in outdoor sports will be impacted by reduced participation.
- Action is already being taken to protect the grassroots sector but there is currently very limited join up planning between sports policies and climate adaptation policies in Scotland.
- There is a strong will to protect grassroots but a lack of knowledge about what action is most effective is hampering efforts.
Lessons for policy
- Training is needed to increase knowledge and awareness of climate impacts, and where further adaptation action is needed, across all levels of the Scottish sports landscape.
- Improved data collection is needed to understand the scale and trends in climate impacts on Scottish grassroots sport.
- Grassroots sport would benefit from inclusion in national and local adaptation planning and risk assessment.
- Grassroots sports organisations have a role to play in building community resilience.
- The alignment of sports facilities funding with adaptation goals would help avoid long-term, maladaptive decisions.
For further information, please read the full report.
If you require the report in an alternative format, such as a Word document, please contact info@climatexchange.org.uk or 0131 651 4783.
To achieve our climate goals, the people of Scotland will need to make significant changes to the way we work and play. Behavioural science can offer valuable insights for climate policymaking and can help to encourage behaviour change, but only a fraction policy decisions are currently informed by this research.
In September 2025, we held a roundtable with the Scottish Government to explore how behavioural science can be better integrated into climate and environmental policymaking. Academics and senior civil servants worked to identify new projects or approaches to trial in Scottish Government over the next six months. This report summarises the key discussions and proposed projects from the event.
Key discussions and proposed projects
Roundtable participants discussed the following three key challenges related to integrating behavioural science into climate policymaking – each time asking ‘What can we try in the next six months to address this?’:
- Challenge 1: Prioritising where to embed behavioural science
- Challenge 2: Engaging policymakers with behavioural evidence
- Challenge 3: Improving the evaluation of behavioural interventions
From these discussions, participants identified six proposed projects:
- Develop a prioritisation matrix that ranks policy areas and their corresponding behaviours, based on a structured framework adapted to Scotland’s policy priorities.
- Hold a ‘mutual learning’ workshop for senior policymakers and behavioural researchers to explore climate policy, behavioural science in policymaking’ and opportunities for collaboration.
- Scope a project to integrate oral history or storytelling into policy design and public engagement.
- Scope the secondment of an academic behavioural researcher into the Climate Behaviours team.
- Co-create theories of change for three priority policy areas, compiling the data into a clear, simple tool that links to data sources monitoring and evaluating impact.
- Develop a ‘Key principles for behavioural evaluations’ document.
The Scottish Government Climate Behaviours Team will take forward the projects proposed in this report. Roundtable participants will be invited to a follow-up event in spring 2026.
If you require the report in an alternative format, such as a Word document, please contact info@climatexchange.org.uk or 0131 651 4783.
Learn more: ClimateXChange Programme Manager Anne Marte Berseng reflects on the roundtable event in her blog post ‘Making better use of behavioural science in policymaking‘.
Summary report from a science-policy roundtable held 2 September 2025
Research completed: November 2025
DOI: http://dx.doi.org/10.7488/era/6775
Introduction
In September 2025, ClimateXChange and the Scottish Government held a roundtable to discuss how the use of behavioural science can be embedded and accelerated in climate and environmental policymaking in the Scottish Government.
Significant behaviour change across the population is needed to reach Scotland’s climate goals. This behaviour change is not currently happening at anywhere near the pace or scale required. Making better use of behavioural science in policymaking, through a fundamental re-think of how the Scottish Government makes policy for people, has the potential to make a meaningful difference.
The roundtable with academics and senior civil servants had the aim of identifying two or three new projects or approaches to trial in the Scottish Government over the next six months. This paper sets out the main discussion points, and the projects proposed.
Annex B sets out further background to the roundtable and the questions participants discussed.
Challenge 1: Prioritising where to embed behavioural science
Methods and principles for prioritising
There are very many behavioural changes needed to reach climate mitigation, adaptation, and biodiversity goals. These behaviours have various levels of impact, and some are harder for governments to enable than others. The policy process needs to prioritise the embedding of behavioural science and behavioural research accordingly.
Structured frameworks offer a robust way to assess and prioritise policy areas. For example, the ‘APEASE’ framework, considers Acceptability, Practicability (including whether there is existing activity or insight to build on), Effectiveness (including whether policy can have meaningful influence on a behaviour), Affordability, Spill-over effects, and Equity. This framework could be adapted according to the Scottish Government context and priorities – for example, by giving particular weight to three considerations:
- Climate and environment impact: A part of ‘effectiveness’, this addresses the potential impact of behaviour change on reducing emissions, managing the impacts of climate change, and/or supporting biodiversity.
- Behavioural plasticity: A part of ‘practicability’, this is the extent to which behaviours can, feasibly, be changed. It includes a consideration of ‘moments of change’ – that is, key life transitions such as leaving home or retirement – when behaviours are more malleable and the potential of behavioural shifts can be maximised.
- Just transition: Perceived fairness is a key driver of policy acceptability, and just transition is central to both ‘equity’ and ‘acceptability’, and to Scottish Government’s climate policies. Importantly, fairness means considering whether interventions ignore or exacerbate structural inequalities, not only whether they are impactful or feasible.
Prioritisation could also be tailored according to specific local contexts, for place-based behavioural solutions.
Policy sectors of note
Alongside these principles, participants identified the following policy areas as worthy of particular attention:
- Agriculture and land management: Changes in land practices can have significant benefits across climate mitigation, adaptation and biodiversity. Scotland also has a relatively small number of large, influential landowners. This makes targeted interventions potentially more feasible and impactful, on behaviours such as tree planting, water management, and peatland restoration and management.
- Clean heating systems: A widespread switch to heat pumps or other low emission heating would give significant emissions reductions, and the choice between heating systems is mostly presented as a household decision – albeit one affected by wider factors including affordability. Clean heat is also an opportunity for innovation and community or area-based solutions.
- Electric vehicles: Access to charging infrastructure and cost remain barriers to the uptake of electric vehicles, which should be prioritised for their significant potential to reduce emissions. This could also be an opportunity to explore behaviours around vehicle sharing.
- Nature: For many people in Scotland, ideas about nature are closely linked to their identity and pride – both of which can be critical drivers of behaviour change. There are therefore opportunities for using behavioural insights in interventions around eating venison to manage deer populations, ‘greening’ gardens, and improving access to nature through both ‘green’ and ‘blue’ spaces.
- Reducing water consumption: Household water use in Scotland exceeds other UK regions. Given Scotland’s rainy climate, there is both low awareness of this issue and low motivation for change – despite areas of Scotland having experienced drought in recent years.
Proposed projects
Action 1:
Develop a prioritisation matrix that ranks policy areas and their corresponding behaviours, based on climate-adapted APEASE criteria.
Challenge 2: Engaging policymakers with behavioural evidence
Challenges and opportunities
Several significant reasons were identified for why behavioural science does not have a more central role in policymaking: a lack of clarity on the root causes of the policy problem; a lack of time available to consider behavioural insights; and a lack of capacity to analyse potentially conflicting evidence. Time pressures create a bottleneck where particularly senior leaders are unable to devote time and resource to consider the full breadth of available evidence to inform complex policy options. It can also be a challenge that behavioural science does not often lead to one clear policy option. Conversely, there is a need to increase capability among academics to present behavioural insights in a way which is useful within the complicated policymaking process.
This raises several opportunities: working to increase mutual understanding between policymakers and academics can help build relationships that survive the churn of officials, and can foster more widespread understanding of how to use behavioural evidence. This could also be pursued by ‘raising the floor’ across the board by increasing policymakers’ understanding of and engagement with behavioural science. That would allow policymakers to better identify the behavioural components of their policy problems and communicate these to academics.
Finally, there is also an opportunity to find more effective means of distilling and sharing key evidence, by using trusted knowledge brokers to engage with senior leaders. For example, climate action can be politically difficult to drive, so storytelling approaches could be brought more into policymaking. This has the potential to better capture the public imagination and to use public participation and engagement to build trust and support for more contentious proposals.
Possible actions and approaches
Action 2:
Hold a ‘mutual learning’ workshop between senior policymakers and behavioural researchers in a priority policy area (see Action 1). This session should cover fundamentals of ‘the practical use of behavioural science in policymaking’ and ‘the realities of climate policymaking’. It should also include an exercise to identify short- and longer-term opportunities for collaboration.
Action 3:
Scope a project to introduce oral history or storytelling expertise as part of policy design and public engagement. The project would seek to understand the different ways that the sharing of stories, experiences and perspectives can have influence on policymaking, and on engagement with the public.
Action 4:
Scope the secondment of an academic behavioural researcher into the Climate Behaviours team (to start in spring 2026), being clear on the purpose. See Annex A for a case study of the secondment of a behavioural scientist into the Cabinet Office.
Challenge 3: Improving the evaluation of behavioural interventions
Challenges and opportunities
Evaluating the impact of behavioural interventions is important to generate evidence of what works, and why. However, it is challenging and resource-intensive to test and track the direct impact of policies on behaviours.
The fast-paced and non-linear nature of the policy cycle can be at odds with evaluation practice, as new priorities often emerge before there is time to assess the impact of existing interventions. In a policy environment where demonstrating short-term impact is important to justify investment, it can be difficult to pursue evaluations which seek to understand what works over time. It is often not possible to meaningfully demonstrate the effect of an intervention over a single electoral cycle.
When evaluations do occur, there can be an emphasis on demonstrating immediate impact, or solely proving which aims have been reached – rather than a more holistic focus on the wider changes which an intervention is contributing to. Indeed, articulating the relative contribution which an intervention has made is also a challenge.
Three practical elements can be the foundation for building evaluation practice into policymaking:
- A simple theory of change that clarifies how the intervention is expected to reach its desired objectives, and which is broadly understood by the policymakers and analysts involved.
- Clear, evaluative questions based on the theory of change, and a record of what is being achieved.
- Proportionate data to track each element – which incorporates (as appropriate) qualitative and quantitative data and is of ‘good enough’ quality.
A Bayesian approach – which looks at the accumulation of knowledge and learning – could help to guide evaluation strategies which span multiple, shorter-term interventions. Whereas traditional evaluation methods use data to provide singular answers on the success (or not) of an intervention, Bayesian approaches suggest the confidence or likelihood of an intervention’s success, based on both the data and what is already known.
Possible actions and approaches
Action 5:
Co-create theories of change for three priority policy areas (see Action 1), and collate the data to feed into this. Provide this in a simple, clear tool for each policy area, which also links to data sources for monitoring and evaluating impact.
Action 6:
Develop a short document with ‘Key principles for behavioural evaluations’, including principles, case studies from the Scottish Government’s Centre of Expertise in Appraisal and Evaluation, and contact details for experienced individuals.
Taking action
The Scottish Government Climate Behaviours Team will take forward the projects and actions proposed in this roundtable summary. They will collaborate with and involve Scottish Government colleagues and other roundtable participants as relevant. The roundtable participants will be invited to a follow-up event in spring 2026 to take stock, and review and reflect on progress.
Annex A:
Case study: Reviewing knowledge, skills and training needs across the Civil Service in behavioural research
Dr Marie-Louise Sharp is seconded to the Cabinet Office as part of the National Capability in Behavioural Research Programme (NCBR). Her secondment runs for four years from February 2025.
“My fellowship workplan is to scope and develop training interventions to increase capability and upskill Civil Servants in their knowledge, skills, networks and use of behavioural research, with the intention of more systematically embedding behavioural research evidence and methods into policy, strategy and delivery processes in the work of Government in the future.
“The first phase of the fellowship will focus on mapping behavioural research knowledge and capability in the Civil Service, whilst also scoping where gaps might be, and what training/interventions might be needed in the future to serve different groups in the Civil Service. These groups might cover behavioural research specialists, different professions, and those who commission behavioural research. It is also important to consider what baseline level of knowledge and training is needed for everyone to improve their behavioural literacy.
“Additionally, the scoping work will look more broadly at systems and cultures within the Civil Service to identify both barriers and enablers of Civil Servants being able to apply behavioural research skills in their day-to-day practice. I will be looking at leadership and ultimately, with any intervention, where the most impact might occur from any upskilling programme.
Dr Sharp is seconded from the Centre for National Training and Research Excellence for Understanding Behaviour (Centre-UB) hosted by the University of Birmingham as part of a £17m investment from ESRC into Behavioural Research in the UK
Annex B: Roundtable pre-read
Accelerating the use of behavioural science in climate policymaking
A pre-read for participants in the roundtable on 2 September 2025
Professor Linda Bauld, Professor Lorraine Whitmarsh and Professor Paul Cairney
Key points: Why are we holding this roundtable?
The focus: This roundtable will discuss how the use of behavioural science can be embedded and accelerated in climate and environmental policymaking in the Scottish Government (SG).
The context: Scotland will not reach our climate goals without significant behaviour change across the population. This behaviour change is not currently happening at anywhere near the pace or scale required. Making better use of behavioural science in policymaking, through a fundamental re-think of how we make policy for people, has the potential to make a meaningful difference to how we work on climate as a government. Despite the abundance of behavioural research and strong evidence of its value to policymaking[1], only a fraction comes to influence policy choices. Significant hurdles to embedding behavioural science in climate policy remain.
The challenge: This roundtable with academics and senior civil servants aims to identify two or three new projects or approaches to trial in SG over the next six months. Together, we will consider how we prioritise action where it is needed most; how to overcome the challenge of making evidence more accessible and usable to policymakers, and how to empower them to use it effectively; and to better demonstrate of the impact of behaviour change via a more systematic use of evaluation. Participants are asked to consider examples that have worked well and what factors made them successful, as well as lessons learned from examples that did not cut through.
Specifically, we’ll discuss three challenges – each time asking, ‘What can we try in the next six months to address this?’:
- There are very many behavioural changes needed to reach SG’s climate mitigation, adaptation, and biodiversity goals. These behaviours have various levels of impact, and some are harder for SG to enable than others. We need to prioritise the embedding of behavioural science accordingly.
- Not enough policymakers in Scottish Government are seeking out behavioural evidence and expertise when making climate and environment policy. The evidence they do find is often densely academic and hard to apply.
- Evaluating the impact of behavioural interventions is important for generating evidence of what works, and why. However, it is challenging and resource-intensive to test and track the direct impact of our policies on behaviours.
The following paper sets out the context for this roundtable.
What do we mean by ‘behavioural science’ and ‘behaviour change interventions’?
Behavioural science (or ‘behavioural research’) is the study of how people behave and make decisions. Using data, behavioural research seeks to understand what drives people’s actions. This includes individual, social and material factors. It is a multidisciplinary field that examines human behaviour by combining insights from a range of academic disciplines including psychology, sociology, neuroscience, economics and others.
Behaviour change interventions are a coordinated set of activities designed to change specified behaviour patterns – these patterns that are measured in terms of the prevalence or incidence of particular behaviours in specified populations.[2] Behaviour change interventions need to take into account individual factors (capability and motivation) but also, importantly, context (social and environmental factors).[3]
Why is behavioural science particularly important in climate policymaking?
Scotland will not reach our climate goals without significant behaviour change across the population. This behaviour change is not currently happening at anywhere near the pace or scale required. To reach net zero by 2045, we need car use to reduce significantly (by at least 20%) and for almost every new car sold to be electric (currently, it’s 1 in 7); we need 92% of homes to have installed clean heating (currently, it’s 11%); we need land managers to be planting more trees and to be restoring and maintaining two-thirds of our peatland (currently, it’s less than one-third).
The First Minister’s Environment Council recently recommended that the SG accelerates the use of behavioural techniques in climate policy. Importantly, this does not mean locating responsibility for these changes with individuals – policies are needed that remove the barriers to action. Behavioural science can increase the chance that ‘the public’ accept and co-operate with policies.
Understanding behaviour is relevant for all stages of the climate policymaking cycle, from problem definition to evaluation. For example:
- At the problem definition or agenda-setting stage, important behavioural questions need to be asked, including, which behaviours and whose behaviour does the policy seek to address/reach/change.
- During policy formulation, consideration of how alternatives will affect behaviour is important, as it is when considering policy alternatives and policy design.
- During implementation, the success of a policy is often determined by behaviour (by governments, delivery partners, and communities affected).
- Including behavioural research in the evaluation can support our understanding of whether the policy succeeded or failed or how it can be improved in future.
Behavioural science is of course not a silver bullet, leading to one clear policy option. Policy choices will still be complex and difficult, but by using evidence from behavioural research and insights, these choices will be more fully informed, and decisions will have a greater chance of succeeding.
How does SG currently use behavioural science in climate policymaking?
Many climate and environment policymakers use ‘person-centred’ principles in their work and intuitively think about citizens’ behaviours. SG has dedicated resource to ensure that this work is consistent, well-documented, and using the latest behavioural insights.
SG has a ‘Climate Behaviours’ team of four people
Their role is to support SG policymakers and partners to use the latest behavioural insights when developing and delivering climate change policy and projects. They have worked closely with 12 policy teams and with external partners; support a cross-directorate Climate Behaviours network; routinely share latest behavioural evidence with policymakers; and deliver a nationwide climate marketing campaign each year. The team’s recent projects include:
- co-designing 10 new behavioural interventions to enable more farmers to plant trees, which agriculture colleagues are now working to deliver
- conducting a ‘sludge audit’ of the heat pump grant and loan scheme, in order to increase the number of people installing heat pumps
- overseeing the design of a behaviourally-informed Household Flood Plan template, to enable more people at risk to prepare for flooding.
Central behavioural expertise
To support behavioural science in policymaking more broadly, SG seconds behavioural researcher Professor Linda Bauld as Chief Social Policy Adviser. There is also a team of three social researchers within Central Analysis Division (CAD) who support a cross-government ‘Behavioural Insight Network’. Professor Bauld and these social researchers (with support from others including academics) have developed a Behavioural Science Toolkit that is available via SG’s internal learning portal. CAD colleagues and Professor Bauld, working with SG communications and others, also contribute to UK and international networks on behavioural science in health.
Enabling the uptake of behavioural science
- In the Climate Behaviours team’s experience factors which best enable the uptake of behavioural science are: Dedicated capacity to stay abreast of latest behavioural insights and identify timely opportunities for these to be applied to government’s strategic priorities (i.e. in areas with momentum and decisions to be made);
- Buy-in and attention from senior leaders who give policymakers the mandate to dedicate time and resources to behavioural work; and strong working relationships between grassroots policymakers and the Climate Behaviours team, collaborating on discrete projects through in-person workshops to build capacity and relationships.
Why is it difficult to embed behavioural science in climate policymaking?
There are significant hurdles to embedding behavioural science in climate policy. Behavioural science is an evolving and multidisciplinary field, and behaviour changes can be slow and difficult to measure, often making it costly to evaluate interventions and to learn what works.
Added to this, climate policy is highly cross-sectoral, politically sensitive and operates in a complex global landscape. A systemic approach to climate policy is needed to address the multiple factors that shape society. This combines regulation, infrastructure and market incentives (upstream interventions) with development of skills and services (mid-stream), and communication and engagement with communities, businesses and individuals (downstream).[4] Governments tend to focus on individual-level rather than system-level interventions. This ‘downstream’ focus can exacerbate inequalities by not removing structural barriers to action. Effective interventions tackle institutional barriers, skills gaps and power structures.
Despite the abundance of behavioural research, only a fraction comes to influence policy choices. Findings are context-dependent so conclusions can be contradictory, e.g. ‘the best mode of communicating about climate change depends on the audience’. This can make it difficult for policymakers to find the top line or overall narrative and prioritise actions.
Conclusions from behavioural research can be broad principles for good practice. Policymakers sometimes struggle to relate that to their specific policy context or issue. Additionally behavioural studies may not measure economic aspects of an intervention, which are often important to policymakers.
Further to this, the Scottish Government Climate Behaviours team have identified the following primary challenges to their work:
- Low awareness of behavioural science as a tool, and misunderstanding at all levels of government as to what it offers. There are widespread misconceptions that enabling behaviour change is the work of communications, is simply about ‘nudges’ (when it is much broader than that), or that the tools are complex and inaccessible to policymakers.
- Few senior leaders are calling for climate behavioural work meaning few policymakers feel they can dedicate resources for ‘nice to have’ behaviours work.
- There are no mechanisms for systematically requiring behavioural evidence in policymaking.
What are the barriers to using evidence in policymaking?
A wealth of research demonstrates an often-large and enduring gap between the supply and demand for research evidence in policy making. These challenges are not exclusive to behavioural science – there are barriers (and enablers) to the full use of all types of evidence in policymaking. There are no simple and obvious solutions to this problem. Rather, we focus on how to understand and respond to three general issues:
Limited coordination and control over policy outcomes
Simple aspirational models of policymaking give the impression of an orderly cycle of activity coordinated from a government, with clear opportunities to use evidence when defining a problem, generating solutions, and evaluating outcomes.
Real-world policymaking involves policy outcomes that emerge from the interaction between many choices made at different times by many different policymaking organisations, making it difficult for researchers to know where and when to act to make an impact with evidence. This issue has prompted attention to a range of approaches and aims to foster policymaking integration, policy coherence, or systems approaches to problems and policymaking.
Limited agreement on what counts as ‘the evidence’
If you engage with a diverse range of researchers and policymakers, you will find a range of ideas on what constitutes good evidence. For example, there is debate within research about what constitutes high quality evidence and which methods to prioritise. Policymakers and researchers may also prioritise different criteria to determine usability, such as to emphasise the methods to produce and evaluate evidence or its timeliness, brevity, and relevance to policy agendas.
Limited resources to gather, understand, and use evidence for policy
Researchers often describe filling gaps in knowledge with more information, to reduce policy uncertainty by improving our understanding of the technical feasibility of solutions. Time-pressed policymakers need reliable ways to filter out most information, seeking a small number of routinely trusted sources. They also use their values or beliefs to reduce policy ambiguity (which describes many ways to interpret the same problem) and seek to engage with a diverse range of stakeholders to improve the political feasibility of solutions. Hence, the disconnect can relate to different activities: researchers seeking more effective ways to communicate technically feasible solutions; and policymakers seeking solutions that would work politically as well as technically.
Appendix A – For those less well-versed in behavioural science: How is behavioural science used in policymaking?
To inform different scopes of policy
- Behavioural intervention: Behavioural science can be used to target individual actions through behavioural interventions.
- Single policy: It can support the development of individual policy tools, by guiding policy choice and design with an understanding of behavioural factors.
- Policy mix: It can align multiple policy tools to work together towards a shared objective, informed by relevant behavioural factors.
- System: And behavioural science can be used to pinpoint leverage points to achieve a more cohesive, well-functioning system.
To inform different stages in the policymaking cycle
When designing policy, we can use evidence to identify the behavioural changes which can benefit our society, and which we can fairly ask the public to make. We can use behavioural models to design policies and policy mixes which are most likely to be effective.
For example: The Behaviour Change Wheel [5] sets out the full range of policy levers which can be pulled to enable behaviour change. It suggests that multiple policy levers are necessary, without over-reliance on one.
When delivering policy, behavioural models help us understand the barriers preventing people from responding the way we intended them to. They help us to see how to overcome those barriers and to course-correct.
For example: The EAST Framework [6] proposes that policy needs to make a behaviour Easy, Attractive, Social and Timely. If a policy isn’t achieving each one, then gaps should be addressed.
When evaluating policy, behavioural data can be used to measure impact, and to understand the reasons for that.
For example: The COM-B Model [7] proposes that people need Capability, Opportunity and Motivation in order to act. We can measure each of these through surveys and focus groups, to help understand levels of uptake of the desired behaviour.
To inform different types of policy
Behavioural science sets our policy as being Upstream, Midstream, or Downstream:
- Upstream (e.g. focusing on systemic and structural factors at societal level)
- Midstream (targeting the context and environment to make positive behaviours easier and more likely)
- Downstream (addressing individual behaviours and providing targeted support to those who need it)
To enable systems thinking
By combining evidence on individual behavioural factors and influences with an understanding of the context within which behaviours occur and the dynamic interactions and feedback loops within complex systems[8].
End notes
Ruggeri, K., Stock, F., Haslam, S.A. et al. (2024) A synthesis of evidence for policy from behavioural science during COVID-19, Nature, 625, 134-147, doi: 10.1038/s41586-023-06840-9 ↑
Michie et al (2011) The behaviour change wheel: a new method for characterising and designing behaviour change interventions, Implementation Science, 6, 42, doi: 10.1186/1748-5908-6-42 ↑
Davis, R, Campbell, R, Hildon, Z, Hobbs, L, Michie, S (2014) Theories of behaviour and behaviour change across social and behavioural sciences: a scoping review. Health Psychology Review, 9, 3, doi: 10.1080/17437199.2014.941722 ↑
Pidgeon, N (2025), Example Behaviour Change Interventions in the Domain of the Environment, Internal briefing to Scottish Government Chief Scientific Adviser ↑
Michie, S, Van Stralen, M, West, R (2011) The behaviour change wheel: a new method for characterising and designing behaviour change interventions. Implementation Science, 6, 1, doi: 10. 1186/1748-5908-6-42 ↑
The Behavioural Insights Team. (2014) EAST: Four Simple Ways to Apply Behavioural Insights; Behavioural Insights Team: London, UK. ↑
Michie, S, Van Stralen, M, West, R (2011) The behaviour change wheel: a new method for characterising and designing behaviour change interventions. Implementation Science, 6, 1, doi: 10. 1186/1748-5908-6-42 ↑
Parkinson JA, Gould A, Knowles N, West J, Goodman AM (2025) Integrating Systems Thinking and Behavioural Science. Behav Sci, 15(4) 403. doi: 10.3390/bs15040403
How to cite this publication: Whitmarsh, L., Cairney, P., Bauld, L., Bartholomew, K., Creamer, E. and Bergseng, AM. (2025) ‘Accelerating the use of behavioural science in climate policymaking’, ClimateXChange. http://dx.doi.org/10.7488/era/6775
© The University of Edinburgh, 2025
Prepared by ClimateXChange, The University of Edinburgh. All rights reserved.
While every effort is made to ensure the information in this report is accurate as at the date of the report, no legal responsibility is accepted for any errors, omissions or misleading statements. The views expressed represent those of the author(s), and do not necessarily represent those of the host institutions or funders.
This work was supported by the Rural and Environment Science and Analytical Services Division of the Scottish Government (CoE – CXC).
ClimateXChange
Edinburgh Climate Change Institute
High School Yards
Edinburgh EH1 1LZ
+44 (0) 131 651 4783
If you require the report in an alternative format such as a Word document, please contact info@climatexchange.org.uk or 0131 651 4783.
Event date: 4 February 2025
DOI: http://dx.doi.org/10.7488/era/5747

Summary of all sessions from the conference by graphic recorder Eddy Phillips. For a high-resolution version click here.
Aims and highlights
With the next Scottish Government Climate Change Plan due to cover the period to 2040, Scotland is at a critical point for climate action to reach net zero and build climate resilience. The aim of the Climate Horizon 2040 Conference was to generate ideas and insights on emerging research and developments to inform realistic and achievable climate policy in the 2030s and 2040s.
Nearly 170 delegates signed up for the event. They included a mix of experts from academia, business, the third sector and the public sector. The conference was an opportunity for them to connect with each other and take inspiration from the sessions for their work. As a delegate said after the conference: “Networking was really good – and the interactivity of the sessions made it feel more engaging and rewarding”.
The event was very popular – ClimateXChange received a total of 36 proposals and had to whittle them down to 7 sessions. Sessions discussed public perceptions of climate change and action, mitigation and adaptation, the potential role of AI, carbon pricing policies, financing place-based home retrofit, land use scenarios and designing cities.
For the final session, delegates sat in groups aiming to answer questions about strategies that could help mobilise climate action in relation to market mechanisms, industry, behaviours, finance and investment, and regulation.
The conference highlighted the urgency of embedding adaptation into Scotland’s net zero strategy, integrating technological and financial innovations while ensuring a just transition. The roundtable discussions produced key recommendations including:
- Strengthening policy alignment of mitigation and adaptation measures
- Scaling up finance mechanisms for public and private climate action
- Investing in resilience
- Enhancing public engagement to drive behavioural change
- Leveraging innovation
- Collaborating across sectors and organisations
- Learning from EU countries
This report summarises the key issues raised and discussed at the conference, the major challenges expected and big things on the horizon. The ClimateXChange podcast features a summary of the conference.
Main issues discussed
1. Future-proofing climate action: Integrating mitigation and adaptation
Led by Sustainable Scotland Network adaptation sub-committee
The synergies between mitigation and adaptation are discussed frequently, yet, mitigation and adaptation efforts are often still considered separately. This is problematic not only because both are necessary to address climate change, but also because mitigation measures can limit adaptation options or even create new challenges for adaptation, and vice versa.
For example, if a low-carbon, sustainable new build is located on a flood-plain or is not adequately insulated and ventilated to deal with increased heat events, then costly modifications or maintenance will need to be completed. This can lead to unnecessary, additional greenhouse gas emissions and costs throughout the building’s lifetime.
This panel discussion with researchers and practitioners in the public sector discussed how they have successfully integrated mitigation and adaptation and the challenges they faced in doing so.
Conversations highlighted that despite efforts to reduce emissions, continued adaptation is essential due to climate change.
In particular, the panel discussed the value of adapting strategies to prevent worsening of public health and ensure benefits from land use. While there is some political resistance and planning uncertainties, panellists gave successful local examples that demonstrated practical integration of adaptation measures.
They also highlighted that transformative changes and improved communication would help align public understanding and actions with increasingly urgent climate realities.
Key points from the discussion:
- Why do we need to future proof climate action? Even if we meet net zero goals, the globe will continue to warm so we need to continue to adapt. Climate change adaptation must be embedded in mitigation strategies to build resilience.
- Uncertainty remains a key challenge in integrating adaptation into policy.
- Land use is responsible for 40% of Scotland’s net emissions. Land must be managed for multiple benefits and guard against multiple risks such as biodiversity, flood prevention, carbon sequestration – this is very different from the historical status quo.
- Some local governments show political resistance to adaptation, yet they are already implementing practical measures eg adaptation measures in net zero social housing.
- The concept of “climate-resilient net zero” must be central to planning, avoiding the carbon costs of rebuilding after climate disasters.
- “Climate is a health emergency as well as a planetary emergency”. It is important to plan our mitigation measures with climate impacts in mind so as not to exacerbate health impacts. For example, active and public transport is a win-win-win for mitigation, adaptation and health.
- Regardless of taking the approaches of incremental or transformative adaptation, we need to be in control of the change rather than wait for impacts.
2. AI for energy justice
Led by Professor Aristides Kiprakis, University of Edinburgh
Artificial Intelligence (AI) has the potential to create a system that is not only more resilient, efficient and sustainable, but also more equitable and inclusive. However, there are challenges associated with AI. Making AI accessible to all citizens, including those in fuel poverty, requires careful consideration, so that no one is left behind.
In this session, experts and stakeholders on AI, social science, energy systems and energy policy shared their views on how to tackle those challenges.
Discussions centred on AI’s potential to tackle fuel poverty and enhance energy distribution efficacy. Panellists highlighted that using data from AI’s capabilities in grid monitoring and behaviour analysis could help optimise energy use and address fuel poverty.
However, they also discussed ethical concerns related to integrating AI, such as privacy in healthcare and biases in algorithms. Discussions acknowledged the potential of AI to improve energy efficiency through smarter infrastructure and demand-side management, yet scepticism remains about AI’s role in overcoming fundamental societal inequalities in energy access.
Highlights from the session included:
- The first step is to use AI to use existing infrastructure more flexibly and smartly. For instance, AI could help monitor household energy needs, as Scotland faces growing fuel poverty (31% of households).
- AI could help save on capital investments in new infrastructure.
- AI could help optimise energy systems, predict grid failures and improve efficiency, but it must be applied equitably. To this end, the role of AI in energy systems should prioritise energy distribution over generation, ensuring equitable access.
- Challenges include high energy use in AI models and concerns about data privacy and embedded bias.
- Innovative solutions, such as using data centres to heat homes, are already being piloted in Edinburgh.
3. Carbon pricing policies
Led by Dr Vera Eory and Professor Klaus Glenk, Scotland’s Rural College
According to research into how farmers in Scotland view carbon schemes and how scheme design preferences affect intentions to uptake, there is considerable interest in carbon schemes if certain conditions are met. However, there is much variation in farmers’ preferences for contractual obligations, suggesting that a careful exploration before implementation could improve participation.
This session considered the wider aspects of carbon pricing policies in Scotland, especially in agriculture and other four sectors not included in the UK Emission Trading Scheme. The discussion included the role of carbon markets currently and in the short- and medium-term.
Highlights from the session included:
- Discussions explored carbon pricing mechanisms, including Emissions Trading Schemes (ETS), taxation and market-based incentives.
- Farmers and land managers expressed concerns about how carbon pricing might impact agriculture.
- There is a need for blended finance approaches that combine public and private investment.
4. Financing place-based home retrofit
Led by Dr Ian Cochran, Changeworks
Place is an important part of the Scottish policy approach. “Place-based” is increasingly widespread in describing how cross-sector decarbonisation can offer opportunities for economies of scale, social and economic benefits as well as combining the multiple interventions needed in targeted zones at once.
The session aimed to provide an understanding of what we need to get right to bring life to place-based to provide important insights for policy. Given fiscal constraints across the public sector, both Scottish and UK government have expressed interest in exploring the financial benefits.
The session discussed what would good place-based action look like in 2040 and how to take action from today for 2040. Highlights from the session included:
- Climate finance must shift from extractive models to regenerative investments that retain wealth locally.
- Community-led energy and retrofit projects require accessible funding mechanisms and streamlined processes.
- Case studies highlighted the need for scalable and replicable funding models to support neighbourhood-level transitions to net zero.
- Long-term investment strategies must prioritise system-wide change rather than isolated pilot projects.
5. Building net zero land use scenarios with Lego
By Anna Sellers, LUNZ Hub
To get delegates energised after lunch, they had a choice of two interactive sessions. In this session, they were asked to play an interactive game using Lego.
Delegates built net-zero land use scenarios and explored trade-offs between competing interests and priorities for land use in coming decades. The following figure summarises scoring across actions and variability across the groups.

The session got delegates considering that the net zero target extends beyond reducing carbon emissions to include biodiversity, water management and flood prevention.
Participants highlighted the complexity of behaviour change and criticised the focus on biomass and mono-culture tree planting. Furthermore, they discussed actions such as reducing livestock numbers both as challenges requiring behaviour change to prevent increased meat imports, and as opportunities to enable broader environmental benefits. Discussions highlighted nature such as peatlands and forests as more than a carbon sink, and the importance of balancing interventions between nature-based and farming practices.
Highlights from the session included:
- Peatland restoration, tree planting and habitat creation emerged as priority land-use strategies.
- Reducing ruminant livestock herds was debated, with concerns over offshoring emissions.
- Participants emphasised the need for evidence-based approaches to increasing soil carbon and the role of agroforestry in helping to achieve Scotland’s net zero goals.
A complete report of the session is on the LUNZ Hub website.
6. Co-designing Glasgow’s future net zero hospitals
Led by Professor Paul Rodgers, University of Strathclyde
A parallel interactive session explored how NHS Scotland’s hospitals in Glasgow can transition to net zero by 2040. As key public institutions, hospitals can serve as models for broader net zero adoption. Groups were asked to design what Scotland’s net zero health care ecosystem could look like in 2040.
Participants took part in an interactive exercise with maps and Plasticine to explore how the city’s health and social care infrastructure can become sustainable while maintaining high care standards. The focus was on sustainable energy, green spaces, transport and waste management infrastructures.
The session showed how net zero is an opportunity to reimagine the way a city works. One of the examples discussed was that of re-purposed buildings such as disused churches that could be used for drop-in health centres, improving access and connectivity.
Highlights from the session included:
- NHS infrastructure and transport networks can be decarbonised and made climate resilient.
- Waste heat from NHS facilities could be repurposed to heat neighbouring communities.
- Local travel can be smoother and help achieve the health and environmental targets.
- Strategies for integrating sustainability into healthcare infrastructure were explored, including solar panels, heat networks and energy-efficient retrofits.
Reflections
The final session of the event was an opportunity for delegates to reflect on the discussions held throughout the day.
They could share their thoughts on research needs and recommendations for the Scottish Government on market mechanisms, industry, behaviours, finance and investment and regulation, while also discussing what more Scotland can do to reach net zero.
How can market mechanisms and incentives be used to deliver emissions reductions?
This discussion explored various aspects of carbon market operations, particularly the Emissions Trading System (ETS). Key points included the effectiveness of carbon pricing and the allocation of free allowances, which has proven successful in sectors like energy that received no free allowances.
The debate extended to the potential inclusion of household fuel and agriculture in the ETS, with suggestions for different ETS setups reflecting specific industry needs and minimising significant economic impacts on certain sectors.
Delegates also discussed transport’s integration into ETS by 2029 and shipping by 2026, along with dynamic pricing models like road pricing during peak times.The conversation touched on the broader political and economic contexts, such as subsidies in aviation fuel and the challenges of a just transition, especially relating to older and electric vehicles. Discussions around financing mechanisms like zero-interest loans for second-hand EVs and grants for heat pumps, highlighted the need for financial and carbon literacy to navigate these incentives effectively.
Participants noted that aligning financial instruments with emission reduction targets is complex. They emphasised the necessity of clear, targeted policies to facilitate a transition to low-carbon alternatives.
The discussion also explored market mechanisms for emissions reduction, highlighting their impact on socio-economic disparities, especially for lower-income groups in Scotland and inter-generational justice in Wales.
Which industries and sectors are in a position to lead on the transformation to net zero, and how do we encourage that leadership?
Given their contribution to greenhouse gas emissions, the session identified oil and gas, construction, transport, electricity and textiles as key sectors that could lead the transformation to net zero. Delegates highlighted the potential role of creative industries in making change through creativity, design and innovation.
Building on existing leadership and expertise, particularly in energy and construction, is crucial. Encouraging leadership involves harnessing the skills of individuals in longstanding industries to lead newer, sustainable sectors.
Delegates also highlighted the need for regulatory support, improved training for retrofit assessors and innovative financial products to encourage retrofitting.
They recommended that policymakers create a level playing field through regulation, set consumption-based targets and support crucial network and SME infrastructure developments for a smoother transition to net zero.
What strategies can help shift behaviours and mobilise climate action by major emitters and the wider public/communities?
The discussion emphasised creating an environment where eco-friendly choices are the most appealing and accessible. Learning from the Covid-19 pandemic, the strategy involves a mix of incentives and penalties. Participants suggested financial incentives for individuals and strict regulations for major emitters. Additionally, participants highlighted the need for a social and wellbeing economy, addressing property ownership issues in Scotland.
Delegates suggested behaviour change tactics such as leveraging consumer power, promoting sustainable travel and localising decision-making. An emphasis on extensive collaboration, both domestically and internationally, is crucial for addressing large-scale emitters. Creative, long-term engagement supported by local authorities, combining technology, legislation and public information, is vital for encouraging widespread adoption of climate-positive behaviours.
The session advocated for both top-down and bottom-up approaches, stressing the importance of co-benefits linking climate actions to other community benefits, like health, to resonate more effectively with the public.
How can we mobilise finance and investment to fund effective climate action in Scotland, including securing public and private sector contributions?
It is crucial to make climate projects investible and de-risking investment. To attract both public and private sector funding, projects need a strong business case that demonstrates both financial returns and climate risk mitigation. There is a need for clearer evidence on risk profiles and investment benefits to increase investor confidence.
Blended finance approaches such as public-private partnerships can help de-risk projects, making them more attractive to investors.
With regard to policy and incentives to drive climate investment, delegates suggested that the Scottish Government could incentivise net zero outcomes rather than funding specific measures, allowing businesses to innovate in achieving climate goals. Government could explore a mix of policies to better align public and private sector investment. Delegates also highlighted that greater investment is needed in areas without a clear revenue mechanism, such as home insulation, where financial benefits are indirect but significant (eg reducing NHS costs from cold-related illnesses).
It is also important to shift investment and valuation approaches. The discussion highlighted the need to rethink how we value climate action, moving away from purely financial metrics and toward societal and environmental benefits. Pension funds and other institutional investors face challenges balancing financial returns with ethical and fiduciary responsibilities. Delegates suggested taking a whole-systems approach to understand policy interdependencies, such as transport and heating schemes, which can generate broader economic and social benefits.
Which regulatory or non-financial policy measures could have the biggest impact on reducing emissions in Scotland?
Key principles suggest that regulation should heavily target high emitters while facilitating grassroots and community initiatives. Delegates suggested taking an assertive approach, similar to France’s ban on oil-fired heating, for phasing out gas boilers.
Participants also suggested tightening regulations on environmental claims about products and services, akin to measures in France and Belgium. Additionally, regulating the embodied carbon in building constructions, a common practice in Nordic countries and soon to be implemented EU-wide from 2028, could further lower emissions.
Another proposal is to open up the energy market to allow peer-to-peer electricity sharing. Increasing the accountability of large landowners could also drive reductions in emissions.
Big things on the horizon
The conference highlighted aspects related to climate change action that are likely to become key policy priorities such as more resilient infrastructure, innovations, considerations for a just transition and climate finance.
1. The need for climate-resilient infrastructure
- Flooding and extreme weather events will continue to escalate, requiring adaptation in housing, transport and utilities.
- Infrastructure investment must consider long-term resilience rather than short-term cost savings.
2. Policy and regulatory innovations
- Moving towards a wellbeing economy means that carbon pricing and regulation align with climate justice goals.
- It’d be beneficial for new policies to focus on consumption-based emissions rather than just production-based metrics.
3. Just transition and equity considerations
- A just transition to net zero ensures that low-income communities are not disproportionately impacted.
- Energy pricing mechanisms should consider affordability while driving emissions reductions.
- Public engagement strategies can bridge the gap between early adopters of net zero technologies and those unable to afford the transition.
4. Expanding climate finance and investment
- Private investors need clearer risk assessments and investment benefits to scale up climate projects.
- Pension funds and institutional investors must balance financial returns with ethical responsibilities.
- A whole-systems approach can help integrate transport, heating and energy infrastructure into net zero planning.
5. Leveraging AI and digital solutions
- AI has the potential to enhance real-time climate action by optimising grid management and energy efficiency.
- However, digital solutions must be accessible and not exacerbate existing inequalities in energy access.
- Further research is needed to understand the long-term role of AI in achieving Scotland’s climate targets.
Conclusion and recommendations
The Climate Horizon 2040 Conference highlighted the urgency of embedding adaptation into Scotland’s net zero strategy, integrating technological and financial innovations while ensuring a just transition. Key recommendations include:
- Strengthening policy alignment: Ensure adaptation and mitigation policies are integrated to prevent unintended consequences.
- Scaling up finance mechanisms: Streamline funding for community-led climate action and incentivise private sector investment.
- Investing in resilience: Prioritise climate-proofing infrastructure to mitigate long-term risks.
- Enhancing public engagement: Develop clear, accessible communications to drive behavioural change and climate action.
- Leveraging innovation: Ensure AI and digital tools contribute to equitable and effective climate solutions.
- Collaborating across sectors and organisations: For instance, a coordinated plan with combined effort could help achieve a balance of pragmatism (especially with regard to cost) and politics (such as achieving public buy-in). This is at the core of accelerating climate action and achieving climate targets.
- Engaging with EU countries: Learning from other countries about measures that are are already being implemented.
DOI: http://dx.doi.org/10.7488/era/5747
© The University of Edinburgh, March 2025
Prepared by ClimateXChange, The University of Edinburgh. All rights reserved.
While every effort is made to ensure the information in this report is accurate, no legal responsibility is accepted for any errors, omissions or misleading statements. The views expressed represent those of the author(s), and do not necessarily represent those of the host institutions or funders.
ClimateXChange
Edinburgh Climate Change Institute
High School Yards
Edinburgh EH1 1LZ
+44 (0) 131 651 4783
If you require the report in an alternative format such as a Word document, please contact info@climatexchange.org.uk or 0131 651 4783.
Why it is important
The Scottish Government aims to reduce the number of car kilometres by 20% by 2030, compared to 2019.
The Scottish Government asked ClimateXChange (CXC) to assess the evidence base on what works to reduce car use, including shifting to a different transport mode and behaviour change.
CXC commissioned a suite of three studies looking into a range of measures that could help reduce car use: the impact of parking policies, how to encourage sustainable travel among under-18s and their families, and the benefits of sustainable travel to local high streets and town centres.
How ClimateXChange supported policymakers
To build strong, practical evidence of what works in reducing car use, the studies looked for long-term and robust evaluations of the impact of interventions, and evaluations that capture a range of benefits across economic, environmental and social factors.
This was challenging because many interventions have not been robustly evaluated, nor have baseline data for such evaluation.
Each project report sets out how robust the evidence is and the strength of the impact evidence.
The project looking at the benefits of sustainable travel to local high streets and town centres also produced a suite of engagement materials for those promoting, campaigning on, designing and delivering sustainable travel measures. The materials can be used when engaging with communities, businesses and local representatives.
They also produced a guide on how to run such engagement processes as part of local planning and development. The materials were based on findings from the study, engagement expertise and tested approaches with potential users.
All three reports set out priority actions and include clear and easy to find recommendations for practical action, making the research relevant and valuable for policymakers in national and local government.
Impact
Findings from the three studies have informed the development of an updated car use reduction route map.
The findings of the study on encouraging sustainable travel behaviour in children and young people in particular, have helped the Scottish Government to plan future work with schools, especially Eco-Schools. Sustainable travel is part of the curriculum of Eco-Schools, which have dedicated sessions on sustainable living and climate mitigation measures – the findings informed the development of these sessions.
“The work on travel behaviour in children and young people was innovative. It has given us the foundation for potential targeted messaging around car use reduction to young people and their families.”
– Bertrand Deiss, Head of Transport Climate Change Strategy & Engagement
Transport Scotland, Scottish Government
The Scottish Government has shared with local authorities the materials produced in engaging with their communities. The study provided them with evidence that interventions to make local streets and town centres more sustainable will bring money to city centres.
Finally, the research into the impact of car parking restrictions can be used in local development plans and local transport strategies to encourage a shift to active travel and public transport.
Taken together, the reports set out a suite of intervention ideas and provide evidence to inform local and national debates on which interventions may be most useful to meet local transport needs.
Related reports
Reducing car use through parking policies: an evidence review
Encouraging sustainable travel in under-18s and their families
The benefits of sustainable travel to local high streets and town centres
Related links
A route map to achieve a 20 per cent reduction in car kilometres by 2030
The Scottish Government’s approach to climate change is underpinned by a commitment to deliver a just transition. The Climate Change Plan 2018-2032 update emphasises that a just transition “puts people, communities and places at the heart of our approach to climate change action.”
The concept of ‘fairness’ is fundamental to delivering a just transition. However, determining what ‘fair’ means in practice, particularly when seeking to deliver a fair distribution of costs and benefits from the transition (i.e. distributive justice), raises complex moral and ethical questions.
This study carried out a programme of deliberative public engagement to inform the design and delivery of Just Transition Plans in the transport, built environment, and land use and agriculture sectors.
Through carefully designed and facilitated deliberative engagement methods, this project gathered well-considered and informed public views on how to ensure distribution of costs and benefits of the transition to net zero is fair for all. The project also gathered views on how specific policy options within the transport, built environment, and land and agriculture sectors could be implemented fairly.
Findings
Participants felt that we all have something to contribute towards the costs of the transition to net zero, including the Scottish Government, businesses and citizens.
They wanted to see an equitable approach, meaning that everyone contributes but not all in the same way or by the same amount. They felt that a fair distribution of costs must take account of different circumstances, including:
- the amount of control someone has over their level of emissions
- the availability of lower carbon alternatives
- their ability to pay.
They also supported a progressive form of taxation to fund some of the changes required across key sectors, with higher income individuals and businesses paying more.
The report sets out specific findings relating to the transport, built environment and construction, and land use and agriculture sectors.
If you require the report in an alternative format, such as a Word document, please contact info@climatexchange.org.uk or 0131 651 4783.
Measuring a just transition
Monitoring and measuring a just transition is important to achieve a fairer, greener future for all, and to ensure the process is a partnership with those impacted by the transition to net zero.
To help the Scottish Government develop it’s just transition monitoring framework further reports summarise approaches to just transition monitoring and evaluation in other jurisdictions, and identify possible baseline variables to include in the framework.
Monitoring and evaluation of a just transition in Scotland – Summary report on international lessons
Proposed just transition baseline variables built environment and construction sector
Proposed just transition baseline variables land use and agriculture sector
Proposed just transition baseline variables energy sector
Proposed just transition baseline variables transport sector
Just Transition Commission: Measuring and Evaluating Success in the Scottish Just Transition
Research completed in May 2024
DOI: http://dx.doi.org/10.7488/era/4964
This work was carried out in accordance with the requirements of the international quality standard for Market Research, ISO 20252
Executive summary
Aims
This study carried out a programme of deliberative public engagement to inform the design and delivery of Just Transition Plans in the transport, built environment and construction, and land use and agriculture sectors.
This report summarises findings from two phases of public engagement that aimed to:
- uncover informed, considered and collective public opinion on the fair distribution of costs and benefits in the transition to net zero emissions in these three key sectors (phase one)
- gather learning into the factors influencing any changes in participants’ attitudes, beliefs or values as a result of engaging in this deliberative process (phase one)
- gather views on how specific policy options within the transport and built environment sectors could be implemented fairly (phase two).
Overall findings and implications
- We all have something to contribute towards the costs of the transition to net zero, including the Scottish Government, businesses and citizens.
- Participants wanted to see an equitable approach, meaning that everyone contributes but not all in the same way or by the same amount. They felt that a fair distribution of costs must take account of different circumstances, including:
- the amount of control someone has over their level of emissions
- the availability of lower carbon alternatives
- their ability to pay.
- Participants supported a progressive form of taxation to fund some of the changes required across key sectors, with higher income individuals and businesses paying more.
- Participants emphasised the need for systems that protect those least able to afford transitions, including exemptions and support for low-income individuals and for those facing health or disability challenges.
- A combination of incentives and disincentives was broadly supported and was considered the most effective way to encourage (and discourage) certain behaviours.
- The timing of any new taxes, charges or penalties was felt to be a key consideration for ensuring a balance between motivating people to change while not unfairly penalising them. A phased, staggered approach was seen as one way of achieving this balance.
- The importance of clear and transparent communication with the public was emphasised. It was agreed that the public should feel part of the decisions that affect them through ongoing public engagement.
Deliberative process and impact on views
- Participants said they had developed and deepened their understanding of the scale and complexity of a just transition to net zero, in this deliberative process.
- Initially, participants thought that those who emit the most should contribute the most. However, upon further deliberation and consideration of the impacts of this on different groups, they had a strong sense that this approach would be unfair if it did not consider those who have more limited control over their emissions (such as some businesses or people living in rural areas).
- The factors that contributed most to participants’ views deepening or shifting were hearing from participants with different backgrounds; learning from experts; engaging with hypothetical scenarios and considering impacts from a range of perspectives; consolidating their views through voicing them in group discussions; and having time to reflect on the issues between sessions.
- Overall, participants valued the opportunity to learn about, discuss and contribute to Scotland’s just transition. They emphasised the importance of ongoing engagement with the public, through these types of engagement.
Key messages for the transport sector
- Achieving a decarbonised transport system will require significant investment in infrastructure across Scotland.
- For any form of Road User Charging to be considered fair, participants concluded that different circumstances and needs should be considered, rather than taking a blanket approach. They felt there should be concessions or exemptions for some groups, including people on low incomes, those with health conditions or disabilities, elderly people, those living in rural communities and those who rely on their car for their livelihoods.
- Participants felt that Road User Charging would be unfair in rural areas unless there was improved access to public transport.
- They also highlighted the importance of allowing sufficient time for people to prepare for any changes being introduced.
Key messages for the built environment sector
- Participants suggested that those who profit from buildings – including businesses in the construction sector and those owning multiple properties – should pay for the changes needed to lower the carbon emissions of those buildings.
- To ensure the heat transition is paid in the fairest way possible:
- There should be support available to all households but the amount of support should vary depending on circumstances, with those on low incomes and those with older properties entitled to the most government funding.
- There should be protections in place, such as exemptions from penalties for vulnerable groups, rent increase caps to protect renters, regulation on the installation of new heating systems and a fair appeals process.
- Other considerations included careful consideration around loans to avoid pushing anyone into financial hardship, reassurances around the efficacy of new heating systems and clear communication with the public about the changes required.
Key messages for the land and agriculture sector
- Participants agreed that the costs of adopting a more climate friendly approach to food should be shared between the Scottish Government, businesses (including farmers but also other businesses along the supply chain such as supermarkets) and consumers. It was also felt that landowners should bear some of the costs.
- Suggestions to ensure a fair transition in the way we produce and consume food:
- Consider people’s ability to pay, with protection in place for low-income consumers.
- Subsidise farms, favouring smaller farms with less income. Support payments should be specifically allocated towards covering the costs of reducing carbon emissions.
- Give farms sufficient time and opportunity to change and reduce emissions before introducing any financial impacts such as additional tax.
- Ensure that consumers have easier access to sustainable food options.
Introduction and method
This report presents the findings from public engagement regarding a just transition to net zero in three key sectors: transport, built environment and construction, and land use and agriculture. The research was carried out by Ipsos on behalf of ClimateXChange and the Scottish Government.
Background to the research
The Scottish Government’s approach to climate change is underpinned by a commitment to deliver a just transition. The Climate Change Plan 2018-2032 update[1] emphasises that a just transition “puts people, communities and places at the heart of our approach to climate change action.” The plan recognises climate change as a human rights issue and the transition to net zero as an opportunity to tackle inequalities.
The Climate Change (Emissions Reduction Targets) (Scotland) Act 2019[2] places statutory obligations on the Scottish Government to develop Climate Change Plans and demonstrate how just transition principles have been taken into account when preparing these.
The 2019 report[3] from the Just Transition Commission outlined recommendations for achieving a just transition to net zero. In its response, the Scottish Government set out its Outcomes, as part of its National Just Transition Planning Framework, and committed to producing Just Transition Plans for high-emitting sectors, sites and regions.[4] The draft Energy plan was published for consultation in January 2023[5]. Plans for transport, built environment and construction, and land use and agriculture are currently in development.
Alongside these policy commitments, the Scottish Government has also emphasised the importance of public engagement in the transition to a net zero and climate ready Scotland. The Climate Change Public Engagement Strategy (Net Zero Nation)[6] sets out the framework for engaging the Scottish public in the transition to net zero, including the objective “people actively participate in shaping just, fair and inclusive policies that promote mitigation of and adaptation to climate change.”
Objectives
Against the policy background outlined above, ClimateXChange and the Scottish Government commissioned a programme of deliberative research to inform the design and delivery of the outstanding Just Transition Plans in transport, built environment and construction, and land use and agriculture. The research initially had two objectives:
- To uncover informed, considered and collective public opinion on the fair distribution of costs and benefits in the transition to net zero emissions in the three key sectors.
- To gather learning into the factors influencing any changes in participants’ attitudes, beliefs or values as a result of engaging in this deliberative process.
As the research progressed, a third objective was introduced:
- To gather views on how specific policy options within the transport and built environment sectors could be implemented fairly.
Ultimately, the research aimed to directly inform the Just Transition Plans and wider work on the transition to net zero across relevant policy areas.
Methodology
Deliberative approach
A deliberative approach was chosen for this research due to the complex and multi-faceted nature of Scotland’s just transition to net zero. Deliberative engagement is about putting people – through informed discussions, involving diverse perspectives, and understanding lived experiences – at the heart of decision making. It differs from other forms of engagement in that it allows those involved to spend time considering and discussing an issue at length before they come to a considered view. Previous research has noted that the complexity of views around climate change means that this topic lends itself well to deliberative forms of engagement.[7]
This deliberative research used a public dialogue approach,[8] a process whereby members of the public interact with experts and policy makers to deliberate on issues relevant to future policy and research decisions. The research was delivered in two phases, each of which are outlined below.
Phase one overview
Phase one brought together a group of 30 people from across Scotland to address the first two objectives (gathering views on a fair distribution of costs and benefits in the transition to net zero emissions, and gathering learning into the factors influencing participants’ attitudes as a result of engaging in a deliberative process). They met online for six workshops held between August and October 2023, each lasting between two to three hours, with the overall aim of answering these overarching questions in relation to each sector:
- As we transition to net zero, who should pay for the changes that will be needed?
- How can we make sure that system of payment is fair?
- How can we make sure that everyone benefits?
An outline of the process and each workshop can be found in the Appendix A.
Online community
Alongside the workshops, an online community helped support ongoing engagement with the participants, facilitating continued discussion and reflection. The online community was hosted on Community Direct (an Ipsos proprietary platform) and discussion was moderated by Ipsos researchers.
Recruitment
The aim was to achieve a sample of at least 30 participants with over-recruitment to account for potential cancellations or drop-outs. In the end, 30 participants started the process and 27 continued to the end.
Participants were recruited by Fieldmouse, a specialist recruitment organisation, who contacted members of their existing panel of potential research participants by telephone. A screening questionnaire was used to capture demographic information about the participants, designed to help ensure the group’s profile was broadly reflective of the Scottish population. Quotas were set on various characteristics (see Appendix B) in line with national population data. However, those living in a remote rural or island area, from an ethnic minority group, with a disability or long-term health condition, or on a lower income were over-sampled to ensure sufficient representation of these groups.
To support and enable participation in the research, and in line with industry standards, each participant was paid £400. Where necessary, training was provided on how to use the technology and access the meeting platform. This allowed Ipsos to enhance the diversity of those taking part. Workshops were also arranged to take place outside of regular office hours to increase participation.
Materials
Discussion guides (Appendix C) and stimulus (Appendix D) were developed by Ipsos and approved by ClimateXChange and the Scottish Government. A range of specialists joined at different points in the dialogue to provide information that would be useful for participants’ learning and deliberation. Presentations were developed by specialist speakers, in consultation with Ipsos, and these presentations were given live during the main plenary sessions. The specialists were available to answer questions from participants in sessions. Presentation recordings were hosted on YouTube and shared via private links for members to watch again in their own time in preparation for subsequent sessions.
Stimulus were used to encourage participants to consider different impacts of the transition. Ipsos developed fictional characters to help participants think about the impact of potential changes on different groups; and fictional future systems of payment to help participants consider what a fair distribution of costs would look like.
Fictional characters used throughout the workshops
Alice is 28. She lives in Dundee in a third-floor flat that she shares with two other friends. Alice works as a nurse in Ninewells Hospital. She works shift patterns, meaning that she often finishes after 10pm. Alice’s income is £28,000 per year.
David and Sarah are married. David is 42and Sarah is 40, and they have two children, Noah (10) and Katie (7). David works as a financial advisor and Sarah works as a website designer. They live in Bearsden, on the outskirts of Glasgow. David and Sarah’s combined income is £105,000 per year.
Lorraine is 60. She lives on a farm in rural Aberdeenshire where she raises cattle and turkeys. Lorraine employs staff who work on the farm and the farm shop. Her son and daughter also work for the business. Lorraine’s income is £55,000 per year.
Maria is 36. She lives in a flat in Moffat with her daughter, Ella (3). Maria has mobility issues and a respiratory condition that sometimes affects her breathing. Maria looks after Ella full time and does not have another job. Maria’s income from benefits is £21,500.
Nadeem is 50. He lives on the Isle of Lewis, about 10 miles from Stornoway. He lives with his son, Ajay (23). Nadeem is a builder and Ajay works in a shop in Stornoway. Nadeem’s income is £45,000 per year and Ajay’s income is £24,000 per year.
Phase two overview
Phase two brought together a group of 20 people from across Scotland to address the third research objective (exploring specific policy options). They met online for three workshops held in March 2024, each lasting between two and three hours. An outline of the structure of each workshop is shown in Appendix A.
Recruitment
The aim was to achieve a sample of at least 15 participants with over-recruitment to account for potential cancellations or drop-outs. In the end, 20 participants started the process and 19 continued to the end.
Participants were recruited by telephone using a screening questionnaire, as per phase one (see Appendix B for quotas and over-sampled groups). Participants were each paid £140 for their participation.
Materials
Discussion guides (Appendix C) and stimulus (Appendix D) were developed by Ipsos and approved by ClimateXChange and the Scottish Government. Presentations given in session one were developed by specialist speakers and Ipsos. Presentation recordings were hosted on YouTube and shared via private links for members to refer back to.
In the remaining workshops, participants focused on two policies; Road User Charging (RUC) and the heat transition in domestic properties. For each policy, they explored two approaches before forming conclusions. Some of the fictional characters from phase one were used to help participants think about the impact of different approaches on a range of groups and to consider trade-offs.
How to read this report
The main body of this report provides a summary of key findings, while appendices 1-3 provide more detailed discussions relating to each sector.
Readers are reminded that the report contains findings from two deliberative processes which were staged in two phases. Phase one’s remit was to consider the broader principle of fairness across three sectors, while phase two’s remit was to consider how specific policies could be implemented fairly within two of those sectors. Findings related to specific phases are highlighted at appropriate points, however, some chapters draw on both to minimise repetition (for instance, in the next chapter, where the starting points for both cohorts were similar).
More broadly, the conclusions set out and discussed in this report are intended to inform the Scottish Government’s development of Just Transition Plans. The report includes verbatim assertions by participants and their understanding of the issues. These are not intended as authoritative statements of fact, but they tell us something valuable about how key issues have been perceived and understood by members of the public.
It should also be noted that, at different points in the dialogue, participants engaged with hypothetical scenarios and policy approaches designed to help participants engage with the issues. They were not necessarily reflective of the Scottish Government’s powers or its intended course of action.
Further, it should be noted that whilst the method of qualitative analysis is systematic and rigorous and the conclusions robust (being based on groups that are reflective of the diversity of the wider public), the analysis does not seek to quantify findings nor does it indicate statistical significance from a representative sample. This report offers a valuable insight into public perspectives on the key questions posed to them after receiving and deliberating on key information relevant to the questions. It will also provide valuable insights for engaging the public on policies which will have a significant impact on their lives.
Participants’ starting point
This chapter outlines the initial views of participants as they began the dialogue. It includes the views of both cohorts (i.e. participants taking part in phase one or phase two) in their respective first workshops, which covered similar content.
Familiarity with key terms
In both phases, participants were generally aware of and familiar with the term “net zero”. When asked to describe what this meant, they used words such as “reducing”, “balancing” or “offsetting our emissions”. Reference was also made to specific behaviours linked with the transition to net zero, such as changing modes of transport, using renewable sources of energy, and eating less meat or dairy. At this early stage there was some concern about the scale of the challenge of reaching net zero, and a desire to learn more about how we get there.
“I recognise it’s something we should work towards but there are so many challenges to cancel out what we are doing. It would take radical changes to people’s lives. I find it hard to work out how on earth we will get there, which is why I really want to listen to the experts.” (Participant, phase 1, workshop 1)
There was also some scepticism about how the term “net zero” was used, with some asking whether it actually translated into real change, and others asking whether the target was long term enough. This reflected fairly high levels of concern about climate change among these participants, and a desire to see action as a result of the dialogue.
Participants were much less familiar with the term “just transition”. Among the few participants who had heard the term, they understood it to mean the sharing of responsibility for the transition to net zero, while protecting groups such as those in rural areas and those struggling financially. Others spoke of it specifically in terms of jobs, and the aim of protecting people who worked in traditional fossil fuel industries that may become obsolete (using the example of oil workers in Aberdeen). Overall, a just transition was seen as challenging and questions were raised such as “is it achievable?” and “who can be trusted to take the lead on this?”
Participants expressed a general interest and concern in the topic of climate change and hoped to learn more about the policy developments, explore how they as individuals could act to help tackle climate change, and to both hear from others’ perspectives and feel that the Scottish Government is listening to their views.
“There’s such a lot of different opinions, and living in a rural area we might have different opinions to those in a town or city. I wanted to find out more and join in.” (Participant, phase 2, workshop 1)
Reactions to the first presentations
In the first workshop of phase one, participants learned about key concepts that would help them in later deliberations. They heard three presentations which covered: Scotland’s current approach to net zero targets; the principle of a just transition and the work of the Just Transition Commission; and the Scottish Government’s Just Transition Plans for the three key sectors.[9] Phase two participants heard similar introductory presentations, but the second one focussed on the Scottish Government’s Just Transition Plans for the three key sectors; and the third one on wider public engagement on Scotland’s just transition.
As well as generating a number of questions (which were responded to by expert presenters) the presentations highlighted some broader issues of importance for participants. Some emphasised their concern about the scale of change required to reach net zero and how challenging it will be to change attitudes and behaviours. Others felt that achieving a just transition would be very difficult due to the range of different circumstances to be taken into consideration, particularly the differences between urban and rural areas.
“It’s a huge undertaking. I don’t think we can accommodate for every single person in the country not to be left behind.” (Participant, phase 1, workshop 1)
Some felt reassured by the existence of the Just Transition Commission and the Scottish Government’s Just Transition Plans, but there was also a lack of clarity for others around the measures that would be put in place to ensure a just transition. There was therefore a broad interest in understanding more about what these would mean in practice.
“We’ve heard all of this before. I want some of this to get put into practice. I haven’t seen anything […] We talk about emissions and everything but nothing has been put into practice to say “we start from here”. We don’t even know where the money is coming from. The transition part is expensive for ordinary households.” (Participant, phase 2, workshop 1)
In phase two there was some scepticism among participants about the Scottish Government’s ability to implement changes fairly (based on perceptions of how LEZs in Glasgow and Aberdeen had been introduced). Given the focus on phase two on specific policies in the transport and built environment sectors, there were also concerns raised about the high upfront costs of switching to EVs or making home energy improvements (based on participants’ own experiences). Participants wanted to see more evidence of the efficacy of low carbon technologies before they would be willing to spend money on them.
Overall, participants generally found the information in the presentations useful and informative. They stressed the importance of the wider public being made aware of Scotland’s net zero targets and the scale of changes required to meet them – the types of information that participants had just heard.
“We need to make sure that people in this country know how [the transition] is going to affect them. You need to give real examples, concrete examples of what is going on in Scotland.” (Participant, phase 1, workshop 1)
Early thoughts on fairness
At the end of the first workshops (in both phase one and two), participants shared their reflections on what a just transition to net zero would mean. Their responses highlighted that, despite a lack of familiarity with the term, participants were engaging with some of the principles that underpin a just transition. These early themes included the following:
- Costs should be distributed. Participants felt there should be some form of shared responsibility. There was a broad sense that everyone should contribute something, but it was also highlighted that these contributions would not be equal (as people would not be starting from equal positions). It was also felt that some individual actions would need to be supported by systemic changes.
- Different needs and circumstances should be taken into consideration. In particular, fairness was linked to acknowledging people’s different financial circumstances and ability to afford the changes that might be expected of them. It was also linked to understanding the differences between urban and rural communities in relation to access to transport infrastructure.
- Awareness-raising and public engagement are important to help people to understand why change is needed and what changes we can all make. It was stressed that consultation and engagement should focus on those who are most likely to be affected by the transition.
- The transition should not result in further inequality and could even be an opportunity to tackle existing poverty and inequality. Particularly among participants in phase one, there was an aspiration that the transition to net zero should not results in the loss of jobs or communities.
These early themes were revisited and developed further by participants in the remaining workshops, as they learned about specific sectors, deliberated on a fair distribution of costs and benefits, and (in phase two) considered different policy options.
Principles of fairness across sectors
In phase one, individual sectors were covered in three separate workshops on transport, built environment and construction, and land use and agriculture. In these workshops participants heard presentations which outlined some of the changes that may be needed in the sector.
Participants were presented with a vision for the sector in 2040 based on the Scottish Government’s discussion papers and explored this in the context of different fictional characters and how they might be impacted. The visions for each sector outlined changes such as:
- Transport – private cars produce fewer emissions; alternatives to private cars (e.g. public transport, car sharing etc) are readily available; there are measures to discourage car use (e.g. road charges); and new transport jobs have been created.
- Built environment and construction – buildings are more energy efficient; places are designed and used differently (e.g. to cope with extreme weather, or reduce flood risk); the construction sector is more sustainable, using more locally sourced and natural supplies; and new construction jobs have been created.
- Land use and agriculture – land is used differently, with less dedicated to food production and more to planting trees, peatland restoration and supporting biodiversity; people are encouraged to consider the climate impacts of food and waste less food; and land and agriculture based jobs have changed.
Using these examples, and based on their own lived experiences, participants answered these questions for each sector:
- As we transition to net zero, who should pay for the changes that will be needed?
- How can we make sure that system of payment is fair?
- How can we make sure that everyone benefits?
- Answers to those questions were developed in detail in the final workshop and are outlined in the conclusions to phase one. Five common, cross-cutting themes emerged across sectors that are summarised below.
Cross-cutting themes
Support for those most impacted by the transition
Having heard about the potential changes that may be required to reach net zero in each sector, participants identified certain groups that were likely to be impacted more than others. It was felt that these groups would require support so that they did not experience financial or other types of disadvantage as a result of the transition. These groups were:
- Individuals and businesses in rural communities. Across all sectors, it was felt that rural areas would face specific challenges in meeting the aspirations outlined in the sectoral visions. These barriers included: a greater reliance on cars and a lack of public transport infrastructure; high costs of upgrading heating systems due to older, less energy efficient properties; and less easy access to sustainable food options in shops. It was felt that these types of barriers should be accounted for in the planning for the transition.
- People who are unable to afford to make changes. Having heard about the potential changes needed in all three sectors, participants felt that these were likely to be expensive. There was particular concern about the impact of those costs on people who would already be considered financially vulnerable, including those on lower incomes and those struggling with the cost of living. This concern carried through to participants’ later views on fair systems of payment, and the importance of considering an individual’s ability to pay.
- Businesses unable to afford to make changes. Smaller businesses, including small farms, were viewed as being more financially vulnerable and less likely than larger companies to be able to cover costs of the transition.
- People working in jobs most likely to be impacted by the transition. This included: farmers who may be required to change the way they use land and produce food; those who drive for a living who may be impacted by the move to a decarbonised transport system; and the construction sector, who would need to reskill people to retrofit or build new energy efficient buildings.
Shared responsibility for paying for the transition
A theme throughout the sector-focussed workshops was that we all have something to contribute. When discussing each sector, it was felt that the costs of transitioning to net zero should be shared among the Scottish Government, businesses and citizens:
- The Scottish Government should fund infrastructure that helps the public to make lower carbon choices (e.g. funding EV charging infrastructure, free public transport) and provide grants or loans to help people with upfront costs such as replacing heating systems. This support was seen as essential to help those who would not be able to afford these changes. It was also felt that the Government should continue to subsidise farmers, as without these subsidies farms may not survive.
- Businesses should pay for making changes, particularly if they are going to benefit financially. This was seen as particularly the case for the construction sector and parts of the transport industry, but also extended to farmers and the wider food supply chain. The overriding theme was that profit-making businesses would both have the ability to pay (because they could afford to) and a responsibility to pay (if they would benefit from the changes).
- Citizens. It was felt that the public bears some responsibility to pay for changes to our homes, our forms of transport, and the food we consume. It was also agreed that those continuing to make high carbon choices should bear the cost of those choices. However, there were a number of important conditions to this, including the affordability of the changes, and the extent to which someone has alternative choices available to them. These conditions, and how they would be accounted for, were explored in more detail in later workshops.
There were also some specific groups identified as being responsible for changes within individual sectors, including landlords and property owners who it was felt should be responsible for making properties more energy efficient or transitioning to clean heating systems; and landowners who participants suggested should be taxed to help pay for some of the changes to land use needed.
No ‘one size fits all’ approach
Reflecting the points above, it was felt that different approaches would be needed to accommodate the circumstances of and likely impacts on different groups. Across the sectors, the following characteristics were seen as important to bear in mind:
- The extent to which there are options available to support low carbon choices. For example, if there is a lack of public transport options (as in rural areas) or if the use of EVs is not practically feasible, then it would be unfair if people in those areas had to pay to fund EV or public transport infrastructure.
- The ability to pay, so that those on lower incomes are not further disadvantaged by having to pay for changes they are unable to afford. This extended to businesses, as it was felt that farmers, small businesses, and those struggling financially should be provided with support towards making changes.
- Having needs that may impact on behaviours, such as having a disability or health conditions that requires use of a car.
In these sector-focussed workshops, there were mixed views on the extent to which systems of payment should be based on levels of emissions. On the one hand, there was a view that individuals who continue to drive high emitting vehicles or property owners who had neglected to make the necessary changes should be obliged to pay more. On the other hand, it was felt that higher emitters may not have a viable alternative, either because of where they live (i.e. those in rural areas may have no alternative to cars) or because of income (i.e. being unable to afford an EV or to make energy efficiency improvements in their homes).
These views on fair systems of payment were explored in more detail, using hypothetical scenarios, in the penultimate workshop.
Acceptance of the possibility of taxation
- Before they had explored potential systems of payment in detail, participants had already discussed the possibility of taxation to support the costs of the transition. While there was an expectation that the Scottish Government would contribute towards the costs (as noted above), it was also acknowledged that those costs paid could end up being borne by the individual anyway through taxation. A progressive tax was supported in principle, based on both ability to pay and ability to choose, but participants did not discuss (at this stage) the details of how that would be implemented.
- Some participants felt that payments should be covered by a tax on larger, profit-making businesses, particularly whose practices are not climate-friendly (e.g. those who import food from overseas). At the same time, there was recognition that penalising businesses too harshly could force them to leave Scotland which would risk jobs and move carbon emissions elsewhere. There was some support for a “food miles tax” or other form of high carbon products tax, but only if other more sustainable food options were available and affordable.
Need for education and time
When reflecting on the likely changes in each sector, participants felt there was need for further education, engagement, and public consultations around the transition. They felt that the necessity and benefits of transitioning to net zero should be clearly communicated to all citizens.
It was also stressed that people and businesses would need sufficient time to adapt to the changes required for the transition to net zero, and that this would require advance notice of regulations, taxes or other charges, or incentives.
How our fictional characters fared across all sectors
When reviewing the impacts of the transition on our fictional characters, participants highlighted many of the points raised above, particularly the importance of taking into account factors such as location (whether they lived in urban or rural areas), ability to choose, tenure, income, occupation and other lifestyle factors.
Who benefits from changes?
Alice benefits from improvements to public transport which she could use to go to work in Dundee, rather than relying on her petrol car. However, it was pointed out that more regular buses would not necessarily make her feel any safer travelling to work at certain times (one of the main reasons she avoided using public transport). It was felt that Alice would also benefit from improved energy efficiency in her rented flat, provided upgrades were carried out by her landlord and that additional costs associated with this were not passed on to her. She would also benefit if she was able to afford a high-quality new build in future (as she was hoping to buy a property).
An improved public transport system would benefit Maria, who did not drive. This would mean she would be less reliant on taxis, saving her money. As a tenant (in a flat with an EPC rating of C), she might also benefit if the housing association made her home more energy efficient and if appropriate measures were introduced to reduce the risk of flooding to her property (her ground floor flat was located in a flood risk area).
Nadeem (a builder) could benefit from an increase in demand in the construction sector and from training opportunities available on new construction techniques, provided these are accessible to him and his staff.
David and Sarah would benefit from the move to a more sustainable food system because their lifestyle choices were already in line with this vision (as they largely bought locally produced food, and were on the waiting list for an allotment), and they could afford to make further changes or absorb increased costs.
Who might be negatively impacted?
Lorraine would be negatively impacted across all sectors. As a farmer, she may be required to change her use of transport but have limited low carbon alternatives for agricultural vehicles and personal car use (based on the view that the sort of rural area where she lives is unlikely to have the level of integrated transport needed). It was also noted that her property would likely require a lot of work to make it more energy efficient, which she may not be able to afford. Lorraine’s livelihood was also identified as at risk given the challenges of diversifying land use and the need to increase prices to cover the cost of making those changes. Her age was noted as a factor in that she may not have time to benefit before she retires.
It was felt that Nadeem would be negatively impacted because of his reliance on a van for his work and the fact that he lives and works on the Isle of Lewis. Based on the assumption that public transport would not be a viable alternative, it was considered unfair that his earnings would be affected by road charges. Nadeem and Ajay (both vegan) may lose out if a focus on local food products means they have less choice in their diet. This could be exacerbated by additional challenges transporting goods to where they live. Ajay’s job in a food shop might be at risk if it is adversely affected by increased prices.
It was felt that Alice may see her rent increased to cover the costs of making her home more energy efficient. This would affect her ability to save for a new property, especially if very high energy efficiency standards led to increased costs for new builds. Alice and Maria were both identified as at risk of losing out if food prices increase because of their concern about the current cost of groceries. They may also struggle to access local produce; Maria because of her child care requirements, and Alice because of her shift patterns.
Although David and Sarah would have to adapt their lifestyle in relation to transport (e.g. they would likely have to reduce their use of two cars) it was felt they would be able to adapt and absorb the costs with their income. However, it was recognised that there would need to be some flexibility or exemptions given for their use of the car when travelling with their disabled son.
Fair systems of payment in practice
In the penultimate workshop participants explored what a fair system of payment might look like across all three sectors. Hypothetical scenarios were created and used as a way of testing participants’ views of fairness. These were based on information provided in the workshop presentations and ideas raised by the participants themselves during breakout discussions, and were not necessarily reflective of the Scottish Government’s powers or its intended course of action. It should also be noted that participants’ interpretations of the scenarios should not be read as authoritative statements of fact, but rather reflect how key issues were perceived and understood.
Hypothetical scenario 1: Those who earn the most pay the most
In this scenario, costs would be covered through a progressive form of “net zero” tax applied to people in Scotland earning over a certain amount (see figure 4.1).
Figure 4.1. Scenario 1: those who earn the most pay the most

What appealed?
There was broad support for the idea of providing free public transport for those on low incomes, given the strong view that this group should be protected as we transition to net zero. However one participant raised the possibility that people on low incomes might already use public transport more than other groups, so felt that incentivising public transport use among those on higher incomes might have more impact.
Providing grants for purchasing EVs was also an appealing aspect of the scenario, as it too would benefit those on lower incomes. However, it was felt that this policy could be more targeted in areas where public transport was not as available, such as rural areas.
“Why would you give a grant to someone on a low income to buy a car in Glasgow or Edinburgh? People in rural areas don’t have a choice, they have to have a car. Giving them a grant could be a really useful thing, to make sure they’re able to get about.” (Participant, workshop 5)
What were the concerns?
Participants felt that middle income earners would potentially lose out under this hypothetical scenario if they would not qualify for grants or free public transport, but would still struggle to afford an EV or to make significant changes to their home.
“It’s a bit vague, ‘low income’ versus ‘high income’. Those on a middle income fall between the cracks, and they can’t afford an electric vehicle or to make the home improvements.” (Participant, workshop 5)
This fed into broader discussions around income, and participants felt that this would not necessarily correlate to ability to pay. Some reflected on their own situations as they considered the scenario, sharing that they had wanted to improve the energy efficiency of their homes but were unable to afford the changes.
There was broad agreement that it would be unfair to fine people, especially those less well off, if they could not afford to upgrade their home. It was therefore felt that a more nuanced consideration of financial ability would need to be considered. Participants were supportive of the suggestion of a progressive “net zero tax”, using small income bands to avoid stark increases in taxation and ease the impact on households.
Participants were aware of potential unintended negative consequences of this scenario. For instance, if landlords struggled to afford the changes they might choose to sell which could impact rental supply and lead to rent increases. There was some debate around whether all landlords should be ineligible for grants, or whether there should be scope for smaller landlords (i.e. with fewer properties) to be eligible, similar to the support offered to smaller farms in this scenario. However, no firm conclusions were reached on this.
As highlighted in the transport workshop, participants remained concerned that a lack of EV charging infrastructure in rural areas would mean rural and island communities missing out.
How our fictional characters fared in scenario 1
Who benefits?
Participants felt that Maria would benefit from free public transport, while Alice could use a grant to switch her petrol car to an EV.
Who might be negatively impacted?
Lorraine was considered to be a middle income earner who could miss out on financial support. Participants felt that she would be “hammered” under this scenario, given her home has an EPC rating of D and she may not be able to afford the necessary changes to bring it up to an energy efficient rating. With the requirements to reduce emissions on her farm as well, it was felt Lorraine would be negatively impacted in several ways.
David and Sarah (owners of a rental property) were also identified as potentially being impacted through the net zero tax and requirements to change EPC ratings in rental properties, but being ineligible for grants. Although it was felt that they could and should pay a higher share based on their income, seeing the various ways in which they would be charged under this scenario, while caring for a disabled son, gave participants a more nuanced perspective which reinforced the view that income alone does not necessarily equate to affordability.
A fair distribution of costs
Participants felt the ‘Those who earn the most pay the most’ scenario could be fair in theory, but in practice would depend on how it was funded; how much time would be given to prepare for the changes; the infrastructure that would be put in place; and how “low income” would be defined. Participants reiterated the view that personal circumstances would need to be taken into account.
Participants also identified a need for awareness raising to ensure fairness in this scenario. They felt that individuals would need to be given guidance on what changes they needed to make and what support would be available for them, recognising that not everyone knows what their home’s EPC rating is.
A key caveat to the discussions was that the role of industry must also be considered alongside public behaviour change and cost-bearing. This was prompted by the risk of food prices increasing as farmers pass costs on to consumers, which would add to the financial burdens already placed on individuals.
“Things are constantly going up, then with this added cost and figuring out if you pay for costs of your home being energy efficient, it seems a difficult and expensive thing to be going through and I’m not sure how this will be managed.” (Participant, workshop 5)
Food price increases were felt to be somewhat inevitable when discussed in the land and agriculture workshop, but in the context of these scenarios were considered to be unfair, especially if big corporations were not doing their bit. It was suggested that “middle businesses” in the supply chain (such as supermarkets) could absorb more of the costs to minimise the impact on farmers or consumers.
Hypothetical scenario 2: Those who emit the most pay the most
Scenario 2 focused on a system of payment whereby those who emit the most pay the most. Costs would be covered through taxing higher emitting industries and other charges for people who contribute the most emissions (see figure 4.2).
Figure 4.2. Scenario 2: those who emit the most pay the most

What appealed?
There were fewer aspects of this scenario that appealed compared to the others. The tax on high carbon food was identified by some as an effective way to encourage people to change their eating habits. Those who were in favour felt that products like meat becoming a ‘luxury’ would make them be more frugal and cut back on certain foods.
“It might encourage me to think more carefully about what I’m buying, maybe being a bit more frugal in terms of what’s used. I see that as a good thing. I’d be quite happy with less choice in some ways because I feel we’ve got way too much choice now.” (Participant, workshop 5)
However, the high carbon food tax was also criticised for making certain food products unaffordable, which was not considered fair. For some, this was based on the view that meat and dairy products were part of a nutritional diet and should not become a luxury. For others, it was about understanding the demands on peoples’ time and ability to pay for fresh, seasonal produce.
“People don’t buy rubbish food because they love it, sometimes it’s because they don’t have the choice […] I love spending too much money in Real Foods, but not everyone has the ability to do that. It’s making sure we’re not leaving people behind. The affordable choice should be for the environment and the health of the people.” (Participant, workshop 5)
What were the concerns?
The main concern around the ‘Those who emit the most pay the most’ scenario was that some people and businesses were higher emitters due to circumstances outside their control. This echoed a strong theme, which emerged early in the dialogue, that people without low carbon alternatives available to them should not be penalised. The construction and farming industries were highlighted as examples where the costs of decarbonisation could be prohibitive and threaten livelihoods. It was also felt that costs could be passed onto consumers, meaning that it would not just be high emitters who would pay the most.
Participants also expressed concern for homeowners and questioned the cost, feasibility and fairness of requiring homeowners to bring their homes to an EPC rating of C by 2033.
“I think the timescale is an important factor here. At the moment, it’s 10 years away. By the time this is made law, it’s probably only going to be 7 years away. It’s what ability is there to do changes in the 7 years.” (Participant, workshop 5)
It was felt that EVs would not be feasible for those living in rural areas, so they would be subject to road user charging despite having no viable alternative. There was some criticism of LEZs in particular, which were seen to have been unfairly implemented in some areas.
“At Keith [in Moray] they were going to create a LEZ but anyone coming from Shetland, if they needed a car, that’d be taxed by the emissions zone [so] they don’t have a choice.” (Participant, workshop 5)
How our fictional characters fared in scenario 2
Who might be negatively impacted?
Nadeem’s livelihood as a builder was felt to be at risk given the additional costs to his business, such as road user charges (if he was not able to switch to an EV) and paying penalties (if he was not able to reduce emissions). Similarly, it was felt Lorraine’s farm would be penalised and her business would be vulnerable if she could not easily change the use of her land.
Who benefits?
Participants felt that the characters living or working in cities, including Alice, Maria and David and Sarah, would benefit from the LEZs due to cleaner air. Given Nadeem and Ajay are both vegan, it was also felt that they would not be penalised for buying high carbon produce such as meat; “lack of penalty is kind of a benefit”.
A fair distribution of costs
Participants consistently felt an emissions-based approach would be unfair:
“I think it’s penalising. There isn’t a lot of incentives there. It’s very directive, ‘You will do this or you will get fined.’ There isn’t a lot of, ‘We are supporting you’. It’s not a kind system […] It’s very harsh.” (Participant, workshop 5)
They felt this system of payment would need a nuanced approach, recognising that some people and businesses have more limited control over their emissions than others, and they would be unfairly penalised if these differences were not considered.
For the introduction of LEZs to be considered fair, improvements to the public transport infrastructure were considered to be a prerequisite.
“There needs to be reliable, good quality transport. And we should start from that. If we start with installing Low Emission Zones, before we improve public transport, it will make people very hostile towards the idea. (Participant, workshop 5)
Additionally, participants felt that there needed to be more of a balance between penalties and incentivisation to help facilitate low carbon choices. Awareness-raising, education and engagement was felt to be an important part of helping people transition, otherwise:
“You are going to disengage and alienate the population and any change becomes a bigger challenge, dramatically. This is going to affect every single part of life.” (Participant, workshop 5)
Hypothetical scenario 3: Incentives for making low carbon choices
Scenario 3 focused on a system of payment where there are incentives for making low carbon choices. Costs would be covered through general increased taxation and through profits generated from certain businesses benefitting financially from the transition (see figure 4.3).
Figure 4.3. Scenario 3: there are incentives for making low carbon choices

What appealed?
Participants were initially drawn to the supportive nature of this scenario, with its emphasis on incentivisation. The provision of subsidised public transport was widely supported.
“If you’re told you’ll get a bit of help, it’s more positive and people will more likely want to carry out and make these differences, but if they have to pay for it and take care of a family, they won’t want to do it. Incentives are always a good thing.” (Participant, workshop 5)
Prioritising high emitting homes for grants and retrofitting schemes were deemed sensible and effective ways of bringing emissions down quickly. Participants living in higher emitting homes said they would appreciate the support to make improvements. Those who rented were more sceptical about this, as they worried that rent prices would be increased by landlords to make the changes, even if they were receiving grants.
While there was a preference for incentives over penalties, there was a view that “there will always be people who can’t be bothered” to change. Participants also highlighted a risk that money could be wasted if it does not target those who need it most. For example, some questioned whether everyone should be eligible for an EV grant or only made available to those who would be unable to afford one without support.
“The bits about grants for all electric vehicles, some people will be able to afford them so they won’t need them. That money could be used for something else.” (Participant, workshop 5)
What were the concerns?
Despite initial positivity towards the ‘Incentives for making low carbon choices’ scenario, concerns grew over how the various financial supports would be paid for and how effective a system based on incentives would be for reaching net zero targets. The idea of general increased taxation was a less appealing aspect of this scenario, as it was felt that this would ultimately result in everyone paying more, and would place an unreasonable burden on people in the context of a cost of living crisis:
“I think we’ve reached a point where we’re all groaning from increase in taxation and cost of living.” (Participant, workshop 5)
Specifically, and echoing earlier findings, middle income earners were identified as a group who were more likely to bear the brunt of general taxation but not see the benefits through grants and subsidies.
“When you talk about general increases in taxation it’s always the middle income owners hardest hit. They earn more so they pay more tax, they then never get the benefits available. They may be £1 over the cut off but they are taxed higher and get no benefits.” (Participant, workshop 5)
How our characters fared in scenario 3
Who benefits?
Participants felt that David and Sarah and Lorraine would benefit as their low EPC-rated properties (David and Sarah’s rental property was D, Lorraine’s home was E) would be prioritised for retrofitting schemes and grants. Profit-sharing for reskilling initiatives were seen to be beneficial for Lorraine too, as well as for Nadeem and his employees.
A fair distribution of costs
While the use of incentives was seen as a kinder approach than penalties, it did not necessarily follow that this system of payment would be fairer. As highlighted above, participants raised concerns about a general taxation putting pressure on some groups, while open incentivisation might mean grants and subsidies were taken up by those who were better off rather than those with the greatest need. Participants therefore felt that a fair distribution of costs under this system would mean more targeted support through grants and subsidies, in combination with a general taxation. The availability of grants and subsidies would also need to be widely publicised and not administered on a first-come-first-served basis to minimise the risk of people losing out.
“Limiting the cash benefits to any group or individual is the key thing, because this is too open-ended.” (Participant, workshop 5)
As with other systems of payment, it was perceived that the current infrastructure – particularly for public transport and EV charging – was too “fragmented”. It was strongly felt that these issues would need to be addressed first, to ensure people were able to make low carbon choices.
This highlighted the importance of timing and sequencing for a just transition to net zero. The system of payment based on incentives was initially more appealing, but it was also felt that some charges might be necessary once people have had time and encouragement to make the necessary changes.
“On the road to net zero it will probably not be fair to charge based on emissions before we reach the points at which changes SHOULD have been made… Emissions charging should be the “stick” coupled with the “carrot” of a really rigorous and case specific package of support to enable homeowners to make the necessary changes.” (Participant, online community)
Summary on systems of payment
These hypothetical systems of payment highlighted the range of complexities inherent in the different approaches to distributing the costs of the transition. Participants were not asked to choose any one scenario over another, but instead discussed how each scenario might impact different groups and raised key considerations for making these approaches as fair as possible. Their key points are summarised in the following table:
Exploring policies
In phase two of the research, a new group of 20 people from across Scotland were convened to learn about and deliberate on potential policy options within two of the key sectors that were focused on in phase one; transport and the built environment. The two policy options were:
- Approaches to Road User Charging (RUC), involving a charge on car usage based either on distance driven or on a defined geographic area.
- Approaches to funding the transition of domestic properties away from gas or oil-based heating systems to clean heating systems (such as heat pumps or district heat networks).
Picking up where the first cohort left off, they considered the benefits and challenges of these policy options, before providing conclusions on how they should be implemented fairly.
Road User Charging
Views on Road User Charging are explored in more detail in the transport chapter. A summary of the key findings is presented here where participants were shown two possible options to road user charging, presented in the following table:
|
Option 1 – UK national road pricing |
Option 2 – Urban local road user charging |
|
|
Views on option 1: UK national road pricing
UK national road pricing was introduced as a possible approach to RUC that would cover all of Scotland’s roads and involve a charge on drivers based on distance driven.
A perceived general benefit of this form of RUC was that those who drove for convenience might be encouraged to choose public transport instead. In turn, the reduced traffic would improve air quality and bring health benefits. That funds raised would be invested in improvements to public transport was widely welcomed, and it was agreed that rural areas should be prioritised for funding, as public transport was considered to be less available and accessible in these areas.
“A good thing about it is that the money raised is put towards public transport. If the money is invested into rural areas, that’d be really good. That’s where the money should go because they need transport.” (Participant, phase 2, workshop 2)
The challenges participants were keen to ensure were considered and addressed included:
- Taking different circumstances into account: It was felt that some groups would be unfairly impacted as their access to alternative options would be limited (e.g. those who rely on their car because of a disability or health condition, those who have to drive long distances for work, or those who live in rural areas where public transport alternatives are not available). It was agreed that exemptions or permits would need to be in place for these groups and these should be clearly communicated:
- “It would be unfair for those that live in rural areas to pay the same when they don’t have a choice in transport.” (Participant, phase 2, workshop 2)
- Balancing incentives and disincentives: It was surprising to some that EVs were not exempt. There were mixed views on the fairness of this which hinged on the risk of discouraging people from switching to lower carbon alternatives versus the overall objective of reducing distances travelled by car. It was therefore suggested that EVs should not be charged as much as petrol/diesel cars to incentivise lower carbon choices.
- How the charge is paid: It was not considered fair to present drivers with an annual one-off charge, as this could come as a shock and be difficult to pay in one go. Instead, it was suggested that the costs should be spread out. It was also felt that consideration should be given to when the charge is applied (with a suggestion for it to be lower or lifted during the night to ensure those travelling for night shifts are not restricted).
Views on option 2: urban local road user charging
Urban local road user charging was introduced as another possible approach to RUC that would involve a charge to drive into specific parts of an urban area.
The benefits highlighted were similar to those raised in response to option 1 (cleaner air and improved public transport infrastructure). For some, this option was considered to be fairer than national road pricing because it was assumed it would be implemented in areas with readily available public transport alternatives.
“This one is targeting particular areas and not all journeys. You’re given an option to use your car or public transport to get into the city.” (Participant, phase 2, workshop 2)
There were still challenges that participants raised in relation to this approach, including:
- How those who living and working within the charging zone would be treated: It was agreed that exemptions would need to be made for such groups.
- Considering the differences between types of urban areas: Inverness, for instance, was felt to be a different type of urban area to Glasgow or Edinburgh, as it served as a connecting transport hub for those in rural areas.
- Ensuring access to alternatives: It was felt that adequate public transport infrastructure would need to be in place before RUC was introduced to an area.
Funding the heat transition in domestic properties
Views on the heat transition in domestic properties are explored in more detail in the built environment and construction sector. A summary of the key findings is presented here, where participants were shown two possible options to funding the heat transition, detailed in the following table:
|
Option 1 – widely available public funding, stricter penalties |
Option 2 – targeted public funding, softer penalties |
|
|
Views on option 1: widely available public funding
Participants considered a scenario in which Scottish Government grants and loans would be available to all households to improve energy efficiency and install a clean heating system. In this scenario, there would be penalties for non-compliance by the deadlines set out.
As well as considering the general benefits of the clean heat transition (such as the need to use less energy to warm homes, and reduced emissions), participants also felt that the combination of widely available funding and strict penalties would encourage people to make the changes. The presence of exemptions for certain groups, protections for renters, and an appeals process were all welcomed.
Participants also highlighted a number of challenges:
- The 2028 deadline for landlords making home energy improvements was felt to be too close and not enough notice. There were also concerns raised that landlords would choose to sell rather than make the required changes, which would mean fewer homes available to rent.
- Conversely, the 2045 deadline for clean heating systems to be installed was considered to be too far away and raised concerns that people would not be motivated to act quickly enough.
- The availability of funding to all households drew mixed views:
- On the one hand, it was not considered fair to fund households that could afford to pay for changes, while others unable to afford the changes may not receive enough to cover their costs:
- “If you’re really rich, you can pay for it, why should you get a grant for it?” (Participant, phase 2, workshop 2)
- On the other hand, it was considered fair that all households receive some support since the changes were being required of them:
- “I think it would be fair to give grants to all households because they’re enforcing it. If they want people to do it, they’ll need an incentive.” (Participant, phase 2, workshop 2)
In drawing conclusions, there was general agreement that while there should be support available to all households, this should vary depending on circumstances (with those on lower incomes and those with older properties being entitled to the most government funding).
- There was some discomfort around the idea of people taking out loans to cover any remaining costs, particularly for those seeking to avoid debt or already struggling with existing financial commitments.
- While welcomed, there were concerns that that an appeals process could be difficult and stressful which would be off-putting to some.
- Building trust in the efficacy of the clean heating systems was felt to be a necessary pre-requisite to people installing them in their homes, and participants expressed a desire to see evidence of this:
- “More trials, more comparisons and more information. I think if people have that then more people are going to go, ‘We see where you’re coming from, we understand and can get behind it.’” (Participant, phase 2, workshop 2)
Views on option 2: targeted public funding
Participants considered another scenario in which Scottish Government grants and loans would be available to households on lower incomes to improve energy efficiency and install a clean heating system (but not to higher income households, landlords or owners of second properties). In this scenario, there would be penalties for non-compliance on energy efficiency improvements, but penalties for not installing a clean heating system by 2045 would not be enforced straight away.
The flexibility in when and how penalties would be applied was welcomed in this scenario. While there were concerns raised initially about landlords being able to increase rent (as in option 1), it was also recognised that there could be a positive impact for tenants if the properties energy efficiency is improved, leading to better living conditions and cheaper energy bills. It was agreed that a rent cap would be important to protect tenants from sharp rent increases.
Similar challenges identified with a targeted funding approach as were raised in relation to widely available funding, which included concerns around the deadlines (2028 being too near and 2045 being too far), the push towards loans, and the need for clear and comprehensive communications to raise awareness of the changes that people would be required to make.
Other challenges identified with this approach to funding the clean heating transition included:
- A lack of clarity around the penalties, with some being enforced as soon as the deadline expires and others not being enforced right away. This was felt to be problematic and an ineffective way of encouraging people to act:
- “If you say you’ve got to do something by 2045 but there are no consequences for not doing it by 2045 [..] do they really have to do it?” (Participant, phase 2, workshop 3)
- The targeted nature of funding drew mixed views. For some it was felt to be fairer as financial support would be offered to those who need it most, while others felt that targeted funding would result in those just over the qualifying threshold being put under financial pressure. There were also concerns that targeted funding would limit the effectiveness of the policy, with those not eligible being less inclined to act.
- There was a strong view against private financing, which was underpinned by a perception that private sector organisations were motivated solely by profit. If loans were to be offered, it was felt that these should be administered by Scottish Government:
- “I don’t think private sector should offer loans in the first place. The government wants you to do this so they should offer the loan themselves or provide the grant.” (Participant, phase 2, workshop 3)
- As well as providing communications around the efficacy of clean heating systems, participants also felt there should be clear advice on the running costs after installation and reassurance that these would be long-term solutions.
Conclusions
This chapter brings together conclusions from across both phases of the research. Conclusions were reached as participants drew on what they had learned over the course of the dialogue:
In phase one, conclusions were developed iteratively by participants over the course of the dialogue, but were developed in detail in the final workshop and focused on answering the over-arching questions:
- As we transition to net zero, who should pay for the changes that will be needed?
- How do we make that system of payment fair?
- How can we make sure that everyone benefits?
In phase two, conclusions were reached at the end of each sector-focused workshop and concentrated on the fair implementation of Road User Charging, and the funding of the heat transition in domestic properties.
Conclusions have been written using the participants own words as much as possible. Where any edits to wording were made by Ipsos, this was to correct repetition or duplication, or to reorder points into a more logical flow.
As we transition to net zero, who should pay for the changes that will be needed?
The overarching message was that we all have something to contribute. Specific contributions from three broad groups were identified:
Government
The Scottish Government should fund (in an efficient and timely manner):
- Public charging infrastructure for electric vehicles.
- An integrated, accessible, and reliable public transport system.
- Grants and interest-free loans for retrofitting existing homes (available to homeowners and long-term tenants) and purchasing electric vehicles.
- Subsidies and research grants for farmers and other small businesses. This should include support towards the cost of changing land use, encouraging development of lower carbon materials or produce, and reskilling and training initiatives.
- Education and awareness raising programmes.
- Research into low-carbon technologies (e.g. wave power).
- An apolitical body to provide the lead in scientific and evidence-based practice.
- As well as the Scottish Government, local authorities and other public sector bodies also have a big part to play and should cover some of the costs.
Business
Businesses (including landowners and private landlords) should pay for the changes they need to make. This should be through taxes and other means, and with some support from the Scottish Government.
Businesses are especially responsible for costs where:
- There is an opportunity for them to profit from the changes.
- They contribute higher emissions where lower carbon alternatives (e.g. alternative land uses, lower carbon transport options or building materials) are possible.
- They are landlords with a certain number of properties / making a certain amount of money (to be defined).
- They can take on apprentices / reskill people.
- They have a responsibility (e.g. private landlords would be responsible for insulating homes and improving energy efficiency; construction businesses would be responsible for switching to low-carbon materials and technologies; landowners would be responsible and accountable for making changes to the land use).
There should be differentiation between small and large businesses, with support available towards the cost for smaller businesses.
Citizens
All citizens should contribute in some way, whether that’s:
-
- Paying tax fairly.[10]
- Changing how we get around (switching to electric vehicles, using public transport and more active travel) or paying charges for continuing to use high-carbon forms of transport when good low-carbon alternatives are readily available, feasible and appropriate to use.
- Making changes to our homes where applicable (acknowledging that some changes may not be appropriate for older homes), with advice and support available.
How do we make that system of payment fair?
While participants did not settle on one specific system of payment, they did highlight some key aspects of what a fair system would like look. These fall broadly under six themes, as outlined below:
EQUITY
- Make the system equitable, meaning that everyone contributes but not all in the same way or by the same amount.[11]
- Decide what an individual contributes based on their ability to pay (through a means-tested approach) or their ability to act. An independent body should decide on this system of payment (see leadership and accountability section).
- Recognise the range of potential impacts on individuals and communities, and reflect individual circumstances when deciding how much different groups should pay. This should take into account location (differences by urban and rural areas), income and the needs of those with disabilities or long-term health conditions.
- Support those on low incomes, so that they are not disadvantaged by the changes and to avoid people being left with no help.[12] “Low incomes” should be clearly defined and consider overall financial position, including assets and savings. Support could include discounts on travel depending on circumstances.
- Public engagement
- Regularly consult and engage with the public on these difficult decisions.
- Consultation and engagement should be accessible and include a diverse range of groups. These engagements should be representative but small in scale and with a clear timeframe in mind.
- Findings from these consultations should be reported on.
- They should be a joint effort between the Scottish Government and local authorities, allowing for locally-focussed consultation (as national campaigns can miss parts of Scotland and might not reach everyone).
Transparency
- Provide education and information about why we need to make changes to reach net zero and what the impacts will be.[13]
- Be transparent about how taxes, charges, grants and loans related to net zero are decided upon, and about how the Scottish Government is contributing to costs. Make this available to the public in a clear and accessible way.
Infrastructure
- Improve infrastructure across Scotland so that it is easier for people to make low-carbon choices. This should include more access to integrated public transport including in rural areas, affordable or free electric vehicle charging points, measures to make homes more energy efficient and more availability of low-carbon food.
Regulation
- Introduce regulation to control how much businesses (e.g. landlords, supermarkets, energy companies) can pass costs on to consumers. Businesses that don’t comply should be fined.
- Prevent people and businesses from gaming the system or exploiting loopholes (e.g. higher earners, multinationals or landowners receiving more financial support than needed, or paying the charges to avoid making changes that others have to make).
Leadership & accountability
- Have clear leadership and accountability from the Scottish Government, following science and evidence (not politics).[14]
- The Scottish Government should be responsible for setting up a non-political body, overseeing discussions between all the interested parties to take the lead on the just transition (including specialists in all relevant areas). They could take the lead on deciding who pays and ensure it is fair.[15]
- Government-tendered contracts should have a large net zero element and not just who is going to do it cheapest. The independent governing body should review these decisions.
How can we make sure that everyone benefits?
Participants conclusions related to benefits showed similar themes to those relating to systems of payment. Key themes, once again, were of addressing inequality, education, supporting people to make changes and leadership from the Scottish Government.
Reducing inequality
- Use the transition to net zero as an opportunity to reduce other inequalities and make Scotland a fairer society. This could be done by, for example, closing the urban/rural divide, reducing health inequalities, reducing reliance on oil and gas and combatting extreme poverty.
Education and support
- Help all people (adults and children) to understand what outcomes they are contributing to and why it makes a difference.
- Communicate changes in a positive and honest way, emphasising the benefits of net zero for future generations, while acknowledging that changes are unavoidable and will mean sacrifices.
- Proactively tell people what costs and other changes are coming, what support is available to them and what will happen if we don’t make those changes. Proactively combat misinformation. This can be through multiple channels, including TV campaigns and population wide texts.
- Provide easily accessible and accurate information from credible sources.[16] This should include individual calculators/tools to help people determine the impact of their own choices and the support available to them.
- Give people time and support to make these changes (they won’t happen overnight).
Encouraging behaviour change
- Empower[17] individuals and businesses to make low-carbon decisions (where changes are viable) through a mix of “carrot” and “stick” initiatives.[18]
- “Carrots” would be incentives to make low-carbon choices (e.g. tax breaks, grants, subsidies). These should come first and be widely publicised including the consequences of not taking them up (i.e. subsequent “sticks”).
- “Sticks” would be restrictions or charges for making high-carbon choices once low-carbon choices are readily available. These should come after “carrots” and only if there are reasonable, economically viable alternatives already in place.
Business & skills
- Encourage and incentivise key industries to reduce emissions and support small businesses to innovate and come up with solutions.
- Ensure there is an equitable distribution of Scottish Government support across different sectors.
- Ensure that new jobs become available as old jobs become obsolete and that upskilling keeps pace with that.
Planning
- Set milestones so that changes are introduced in a gradual and ordered way, rather than in a late rush nearer to 2045. As part of this:
- Ensure changes are thoroughly planned for first.
- Prioritise changes, so it is clear to people what needs to happen when.
- Continually review progress and adapt plans as needed.
- Be prepared to adapt milestones and follow the science if things change.
Leadership
- Make sure the Scottish Government are leading from the front and setting an example.
What needs to be in place to make Road User Charging fair?
If RUC was to be introduced to reduce emissions within the Scottish transport sector, and to ensure it was implemented fairly, participants concluded that:
It should be implemented with different circumstances and needs to be taken into consideration.
There should be exemptions or concessions for some groups (e.g. people with disabilities, those who live or work in areas where RUC has been introduced, those living in rural areas and those on lower incomes).
Ensure there is reliable, frequent and more integrated public transport infrastructure before RUC is introduced.
Those were the conclusions that participants most strongly agreed upon. But other conclusions reached included that:
- There should be more incentives as well as disincentives (e.g. not charging EV drivers the same as petrol/diesel drivers, and rewarding those who take fewest journeys).
- Changes should be introduced carefully, gradually and the public should be clearly informed about them.
- The changes should be considered in a holistic way, with consideration given to things like the affordability of housing (affecting where people can live and what options they have for getting to work), and the possible impact on tourism in areas where RUC is introduced.
It should be noted that there were mixed views on the principle of RUC, whichever way it is implemented. While it was generally considered to be acceptable if the above conditions were met, there was also a strong and persistent (albeit more exceptional) view that RUC would be intrinsically unfair as it would limit the choices of those less able to afford the charges.
What needs to be in place to ensure funding for the heat transition is fair?
To ensure the costs of the heat transition are distributed fairly, participants concluded that:
There should be support for all, but the share of funding should vary depending on circumstances, such as income and age of property.
Exemptions from penalties should be in place, with a fair appeals process.
Those were the conclusions that participants most strongly agreed upon. But other conclusions reached, which for some were fundamental to any clean heat transition being implemented fairly, included that:
- There should be a proportionate approach that incentivises and supports people to make changes, and allows sufficient time for changes to be made before penalties are imposed.
- The use of loans should be considered carefully, with long and flexible repayment plans that are sensitive to peoples’ circumstances. Ultimately, it was agreed that nobody should be forced to take out a loan.
- There should be reassurances around the efficacy of clean heating systems, grounded in evidence that is clearly communicated with the public. This should be supported by regulation of new technologies being installed.
- There should be a wide-reaching and transparent communications campaign to ensure people understand what’s needed, why it’s needed and what support is available.
Participants’ learning journey
An objective of phase one of the research was to gather learning into the factors influencing any changes in participants’ attitudes, beliefs or values as a result of engaging in this deliberative process. This chapter summarises findings in relation to this objective and draws only on findings from the cohort taking part in phase one.
Extent to which views changed
Early views
As outlined at the start of this report, participants began the process with a fairly good grasp of the term net zero, but less so with the concept of a just transition. Though they had some ideas of the types of change that might be required to reach net zero (such as less reliance on cars, changes to our diet, and different ways of using energy in our homes) they were unsure of the detail about what a just transition to net zero might involve.
Participants started the process slightly daunted by the challenge ahead, but nonetheless open-minded and keen to learn more from experts and from each other. They shared a sense of hope that this deliberative process might lead to some positive action. They also conveyed a sense of the responsibility in their own role in the process, and were keen to make a valuable contribution to the dialogue. However, there was also a note of scepticism about how much impact the process could have, and some questioned whether any action would be taken by the Scottish Government as a result.
Participants’ gradual learning process
As they moved through the process, it was clear that participants were gradually learning new information. During the sector-focussed workshops (workshops two, three and four), participants expressed notes of surprise at some of the information in the expert presentations, which had raised new issues for them or new ways of looking at things. For example, there was surprise at the scale of reduction in car use needed, at the costs of installing heat pumps in homes, and at the level of financial subsidies received by farms.
Learning about the types of changes required to reach net zero also caused some concern among participants, as they appreciated the scale of the challenge ahead and the potential financial implications of those changes. This caused some participants to push back stressing that some changes would be too difficult to implement in certain parts of the country, particularly rural communities, or too costly for certain people.
“It’s hard to imagine me being able to take on any more costs, as someone in fuel poverty. I can’t afford to replace the boiler if it breaks. It seems a bit ambitious, scary. Especially where I live, I am not the worst off, but I struggle to heat the home and then adapt to new technologies.” (Participant, phase 1, workshop 3)
As they discussed the issues further in the sector-focussed workshops, participants said that they had developed a greater appreciation of the need for collective action to reach net zero and for costs to be distributed. Some said they had moved away from a feeling that responsibility lay mostly with the Scottish Government, local authorities or businesses, to feeling that societal-level change was required. However, they acknowledged that sharing of responsibility, and distribution of costs, would be complicated and would require thoughtful decision-making supported by education and awareness raising.
“One of the things that struck me, the just transition will have to be government but also society in general. Society itself has to be a driver. The education value and sharing why this is important will make all the difference.” (Participant, phase 1, workshop 2)
This sense of collective responsibility was a position that they brought into the final workshops, as they started their detailed deliberations and conclusion-forming.
Views at the end of the process
In the final session, participants reflected on whether their views had changed over the course of the process. The overall message was that they had developed and deepened their understanding of the issues, more so than having changed their opinion or position.
Participants noted that, as a result of taking part in the dialogue, they had developed more understanding of the scale and complexity of the challenge of a just transition to net zero. Participants started the process appreciating the importance of reaching our net zero targets, but by the end they had more of an appreciation of how important, but also how difficult, it will be to ensure a just transition.
“I haven’t necessarily changed my views on anything, but it’s forced me to think about this intensely and it’s driven home how important this is.” (Participant, phase 1, workshop 6)
As noted above, there was a greater sense of shared responsibility, and need for collective action to achieve a just transition. At the same time, participants said they had more appreciation of the impacts of the transition on different groups, and for individual circumstances to be born in mind in deciding how costs should be distributed. Indeed, this was one of the strongest messages that participants shared towards the end of the process, and which was reflected in their conclusions. Linked to this, the need to protect the most vulnerable in society was a key theme throughout the process.
“At the start I’d quite naively said the Scottish Government (should be responsible) but I’ve learned a lot and changed my mind…from hearing from the professionals and talking to people in the groups.” (Participant, phase 1, workshop 6)
In addition to the deepening of understanding, one area where views did change somewhat was in relation to systems of payment. In the early stages of the process, some participants felt that responsibility for costs should lie with those who contribute the most carbon emissions. This, they felt, was the fairest way of allocating responsibility for costs. However, as noted in chapter 4, when discussing the scenario of “those who emit the most pay the most”, participants strongly felt that this would not be fair. Having deliberated and considered the impacts of different groups, they felt that some people and businesses have more limited control over their emissions than others. They therefore felt that a more nuanced approach would be required, and that some people and businesses would be unfairly penalised if these differences were not considered.
“I felt it was more apt for the people that produce the most carbon to take the lead…but hearing about farmers and how they don’t really earn money, that really took me aback.” (Participant, phase 1, workshop 6)
Views on who should take the lead
In the first workshop, participants were asked a live-polling question “who should take the lead in tackling climate change in Scotland?” At that stage, around two thirds said it should be everyone (individuals, businesses and the Scottish Government) while two-in-five said the Scottish Government and one-in-five said all individuals in Scotland.
Participants were asked the same question in the final session. As shown in figure 7.1, views did not change to a great extent. The most common answer once again was for everyone to take the lead. However, there was more emphasis placed “certain groups of people” and slightly more on the Scottish Government.
Figure 7.1: Findings from “live polling” question asked in workshops 1 and 6

Participants felt the relative emphasis on the Scottish Government highlighted a need for “leadership from the front”, a point that was highlighted in participants’ conclusions. They also noted that the slight change in the findings between sessions reflected the difficulty of placing responsibility on any one group.
“We all have a part to play but taking a lead, someone has to be in the front. The fact that more people were choosing the Scottish Government and certain businesses and actors, it possibly reflects the complexities of the situation.” (Participant, phase 1, session 6).
In discussing the results of the poll, participants emphasised the distinction between taking action to tackle climate change and taking the lead. It was highlighted that while we all bear responsibility for making changes, there was an expectation that leadership should come from the Scottish Government.
What contributed to views changing
Participants identified a range of factors that had contributed to their learning journey and to their views either deepening or changing. In summary, these were:
- Hearing from each other. Participants felt that having the chance to discuss issues as a group helped them to appreciate different perspectives on the issues and different circumstances. The experiences of rural participants were highlighted as being particularly valuable:
- “I had only thought about my own situation but have learned from people in completely different areas of Scotland and stages of life.” (Participant, phase 1, workshop 6).
- Expert speakers, through their presentations at the workshop and their responses to participants’ questions.
- Characters and scenarios had helped participants to consider the various aspects involved in the transition to net zero and to appreciate how different impacts might be felt by different people.
- Being asked to articulate their views in the sessions helped to clarify and strengthen their own positions:
- “Being asked to speak out, it makes your position clearer. It makes you put it into words, so you’re more aware of your opinion.” (Participant, phase 1, workshop 3).
- Time to think and reflect about the issues, both between the sessions and over the course of the whole dialogue.
Implications from the research
The key outcome of this process was a set of conclusions (shown above) which provide clear suggestions for the Scottish Government to consider as it develops Just Transition Plans. This includes conclusions around specific policy options that were tested in relation to the transport, and built environment and construction sectors. The research also has a number of broader implications for future policy in this area, which are set out below.
- A fair system of payment must consider different circumstances.
When considering three hypothetical payment systems (based on ability to pay, level of emissions, or incentivisation), there were elements of each that were appealing and problematic. While it was recognised that placing responsibility on those who contribute most emissions was fair in principle, there were also concerns that this could be unfair if applied to those without the ability to choose lower carbon alternatives. Meanwhile, a system that considers ability to pay was seen to be more aligned with their overall principles of fairness but would require careful implementation to avoid negative impacts on some groups. Research has shown that there is a disparity between the carbon footprints of high-income and low-income households,[19] which suggests that higher emitters would also be those more able to pay. Ultimately though, participants’ views aligned with the existing National Just Transition Outcome,[20] of a fair distribution of costs and benefits that consider different circumstances.
- There was support for a progressive form of taxation, with higher income individuals and businesses paying more.
It was acknowledged that Scottish Government grants, financial incentives, and wider investment in infrastructure would require additional funding. It was therefore seen as somewhat inevitable that new or different forms of taxation would apply. However, there was resistance to the idea of a general taxation on the basis that this may create financial hardship for those unable to pay more. Instead, participants supported a form of progressive taxation, reflecting the principle of ability to pay noted above. Though not discussed in as much detail, there were also suggestions of taxing larger high-emitting businesses, energy companies, landowners, and a tax on high-carbon products.
- Protecting the most vulnerable in society was seen as a fundamental requirement for any future systems of payment.
Whether discussing broad principles of fairness, or how specific systems of payment or policies should be implemented, participants strongly felt that protections or exemptions should be in place for those least able to afford the payment. Participants also stressed the importance of supporting those with other needs or challenges related to health, disability and life stage.
- A balance between incentives and disincentives may have the greatest appeal and impact.
The use of incentives (such as grants for EVs and clean heating systems, funded retrofitting schemes, tax breaks for businesses that meet emission targets) was considered a more supportive and kinder approach to encouraging behaviour change than using penalties or charges. But they were not universally supported, and some felt they did not go far enough towards encouraging the level of changes required to reach net zero. Disincentives (such as Road User Charging) were broadly accepted on the basis that they would help to discourage car use. However, for both incentives and disincentives to be considered fair, it was felt that they needed to reflect individual circumstances and (as outlined above) ability to pay.
- The timing of any new taxes, charges or penalties will be important.
Introduced too soon, and these pose the risk of placing individuals in financial difficulty and may be met with resistance. Introduced too late and they may not be enough of an incentive to encourage, and instil a sense of urgency in, behaviour change. This was clear when participants discussed the heat transition; they felt that a target of 2028 or 2033 for homeowners to make energy efficiency improvements was too soon, but a target of 2045 for installing clean heating systems was too far away. The most appropriate timing will therefore require a balance between motivating people to change while not unfairly penalising them. A phased, staggered approach was seen as one way of achieving this balance.
- It will be important that the public feel part of the decisions that affect them.
The Just Transition Commission highlighted that “the time for difficult conversions is now”[21] and emphasised the importance of communication and engagement. Participants echoed this sentiment, emphasising the importance of clear and transparent communication about the need for changes in each of the sectors, and the need for ongoing public engagement.
This will be particularly important when it comes to communicating changes such as those outlined in the Heat in Buildings bill. As highlighted in Appendix 2, participants perceived that heat pumps might not be suitable for all environments and there was an appetite for evidence to show their efficacy. A recent study from Energy Systems Catapult found that heat pumps were widely suitable across a broad spectrum of housing types, and that most heat pumps were installed without requiring other energy efficiency upgrades.[22] Communicating such evidence clearly and accessibly will therefore be vital to encouraging uptake.
Learnings from this deliberative process for future public engagement
Reflecting on their involvement in this deliberative research, participants raised a number of considerations to ensure meaningful public engagement on this topic in future. As highlighted in the previous chapter, engaging over a longer period of time enabled participants to consider complex issues more fully than would have been possible with other form of public engagement.
Breakout groups changed between sessions and participants really valued the opportunity this gave them to discuss the issues with different people and to hear a wider range of perspectives. With a relatively small group of people coming together to discuss issues affecting Scotland as a whole, one participant raised a concern that some groups (e.g. those with disabilities) might have been missing from the discussions. Although those with disabilities were represented in the dialogue, this comment underscores the importance of ensuring that participants in public engagement understand why they have been invited to take part, how the group has been recruited, and where their involvement sits in relation to the wider landscape of public engagement on Scotland’s just transition.
Some practical reflections on the process also highlighted the importance of designing an accessible process. As this project sought involvement from people living across Scotland, an online approach was felt to be appropriate and in particular enabled those living in rural areas, those with disabilities, and those with caring responsibilities to take part. Ensuring the information was presented clearly by experts and facilitators was also important, as it enabled participants to engage on the topic and able to express their views in a safe and non-judgemental space. Valuing participants’ time was another factor that ensured an accessible process; as one participant pointed out, they had been set a big task and being paid made them feel that they could dedicate their time and engage meaningfully.
Participants also highlighted the importance (and challenge) of translating the work of the group into effective awareness-raising and engagement with the wider general public.
- “We have now spent almost 15 hours listening to experts and discussing this and we have grown, some have changed [views], some are simply [more aware]. To [share] that kind of information across a population of 5 and a half million…there is quite a gap, with a lot of [work needed] to go forward. Because it’s so complex.” (Participant, phase 1, session 5)
Appendix 1. Transport sector detailed findings
This chapter outlines participants’ views on a just transition in the transport sector. It provides detailed findings from both phases of research:
- Phase one, where a group of 30 people living across Scotland met over six online workshops and an online community to consider what a fair distribution of costs and benefits would look like. It focussed on three sectors, one of which was transport.
- Phase two, where a group of 20 people living across Scotland met over three online workshops to explore specific policy options. One of those workshops focussed specifically on transport, including the potential use of Road User Charging.
Summary of findings related to transport
- The vision for a decarbonised transport system in 2040 was considered difficult to achieve without significant investment in transport infrastructure across Scotland.
- Participants felt that the costs for the transition should be shared between:
- The Scottish Government in providing support and infrastructure.
- Businesses in the transport industry (with support for smaller businesses).
- Citizens, but based on use, access to and choice over lower carbon alternatives, and ability to pay.
- To ensure a fair transition, in which everyone benefits, participants felt that individuals’ circumstances needed to be considered and steps taken to address any barriers they might face. Groups identified as requiring additional support included:
- Those on low incomes.
- People with health conditions or disabilities.
- Elderly people.
- Those living in rural communities.
- Participants highlighted the importance of allowing sufficient time for people to prepare for any changes.
- Improvements to the current public transport infrastructure was seen as a prerequisite for a just transition.
- To ensure any form of Road User Charging is implemented fairly, participants concluded that:
- Different circumstances and needs should be taken into account, rather than taking a blanket approach.
- There should be concessions or exemptions for some groups, including those listed above and those who rely on their car for work.
- Charges should only apply where people have easy access to public transport.
- Road User Charging applied to a defined urban area was considered fairer than an approach based on distances travelled.
What changes were expected?
Early in each phase participants discussed the changes to transport that they thought would need to happen for Scotland to reach net zero. These included:
- A shift towards lower-emitting forms of transport, including more electric vehicles (EVs), car-sharing schemes, and public transport.
- Restrictions on car use in city centres, such as Low Emissions Zones (LEZs) which had already been observed in cities like Aberdeen and Glasgow.
- Electrification of rail and bus networks, with more frequent and efficient trains and ferries.
- Improving cycling infrastructure, including more cycling lanes and incentives for active travel.
- A reduction in the availability of domestic flights in favour of public transport alternatives.
It was felt these changes would be expensive, as the infrastructure in Scotland (for both public transport and EV charging) was perceived to be lacking currently. Participants agreed that the transport network would need to become more integrated for people to be less reliant on cars.
“When I try to travel down south by train, I have to drive to the railway station. That is defeating the object.” (Participant, phase 1, workshop 2)
A distinction was drawn early in the discussions between cities and rural areas which prevailed throughout both phases of the dialogue. Among those living in urban areas, the need to reduce car use and encourage use of public transport was considered a positive, if inconvenient, change. Among those living in rural areas, there was a strong view that insufficient public transport had rendered cars “an essential not a luxury”. Participants expressed concern that public transport would not be improved sufficiently and that rural communities would be forgotten about.
“I worry about rural areas as we have zero public transport. I walk to loads of places but can’t walk 45 miles to the nearest supermarket or 100 miles to the nearest hospital. I feel there’s no voice for rural areas, there’s dreadful infrastructure and I really worry.” (Participant, phase 1, workshop 2)
Overall, it was therefore considered unfair to ask people to rely less on their cars without providing improved public transport. It was felt that this would be particularly unfair on certain groups, such as those living in rural areas, young families, those with disabilities, and elderly people. Improvements that participants wanted to see in transport infrastructure included more frequent, reliable, direct, cost-effective and accessible services.
“Even if the buses were reliable, for what it would cost for a return ticket, you might as well put in the fuel and it works out cheaper.” (Participant, phase 2, workshop 2)
Reactions to initial presentations in phase one
Phase one participants heard introductory presentations providing an overview of the types of changes that would be needed to move to a decarbonised transport system. Following this, the scale of the challenge became more apparent and daunting to some.
“I just think there are some serious decisions to be made – in how we live our lives, do our work, what we feel is essential in our lives – to enable that to happen.” (Participant, phase 1, workshop 2)
As well as sparking further discussion about the potential costs (explored in detail below), the presentations also prompted participants to reiterate concerns about existing infrastructure (such as EV charging), which they felt would need to be significantly improved for this vision to be realised. Participants raised several questions about those infrastructure challenges.
After hearing the presentation about inequalities in the transport sector, participants identified several groups that they felt could be at risk of being left behind in the transition:
- Rural communities, particularly those living on islands, based on the points noted above about the current state of public transport in parts of Scotland.
- Women, noting a point made in the presentation that women were less likely to have access to a car and were more reliant on public transport.
- People on lower incomes, who participants felt may be trapped if they were charged more for using their car but could not afford to replace it with an EV.
- People with disabilities or additional needs, who it was recognised may not find public transport accessible.
- Small businesses, with concerns over potential job losses in the motor industry if EVs required less maintenance and for businesses struggling to absorb the costs of reskilling employees.
Overall, there was a sense that the changes represented an imbalance towards removing transport options without providing alternatives. One participant illustrated this with an example, describing an experience of their partner who sold their car because they could not afford to drive in a LEZ and could not get to work on time using public transport.
“I thought it was quite unfair. She wasn’t able to afford to buy a car she could have driven in the [LEZ] area […] and is now having to use mine […] She was really negative impacted. If she lived on her own she probably would not have been able to keep her job.” (Participant, phase 1, workshop 2)
Vision for the transport sector discussed in phase one
Phase one participants were presented with a vision for public transport in 2040 based on the Scottish Government’s discussion paper (see fig. 9.1) and explored this in the context of different fictional characters and how they might be impacted (see fig. 9.2). The vision was a high level scenario intended to encourage discussion and invite participants to consider its implications, based on the characters and their own lived experiences, before discussing what a fair distribution of costs and benefits would be.
Figure 9.1: Vision for transport

The role of transport for our characters
Alice has a small, petrol car. There is a bus route that can take Alice from the hospital to her flat. But because of her working patterns, Alice prefers to drive to work. Even though this is more expensive, she does not feel safe travelling by bus late at night.
David and Sarah have two cars: a diesel SUV and a mid-sized petrol car. David travels by car most days. Sarah mostly works from home. Either David or Sarah use one of their cars to drop-off and collect their children from school. Noah has a disability and uses a wheelchair.
Lorraine sells produce at a small shop on the farm and supplies local businesses, but most of it is sold to suppliers across Scotland and the rest of the UK. There is no public transport in the area, so Lorraine and her family rely on their cars and vans.
For weekly food shopping and other needs, Maria uses the local shops and services in Moffat. For anything further away, such as medical appointments for herself or for her daughter Ella, she takes a taxi. Those longer journeys would usually require two buses, which are not accessible for Maria.
Nadeem uses a diesel van that he drives most days for work. Ajay drives a small hybrid car, which he uses every day to get to work in Stornoway. He has a bicycle but rarely uses it as he does not feel safe cycling on the road. There is limited public transport where Nadeem and Ajay live.
Who could benefit?
Under this vision, there was a view that anyone in transport poverty[23] would benefit from having access to public transport for their everyday needs. However, there were questions around the extent to which public transport could replace all types of journeys in all places.
Participants felt that these changes might not feel beneficial to everyone immediately, as it would involve more effort and time to get around. Nevertheless, there was an acceptance that this would be a reasonable trade-off for a fairer, healthier society. A broader sense of duty was also felt, with participants recognising that they might not benefit directly from the changes themselves but future generations would.
Who benefits?
As they lived in urban areas and used public transport, participants identified Alice and Maria as two characters who would benefit under the vision, given the improvements to public transport. It was felt that Maria would be able to make more journeys using public transport and would be less reliant on taxis, saving her money. Alice could also use public transport to go to work rather than rely on her car. However, it was pointed out that more regular buses would not necessarily make her feel any safer travelling to work at certain times and that there would be other factors influencing this (such as the bus routes, behaviour of other passengers, and confidence in the driver to manage any issues).
Who might be negatively impacted?
The groups identified as potentially being negatively impacted under this vision were:
- Individuals and businesses in rural communities, if more accessible public transport systems did not reach all parts of Scotland (which some participants felt would be the case), but initiatives like road user charges did.
- Businesses in the tourism or hospitality sector, if road user charging put tourists off travelling to parts of Scotland.
- Families with children, who could find public transport difficult to use.
- People who drive for a living, if they were not exempt from road user charges.
- People with limited mobility, if they were not able to use public transport and were not exempt from road user charges.
Participants also commented on the intersectionality of these groups, and highlighted the need for different circumstances to be taken into account.
Who could be negatively impacted?
Although David and Sarah would have to adapt their lifestyle (e.g. use of two cars), it was felt they would be able to adapt and absorb the costs with their income, so they would not be at risk of losing out. However, it was recognised that there would need to be some flexibility or exemptions given for their use of the car when travelling with their disabled son.
Lorraine was identified as at risk given the impact of the changes on her farm and limited low carbon alternatives for agricultural vehicles and personal car use (based on the view that the sort of rural area where she lives is unlikely to have the level of integrated transport needed).
It was felt that Nadeem would also be negatively impacted because of his reliance on a van for his work and the fact that he lives and works on an island. Based on the assumption that public transport would not be a viable alternative, it was considered unfair that his earnings would be affected by road charges.
While it was recognised that society as a whole would benefit if this vision was achieved – due to reduced air pollution and increased social interconnectedness – doubts remained over whether it could happen, and whether it could be implemented in a way that everyone benefits from.
Phase one conclusions on a fair distribution of costs and benefits
As we transition to net zero in the transport sector, who should pay for the changes that will be needed?
There was a broad sense that the costs of transitioning to net zero in the transport sector should be shared and that no single organisation or group should bear sole responsibility. However, participants identified particular groups as being in a position to take more responsibility for these costs.
A common view was that the Scottish Government should pay a substantial share to help people make the transition to a decarbonised transport system and to encourage behaviour change in how people travel, through incentivisation such as grants for the purchase of EVs and private charging infrastructure, and free public transport.
“If the government wants everyone to change the way that we live, then they need to put more back in than us ourselves. If they want us to do so much more, they need to help out more than us personally.” (Participant, phase 1, workshop 2)
However it was also acknowledged that any costs paid for by the Scottish Government could end up being borne by the individual anyway through taxation. Participants’ discussions therefore focused on ways to make this fair (see fair payment systems).
It was also felt that the transport industry should take on some of the costs, especially where there was scope for businesses to profit (for instance due to increased demand and/or where they contribute higher emissions. Delivery companies had been mentioned in the presentation and it was felt that such businesses could bear the costs of decarbonising their fleets. However, it was also recognised that smaller businesses – such as local mechanics – would need financial support from the Scottish Government to make the initial changes required and to retrain the workforce in new green skills.
Participants recognised that all citizens would ultimately have to pay something to help reach net zero in Scotland’s transport sector, but identified certain groups that they felt should bear more of the costs. It was generally expected that service users – i.e. people already using public transport – would continue to pay for that, and those benefitting from specific aspects of the transport system (e.g. EV infrastructure) should contribute in some way. It was suggested that those contributions could be scaled according to ability to pay and based on some wider investment in infrastructure.
It was suggested that those who can avail of alternative forms of transport (but choose not to) should pay more for making choices that result in higher emissions, for example:
“If someone makes a choice to have two cars in 2040 where we have great transport links, they need to justify it or pay up.” (Participant, phase 1, workshop 2)
It was also suggested that tourists could pay a share of the costs through a tourism tax aimed at supporting changes in certain areas. However, as highlighted above, there were also concerns that such charges could reduce the number of visitors and negatively impact businesses that are reliant on tourism.
There were some references to high carbon emitters and suggestions that they might be expected to pay more e.g. businesses that have high emissions, or individuals that continue to drive petrol or diesel vehicles. It was pointed out that those on higher incomes would be more likely to be able to pay the charges and continue high emitting behaviours, or be more likely to afford the low carbon alternatives.
“The wealthy will always be able to do whatever they want to do. They will do however miles they want because they will pay the charges. The poor will be disadvantaged because they can’t pay.” (Participant, phase 1, workshop 2)
However, this point was qualified by a view that some high emitters may not have a viable alternative, either because of where they live (i.e. those in rural areas may have no alternative to cars) or because of income (i.e. some would not be able to afford the switch to EVs). Affordability, therefore, was seen an important consideration, even in the case of those contributing the highest emissions:
“Those with older vehicles, and so higher emissions, will be penalised but it might be unfair if those people cannot afford new, cleaner vehicles. This will disadvantage those who cannot use public transport as an alternative for whatever reason. People on lower incomes are always left behind.” (Participant, phase 1, online community)
A view shared by some participants was that there will be parts of Scotland that will lose out once the changes are implemented. This view was particularly held by those living in rural areas who did not feel that the vision for transport in 2040 was realistic for rural communities, and considered it unfair to expect those communities to cover the costs of changes that (some felt) ‘will make their situation worse’.
“It will not cover everyone’s needs here, the system and infrastructure is so dreadful they would need to start major roadworks now. I don’t see any of this helping rural areas at all.” (Participant, phase 1, workshop 2)
How can we make sure that system of payment is fair?
Thinking about individuals and groups in society who could pay for the changes needed to reach net zero, participants were supportive of a system of payment based on:
- Use, with those benefitting from a particular mode of transport, or from a part of the transport infrastructure, or using these more paying a higher share. It was also felt that those using forms of transport that carry higher emissions (e.g. petrol/diesel cars) should pay a higher share for that, but only if they can afford to do so and if other choices are available (as outlined in the next two points).
- Ease, availability and choice, with those who have services available to them paying, and correspondingly those who do not have services available or who are not able to use the services not paying. Choice was a particularly important factor in who should pay. Taking road charges as an example, participants felt it was not just important to think about proximity to public transport, but circumstances:
“I live in a rural area where the closest bus is a mile away and the closest train station is nearly 2 miles away. This means I’d have difficulty reaching either of those services, [and] when I am able to get there I’ve either had to walk or drive making it in my eyes a waste of time.” (Participant, phase 1, online community)
- Ability to pay. In defining what ability to pay means, views were mixed. Some suggested this should be linked to benefits (none specified), while others felt this would be unfair to those not on benefits but with low incomes. A more exceptional view was that there should be a flat fee applied to everyone. There was broad agreement, however, that those on lower incomes should pay a smaller share than those on higher incomes:
“It’s got to be based on what people can afford. In principle, it needs to be progressive, otherwise you will end up with poor people paying too much, and richer elements of society paying too little.” (Participant, phase 1, workshop 2)
Participants felt that a fair payment system would require individual circumstances to be taken into consideration, in particular the needs of those in rural communities. For example, it was felt that car users in rural communities should not pay for road user charging if lower carbon alternatives (i.e. public transport or EV infrastructure) were not available to them and they were still reliant on petrol or diesel cars.
“[For] people in rural communities who may struggle to transition to electric cars in particular (short range, financial challenge, no viable public transport alternative), will rural communities be given concessions, assistance?” (Participant, phase 1, online community)
A range of ideas were suggested for taking different circumstances into account. These included a points-based system with an annual self-declaration (considering a range of criteria such as location, mobility, age, and financial circumstances) or a carbon token allowance system for individuals and companies.
When considering the role of business in sharing the costs, participants worried that these could be passed onto the consumer (e.g. consumers paying more for items being delivered to their home or EV charging prices being increased while companies make large profits). It was therefore felt that there should be “checks and balances” in place to prevent this from happening. But there was also concern for smaller businesses being unable to adapt, so it was considered fair that they would be supported by government.
“The government, which has the power to force change must be aware of the negative effects of forcing costly change on businesses that may not be able to afford it. Appropriate support should be in place, this may be financial, educational or of other modes such as time limited exemptions”. (Participant, phase 1, online community)
In terms of the Scottish Government’s role in sharing the costs, it was recognised that some of the funding would inevitably be raised through taxation. A progressive tax was supported, based on both ability to pay and ability to choose.
“Everyone has to contribute, but what you contribute depends on what choices you are able to make. If you make personal choices that will have more of an impact, you should pay more for it. In many places, you don’t have the choice. You have to factor all that in.” (Participant, phase 1, workshop 2)
Overall, it was felt that any fair system of payment would need to give people time to make the changes required. In practice, this would mean giving plenty notice of the introduction of new regulations, taxes, charges, or incentives. Related to this, one suggestion was to introduce a sliding scale so that those not making the changes required are charged more as time elapses.
It was also stressed that certain groups will need additional support, or exemptions from the costs. Echoing earlier views, there was widespread concern about the impact of costs on those who were already struggling financially, particularly in the context of the cost of living crisis. There was therefore a strong desire to protect and support those least able to afford the changes, as well as those with restricted choices in their transport use (e.g. those with disabilities and those in rural areas with no accessible services).
How can we make sure that everyone benefits?
If the vision for a decarbonised transport system was realised by 2040 (and there was some scepticism over whether it would be), a number of broad societal benefits were identified, including:
- A more integrated, smoother and accessible public transport for Scotland (as outlined in the vision) improving health, wellbeing and social connectedness.
- More services for communities to support a thriving local economy, reducing the need for people to travel further for their everyday needs.
As with costs, participants highlighted that the benefits of the transition may not be the same for everyone. To ensure that everyone benefits from the transition, they therefore felt that specific circumstances of different groups should be acknowledged and steps taken to address the barriers they may face. This included the groups already mentioned: those on lower incomes and those struggling financially; people with health conditions, disabilities, and elderly people; and those living in rural communities.
Participants felt that further education and engagement on the benefits of the transition was required. Public consultations, particularly with those most likely to be affected, were suggested as an effective way of understanding the needs of these groups.
“At the moment there seems to be a disconnect between the current Scottish Government and the public; they are not listening to the genuine concerns of those who will be most affected and are least able to shoulder these burdens.” (Participant, phase 1, online community)
It was also felt that the necessity of transitioning to net zero in the transport sector (and the benefits of doing so) would need to be clearly and widely communicated to people living in Scotland. Related to this, a theme of transparency emerged, with participants highlighting the importance of the Scottish Government showing how funds raised were being used (e.g. to improve public transport infrastructure).
“You would need an acceptance from the collective good, that everyone is going to buy in from the system […] You have to take everyone with you on it, and that is a big challenge.” (Participant, phase 1, workshop 2)
There was a view that reducing the cost of public transport would not have an impact on vulnerable groups unless it was available or accessible to them. Infrastructure improvements were therefore seen as a prerequisite for all people benefitting from the transition to net zero in the transport sector.
“Older people already have free access to bus transport but if the buses don’t go where you need it’s no use.” (Participant, workshop 2)
Exploring transport policies in phase two
In phase two, participants discussed the potential application of Road User Charging (RUC) as a way of helping reduce our reliance on cars. They considered two possible approaches to this:
- UK national road pricing, involving a charge on drivers based on distance driven.
- Urban local road user charging, involving a charge to drive into specific parts of an urban area.
Participants explored each approach through scenario-based discussions and considered the implications for different people living in Scotland (using some of the same characters from phase one).
Initial views on the idea of Road User Charging
Before the two approaches were presented, participants shared their initial thoughts on the idea of RUC in principle. Some clear themes emerged, which included:
- Not implementing it as a blanket rule: while it was recognised that RUC could encourage people to reduce their reliance on cars, it was also felt that it could impact negatively on some groups (e.g. those on low incomes and those who rely on their car because of a disability or health condition, their work, or where they live). It was therefore agreed that exemptions or permits would need to be in place for these groups.
- Ensuring there are alternative choices available: initially it was felt that applying some form of RUC would be fair where public transport alternatives were readily available (e.g. in cities), but not in areas where cars are not a choice but a necessity due to a lack of accessible public transport option (e.g. in rural areas):
- “People who live in rural or isolated locations. It’ll be a struggle to get to public transport. I think it will be unfair to put charges on them when they don’t have an option.” (Participant, phase 2, workshop 2)
- Ensuring that funds raised through RUC are spent on public transport improvements, which highlighted the importance of transparency in the policy for the public to trust it:
- “The money raised needs to be used to directly improve the transport system rather than being gobbled up by the government.” (Participant, phase 2, workshop 2)
It was broadly felt that RUC would be acceptable to the public if they understood why it was being introduced and what the benefits would be. However, there was some opposition to the principle of RUC on the basis that it would restrict peoples’ autonomy. It was felt that this would impact those on lower incomes most, as they might have to make decisions based on where they can afford to travel to, while higher earners could absorb the cost and not have to change their behaviour, thus exacerbating current inequalities.
Views on UK national road pricing
UK national road pricing was introduced as a possible approach to RUC that would cover all of Scotland’s roads and involve a charge on drivers based on distance driven, as described in the following table: (see figure 9.3).
|
Option 1 – UK national road pricing |
|
A number of benefits to this approach were identified, such as cleaner air, improved health and wellbeing, and encouraging greater uptake of public transport.
Participants noted that the money raised would be invested in improvements to public transport and active travel infrastructure. It was agreed that this should be prioritised in rural areas where public transport was widely perceived to be less available and accessible.
“A good thing about it is that the money raised is put towards public transport. If the money is invested into rural areas, that’d be really good. That’s where the money should go because they need transport.” (Participant, phase 2, workshop 2)
Consideration for different circumstances
Reflecting one of the recurring themes from phase one, participants felt strongly that an approach like this would need to take account of different circumstances. It was reiterated that a charge on people living in rural areas who are reliant on their cars to access services would be unfair due to the lack of alternative options available to them.
“It would be unfair for those that live in rural areas to pay the same when they don’t have a choice in transport.” (Participant, phase 2, workshop 2)
Participants also discussed the impact on people they knew who travel long distances across the country as part of their jobs. With the prospect of national road pricing, it was felt that they would struggle to absorb these charges.
Participants noted from the scenario description that costs would vary depending on certain factors, such as the user’s disability status, and this was broadly welcomed.
“People who are dependent on cars with disabilities, there should be nothing stopping them using their cars, but people who could make small adjustments to their lifestyle, they should just have to bite it” (Participant, phase 2, workshop 2)
To ensure that national road pricing takes account of different circumstances, it was agreed that there should be clarity around who the charge applies to.
Who would be impacted more?
While it was felt that David and Sarah (a couple living on the outskirts of Glasgow with their two children) could afford the charges and make small adjustments to their lifestyle to reduce car use, it was also recognised that there would be circumstances where they would need their car to care for their disabled son and that they shouldn’t be limited in this circumstance.
This approach was also considered to be unfair for Nadeem (a rural builder), who would not have a choice but to transport his equipment and materials by van and incur the charge.
Balancing incentives and disincentives
When looking at national road pricing, there was some surprise among participants that EV users would not be exempt from the charge. There were mixed views on the fairness of this. On the one hand, it was felt that applying road pricing to EV users would act as a disincentive and would contradict other messaging that encourages drivers to switch to EVs. This concern was tied to a broader wariness around the potential that consumers would be faced with costs from multiple different angles.
“They’re trying to force you to buy an electric car, but once everyone has got an electric car, they’ll change the rules. As a consumer, I just pay, pay, pay.” (Participant, phase 2, workshop 2)
On the other hand, it was felt that EVs should be charged as they would still contribute to emissions through the manufacturing process, to wear on the roads. It was also felt that owners of EVs were more likely to be higher earners and therefore could afford the charge. If the objective is to reduce overall journeys by car, then exempting EVs would not help in achieving this.
It was suggested that this form of RUC would be fairer if EVs were charged less than petrol/diesel cars to encourage lower carbon choices, while also encouraging people to rely less on their cars overall.
“You could say you could be charged reduced rates for that purpose. You are contributing less compared with other people, so that could be one way around.” (Participant, phase 2, workshop 2)
How the charge is paid
The indicative cost of 3-10p per mile driven drew mixed responses. For some this amount was felt to be too low to have the desired impact, while others felt increasing the charge would place an unfair financial burden on people who are already struggling. It was suggested that charges could be increased over time to target those who choose to absorb the cost and continue to drive.
Participants also had questions around how drivers would be expected to pay the charge. It was highlighted that a one-off annual charge could come as a shock to some drivers and would be harder to pay in one go. Instead, participants suggested that the costs should be paid in instalments to ease any financial pressures.
It was also suggested that the charge could be lower (or lifted) during the night to ensure those working night shifts have more choices available to them. This was considered important in the case of people who may not feel safe using public transport at night.
“I think there are different circumstances between somebody travelling to work and somebody travelling for leisure. I’m not sure how you would separate the two for making a charge.” (Participant, phase 2, workshop 2)
Who would be impacted more?
When considering this approach in relation to Alice (a nurse living in a city), the safety concern around her using public transport for night shifts was discussed.
While one view was that Alice has the choice to drive or take public transport available to her and so it would be fair for her to pay the charges, another view was that it would be unfair for her to have to choose between her safety and her finances.
Building on the concern raised about mixed messages, rules changing over time, and the costs for consumers continuing to mount up, it was felt that any changes introduced should be for the long-term.
“If you’re going to have a just transition, make it sensible for the consumer and don’t make the consumer pay more and more.” (Participant, phase 2, workshop 2)
Views on urban local road user charging
Urban local road user charging was introduced as another possible approach to RUC that would involve a charge to drive into specific parts of an urban area, as described in the following table: (see figure 9.4).
|
Option 2 – Urban local road user charging |
|
This approach was considered to be fairer than national road pricing. While delivering the same benefits (e.g. cleaner air and improved public transport), participants also expected this approach to be implemented in areas where alternatives – such as public transport and park and rides – would be readily available. Participants were also reassured that similar systems had already been implemented in other cities.
“This one is targeting particular areas and not all journeys. You’re given an option to use your car or public transport to get into the city.” (Participant, phase 2, workshop 2)
Who could be impacted less?
This approach was considered fairer for Nadeem, as it was assumed that he would not be travelling into areas where RUC was in place and his rural building business would therefore be unaffected.
For David and Sarah, while it was recognised that RUC would likely affect them, they would have alternative public transport options available to them as they lived in a large urban area.
Offering alternatives
Reiterating earlier discussions around the importance of providing alternatives, it was strongly felt that adequate public transport infrastructure would need to be in place before RUC was introduced to an area.
“I think it would have to be done once the developments on public transport were completed and once the government had good confidence that public transport is efficient.” (Participant, phase 2, workshop 2)
Exemptions
Participants queried how those who live within the charging zone, or travel in and out of it for work, would be treated. While it was felt that some businesses would be able to absorb the costs or find alternatives, it was perceived to be unfair on those who already live or work within the RUC areas. There was broad agreement among participants that exemptions would need to be made for such groups. Similar to national road pricing, it was felt that some EVs should also be exempt, such as those used for work purposes.
“If you’re already living in an area and then you suddenly get told you’re going to have to pay £5 or £15 any time you take your car out purely because of where it is, I would say that would be quite unfair.” (Participant, phase 2, workshop 2)
Urban area differences
The definition of an “urban area” was also scrutinised, with a distinction drawn between cities like Glasgow or Edinburgh, and cities like Inverness. Inverness was considered to be a city that connects people by transport in rural areas to the rest of Scotland. If local road user charging was introduced here, there was a concern that it would limit the mobility of those living in the surrounding rural areas. This added to the concerns raised earlier about not taking a blanket approach, but considering different circumstances.
“In Inverness, you wouldn’t just be restricting the city centre, you’d be restricting other areas outside of that. Inverness city centre is a connecting point to get to other areas. I can’t see this working [there].” (Participant, phase 2, workshop 2)
What needs to be in place for Road User Charging to be fair?
Participants identified a number of conditions that would need to be in place to make Road User Charging fair (see conclusions section). In reaching their conclusions participants were broadly accepting of the principles of Road User Charging, based on the view that it could help encourage some of the significant changes needed for Scotland to reach its net zero targets.
A more exceptional view was that it would be difficult (and for one participant, impossible) to make RUC fair. Participants drawing this conclusion considered there to be too many variables to consider, and were concerned that RUC would ultimately deepen inequalities by limiting the choices of those less able to afford the charges.
“I can imagine if you’re already living hand to mouth, it would be very stressful to keep track of all your miles and try and work out exactly what you’re going to be paying.” (Participant, phase 2, workshop 2)
Appendix 2 – Built environment and construction sector detailed findings
This chapter outlines participants’ views on a just transition in the built environment and construction sector. It provides detailed findings from both phases of research:
- Phase one, where a group of 30 people living across Scotland met over six online workshops and an online community to consider what a fair distribution of costs and benefits would look like. It focussed on three sectors, one of which was the built environment and construction.
- Phase two, where a group of 20 people living across Scotland met over three online workshops to explore specific policy options One of those workshops focussed specifically on the built environment, including the transition to clean heating systems in domestic properties.
Summary of findings
The vision for the built environment and construction sector was viewed positively, but also as overwhelmingly ambitious. Participants felt costs should be shared between:
- The construction sector
- Multiple property owners
- Homeowners
- The Scottish Government
To ensure a fair transition, and that everyone benefits , it was suggested that:
- Those who profit from buildings should pay for the work needed to make them adequately energy efficient.
- Costs should be distributed based on ability to pay, which could include a means-tested approach to payment. Having more than one property was viewed, by some, as an indicator of wealth and that such individuals could afford to pay for changes to their properties.
- Landlords have a responsibility to pay for their properties and there should be regulation to ensure they do so without passing on costs to tenants.
To ensure the heat transition is paid for in the fairest way possible, it was concluded that:
- There should be support available to all households but that the amount of support should vary depending on circumstances, with those on low incomes and those with older properties entitled to the most government funding.
- There should be protections in place, such as exemptions from penalties for vulnerable groups, rent increase caps to protect renters, regulation on the installation of new heating systems, and a fair appeals process.
- Other considerations included careful consideration around loans to avoid pushing anyone into financial hardship, reassurances around the efficacy of new heating systems, and clear communication with the public about the changes required.
What changes were expected?
Early in each phase, participants discussed the changes they thought would be needed for the built environment and construction sector to reach net zero. Their suggestions covered people’s homes, commercial or public buildings, and the broader construction sector, including:
- Phasing out use of fossil fuels, for example shifting from gas and oil to cleaner heating systems in homes.
- More energy efficient buildings.
- Using more sustainable materials in construction.
- Increased regulation on standards and location of new builds, including ensuring buildings were weather-proof.
One of the key challenges participants identified at this stage was with retrofitting existing buildings. They felt this would be difficult due to the age and characteristics of a property (e.g. whether it would be possible to install cavity wall insulation), location (e.g. there was a perception that heat pumps did not work well in all environments), and the potential cost and disruption caused by making adaptations.
“It [is] easier to address environmental and energy issues when building new houses, most of the problems arise when we try to improve these issues in older housing stock. It means prohibitive costs to change heating systems and insulate old buildings. Who is going to pay for this?” (Participant, phase 1, online community)
Potential challenges were also raised specifically in relation to rural communities due to the nature of the existing housing stock, the climate, and the availability of skilled workers.
On heating systems specifically, participants raised concerns about the upfront cost, their perceived suitability for some properties (e.g. apartments with limited external space or coastal properties), and the efficacy of such systems based on what they had heard. One participant, who had seen planning applications for heat pumps as part of their job, highlighted that the process of installing can also be difficult.
“I’ve heard a lot of bad press about heat pumps not working properly […] I’ve heard people have installed them and removed them and gone back to boilers as they couldn’t get their house warm enough. It would be off-putting if you’re going to spend thousands.” (Participant, phase 2, workshop 3)
In discussing their expectations for the sector there were early suggestions of financial support for homeowners to make changes to their property in the form of means-tested grants.
Reactions to the initial presentations in phase one
Phase one participants heard a presentation outlining the Scottish Government’s vision for the future of the sector, the types of changes that would be needed to achieve it, and the benefits and challenges associated with decarbonising the sector. A second presentation then outlined the inequalities within the sector that would need to be addressed as part of the transition to net zero.
Echoing many of the sentiments raised in earlier sessions, some participants mentioned feeling overwhelmed about the scale of the challenge in terms of cost, feasibility of retrofitting, and extent of upskilling required.
“It will be difficult to bring current homes up to standard, mainly due to costs…I have an older, solid stone house, which is a nightmare to heat. It’s not on the gas grid, but uses electric and coal. It comes down to funding for me.” (Participant, phase 1, workshop 3)
In their initial reactions to the presentation, participants suggested that those profiting within the sector (landlords, energy companies, and construction companies) should bear a greater share of costs than the public should. Having heard about the costs associated with changes such as heat pumps, participants felt that financial support from the Scottish Government would be needed to help homeowners to afford those changes.
Participants also stressed the importance homeowners receiving trustworthy advice regarding the changes required to their properties, and of contractors carrying out high quality work. The need for regulation in the private rental sector was highlighted, as a way of ensuring that landlords did not pass on the cost of upgrades to tenants.
Vision for the built environment and construction sector discussed in phase one
Phase one participants had a chance to view a future vision for the built environment and construction sector on the online community and again in the workshop. The vision (shown in figure 10.1 below) was based on the Scottish Government’s discussion paper for the sector. As well as sharing their own views on the vision, participants revisited the five fictional characters (show in figure 10.2) and discussed how it might impact on them.
Figure 10.1. Vision for the built environment and construction sector

The role of the built environment for our characters
Alice lives in a three-bed flat with two friends. They rent from a private landlord and share responsibility for bills. The flat has electric heating. It has double glazing but is drafty and has poor insulation. She hopes to buy her own property when she has saved enough money.
David and Sarah live in a semi-detached house which they own. Their home has an EPC B rating. It has gas central heating, double-glazing, and loft and cavity wall insulation. They own a second property, which they rent out. This property lacks insulation and has an EPC D rating.
Lorraine lives in a 1920s home. It does not have central hearing. She uses a wood burning stove and electric storage heaters. She has external wall insulation, but the home still has a low EPC E rating. Her daughter wants to work in construction but there are not many local training opportunities.
Maria lives in a ground floor flat which she rents from the housing association. The flat is in a flood risk area. She requires a minimum level of warmth, meaning her heating is used all the time. The flat has an EPC C rating, with double glazing, central heating and loft insulation.
Nadeem and Ajay live in semi-detached property. The property has solar panels and a ground source heat pump. Nadeem is a builder and is working on more new builds. He feels he needs training on new construction techniques for him and his staff.
Who could benefit?
Participants identified groups who would benefit from the vision, provided certain measures were in place. The construction sector was identified as potentially benefitting from the additional work involved in retrofitting buildings, which could lead to profit and the creation of new jobs. Participants noted that construction firms that were already working in line with the vision would find the transition easier than those having to change practices.
“Most of the cost is in retrofitting older buildings. If you build a new building already to high standards the costs are reasonable. You could factor in a heat pump at the beginning. I think the building industry is perfectly able to adapt to that with minimal challenge.” (Participant, phase 1, workshop 3)
Participants felt that those currently living in an energy inefficient home would benefit from the energy efficiency improvements proposed under this vision. It was suggested that homeowners who could afford to make those changes would likely find this aspect of the transition easiest. It was felt that home buyers would benefit from new builds being built to high energy efficiency standards, as long as those new homes were affordable.
Participants also felt that social renters might face fewer challenges in implementing the changes needed, which was based on a perception that responsibility for making upgrades to their homes would lie with providers of social housing, such as the council. However, they also noted that a drawback for social renters was their lack of control over these types of decisions and that they would have to rely on providers of social housing to make improvements. There was equally a concern that private landlords would pass cost on to tenants.
Who benefits?
Nadeem was identified as benefitting from an increase in work for the construction sector and from training opportunities available on new construction techniques, provided these are accessible to him and his staff.
Alice would benefit from improved energy efficiency, provided upgrades were carried out by her landlord and that additional costs associated with this were not passed on to her. She would also benefit if she was able to afford a high-quality new build.
Maria was also identified as benefiting, if the housing association carries out upgrades and if appropriate measures were introduced to reduce the risk of flooding to her property.
Who could be negatively impacted?
Participants felt that there was potential for homeowners to be negatively impacted if they found energy efficient improvements unaffordable. There was specific concern about middle income earners, who it was felt might not qualify for financial support towards making their homes more energy efficient, yet may not be able to afford those changes.
“The asset rich cash poor single homeowner is going to be the one that’s hit most. You apply for the grant and they’ll say you have a pension and savings but, you can’t access it in the same way a council tenant can.” (Participant, phase 1, workshop 3)
Participants also felt that there would generally be higher costs associated with living in a rural area, which would impact on ability to afford upgrades. For example, it may cost more to transport construction materials to rural areas.
There was concern that new builds with very high energy efficiency standards would be more expensive which would affect home buyers or self-builders’ ability to afford a new property.
As well as barriers related to costs, participants also noted that it may not be possible to upgrade certain properties due to their age or location (e.g. listed buildings) meaning people living in these properties would not benefit from the vision. There was also concern about the possibility of property owners receiving bad advice about upgrades or work not being carried out to a high standard.
While the construction industry was identified as benefitting overall, participants emphasised that some workers could lose out if there were no local training opportunities available to them, or if they would find it difficult to reskill given their age or need for financial support.
Who could be negatively impacted?
Lorraine was identified as at risk because her property had a low EPC rating and would likely require a lot of work to make it energy efficient, which she may not be able to afford.
Reflecting the points raised above, it was felt that Alice was at risk of losing out if her landlord increased her rent to cover the costs of changes to the property. This would also affect her ability to save for a new property, especially if very high energy efficiency standards led to increased costs for new builds.
Phase one conclusions on a fair distribution of costs and benefits
As we transition to net zero, who should pay for the changes needed in the built environment and construction sector?
In the workshop, the types of costs covered by the expert speakers included those associated with the construction of new buildings, those required for the retrofitting of existing buildings (e.g. through insulation or heat pumps), and the training and reskilling of the construction workforce. Participants discussions therefore centred around these broad cost categories.
As with the transport sector, there was a sense among participants that the costs of transitioning to net zero should be shared and that no single organisation or group should bear sole responsibility. Groups that participants felt should contribute to paying for the changes included:
- The construction sector. As noted above, it was felt that the buildings and construction industry was likely to benefit from the changes needed to reach net zero, due to demand for new homes and the retrofitting of existing homes to bring them up to standard. As the industry would likely profit from an increase in demand, it was considered fair for them to pay a share of the costs. In particular, it was felt that the industry should bear the cost of reskilling the workforce, as this would ultimately benefit them (though some suggested that the Scottish Government and colleges or universities should also share some of this cost):
“The companies that are building the new properties should bear a reasonable chunk of [the cost] because they’re going to profit from selling the properties. And they have a duty to bring the properties up to some sort of [standard].” (Participant, phase 1, workshop 3)
- Those owning rental properties. There was an expectation that social landlords would bear responsibility, and therefore the cost of making changes. Further, there was a strong feeling that private landlords should pay to bring those properties to a suitable energy efficiency standard. Similar to the views about the construction industry, it was felt that those generating profit from the property market should and could pay for changes needed, and that they should be held responsible for ensuring properties reach the necessary standard of energy efficiency:
“If they can generate profit from just owning [an additional property], they should be expected to maintain the same or higher standards than private owners or council flats.” (Participant, phase 1, workshop 3)
- Homeowners. It was generally accepted that homeowners should contribute to the costs of making changes to their properties, as this was seen as part of the responsibility of owning a property. As the cost of making changes would potentially be very high, it was suggested that financial support should be made available for homeowners, ideally in the form of grants or interest free loans. Some felt that homeowners may benefit financially in the long term, as making the improvements to the property may save money on bills or increase its value, although this would depend on local circumstances. A tiered system of payment was therefore suggested, reflecting ability to pay and other circumstances (explained further below in relation to systems of payment):
“I think that low or no interest loans would be welcomed. It’s taken me this long to put together a 5% deposit. I’ve done the biggest bunch of [saving] that I can do … that would take the pressure off me.” (Participant, phase 1, workshop 3)
- The Scottish Government. Due to the scale of changes required to buildings (e.g. one of the expert speakers noted that almost 2 million homes will need retrofitting) and the level of costs (e.g. installing a heat pump was described by one of the experts as potentially costing up to £15,000 for some households), it was felt that individuals would require support from the Scottish Government. Some participants shared their own experiences of looking into heat pumps, saying that they were unable to get them because they were prohibitively expensive. Government support towards this, and other costs associated with retrofitting, was therefore considered necessary:
“I don’t think it’s doable to pay for this all on our own. Obviously this is something we all want and it needs to be done. But there does need to be funding or grants to help people.” (Participant, phase 1, workshop 3)
How can we make sure that system of payment is fair?
In discussing fair systems of payment, two clear themes emerged:
- First, that the built environment was complex, with many different players involved and different circumstances to be considered. As such, it was felt that while collective action was required to help reduce the emissions from our buildings, there was no “one size fits all” approach to covering the costs.
- Second, that those who were unable to afford the changes, particularly those on lower incomes, should be provided with support. Of the potential systems of payment discussed in the workshop and online community, the approach that was met with most support was one based on addressing inequality and ensuring that those on lower incomes did not get left behind.
There was at least some level of support for the following systems of payment:
- Ability to pay. It was felt that individuals all have a part to play, but there should be a tiered, perhaps means-tested, approach to payment. This would mean that those most able to afford changes would make higher contributions, potentially through a tax-based system of payment. There was some discussion of the pros and cons of means testing given the bureaucracy this would require, balanced with a need to act quickly in order to reach net zero by 2045.
“The people who build the biggest and poshest houses, there should be some kind of tax on them to help insulate the people at the bottom of the market… A bit of taxation redistribution there would be useful.” (Participant, phase 1, workshop 3)
- Profit-sharing. As noted above, a strong sentiment in the workshops was that those who made profit from buildings (both from their construction and from leasing them to tenants) could and should pay for the work needed to make those buildings adequately energy efficient.
- Number of properties. Having more than one property was viewed, by some, as an indicator of wealth and that such individuals could afford to pay for changes to their properties. However, some challenged this by saying that having a second home did not automatically mean that they could cover the high costs of installing heat pumps or similar measures.
“Unless there are solid reasons why the individual owns more than one home, then they should incur more cost and inconvenience than those living in properties which are appropriate to their needs.” (Participant, phase 1, online community)
- Ability to make changes. Linked to the point above, it was felt that landlords (both private and social) have a responsibility to pay for their properties, and that tenants should not be obliged to cover the costs. It was seen as unfair for landlords to pass the costs of improvements on to tenants – otherwise, the already challenging costs of renting and attempting to purchase a home would become even more prohibitive. This led participants to suggest regulation of private landlords to ensure they bring their properties up to standard and prevent them from passing these costs on to tenants.
“If they talk of passing on costs to the renter, if there are not things like rent controls, then the housing situation will become so bad that no one will be able to afford to live anywhere.” (Participant, phase 1, workshop 3)
- Some participants with experience of renting or owning a property within a building with shared ownership felt it would be unfair if they had to pay costs that they had not agreed to or that would not be borne by social renters.
Opinion was split on whether a payment system based on level of emissions (i.e. with those living in higher emitting homes paying more) was fair. On the one hand, there was a view that property owners who had neglected to make the necessary changes should, after time, be obliged to pay more. On the other hand, there was a view that those in less energy efficient properties may also be those with the lowest incomes, they should not be penalised for not being able to afford the changes needed. Indeed, it was suggested that these properties should be prioritised for support.
“Some houses are not able to have all the new fancy equipment and insulation fitted to them… people living in such buildings should be offered more help and not penalised. However, that being said if such houses have refused to update their homes and continue to use excessive carbon emissions without trying to cut down then, yes, they should pay more.” (Participant, phase 1, online community)
Participants also recognised that building standards have changed over time so it would not be fair to penalise owners who have “inherit[ed] decisions made by previous owners…that were taken in good faith”. More broadly, participants emphasised the need to consider links between sectors when it comes to an overall system of payment.
“I suggest a nuanced, means-tested approach, which is tailored to each person’s circumstances. I also suggest that this approach takes into account the overall carbon emissions caused by an individual’s lifestyle…Treating these as separate issues seems to be missing the point.” (Participant, phase 1, online community)
How can we make sure that everyone benefits?
To ensure everyone benefits from the transition, the general feeling was that appropriate financial assistance should be provided to those on lower incomes and those with particular support needs (on account of their age, health, or disability). Participants therefore suggested financial support for homeowners to retrofit their properties, ideally in the form of a government grant reflective of ability to pay.
Other specific suggestions included assistance in the form of a scheme similar to ‘Help to Buy’ but for energy efficient new builds, and a loan encompassed with mortgage to help owners replace heating systems.
“The people who will find it most difficult are the people that have been in their family home for 40 years and it’s their responsibility to fit it. The support seems patchy for people trying to make these changes…so ultimately homeowners need the most help.” (Participant, phase 1, workshop 3)
Protecting private renters was also seen as important. It was felt that private renters may be at risk of being left behind if the focus of support was on homeowners. Their concern that some landlords may not be able to afford to make the changes required to their rental property (e.g. if also making changes to the home they live in), therefore leaving renters in energy inefficient properties. To make sure that renters benefit from the changes, there was a suggestion of both regulation for landlords (outlined above) and financial support if necessary.
The importance of awareness raising was also highlighted as a way of ensuring everyone benefits. Specifically, it was seen as important to ensure that everyone understood the EPC rating system, what changes they would need to make to achieve the new requirements, and what support would be available.
Finally, it was noted that rural areas may need different solutions and retrofitting may be harder in rural properties. Several factors were highlighted including age of property, local climate, availability of tradespeople, and additional costs or logistics associated with each of these factors. The importance of adapting to the needs of rural areas was therefore highlighted as a way of ensuring people living in rural areas are not left behind and that people are not discouraged from moving to a rural community.
Exploring policies related to heating systems in phase two
In phase two, participants discussed the transition to clean heating systems in domestic properties (i.e. homes that people live in, whether owned, private-rented, or social-rented) and considered two possible approaches for funding and implementing this:
- Widely available public funding, with stricter penalties for non-compliance.
- Targeted public funding, with softer penalties for non-compliance.
Participants explored each approach through scenario-based discussions and considered the implications for different people living in Scotland (using the same characters from phase one of the research).
Initial views on the idea of a clean heat transition
Before the two approaches were presented, participants shared their initial thoughts on the idea of transitioning domestic properties to clean heating systems and making energy efficiency improvements in principle.
The Scottish Government support currently available for people switching to clean heating systems (in the form of grants and interest free loans) was viewed positively and the timescales for this (i.e. prohibiting polluting heating systems by 2045) were considered reasonable. However, several practical questions were raised around: how homeowners and landlords would go about installing clean hearing systems ; how suitable they would be for some types of properties (one participant had used support from Home Energy Scotland and was advised that a heat pump was not viable); how listed buildings would be protected; and what the ongoing costs of clean heating systems would be.
The energy efficiency improvements were also viewed positively in terms of the impact they would have on properties’ ability to retain heat. These changes were also considered to be easier, cheaper and more manageable to make than the heat system changes. However, participants questioned the availability of tradespeople, with one participant having been unable to find someone to install loft insulation despite receiving support for that.
Some broader themes also emerged that remained prominent through later discussions:
- Concerns around the upfront costs and the impact on certain groups (e.g. students, elderly people, those with disabilities or health conditions, people with older properties, landlords[24] having to absorb the costs, and tenants who might be subject to rent increases).
- A view that grants should be limited to those on low incomes or those in older properties who have to make the biggest changes.
- A perception that rent freezes or caps would be necessary to prevent renters experiencing the shock of sudden rent increases.
- An appetite for more evidence from trials and system comparisons to reassure people that the solutions proposed are the right ones and are for the long term.
Views on widely available public funding
Participants considered a scenario in which Scottish Government grants and loans would be available to all households to improve energy efficiency and install a clean heating system. In this scenario, there would be penalties for non-compliance by the deadlines set out (see figure 10.3 below).
Figure 10.3: Widely available public funding with stricter penalties

It was felt that widely available funding would prompt more people to be proactive and make changes to their homes earlier rather than waiting until the last minute. This, coupled with stricter penalties, was considered an effective way of encouraging people to switch.
The fact that exemptions would be in place for some homeowners based on certain circumstances was “heartening” for participants. It was felt that people with disabilities, health conditions, pensioners and people living in older properties (who would find the changes most difficult) should be exempt. Participants were also supportive of an appeals process being in place to enable people to challenge penalties.
Who would be impacted more?
Participants identified Lorraine (a rural farmer with an older property) as someone who should be exempt. In her case, being exempt was felt to be important to protect her from further financial precarity, as an older person living in an older property who was already paying off debts.
Participants were also reassured by the fact that tenants would be protected from rent increases, although there were some concerns raised about landlords ignoring the regulations or exploiting loopholes (e.g. by increasing rents before making the required changes).
Deadlines and penalties
The 2028 deadline for private landlords making home energy improvements was felt to be too close, and that introducing penalties without a longer notice period would be unfair. While some welcomed the fact that landlords would not be able to pass along additional costs to tenants, others raised concerns about the potential consequences of this. One participant highlighted the risk of landlords (including her own current landlord) deciding to sell in response to the 2028 deadline, penalties and restrictions, which would mean fewer homes available to rent.
“Very many landlords will simply sell their properties rather than fork out such a large sum of money, this will, of course remove even more homes from housing stock when there is already a housing crisis.” (Participant, phase 2, workshop 3)
The 2033 target for homeowners to make energy efficiency improvements was also considered too soon. For this funding approach to be made fairer, participants suggested that homeowners and small business landlords should be given more time to make the necessary changes before penalties are introduced. Exemptions from penalties were also considered to be fair if homeowners and landlords could demonstrate that they had made some effort towards meeting the targets or that they cannot afford to make them.
“If you make an effort and don’t achieve the target, it seems unfair to give you a penalty. The people who do make an effort and achieve it, fair enough. It depends if the target is achievable or not. Be fair about it all and make the target reasonable and achievable.” (Participant, phase 2, workshop 3)
The 2045 deadline for clean heating systems to be installed, however, was considered too far away. There were concerns that this timescale would not provide enough motivation for people to act quickly.
“How are you going to get people interested at all when the penalties don’t kick in for another 20 years?…It feels too distant.” (Participant, phase 2, workshop 3)
While the appeals process was welcomed, there were concerns that it could be a difficult and stressful process which would be off-putting for some.
Availability of funding
The availability of funding to all households drew mixed views. Some participants felt this was unfair, as wealthier households could afford to make the changes without funding support, while those struggling financially would be reliant on support.
Other participants felt that the Scottish Government should provide financial support to everyone if the changes were being made compulsory. Broader availability of funding was also considered fairer than the alternative, as there was a perceived risk that targeted funding could lead to some households not being eligible for funding but still being put under financial pressure.
“If the government were to enforce this, I think it wouldn’t be very fair to give grants to some and some to not…If they want people to do it, they’ll need an incentive.” (Participant, phase 2, workshop 3)
There was some discomfort around the idea of people taking out loans to cover the remaining costs, particularly for those seeking to avoid loans or already struggling with debt.
“I went through my life trying to avoid debt. Taking on debt in your 80s, you’ve had a lifetime not owing anybody then because someone has decided your gas boiler is out of fashion you have to find £15,000.” (Participant, phase 2, workshop 3)
If loans were to be offered, participants agreed that long repayment plans should be available to ease any financial burdens, particularly for those paying off existing debts. Among participants who preferred targeted funding, it was felt that lower income households should be given higher grants so that they would not have to take out a loan.
“If giving you a loan, it’s on top of the debts I already have. If [repayments] don’t eat into my pay, maybe it’s manageable, but trying to squeeze the little I earn to then pay for the renovations I don’t need, it’s a bit too much.” (Participant, phase 2, workshop 3)
Trust and transparency
Discussions on the heat transition highlighted issues of trust in systems such as heat pumps and heat networks. Participants sought more reassurances around the efficacy of these systems and felt that there would need to be a campaigns on a continual basis to raise awareness among the public (using a range of methods such as letter, billboards, and social media). One participant suggested reaching people through alerts on their phones, highlighting the sense of urgency and scale required to make sure the public are aware so that they can start to prepare.
While the focus of these discussions was on homeowners and landlords making the heat transition in their properties, it was also felt that housing developers should be responsible for installing heat pumps in new builds, or connecting them to heat networks. This was linked to a broader sense that these policies were placing an unfair burden on consumers without systemic action or leadership being demonstrated by industry or government.
“They’re still putting gas boilers in. Why don’t they put heat pumps in new builds so people know how they work. It feels like it’s just the stick at the moment, there’s no carrot.” (Participant, phase 2, workshop 3)
Views on targeted public funding
Participants considered another scenario in which Scottish Government grants and loans would be available to households on lower incomes to improve energy efficiency and install a clean heating system (but not to higher income households, landlords or owners of second properties). In this scenario, there would be penalties for non-compliance on energy efficiency improvements, but penalties for not installing a clean heating system by 2045 would not be enforced straight away (see figure 10.4 below).
10.4: Targeted public funding with softer penalties

Those who preferred a more targeted funding approach saw this as fairer than the option of broadly available funding, as they felt it would support those who needed it most. As well as people with low incomes, people with disabilities were also identified as a group who should be eligible for grants.
While there were concerns raised initially that private landlords being able to increase rent would negatively impact tenants, it was also recognised that tenants could benefit from their homes being made more energy efficient, which in turn could lead to better living conditions and cheaper energy bills. It was agreed that a rent cap would be important to protect tenants from sharp rent increases.
Deadlines and penalties
As highlighted in discussions around the timescales for implementing changes in option one, it was felt that some deadlines (e.g. 2028 for landlords to meet a minimum energy standard)) were too soon and would not provide enough notice, while others (e.g. 2045 for switching to a clean heating system) were too far away and would not instil enough of a sense of urgency in the changes required.
In discussing the introduction of penalties for non-compliance, participants raised concerns that this would lead to people rushing to install the technologies before the deadline and mistakes being made. This prompted questions around how the clean heating systems would be installed and regulated.
“I think penalties scare people off more and maybe they’ll do things quickly and they’ll be done wrongly. Who’s checking these things? Are there people checking it’s done correctly? It could be a cowboy builder doing things that are wrongly done and then you get penalties for something that you thought was right.” (Participant, phase 2, workshop 3)
There was also a lack of clarity around the timings of the penalties, with some being enforced as soon as the deadline expires and others not being enforced right away. This was felt to be problematic and an ineffective way of encouraging people to act.
“If you say you’ve got to do something by 2045 but there are no consequences for not doing it by 2045, [it] doesn’t make sense. I could say anyone has to do something but if there are no consequences, do they really have to do it?” (Participant, phase 2, workshop 3)
Participants suggested that the penalties should be made clearer, but agreed that there should be some flexibility in how and when they are applied by taking the household’s circumstances into account first.
Targeted funding
Although some participants supported a more targeted funding approach, there was also a strong view that targeted funding could create financial hardship and worsen the cost of living crisis. It was also felt that targeted funding could limit the effectiveness of the policy, with those not eligible for funding being less inclined to act.
As in the previous scenario, some were not comfortable with people being pushed into any form of debt, even with some of the costs covered by grants.
“They’re saying 0% interest loans, but you’re putting a heap of people into debt, vulnerable people, young people. I think this would be quite horrible.” (Participant, phase 2, workshop 3)
There were strong views against private financing, which were underpinned by a perception that private sector organisations – and energy companies in particular – were motivated solely by profit. If loans were to be made available, it was preferable that these be Scottish Government-administered and not privately financed.
“I don’t think private sector should offer loans in the first place. The government wants you to do this so they should offer the loan themselves or provide the grant.” (Participant, phase 2, workshop 3)
While some were not comfortable with private financing in the form of loans, there was some openness to other forms of private financing, such as discounts on energy bills in return for making energy efficiency improvements. Alternative sources of funding for the heat transition were also suggested, such as a tax on the profits of energy providers.
Trust and transparency
As in the previous scenario, participants felt that there would need to be clear and comprehensive communications with the public to raise awareness of the changes that homeowners and landlords would be required to make. Building on this, participants expressed a clear appetite for these communications to provide reassurances around the reliability of the clean heating systems and the ongoing running costs as well as installation costs.
“If I knew that my energy bills were going to drop sufficiently then it wouldn’t bother me at all having to try and fund it from a low interest loan. But I would feel extremely nervous on going that it might. It’s a big jump to take just based on faith.” (Participant, phase 2, workshop 3)
Related to this was an unease around the longevity of the policy, the risk of requirements changing in future, and the cost of this to consumers in future.
“Scottish Government years ago encouraged people to buy diesel cars, and now diesel is dreadful, encouraged to install wood burning stoves and central heating, again now it’s wrong. How many times are the public expected to listen to the government and spend money converting to whatever it is only to be told within a short time that it’s wrong.” (Participant, phase 2, workshop 3)
Appendix 3 – Land use and agriculture sector detailed findings
This chapter discusses participants views on a just transition for land use and agriculture. As with the previous sector-focussed chapters, it describes initial views on changes needed, learning during the workshop, and conclusions in relation to the three questions. Policy options for the land and agriculture sector were not explored as part of phase two of the research, so the findings presented here are in relation to phase one only.
In agreement with ClimateXChange and the Scottish Government, the workshop dedicated to this sector focussed on what the transition to net zero means for food production and consumption. Recognising the scale and complexity of the land and agriculture sector, this topic was chosen as an area in which participants would be able to relate to their everyday lives.
Summary
Participants supported the move towards more climate friendly approach to food, but were concerned the overall fairness of the vision and impact on rural communities.
Participants felt costs should be shared between:
- The Scottish Government
- Farmers
- Other businesses (e.g. supermarkets)
- Consumers
- Landowners
To ensure a fair transition, in which everyone benefits, it was suggested that:
- People’s ability to pay is taken into account, with protection in place for low-income consumers.
- Farms are subsidised, favouring smaller farms with less income. Support payments should be specifically allocated towards covering the costs of reducing carbon emissions.
- Farms should be given sufficient time and opportunity to change and reduce emissions before introducing any financial impacts such as additional tax.
- Ensure that consumers have easier access to sustainable food options.
What changes were expected?
Before the workshop, participants used the online community to discuss the changes they thought would be needed for the land use and agriculture sector to reach net zero.
They anticipated changes to the way we buy and eat food. There was a widespread sense that people should eat more local, seasonal and sustainable produce, with fewer products imported from abroad. Many participants interpreted this as a climate friendly diet. It was also suggested that we may need to reduce meat consumption, especially imported meat. While it was noted that these changes would likely reduce the range of foods available, participants were generally very positive about the environmental and health benefits they could bring. However, some participants felt that it would be difficult for consumers and the wider food industry to adapt to these kinds of changes, and that this could have economic consequences.
“The range of food we have readily available may be reduced. I don’t have a problem with that and feel it is something we should make the best of in terms of reducing food miles and eating found produced as near to home as possible.” (Participant, phase 1, online community)
Changes to farming practices were also anticipated, with a strong focus on farming practices being more “ecologically friendly”. Participants suggested that there may be move towards more organic farming, vertical farming (i.e. growing crops in vertical layers) to make space for rewilding, and regenerative practices (e.g. techniques that preserve and enhance soil quality). It was also suggested that our approach to land management more broadly may need to change, with greater emphasis on tree planting, biodiversity and creation of more carbon sinks.
Participants were generally positive about the types of changes to food production described above, though some felt that food price rises for consumers were inevitable. Others emphasised that farming should be supported to become profitable without passing on costs to consumers. There was therefore support for subsidies for farmers, as food production was considered a “vital” industry, but not for “wealthy landowners”.
Overview of presentations and reactions to them
At the workshop, participants heard two presentations delivered by experts. The first outlined the Scottish Government’s vision for the future of the sector, the types of changes that would be needed to achieve it, and the benefits and challenges associated with reducing emissions in the sector. The second outlined the inequalities within the sector that would need to be addressed as part of the transition to net zero.
Participants were struck by the complexity of the topic and emphasised a need for more public education around food production and consumption. Several participants were unaware that the sector received financial support from the Scottish Government, and were surprised at the extent to which businesses relied on this subsidy (e.g. the presentations had explained that without support payments, many farms would be in deficit). This led to a feeling that many farms were financially vulnerable and in need of ongoing support, which set the context for the later discussions around who should pay.
“Farming is already so heavily subsidised. One can’t imagine it continuing in any shape or form without large subsidies in the future, unless we were to lose the farming industry…I can’t imagine the rug being whipped from the farming industry.” (Participant, phase 1, workshop 4)
There was some surprise at how much food was imported, particularly fruit (the presentation explained that 16% of our fruit was produced domestically). There was also discussion on the average age of farmers, and about the need to encourage young people into the sector.
Some participants stressed the importance of considering wider aspects of land use which they felt impacted efforts to reach net zero. This echoed their initial thoughts on changes needed and included aspects like deer management, shooting estates and carbon credits. These are explored in more detail below.
Vision for the land use and agriculture sector
Participants had a chance to view a future vision for the land use and agriculture sector on the online community and again in the workshop. The vision (shown in figure 11.1) was based on the Scottish Government’s discussion paper for the sector. As well as sharing their own views on the vision, participants revisited the five fictional characters and discussed how it might impact on them.
Figure 11.1: Vision for the land use and agriculture sector

The role of land use and agriculture (particularly food) for our characters
Alice picks things up on her way to and from work. She doesn’t have a lot of time to cook and gets a takeaway or delivery a few times a week. Alice feels that she spends too much on food. She would like to eat more fresh fruit and vegetables and better-quality meat, but these are not easily available in the shops close to her flat.
David and Sarah have a large garden. They buy locally produced food as much as they can, even if it is more expensive. They get their weekly food shop from several places. They have reserved a space at a local community allotment.
Lorraine’s farm specialises in cattle and turkeys. She is planning on making changes to the business to help reduce its emissions. These changes would increase the cost of producing food and the business would not be able to absorb these costs.
Maria gets all her food shopping delivered from the supermarket and has a strict weekly food budget. She choses whichever products are cheaper. She tries to ensure that her daughter eats a healthy diet, but this can be difficult within her budget.
Nadeem and Ajay have a vegan diet. They get their weekly groceries from the supermarket. Buying food that suits their diet is more important to them than where it comes from. Ajay works at a small food shop. If farmers increase their prices, the shop will increase the price it charges consumers.
From the outset, the potentially negative impacts of the vision on rural communities were noted, particularly in relation to the suggestion that less land would be dedicated to food production. There was a sense that crofting land would not be suitable for other uses and so crofters may lose out if they are not able to continue current practices.
“Crofting is environmentally friendly. There’s no fertiliser use, it’s a very natural way of farming and yet that’s the one that’s going to be penalised against much more intensive farming in arable areas. That’s the wrong note to hit, the wrong balance.” (Participant, phase 1, workshop 4)
There was also some resistance to using more land for tree planting. One reason for this was the perception that would reduce the potential for farmers to earn money, as they would be giving up land used for grazing or meat production in favour of forestry. Another reason was in relation to the impacts on communities, with some participants describing how plantations had led to a sense of isolation for their community and a feeling that they were “cut off” as result of being surrounded by trees.
Reflecting their initial thoughts on the changes needed in the sector, there was support for importing less and eating more local and seasonal produce, and for continued support for food producers. However, there was discussion of the difficulty of changing consumer habits, especially in the context of the cost-of-living crisis, and the challenges that some might face in accessing climate friendly food.
Who could benefit?
Under this vision, participants felt that farmers who were able to diversify could benefit if the changes resulted in a more financially sustainable business, provided there was support and advice available to help them do so.
Participants felt that consumers could see health benefits from access to more quality, nutritious produce, and if there was more education on how to cook meals from scratch. It was also felt that communities could in turn see economic benefits from more people shopping locally.
Participants felt that wealthier consumers would find the transition easiest as they could absorb an increase in food prices. Similarly, participants felt that wealthier farmers would be able to afford to make changes to their business. There was also a sense that the scale of change required for businesses in the wider supply chain (e.g. larger supermarkets, retailers and distributers) would be smaller than for food producers directly.
Overall participants recognised that consumers who were already eating a sustainable diet or businesses whose practices were already in line with the vision would find the transition easier as they would need to make fewer changes.
Who benefits?
It was felt that David and Sarah would benefit because their lifestyle choices were already in line with the vision, and they could afford to make further changes or absorb increased costs.
Who could lose out?
Participants highlighted farmers and crofters who specialise in livestock may lose out, as their ability to do so may be restricted if more land is dedicated to forestry. There was a suggestion that the vision would “decimate” these communities in the north of Scotland. It was also felt that, if farmers were growing less food, there may be knock-on impacts on others working in the food sector and potentially job losses.
Participants felt that food price rises were inevitable and therefore that people on low incomes would lose out.
“All the changes will come with a cost. We already have a lot of food banks and people struggling. Those people will be impacted even more than they are now. It’s difficult to tell what would make it fairer. How can we help the poor more than we are helping now with food banks.” (Participant, phase 1, workshop 4)
There was a view that consumers may lose out if they were not able to grow their own food (some participants, especially in urban areas, felt this would be difficult for them to do), or were not able to access sustainable produce.
“Consumers are going to miss out if there are no local food co-ops, food sharing, food communities. Some people are surrounded by takeaways and corner shops. They don’t necessarily have access to local foods because of where they live.” (Participant, phase 1, workshop 4)
Who could lose out?
Lorraine’s livelihood was identified as being at risk given the challenges of diversification and the need to increase prices to cover the cost of making changes. Her age was also noted as a factor in that she may not have time to benefit before she retires.
Alice and Maria were identified as at risk of losing out if prices increase because of their concern about the current cost of groceries. They may also struggle to access local produce; Maria because of her child care requirements, and Alice because of her shift patterns.
Nadeem and Ajay may lose out if a focus on local products means they have less choice in their diet. This could be exacerbated by additional challenges transporting goods to where they live. Ajay’s job might be at risk if the viability of the shop where it works is affected by increased prices.
As we transition to net zero, who should pay for the changes needed in the land use and agriculture sector?
The types of costs that were outlined in the presentations and that participants explored in their discussions included: the costs associated with change the way land is used and food is produced, the costs associated with the wider food supply chain and distribution network, and the costs of food for consumers.
Generally, it was felt that costs should be paid for by a balance between government, industry and consumers. Specific groups that they felt should be responsible for some of the costs of the transition included:
- The Scottish Government. Farming subsidies were described as a “practical necessity” in order to sustain the industry and keep prices affordable. It was therefore felt that some level of subsidies should continue, and that these could help to fund some of the costs associated with the transition. However, it was also suggested that not all farms should be supported to the same extent and that subsidies should vary to reflect the size and financial performance of the farm (outlined further in the next section).
- Farmers. It was felt that farmers should cover some of the costs associated with changes to land use or food production, especially if they would benefit directly from the changes (e.g. if the changes to practices helped with their operational efficiency, helped them to generate income, or added value to their business). However, participants stressed that farmers would unlikely be able to incur significant additional costs without becoming financially unviable. It was therefore felt that, as noted above, ongoing financial support for farmers would be required.
“It will have to be [supported by] the government…I don’t see it being viable without subsidies. Loads of farms will just go out of [business].” (Participant, phase 1, workshop 4)
- Consumers. There was a sense that an increase in food prices for consumers will be “inevitable” and that those who can afford to pay should share some of the costs. With this came a sense that consumer behaviour would also need to change, with more of a focus on eating a climate friendly diet. Some participants supported prices rises to encourage consumer behaviour change. However, there was a sense that consumers have less responsibility for paying for changes than other businesses as they do not have a direct say in the costs.
“We eat like kings, all of us, and we need to come back to [eating] more sustainable things.” (Participant, phase 1, workshop 4)
- Other businesses. While not a common theme, it was suggested that businesses in the wider food supply chain should also share some of the costs. In particular it was felt that large, profit-making businesses such as supermarket chains would be able to afford some of the costs (e.g. for reducing or replacing packaging), rather than farmers and consumers.
“It’s those businesses in the middle that should pay because the consumer and the farmer don’t have the money… commercial businesses who are making big profits, they should make more of a contribution to this process to make this fairer.” (Participants, phase 1, workshop 4)
- Landowners. From the outset, some participants raised issues with the current structure of land ownership in Scotland, with a perception that absentee landowners earn from large shares of land that might otherwise have been used for food production. It was suggested that these landowners should be taxed to help pay for some of the changes need to land use. As previously noted, there were also calls for wider land reform which, for some participants, was seen as inextricably linked to viability of the farming industry.
“One of the biggest factors affecting the viability of Scottish farming is land ownership…the fact that huge swathes of good land are owned by…absentee landlords leaving very little for homegrown farmers.” (Participant, phase 1, online community)
How can we make sure that system of payment fair?
While acknowledging the scale of the challenge, participants showed at least some support for systems of payment based on:
- Ability to pay. Consumers on lower incomes were seen as likely to find any increase in food costs most disruptive and difficult. Echoing findings from the transport and built environment workshops, participants therefore felt that a future system of payment should take into account people’s ability to pay and protect low-income consumers. At the same time there was recognition that placing a greater burden of the costs on wealthier households could discourage them from making good choices which may be counterproductive.
- Subsidising some, but not all, farmers. As noted above, continuation of farming subsidies was considered a fair way of helping the sector to adapt to change. It was suggested that the subsidy system should favour smaller farms with less income (and therefore less ability to pay). It was also suggested that support payments should be specifically allocated towards covering the costs of reducing carbon emissions and making farming practices more sustainable. Recognising that some farms or crofts may already be operating sustainably, there was also a suggestion that a payment system should “penalise neglect”.
“[Financial] support can help the transition but should only be given where additional costs are incurred and not where changes may actually help profitability. This is one area where justice in transition could easily be lost as large farmers, forestry companies and green investors soak up ever larger sums of public money.” (Participant, phase 1, online community)
- Taxing larger businesses. Some participants felt that payments should be covered by larger, profit-making businesses, particularly whose practices are not climate-friendly (e.g. those who import food from overseas). They suggested taxing these businesses, or having a payment system that means these businesses absorb costs rather than passing them on to consumers. At the same time there was recognition that penalising businesses too harshly could force them to leave Scotland which would risk jobs and move carbon emissions elsewhere.
“What about taxing the big business that’s importing things from faraway countries that they could get here? People like Maria [one of the fictional characters used as stimulus for the discussion] don’t really care much about where food is from and how it’s sourced, it’s just about feeding their family.” (Participant, phase 1, workshop 4)
- Taxing high-carbon products. There was some support for a “food miles tax” or other form of high carbon products tax, but only if other more sustainable food options were available and affordable. It was also suggested that a tax on food waste (for supermarkets, not consumers) would help to reduce the amount of food currently wasted. However, some participants felt that it was not fair to base a payment system on emissions as some farms emit more than others depending on their produce.
To make the transition as fair as possible, it was also stressed that farms need to be given sufficient time and opportunity to change, diversify and reduce emissions before introducing any financial impacts such as additional tax.
How can we make sure that everyone benefits?
As well as a reduction in carbon emissions, participants identified a range of potential benefits from the future vision for the sector including: health benefits of eating more locally grown, quality food; physical and mental health benefits for individuals and communities growing their own food; economic benefits of supporting local businesses (though business viability was also seen as a risk); a reduction in food waste; more job opportunities within the land use and agriculture sector; and financial benefits for farmers from diversification.
An overarching message was that financial support was required to ensure that farmers and consumers could benefit from the changes. To make sure everyone benefits, participants also felt that we should:
- Provide people with the opportunity to eat the right kinds of food. It was felt that steps should be taken to ensure that low carbons foods remain affordable for people on low incomes. It was also suggested that more access to individual and community growing spaces and food sharing initiatives may help more people to benefit from these types of food, particularly for those who do not already have access to a garden.
“Consumers are going to miss out if there are no local food co-ops, food sharing, food communities. Some people are surrounded by takeaways and corner shops. They don’t necessarily have access to local foods because of where they live.” (Participant, phase 1, workshop 4)
- Improve communication and engagement with the public. Participants felt that there was need for more awareness-raising about how the food system works, the types of changes that will be necessary, and what types of food are more climate-friendly, and how to make healthy affordable meals. It was stressed that the public need to understand why change is necessary before they can accept those changes. Participants also advocated more community and local government involvement in decision-making about land use.
- Change the system of land ownership to provide more equitable access to land. A few participants felt strongly that widescale change to land ownership was required, so that smaller farms have more opportunity to be profitable and that there were more opportunities for young people to work in the sector.
Appendices A-D: Research materials
Appendix A – Structure of workshops
Phase 1
- The first workshop introduced participants to the process and key concepts. This was followed by three separate workshops on transport, built environment and construction, and land use and agriculture. In these workshops participants learned about key issues associated with the transition in each sector and shared their views, before answering these overarching questions in relation to that sector.
|
Date/time |
Objective |
Session description |
Presentations | |
|
Session 1 – Introduction |
10 August 2023, 6pm to 9pm |
Introduction to the process and aims. Participants learn key concepts. |
Introduction to the process. Participant introductions. Presentations from expert speakers (see right). Small breakout discussions followed by Q&A with speakers. Initial thoughts on a fair transition. |
Introduction to key concepts relating to climate change, just transition, net zero and Scottish Government plans. |
|
Session 2 – Transport Session 3 – Buildings and Construction Session 4 – Land use and agriculture |
15 August 2023, 6pm to 9pm 29 August 2023, 6pm to 9pm 14 September 2023, 6pm to 9pm |
Participants develop an understanding of each sector and form initial thoughts on a fair distribution of costs and benefits for that sector. |
Presentations from expert speakers (see right). Breakout discussion followed by Q&A with speakers. Breakout discussion of future vision in relation to fictional characters. Breakout answers to the overarching questions in relation to the sector. |
Future vision for the sector. Addressing inequalities in the sector |
|
Session 5 |
30 September 2023, 10am to 1pm |
Participants consolidate their views on a fair distribution of costs and benefits and form wider conclusions on cross-cutting elements |
Breakout discussion of future scenarios in relation to fictional characters. Breakout forming conclusions on a fair transition. |
No presentations |
|
Session 6 – Conclusions |
5 October, 2023, 6pm to 9pm |
Participants review, ratify and finalise their conclusions. |
Breakout discussion on answers to the overarching questions. Reflections on the process. Postcard to the future task. |
No presentations |
Phase 2
The first workshop introduced participants to the process and key concepts. This was followed by two workshops, each focussing on a policy area within the transport and built environment sectors. The transport sector session focused on two possible approaches to Road User Charging; UK national road pricing or urban local charging. The built environment sector session focused on two approaches to funding the heat transition in domestic properties; widely available funding (with stricter penalties) or targeted funding (with softer penalties).
|
Date/time |
Objective |
Session description |
Presentations | |
|
Session 1 – Introduction |
6 March 2024, 6.30pm to 8.30pm |
Introduction to the process and aims. Participants learn key concepts. |
Introduction to the process. Participant introductions. Presentations from expert speakers (see right). Small breakout discussions followed by Q&A with speakers. Initial thoughts on a fair transition. |
Introduction to key concepts relating to climate change and the move to net zero; concept of just transition and Just Transition Plans; previous public engagement on just transition. |
|
Session 2 – Transport |
14 March 2024, 6.30pm to 9pm |
Participants learn about Road User Charging (RUC) and discuss how to ensure this is implemented fairly. |
Presentation (see right). Breakout discussion considering two approaches to RUC in relation to fictional characters. Breakout answers to form conclusions on RUC. |
Introduction to RUC. |
|
Session 3 – built environment and construction |
20 March, 6pm – 9pm |
Participants learn about clean heat transition in domestic properties and discuss how to ensure this is funded fairly. |
Presentation (see right). Breakout discussion considering two approaches to funding the clean heat transition in relation to fictional characters. Breakout answers to form conclusions on clean heat transition. |
Introduction to clean heat transition and Heat in Buildings bill. |
Appendix B – Recruitment quotas
Phase 1
The quota targets were based on data from the Scottish Household Survey 2019, unless otherwise stated. Groups that were over-sampled are indicated with asterisk (*).
|
Variable |
% in population |
Target number |
Achieved number | |
|
Age |
16-24 |
11% |
4 |
4 |
|
25-34 |
18% |
6 |
4 | |
|
35-54 |
32% |
11 |
11 | |
|
55+ |
38% |
12 |
11 | |
|
Gender |
Woman |
52% |
17 |
17 |
|
Man |
48% |
16 |
13 | |
|
Non-binary/other |
No clear data |
No target |
0 | |
|
Region of Scotland (source: NRS mid-year population estimates) |
Central |
12% |
4 |
2 |
|
Glasgow |
13% |
4 |
4 | |
|
Highlands and Islands* |
8% |
5 |
5 | |
|
Lothians |
15% |
5 |
5 | |
|
Mid Scotland and Fife |
12% |
4 |
3 | |
|
North East Scotland |
14% |
4 |
4 | |
|
South |
13% |
4 |
3 | |
|
West |
13% |
4 |
4 | |
|
Ethnicity |
African, Caribbean, Black or Black Scottish/British* |
1% |
2 |
0[25] |
|
Asian, Asian Scottish or Asian British* |
3% |
3 |
3 | |
|
White Scottish/Other British/White Other |
96% |
27 |
25 | |
|
Other ethnic group or mixed/multiple ethnic groups* |
0% |
1 |
2 | |
|
Disability |
No long-term physical or mental health condition |
70% |
19 |
16 |
|
Long-term physical or mental health condition which is limiting* |
24% |
10 |
10 | |
|
Long-term physical or mental health condition which is not limiting* |
6% |
4 |
4 | |
|
Household income, per year |
Less than £10,000* |
9% |
4 |
3 |
|
£10,001 – £20,000* |
30% |
11 |
9 | |
|
£20,001 – £30,000 |
21% |
7 |
6 | |
|
£30,001 – £40,000 |
15% |
5 |
4 | |
|
More than £40,001 |
24% |
6 |
8 | |
|
Attitudinal measure (SHS 2019): Which of these statements, if any, comes closest to your own view? |
Climate change is an immediate and urgent problem |
68% |
Aim for mix |
17 |
|
Climate change is more of a problem for the future |
14% |
7 | ||
|
Climate change is not really a problem |
3% |
1 | ||
|
None of these / don’t know |
9% |
5 | ||
|
I’m still not convinced that climate change is happening |
6% |
Excluded[26] |
0 |
Phase two
The quota targets were based on data from the Scottish Household Survey 2019, unless otherwise stated. Groups that were over-sampled are indicated with asterisk (*).
|
Variable |
% in population |
Target number |
Achieved number | |
|
Age |
16-24 |
11% |
2 |
2 |
|
25-34 |
18% |
4 |
4 | |
|
35-54 |
32% |
6 |
7 | |
|
55+ |
38% |
8 |
7 | |
|
Gender |
Woman |
52% |
10 |
10 |
|
Man |
48% |
10 |
10 | |
|
Non-binary/other |
No clear data |
No target |
0 | |
|
Region of Scotland (source: NRS mid-year population estimates) |
Central |
12% |
2 |
2 |
|
Glasgow |
13% |
3 |
3 | |
|
Highlands and Islands |
8% |
2 |
2 | |
|
Lothians |
15% |
3 |
3 | |
|
Mid Scotland and Fife |
12% |
2 |
2 | |
|
North East Scotland |
14% |
3 |
3 | |
|
South |
13% |
3 |
3 | |
|
West |
13% |
2 |
2 | |
|
Urban/rural |
Urban |
83% |
15 |
15 |
|
Rural* |
17% |
5 |
5 | |
|
Ethnicity |
African, Caribbean, Black or Black Scottish/British* |
1% |
2 |
3[27] |
|
Asian, Asian Scottish or Asian British* |
3% |
2 |
2 | |
|
White Scottish/Other British/White Other |
96% |
15 |
14 | |
|
Other ethnic group or mixed/multiple ethnic groups* |
0% |
1 |
1 | |
|
Disability |
No long-term physical or mental health condition |
70% |
12 |
12 |
|
Long-term physical or mental health condition which is limiting* |
24% |
6 |
6 | |
|
Long-term physical or mental health condition which is not limiting* |
6% |
2 |
2 | |
|
Household income, per year |
Less than £10,000* |
9% |
2-3 |
2 |
|
£10,001 – £20,000* |
30% |
6-7 |
7 | |
|
£20,001 – £30,000 |
21% |
4 |
4 | |
|
£30,001 – £40,000 |
15% |
3 |
2 | |
|
More than £40,001 |
24% |
4 |
4 | |
|
Attitudinal measure (SHS 2019): Which of these statements, if any, comes closest to your own view? |
Climate change is an immediate and urgent problem |
68% |
Aim for mix |
17 |
|
Climate change is more of a problem for the future |
14% |
3 | ||
|
Climate change is not really a problem |
3% |
0 | ||
|
None of these / don’t know |
9% |
0 | ||
|
I’m still not convinced that climate change is happening |
6% |
Excluded[28] |
Appendix C – Discussion guides
Phase one, session one
Thursday 10 August 2023, 6pm-8pm
Overarching objective: introduce participants to key concepts and familiarise them with the online discussion format and their role throughout the dialogue. Opportunity for Q&A to develop understanding before moving into focused discussion on each sector in subsequent sessions.

Phase one, session two
Tuesday 15 August 2023, 6pm-9pm. Group of 30 participants, with 5 pre-assigned breakout groups (of 6 participants each).
Overarching objective: Participants develop an understanding of the vision for a transition to net zero in the transport sector and an understanding of the costs, benefits and challenges associated with that transition. Participants provide views on the fair distribution of costs and benefits.

Phase one, session three
29 August 2023, 6pm-9pm. Group of 30 participants, with 5 pre-assigned breakout groups (of 6 participants each).
Overarching objective: Participants develop an understanding of the vision for a transition to net zero in the built environment and construction sectors and an understanding of the costs, benefits and challenges associated with that transition. Participants provide views on the fair distribution of costs and benefits.

Phase one, session four
14 September 2023, 6pm-9pm. Group of 30 participants, with 5 pre-assigned breakout groups (of 6 participants each).
Overarching objective: Participants develop an understanding of the vision for a transition to net zero in the land and agriculture sector (with a particular focus on food production) and an understanding of the costs, benefits and challenges associated with that transition. Participants provide views on the fair distribution of costs and benefits.
|
Discussion structure |
Time allocated |
Objective |
Questions and materials |
|---|---|---|---|
|
Set-up: Facilitators check-in 25 mins |
17.30-17.50 |
Set up and test tech, and team preparation |
Facilitator and tech team only
|
|
Participant check-in 10 mins |
17.50-18.00 |
Ensure participants are supported with set up |
Participants log into the online session
|
|
Introductions and context setting 10 mins |
18.00 – 18.10 |
Re-familiarising participants with the process, settling back in. |
Ipsos Chair to welcome the room back (10 mins): Participants allocated to (new) break-out groups, but not put in them.
As we transition to net zero…
|
|
Move to breakout (18.10) | |||
|
Table introductions 5 mins |
18.10 – 18.15 |
Introducing participants to new group and reflections on previous workshop. |
Break-out group introductions and warm-up FACILITATOR INTRODUCES THEMSELVES AND THE GROUP’S NOTE TAKER, THANKS FOR CONTINUED PARTICIPATION. COLLECTS PERMISSION/CONSENT FOR RECORDING.
|
|
Move to plenary (18.15) | |||
|
Future land and agriculture sector 10 mins |
18.15 – 18.25/30 |
To introduce the types of changes needed and why they are necessary |
CHAIR TO INTRODUCE SPEAKER – ASK PARTICIPANTS TO NOTE DOWN ANY THOUGHTS AND/OR QUESTIONS AS THEY LISTEN, WHICH WE WILL RETURN TO LATER Plenary presentation: Vision for a future land use and agriculture (Scotland’s Rural College) Presentation to help participants understand the land and agriculture sector, the changes that are likely to be needed, and how this impacts on food. Covering:
|
|
How different groups might be impacted by the transition 10 mins 5 minute buffer built in |
18.25/30 – 18.40 |
To help participants understand potential inequalities, that the just transition hopes to address |
CHAIR TO GIVE PARTICIPANTS A MINUTE TO REFLECT ON PRESENTATION 1 AND WRITE DOWN ANY BURNING THOUGHTS/QUESTIONS BEFORE INTRODUCING SPEAKER. Plenary presentation: Impacts of the transition on different groups (Climate Change Committee). To help participants to understand the impacts of the transition, covering:
|
|
Move to breakouts (18.40) | |||
|
Future land and agriculture sector -discussion 25 mins |
18.40 – 19.05 |
Initial views on future costs and their fairness. Opportunity to clarify any points from presentation |
We have the opportunity now to reflect on that presentation and to ask questions.
FACILITATOR TO PREPARE TOP QUESTION (WITH TWO BACK-UP). ENCOURAGE VOLUNTEERS TO ASK QUESTIONS ON BEHALF OF GROUP. |
|
BREAK |
19.05 – 19.15 |
BREAK |
Break (10 mins) Chair to present screen advising on time to return from break. TECH TEAM KEEP BREAK OUTS OPEN UNTIL END OF THE BREAK. |
|
Move to plenary (19.15) | |||
|
Q&A 20 mins |
19.15 – 19.35 |
Q&A |
Q&A in panel-style, with both presenters. CHAIR TO FACILITATE Q&A SESSION, WITH FACILITATORS ASKING THE QUESTIONS FROM THEIR BREAK-OUT GROUP OR CALLING ON PARTICIPANTS TO. |
|
Move to breakouts (19.35) | |||
|
Deliberation on key issues 30 mins |
19.35 – 20.05 |
Deliberation on key issues – changes required, impact on different groups, and how that could be made more fair |
[10 MINS] We’re now going to look at a Vision for 2040, which describes a future land use and agriculture sector. This Vision is based on the changes that the Scottish Government believes are necessary if we are to reach net zero, and some of these have been mentioned already by [the speakers]. FACILITATOR SHOWS THE SLIDE WITH THE “VISION FOR LAND USE AND AGRICULTURE IN 2040” AND READS THROUGH. REMIND PARTICIPANTS THAT THE SCENARIO IS BASED ON A VISION FOR SCOTLAND’S FUTURE LAND AND AGRICULTURE SYSTEM, PARTICULARLY HOW THAT IMPACTS ON FOOD.
[20 MINS]
SEE SLIDES LABELLED – “CHARACTERS – LAND USE AND AGRICULTURE”. SHOW THESE ON SCREEN. AIM TO COVER 2 CHARACTERS IF THERE IS TIME.
|
|
BREAK |
20.05 – 20.15 |
BREAK |
Break (10 mins) Facilitator to advice their group on the return time (back into plenary). |
|
Deliberation on key issues 30 minutes |
20.15-20.45 |
Deliberation on key issues – specific costs areas and how they should be shared fairly |
DURING THESE FINAL DISCUSSIONS ENCOURAGE PARTICIPANTS TO REFLECT ON THEIR OWN CIRCUMSTANCES, THOSE OF THE OTHER PARTICIPANTS IN THEIR GROUP, AND THE TYPES OF PEOPLE THEY DISCUSSED IN THE PREVIOUS EXERCISE. We are going to use this final discussion to bring together everything we have been discussing so far. We will do this in the same way we did in the previous session. Remember, for tonight, we’re focussing only on the changes that will be needed in the land and agriculture sector.
IF NOT COVERED ABOVE: Should the system of payment be based on:
|
|
Move to plenary (20.45) | |||
|
Feedback in plenary |
20.45-20.55 |
Participants hear from each other |
Each facilitator to give a recap on the key themes coming out of their breakout discussions – focussing on the key themes of how we share costs and benefits fairly. |
|
Close 5 mins |
20.55-21.00 |
Close |
Chair to close the day:
Thank participants and close |
Phase one, session five
30 September 2023, 10am – 1pm. Group of 30 participants, with 5 pre-assigned breakout groups (of 6 participants each).
Overarching objective: Participants consolidate their views on the costs, benefits and challenges associated with the transition and form wider conclusions on the cross-cutting elements relating to a just transition (i.e. fairness). Findings from this session will feed into the final concluding session.
|
Discussion structure |
Time allocated |
Objective |
Questions and materials |
|---|---|---|---|
|
Set-up: Facilitators check-in 25 mins |
09.30-09.50 |
Set up and test tech, and team preparation |
Facilitator and tech team only
|
|
Participant check-in 10 mins |
09.50-10.00 |
Ensure participants are supported with set up |
Participants log into the online session
|
|
Introductions and context setting 10 mins |
10.00 – 10.10 |
Re-familiarising participants with the process, settling back in. |
Ipsos Chair to welcome the room back (10 mins): Participants allocated to (new) break-out groups, but not put in them.
|
|
Move to breakout (10.10) | |||
|
Table introductions 15 mins |
10.10 – 10.25 |
Introducing participants to new group and initial discussions around fairness. |
Break-out group introductions and warm-up FACILITATOR INTRODUCES THEMSELVES AND THE GROUP’S NOTE TAKER, THANKS FOR CONTINUED PARTICIPATION. COLLECTS PERMISSION/CONSENT FOR RECORDING.
ALLOW PARTICIPANTS A MINUTE TO REFLECT ON THAT QUESTION, AND NOTE DOWN THEIR THOUGHTS ON A PIECE OF PAPER BEFORE ASKING THEM TO SHARE.
|
|
Move to plenary (10.25) | |||
|
Introduce future scenarios 10 mins |
10.25 – 10.35 |
To introduce the future scenarios |
Plenary presentation: Future scenarios (Ipsos chair) The chair will talk everyone through the future scenarios and provide a brief explanation of the plan for the remainder of the session (emphasising that it is largely over to them now to deliberate, with the help of Ipsos facilitators). An overview of the scenarios are:
Chair will explain that the scenarios are based on the sorts of changes we have been discussing in the sector sessions, and the different ways in which these changes might be brought about. The chair will emphasise that these are all things that are being considered or are already being done around the world, and are options that could be considered in Scotland. The chair will remind participants that the task is not to focus so much on how likely or desirable the changes are in Scotland, but how we make sure the costs and benefits of these changes are distributed fairly IF they were to happen. Will also emphasise that the aim is not for participants to choose the “best” scenario or decide which once should be implemented – we are using these as a way of helping participants to think differently about the three big questions we are trying to answer. |
|
Move to breakouts (10.35) | |||
|
Future scenarios – part 1 discussion 40 mins |
10.35 – 11.15 |
Exploring first scenario in detail |
SCENARIOS SUMMARY. EACH FACILITATOR TO FORCUS ON TWO SCENARIOS, BUT WITH THE OPTION TO COVER THE OTHERS WITH ANY REMAINING TIME: FACILITATORS TAKE ASSIGNED SCENARIO FOR FIRST BREAKOUT: FACILITATOR SHARE SCREEN AND GO TO FIRST SCENARIO IN MIRO, USING DIGITAL POST-ITS TO RECORD CROSS-CUTTING THOUGHTS / EMERGING CONCLUSIONS THAT ARISE DURING DISCUSSION, PLAYING THESE BACK TO PARTICIPANTS. The first scenario we are going to look at is [read title]. We’ll read through it together and then have a discussion about it. FACILITATOR READ THROUGH SCENARIO AND ALLOW TIME FOR PARTICIPANTS TO REFLECT/NOTE THINGS DOWN. Initial reactions to scenario (10 mins)
Scenario + individual impacts (15 mins) Let’s now think about this scenario in terms of your own live, if you are comfortable sharing.
Scenario + character impacts (15 mins) Now let’s look at this scenario in relation to our characters. FACILITATOR MOVE ALONG ON MIRO BOARD TO CHARACTER SUMMARY CARDS AND READ THROUGH THESE, THEN MOVE ALONG TO SCENARIO AND CHARACTERS SHOWN TOGETHER WITH ICONS. FACILITATOR REFER TO EACH BOX IN SCENARIO AND ASK:
PLACE GREEN CHARACTER ICONS ON PARTS OF SCENARIO WHERE PARTICIPANTS THINK THEY WILL BENEFIT. PLACE RED CHARACTER ICONS ON PARTS OF SCENARIO WHERE PARTICIPANTS THINK THEY WILL LOSE OUT.
LET PARTICIPANTS KNOW THAT THEY MIGHT NOT THINK ANY OF THE CHARACTERS SHOULD PAY, AND THEY CAN ADD GROUPS THAT THEY THINK SHOULD PAY USING POST-ITS (E.G. GOVERNMENT, BUSINESS, OTHER GROUPS OF PEOPLE).
|
|
Stay in breakouts (11.15) | |||
|
BREAK |
11.15 – 11.25 |
BREAK |
Facilitator sends own group on break and advises on return time (ensuring everyone gets at least 10 minutes) |
|
Stay in breakouts (11.25) | |||
|
Future scenarios – part 2 discussion 40 mins |
11.25 – 12.05 |
Exploring second scenario in detail |
SCENARIOS SUMMARY. EACH FACILITATOR TO FORCUS ON TWO SCENARIOS, BUT WITH THE OPTION TO COVER THE OTHERS WITH ANY REMAINING TIME: FACILITATORS TAKE ASSIGNED SCENARIO FOR SECOND BREAKOUT: FACILITATOR TO USE DIGITAL POST-ITS TO RECORD CROSS-CUTTING THEMES THAT EMERGE DURING DISCUSSION, PLAYING THESE BACK TO PARTICIPANTS. The first scenario we are going to look at is [read title]. We’ll read through it together and then have a discussion about it. FACILITATOR READ THROUGH SCENARIO AND ALLOW TIME FOR PARTICIPANTS TO REFLECT/NOTE THINGS DOWN. Initial reactions to scenario (10 mins)
Scenario + individual impacts (15 mins) Let’s now think about this scenario in terms of your own lives, if you are comfortable sharing.
Scenario + character impacts (15 mins) Now let’s look at this scenario in relation to our characters. FACILITATOR MOVE ALONG ON MIRO BOARD TO CHARACTER SUMMARY CARDS AND READ THROUGH THESE, THEN MOVE ALONG TO SCENARIO AND CHARACTERS SHOWN TOGETHER WITH ICONS. FACILITATOR REFER TO EACH BOX IN SCENARIO AND ASK:
PLACE GREEN CHARACTER ICONS ON PARTS OF SCENARIO WHERE PARTICIPANTS THINK THEY WILL BENEFIT. PLACE RED CHARACTER ICONS ON PARTS OF SCENARIO WHERE PARTICIPANTS THINK THEY WILL LOSE OUT.
LET PARTICIPANTS KNOW THAT THEY MIGHT NOT THINK ANY OF THE CHARACTERS SHOULD PAY, AND THEY CAN ADD GROUPS THAT THEY THINK SHOULD PAY USING POST-ITS (E.G. GOVERNMENT, BUSINESS, OTHER GROUPS OF PEOPLE).
|
|
Stay in breakouts (12.05) | |||
|
BREAK 10 mins |
12.05 – 12.15 |
BREAK |
Facilitator sends group on break. Halfway through break, tech support to close breakouts and bring everyone back to plenary. |
|
Move to plenary (12.15) | |||
|
Feedback |
12.15 – 12.25 |
Participants hear from others |
Chair invites facilitator to feedback on group discussions, briefly summarising scenarios explored and what the group’s conclusions were around how fair/unfair they are and what would need to be in place to ensure fairness. |
|
Move to breakouts (12.25) | |||
|
Emerging conclusions |
12.25 – 12.55 |
Emerging conclusions captured (preparing for final session) |
Reflections on feedback (5 mins) Before we get into our final task, I just want to get your thoughts on what the other groups have been discussing:
Forming conclusions (20-25 mins) We’re now going to revisit the discussion we had earlier about what fairness means, to help us start forming conclusions around how we ensure the costs and benefits of the transition to net zero – in each of the sectors we’ve been looking at – are fair. FACILITATOR SHARE DIGITAL WHITEBOARD AND READ OUT POST-ITS THAT WERE WRITTEN AT THE START. THEN BRING IN POST-ITS THAT HAVE BEEN WRITTEN OVER THE COURSE OF THE SESSION. Our final task is to start to tidy these up into conclusions, i.e. what we think the Scottish Government should consider as they draft the Just Transition Plans for each sector.
Revisit S1 Jamboard (5 mins) IF TIME, FACILITATOR SHOW JAMBOARD FROM SESSION 1 SHOWING INITIAL THOUGHTS ON WHAT A FAIR TRANSITION TO NET ZERO MEANS.
|
|
Move to plenary | |||
|
Close 5 mins |
12.55-13.00 |
Close |
Chair to close the day:
Thank participants and close |
Phase one, session six
5 October 2023, 6-9pm. Group of 30 participants, with 5 pre-assigned breakout groups (of 6 participants each).
Overarching objective: Participants review, ratify and finalise their conclusions.
|
Discussion structure |
Time allocated |
Objective |
Questions and materials |
|---|---|---|---|
|
Set-up: Facilitators check-in 25 mins |
17.30-17.50 |
Set up and test tech, and team preparation |
Facilitator and tech team only
|
|
Participant check-in 10 mins |
17.50-18.00 |
Ensure participants are supported with set up |
Participants log into the online session
|
|
Introductions and context setting 15 mins |
18.00 – 18.15 |
Re-familiarising participants with the process, settling back in. |
Ipsos Chair to welcome the room back (15 mins): Participants allocated to (new) break-out groups, but not put in them.
|
|
Move to breakout (18.15) | |||
|
Table introductions and ratifying conclusions on Q1 20 mins |
18.15 – 18.35 |
Introducing participants to new group and ratifying conclusions on Q1 |
Break-out group introductions and warm-up FACILITATOR INTRODUCES THEMSELVES AND THE GROUP’S NOTE TAKER, THANKS FOR CONTINUED PARTICIPATION. COLLECTS PERMISSION/CONSENT FOR RECORDING.
As the chair said, we’re going to spend most of this workshop finalising our conclusions on each of the overarching questions. As we do this, we’ll think about each of the sectors too. FACILITATOR SHARE SCREEN WITH DRAFT RESPONSES TO FIRST QUESTION: As we transition to net zero, who should pay for the changes that will be needed? This is a summary of responses that we have pulled together based on what you’ve said in previous sessions. These conclusions should be in your words, so I’m going to ask what (if anything) you’d like to change, add or take away to make sure it reflects what you think, based on what you’ve heard throughout this process. If we don’t agree on anything, that’s absolutely okay, we will discuss it as a group if that’s the case FACILITATOR TO CONTINUALLY CHECK WHETHER THERE IS AGREEMENT ON ANY CHANGES OR IF THERE ARE DIFFERENT VIEWS. IF THERE IS DISAGREEMENT, CAPTURE DIFFERENT VERSIONS TO REFLECT DIFFERENT PERSPECTIVES.
|
|
Move to plenary (18.35) | |||
|
Feedback on Q1 10 mins |
18.35 – 18.45 |
Feedback on Q1 |
Chair invites each facilitator to share screen and summarise the group’s changes / reasoning. |
|
Move to breakout (18.45) | |||
|
Reflections on Q1 edits and ratifying conclusions on Q2 10 mins |
18.45 – 18.55 |
Reflections on Q1 edits and ratifying conclusions on Q2 |
Reflecting on other edits (10 mins)
IF NEEDED, FACILITATOR TO REITERATE CHAIR’S REMARKS ABOUT HOW THE FINAL CONCLUSIONS WILL BE PRESENTED IN THE REPORT (I.E. THEY WILL REFLECT THE GROUP’S EDITS BUT ALSO THE RANGE OF VIEWS AROUND THEM, SO IT’S IMPORTANT TO HEAR FROM ANYONE WHO DISAGREES WITH PARTICULAR WORDING SO THAT WE CAN EXPLAIN THIS IN THE REPORT).
|
|
Ratifying conclusions on Q2 20 mins |
18.55- 19.15 |
Ratifying conclusions on Q2 |
FACILITATOR SHARE SCREEN WITH DRAFT RESPONSES TO SECOND QUESTION: How can we make that system of payment is fair? Moving onto question 2, this is a summary of responses that we have pulled together based on what you’ve said in previous sessions. FACILITATOR TO CONTINUALLY CHECK WHETHER THERE IS AGREEMENT ON ANY CHANGES OR IF THERE ARE DIFFERENT VIEWS. IF THERE IS DISAGREEMENT, CAPTURE DIFFERENT VERSIONS TO REFLECT DIFFERENT PERSPECTIVES.
|
|
Stay in breakouts (19.15) | |||
|
BREAK 10 mins |
19.15 – 19.30 |
BREAK |
Facilitator to advise on time to return from break |
|
Move to plenary (19.30) | |||
|
Feedback on Q2 10 mins |
19.30 – 19.40 |
Feedback on Q2 |
Chair invites each facilitator to share screen and summarise the group’s changes / reasoning. Chair introduces poll and asks participants to answer this question again: “Who do you think should take the lead in tackling climate change in Scotland?
Chair closes poll but results not shown. Chair explains that they will be presented again later. |
|
Move to breakouts (19.40) | |||
|
Reflections on Q2 edits 10 mins |
19.40 – 19.50 |
Reflections on Q2 edits |
IF NEEDED, FACILITATOR TO REITERATE CHAIR’S REMARKS ABOUT HOW THE FINAL CONCLUSIONS WILL BE PRESENTED IN THE REPORT (I.E. THEY WILL REFLECT THE GROUP’S EDITS BUT ALSO THE RANGE OF VIEWS AROUND THEM, SO IT’S IMPORTANT TO HEAR FROM ANYONE WHO DISAGREES WITH PARTICULAR WORDING SO THAT WE CAN EXPLAIN THIS IN THE REPORT).
|
|
Stay in breakouts (19.55) | |||
|
Ratifying conclusions on Q3 20 mins |
19-50-20.10 |
Ratifying conclusions on Q3 |
FACILITATOR SHARE SCREEN WITH DRAFT RESPONSES TO THIRD QUESTION: How can we make sure that everyone benefits? Moving onto our final question, this is a summary of responses that we have pulled together based on what you’ve said in previous sessions. FACILITATOR TO CONTINUALLY CHECK WHETHER THERE IS AGREEMENT ON ANY CHANGES OR IF THERE ARE DIFFERENT VIEWS. IF THERE IS DISAGREEMENT, CAPTURE DIFFERENT VERSIONS TO REFLECT DIFFERENT PERSPECTIVES.
|
|
Move to plenary (20.10) | |||
|
Feedback on Q3 edits and poll 10 mins |
20.10 – 20.20 |
Feedback on Q3 edits and poll |
Chair invites each facilitator to share screen and summarise the group’s changes / reasoning. Chair presents slide showing S1/S6 poll and comments on results/any shifts. Introduces final breakout. |
|
Move to breakouts (20.20) | |||
|
Reflections on Q3 edits, poll results and projective exercise 10-15 mins (Facilitators to judge length based on how much they say in the reflections section) |
20.20 – 20.30-35 |
Participants hear from others |
Reflections on Q3 edits (5-10 mins)
Poll results and reflections on process (5-10 mins)
IF ANY TIME REMAINING: Before we finish, I’d be interested in hearing your reflections on this process overall.
|
|
Move to plenary (20.30/35) | |||
|
Close |
20.30/35 – 20.40/45 |
Thank participants |
Chair to thank participants for their efforts over the 6 sessions, explain next steps including final online community activity (see below*), and reporting. Ipsos to thank participants and close the session. Final activity for the online community On the online community, we will ask you to write a postcard to yourself as if you were in the year 2040. Imagine you are writing back to yourself in the current moment – in 2023 – about the changes that have been made in Scotland: what has it meant for how you travel around in 2040? The house you live in? The food you eat? And how you feel about these changes? |
Phase two, session one
Wednesday 6 March 2024, 6.30pm-8.30pm
Overarching objective: introduce participants to key concepts and familiarise them with the online discussion format and their role throughout the dialogue. Opportunity for Q&A to develop understanding before moving into focused discussion on each sector in subsequent sessions.
|
Discussion structure |
Time |
Objective |
Questions and materials |
|---|---|---|---|
|
Set-up: Facilitators check-in 20 mins |
18.00-18.20 |
Set up and test tech, and team preparation |
Facilitator and tech team only
|
|
Participant check-in 10 mins |
18.20-18.30 |
Ensure participants are supported with set up |
Participants log into the online session
|
|
Introductions and context setting 10 mins |
18.30 – 18.40 |
Welcome and introduction of process |
Ipsos Chair to welcome everyone to the dialogue (10 mins): Participants allocated to break-out groups, but not put in them.
To explore the public’s views on how the changes in the transport and the built environment sectors are done fairly to ensure a just transition to net zero.
|
|
Move to breakout (18.40) | |||
|
Table introductions |
18.40 – 18.50 |
Introducing participants to group, gathering initial thoughts and feelings. |
Break-out group introductions (10 mins)
|
|
Move to plenary (18.50) | |||
|
Presentation on climate change and the move to net zero 10 mins |
18.50 – 19.00 |
Introduction to key issues around climate change and the transition to net zero |
Plenary presentation 1 (10 mins): Climate change and the move to net zero. CXC BEFORE PRESENTATION STARTS – CHAIR TO ASK PARTICIPANTS TO WRITE DOWN ON (ON A PIECE OF PAPER, OR ON THEIR PHONE) ANY THOUGHTS OR QUESTIONS WHICH THEY WILL HAVE THE OPPORTUNITY TO SHARE LATER ON. Presentation to help participants understand the key concepts relating to climate change, net zero and to outline the SG’s plans generally:
|
|
Stay in plenary (19.00) | |||
|
Presentation on just transition 10 mins |
19.00 – 19.15 5 minute buffer built in here to allow for intros/ crossover |
Introduction to just transition |
Plenary presentation 2 (10 mins): Just Transition and JTPs. Scottish Government BEFORE PRESENTATION STARTS – CHAIR TO ASK PARTICIPANTS TO WRITE DOWN ON (ON A PIECE OF PAPER, OR ON THEIR PHONE) ANY THOUGHTS OR QUESTIONS WHICH THEY WILL HAVE THE OPPORTUNITY TO SHARE LATER ON. Presentation to help participants understand the concept of just transition:
|
|
BREAK (19.15) | |||
|
Chair displays break time on screen and encourages participants to take a screen break 19.15-19.25 (10 mins) | |||
|
Return to plenary (19.25) | |||
|
Presentation on public engagement so far |
19.25 – 19.35 |
Overview of the range of public engagement already carried out |
Plenary presentation 3 (10 mins): Findings from public engagement so far. Chair, Ipsos Scotland BEFORE PRESENTATION STARTS – CHAIR TO ASK PARTICIPANTS TO WRITE DOWN ON (ON A PIECE OF PAPER, OR ON THEIR PHONE) ANY THOUGHTS OR QUESTIONS WHICH THEY WILL HAVE THE OPPORTUNITY TO SHARE LATER ON. Provide an overview of what public engagement has happened so far, and what it’s told us:
|
|
Move to breakouts (19.35) | |||
|
Reflections and question forming 25 mins |
19.35 – 20.00 |
Reflect on presentations and gather questions |
Reflections on presentations (15 mins): FACILITATOR REMIND PARTICIPANTS THAT THE PRESENTATIONS HAVE BEEN RECORDED AND WILL BE MADE AVAILABLE TO WATCH BACK AT ANY TIME. AIM FOR ABOUT 5 MINS OF DISCUSSION PER PRESENTATION. ORDER FOR GROUPS 1-2: CXC, SG, IPSOS ORDER FOR GROUP 3: IPSOS, SG, CXC
Question gathering (5 mins):
GATHER QUESTIONS FROM ANY PART OF THE SESSION AND ASK GROUP TO PRIORITISE 2-3 FOR Q&A (REASSURE THAT OTHER QUESTIONS WILL BE PUT TO SPEAKERS AFTER SESSION AND WRITTEN RESPONSES PROVIDED OVER EMAIL OR RECAPPED IN NEXT SESSION). |
|
Move to plenary (20.00) | |||
|
Q&A 20 mins |
20.00 – 20.20 |
Q&A with experts |
CHAIR TO CALL ON FACILITATORS IN TURN TO ASK QUESTIONS AND DIRECT TO RELEVANT EXPERTS |
|
Stay in plenary (20.20) | |||
|
Final reflections and wrap up 10 mins |
20.20 – 20.30 |
Final reflections and exercise |
Chair to thank experts and participants for taking part in the discussion and introduce final plenary exercise ( 5 mins) On screen, you’ll see a sentence and all we want you to do is complete this sentence in your own words based on what you’ve heard tonight. There is a character limit so try and keep it short and snappy! To me, a just transition to net zero means… Chair to comment on results before closing the session (5 mins):
|
Phase two, session two
Thursday 15 March 2024, 6.30pm-9pm
Overarching objective: To introduce potential changes to our transport system including road user charges, and to test views on different approaches to this in terms of their fairness.
|
Discussion |
Time |
Objective |
Questions and materials |
|---|---|---|---|
|
Set-up: Facilitators check-in 20 mins |
18.00-18.20 |
Set up and test tech, and team preparation |
Facilitator and tech team only
|
|
Participant check-in 10 mins |
18.20-18.30 |
Ensure participants are supported with set up |
Participants log into the online session
|
|
Introductions and context setting 10 mins |
18.30 – 18.40 |
Welcome and introduction to this session |
Ipsos Chair to welcome everyone Participants allocated to break-out groups, but not put in them.
|
|
Move to breakout (18.40) | |||
|
Role of transport in your life 15 mins |
18.40 – 18.55 |
Introducing participants to group, understanding their current transport behaviour |
Break-out group introductions and warm-up FACILITATOR INTRODUCES THEMSELVES AND THE GROUP’S NOTE TAKER, THANKS FOR CONTINUED PARTICIPATION. COLLECTS PERMISSION/CONSENT FOR RECORDING.
|
|
Move to plenary (18.55) | |||
|
Presentation on road user charging 10 mins |
18.55 – 19.05 |
Help participants understand why charging is necessary |
Plenary presentation: How can we reduce our reliance on cars? Presentation to help participants understand why we are focussing on actions related to road users and to introduce road user charging. Coverage of presentation:
|
|
Move to breakout (19.05) | |||
|
Discussion on road user charging 15 mins |
19.05 – 19.20 |
To understand overall views on charging and to set up key considerations for the discussion on specific policies. |
We have the opportunity now to reflect on and discuss your views on what you heard. We are going to look at some specific examples of road user charging later, so that we can discuss how it might work. But first…
NOTE – IF PARTICIPANTS RAISE CONCERNS ABOUT 20 MIN NEIGHBOURHOODS, OR HAVE THE IMPRESSION THAT THEY MEAN RESTRICTING WHERE WE CAN DRIVE, YOU CAN SAY: “The idea behind 20 minute neighbourhoods is to create thriving, positive places and tackle inequalities by improving access to local facilities. It is not about restricting movement or ability to travel, but is based on better provision of local services and amenities that reduce the need to travel. The idea is flexible and should be adapted to support local needs and context, and effective community engagement is a key part of it.” |
|
BREAK 19.20-19.30 (10 mins) | |||
|
Return to breakouts (19.30) | |||
|
Reviewing different charging approaches 45 mins |
19.30 – 20.15 |
To test the acceptability and fairness of policy options |
We are now going to look at how road user charging might be applied in Scotland. The Scottish Government is currently exploring options for how car demand management could be applied in future. It has carried out research exploring how different options could work, and is reviewing the existing powers that local authorities have to ensure these are fit for purpose in the future. As part of these considerations we are now interested in your views on road user charging options, including what they might mean for you and your household, and for other people across Scotland. There are two potential approaches that we are going to look at. These are based on approaches that have happened elsewhere. I am going to show you each option on screen, and after each one we will have a discussion about it. As you will see, these are fairly brief descriptions and are not shown as fully formed ideas. That is because we want to open up discussion about how approaches like these might work, how fair they feel, and what else you think should be considered. These workshops are part of the process of developing these policies, so we do invite questions and even challenge about these. ORDER OF THE OPTIONS TO BE ROTATED BETWEEN GROUPS FACILITATOR TO HAVE SLIDES THAT HAVE MOCKED-UP DESCRIPTIONS OF THE TWO OPTIONS, INCLUDING THE FOLLOWING INFORMATION: Option 1: UK National road pricing.
NOTE: If asked about how this apples to SG, explain that “The Scottish Government would be involved in discussions about future systems, and would use any evidence (such as what this group tells us) to continue to press the UK Government for a fair and progressive future transport finance system.” Option 2: Urban local road user charging.
AFTER EACH OPTION, ASK THE FOLLOWING:
CHARACTERS AFTER GOING THROUGH EACH OPTION, FACILITATOR INTRODUCES THE CHARACTERS
SHOW CHARECTORS ON SCREEN, ONE BY ONE, EACH GROUP COVERING 1-2 CHARACTERS. ORDER:
|
|
Move to breakouts (20.25) | |||
|
Conclusion-forming 25 mins |
20.25-20.50 |
To bring everything together and form conclusions |
We are going to use this final discussion to bring together everything we have been discussing so far. Working together, I’d like you answer this question: “If road user charging is introduced, what needs to be in place to make it fair?” REMIND PARTICIPANTS THAT IN THIS FINAL SECTION WE ARE TALKING ABOUT ROAD USERS CHARGING IN GENERAL, NOT ONE OF THE SPECIFIC OPTIONS ABOVE (BUT THEY CAN REFER TO THOSE IF THEY LIKE). ASK PARTICIPANTS TO COME UP WITH THREE STATEMENTS IN RESPONSE TO THIS OVERARCHING QUESTIONS. PARTICIPANTS START BY CALLING OUT THEIR RESPONSES, WHICH ARE NOTED DOWN ON VIRTUAL POST ITS. THEY THEN DISCUSS / RANK THE 3 THAT THEY FEEL ARE MOST IMPORTANT. FACILITATOR HAS THESE 3 STATEMENTS WRITTEN UP (ON THE MIRO BOARD, OR ON 3 BULLET POINTS ON A SLIDE), READY TO FEEDBACK IN PLENARY. |
|
Move to plenary (20.50) | |||
|
Feedback and wrap up 10 mins |
20.50 – 21.00 |
Final reflections and exercise |
CHAIR THANKS EVERYONE INVITES FEEDBACK FROM EACH OF THE THREE GROUPS, CONCENTRATING ON THEIR 3 CONCLUDING STATEMENTS THEY CREATED. BRIEF RECAP ON NEXT STEPS, THANK AND CLOSE. |
Phase two, session three
Wednesday 20 March 2024, 6pm-9pm
Overarching objective: To introduce changes required to transition to clean heating in homes, and to test views on different financing approaches to this in terms of their fairness.
|
Discussion |
Time |
Objective |
Questions and materials |
|---|---|---|---|
|
Set-up: Facilitators check-in 20 mins |
17.30-17.50 |
Set up and test tech, and team preparation |
Facilitator and tech team only
|
|
Participant check-in 10 mins |
17.50-18.00 |
Ensure participants are supported with set up |
Participants log into the online session
|
|
Introductions and context setting 10 mins |
18.00 – 18.10 |
Welcome and introduction to this session |
Ipsos Chair to welcome everyone Participants allocated to break-out groups, but not put in them.
Thinking about the energy efficiency of your home, which of these statements – if any – comes closest to your own view or experience?
If you were considering making changes to the energy efficiency of your home over the next decade, which of these – if any – would be the biggest factor in your decision to go ahead or not?
|
|
Move to breakout (18.10) | |||
|
Role of transport in your life 15 mins |
18.10 – 18.25 |
Introducing participants to group, understanding their current transport behaviour |
Break-out group introductions and warm-up FACILITATOR INTRODUCES THEMSELVES AND THE GROUP’S NOTE TAKER, THANKS FOR CONTINUED PARTICIPATION. COLLECTS PERMISSION/CONSENT FOR RECORDING.
|
|
Move to plenary (18.25) | |||
|
Presentation on energy transition in homes 10 mins |
18.25 – 18.35 |
Help participants understand why heat transition is necessary and options for financing it |
Plenary presentation: How can we fairly transition our homes to clean energy? Presentation to help participants understand why we are focussing on heat transition in homes and different approaches to paying for this. Coverage of presentation:
|
|
Move to breakout (18.35) | |||
|
Discussion on clean heating 20 mins |
18.35 – 18.55 |
To understand overall views on charging and to set up key considerations for the discussion on specific policies. |
We have the opportunity now to reflect on and discuss your views on what you heard. We are going to look at some specific approaches for making these changes later, so that we can discuss how it might work. But first…
|
|
BREAK 18.55-19.05 (10 mins) | |||
|
Return to breakouts (19.05) | |||
|
Reviewing different financing approaches to heat transition 55 mins |
19.05 – 20.00 |
To test the acceptability and fairness of policy options |
We are now going to look at how the transition to more energy efficient homes could be achieved in Scotland. The Scottish Government is currently exploring options for how the transition to clean heating and more energy efficient homes can be financed, recognising that it will be unaffordable to finance this through public funding alone. The Scottish Government is considering how best to make use of the public and private funding options available. As part of these considerations we are now interested in your views on approaches to paying for these changes to homes, including what different payment options might mean for you and your household, and for other people across Scotland, as well as the timescales for making changes. There are two potential approaches that we are going to look at. I am going to show you each option on screen, and after each one we will have a discussion about it. ORDER OF THE OPTIONS TO BE ROTATED BETWEEN GROUPS FACILITATOR TO HAVE SLIDES THAT HAVE MOCKED-UP DESCRIPTIONS OF THE TWO OPTIONS, INCLUDING THE FOLLOWING INFORMATION: Option 1: More widely available public financing, stricter penalties (approx. 20 mins)
*If asked about the EPC rating, facilitators to read out: An Energy Performance Certificate (EPC) gives a property an energy efficiency rating from A (most efficient) to G (least efficient) and is valid for 10 years. *If asked about penalties, facilitators to read out: For landlords, civil penalties might include a fine for not responding to a compliance notice, and the landlord may not be able to let the property after 2028 if the required energy efficiency rating isn’t met by then, For homeowners, civil penalties could include a fine if the property does not meet required energy efficiency rating by 2033. Option 1 discussion:
Option 2: More targeted public financing, softer penalties (approx. 20 mins)
*If asked about the EPC rating, facilitators to read this out: An Energy Performance Certificate (EPC) gives a property an energy efficiency rating from A (most efficient) to G (least efficient) and is valid for 10 years. *If asked about penalties, facilitators to read out: For landlords, civil penalties might include a fine for not responding to a compliance notice, and the landlord may not be able to let the property after 2028 if the required energy efficiency rating isn’t met by then. Option 2 discussion:
CHARACTERS (approx. 15 mins) AFTER GOING THROUGH EACH OPTION, FACILITATOR INTRODUCES THE CHARACTERS
SHOW CHARECTORS ON SCREEN, ONE BY ONE, EACH GROUP COVERING 1-2 CHARACTERS. ORDER:
|
|
BREAK 20.00-20.10 (10 mins) | |||
|
Move to breakouts (20.10) | |||
|
Conclusion-forming 30 mins |
20.10-20.40 |
To bring everything together and form conclusions |
We are going to use this final discussion to bring together everything we have been discussing so far. Working together, I’d like you answer this question: “If all households are going to be required to improve their home’s energy efficiency and switch to clean heating, what needs to be in place to make how we pay for it fair?” REMIND PARTICIPANTS THAT IN THIS FINAL SECTION WE ARE TALKING ABOUT CHANGES TO HEATING SYSTEMS IN GENERAL, NOT ONE OF THE SPECIFIC OPTIONS ABOVE (BUT THEY CAN REFER TO THOSE IF THEY LIKE). ASK PARTICIPANTS TO COME UP WITH THREE STATEMENTS IN RESPONSE TO THIS OVERARCHING QUESTIONS. PARTICIPANTS START BY CALLING OUT THEIR RESPONSES, WHICH ARE NOTED DOWN ON VIRTUAL POST ITS. THEY THEN DISCUSS / RANK THE 3 THAT THEY FEEL ARE MOST IMPORTANT. FACILITATOR HAS THESE 3 STATEMENTS WRITTEN UP (ON 3 BULLET POINTS ON A SLIDE), READY TO FEEDBACK IN PLENARY. (IF TIME) Reflections on the process With the few minutes remaining, I’d be interested to hear your thoughts on this process and your participation…
|
|
Move to plenary (20.40) | |||
|
Feedback and wrap up 10 mins |
20.40 – 20.50 |
Final reflections and exercise |
CHAIR THANKS EVERYONE INVITES FEEDBACK FROM EACH OF THE THREE GROUPS, CONCENTRATING ON THEIR 3 CONCLUDING STATEMENTS THEY CREATED. CHAIR CONDUCTS END OF SESSION POLL. Thinking about the changes that will be required to how people heat their homes, and your own personal view on the issues we’ve discussed this evening, which of these statements would you agree with more?
I agree with A more than B I agree with B more than A I don’t agree with either I’m not sure THANKS PARTICIPANTS FOR THEIR CONTRIBUTIONS, EXPLAIN NEXT STEPS FOR REPORTING AND THAT WE WILL SEND AN EMAIL TO CHECK PREFERENCES FOR KEEPING IN TOUCH ABOUT THAT, AND POTENTIAL FUTURE OPPORTUNITIES TO TAKE PART IN PUBLIC ENGAGEMENT ON THIS. INVITE REP FROM CXC/SG TO SAY CLOSING REMARKS. THANK AND CLOSE. |
Appendix D – Characters
The following character descriptions were provided to participants in the sector specific workshops to aide their deliberations. The characters were created by Ipsos, with input from Scottish Government and ClimateXChange, and were used as stimulus to help participants consider a range of different experiences from across Scotland. The design of the dialogue and development of characters was informed by interviews with stakeholders in each of the sectors who identified several groups who would be more likely to be impacted by the changes.
Phase 1


Phase 2


© The University of Edinburgh, 2024
Prepared by Ipsos on behalf of ClimateXChange, The University of Edinburgh. All rights reserved.
While every effort is made to ensure the information in this report is accurate, no legal responsibility is accepted for any errors, omissions or misleading statements. The views expressed represent those of the author(s), and do not necessarily represent those of the host institutions or funders.
https://www.gov.scot/publications/securing-green-recovery-path-net-zero-update-climate-change-plan-20182032/documents/ ↑
https://www.legislation.gov.uk/asp/2019/15/enacted ↑
https://www.gov.scot/publications/transition-commission-national-mission-fairer-greener-scotland/documents/ ↑
National Just Transition Planning Framework – Just Transition – A Fairer, Greener Scotland: Scottish Government response – gov.scot (www.gov.scot) ↑
https://www.gov.scot/publications/draft-energy-strategy-transition-plan/ ↑
https://www.gov.scot/publications/net-zero-nation-public-engagement-strategy-climate-change/ ↑
https://www.climatexchange.org.uk/media/4231/understanding-and-engaging-the-public-on-climate-change.pdf; https://www.theccc.org.uk/publication/the-role-of-deliberative-public-engagement-in-climate-policy-development-university-of-lancaster/ ↑
https://sciencewise.org.uk/about-sciencewise/our-guiding-principles/ ↑
https://www.gov.scot/publications/transition-transport-sector-discussion-paper/; https://www.gov.scot/publications/transition-built-environment-construction-sector-discussion-paper/; https://www.gov.scot/publications/transition-land-use-agriculture-discussion-paper/ ↑
Participants felt a fair tax system would be required, whereby those who can afford to pay a higher share. ↑
Discussions on a fair system of payment also led some participants to call for wider overhauls of the existing tax system, which they felt should be fairer and more equitable. However, this broader point fell beyond the remit of this dialogue. ↑
When discussing protecting those on low incomes, some felt that this should be widened to say “support those on differing incomes”. The point was that people not defined as “low income” may also need support. These two positions did not necessarily conflict, as both were based on the principle of protecting those who could not afford to make changes. However, the group that suggested “differing incomes” wanted to stress the point (made earlier in the report) that income was not the only determinant of ability of pay. ↑
In discussion about informing the public on the changes needed, it was specified that this should highlight how the changes will positively impact the future of transport, home energy and food production/consumption. ↑
In discussion about their aspirations related to leadership and accountability, one group suggested that there should be measures in place to prevent future leaders from totally reversing changes that have been agreed on. However, they also said leaders should have some flexibility to change the approach. They also hoped for cross-party consensus if possible. ↑
This conclusion built on discussions from previous sessions, and those who suggested it saw the role of a non-political body as providing independent monitoring of the transition and associated costs, ensuring that people are treated fairly. It was described as something akin to Ofgem (the independent energy regulator) but specifically for the transition to net zero. ↑
While participants did not specify what exact sources they would consider “credible”, they noted specific media outlets which they personally would not trust (which are not named in this report). They also suggested that specialist advisers should be placed in Citizen’s Advice Bureaux, in Job Centres, or at community meetings. This highlights some of the sources that they felt would be useful means of disseminating information. ↑
Some felt that empowerment would only be achieved through the use of incentives and not through the use of charges or penalties. They therefore suggested changing the language from “Empower people” to “Encourage people”. As this was only suggested by one group, the original language was kept but their views are noted here. ↑
It was emphasised that carrots should be identified based on investment in research. It was felt that sticks need to be carefully thought about in terms of where they should fall – e.g. taking into account individual circumstances. One group felt that certain industries should be exempt (from the sticks) where it is technically not possible to reduce emissions. They used the example of steel manufacturers, which falls outside of the remit of this research. ↑
https://www.futureeconomy.scot/publications/59-measuring-carbon-inequality-in-scotland ↑
https://www.gov.scot/publications/transition-fairer-greener-scotland/pages/5/ ↑
https://www.justtransition.scot/publication/time-to-deliver-annual-report-2023/ ↑
https://es.catapult.org.uk/project/electrification-of-heat-demonstration/ ↑
Public Health Scotland define transport poverty as the lack of transport options that are available, reliable, affordable, accessible or safe that allow people to meet their daily needs and achieve a reasonable quality of life, see: https://publichealthscotland.scot/publications/transport-poverty-a-public-health-issue/transport-poverty-a-public-health-issue/ ↑
Please note that participants did not generally distinguish between private landlords and the social rented sector when discussing issues relating to those in rental properties. The type of landlord is specified where participants did make this distinction. ↑
The achieved number of African, Caribbean, Black or Black Scottish/British participants was zero in phase one due to a last minute dropout. Additional targets were set in phase two to ensure representation from this ethnic minority group. ↑
Anyone agreeing with the statement “I’m still not convinced that climate change is happening” was screened out at the recruitment stage to help ensure that those convened for the dialogue could focus on how the costs/benefits of the changes could be distributed fairly to reach net zero (not whether changes should happen at all, though views on this – where expressed – were noted). ↑
A particular focus and boost was placed on the African, Caribbean, Black or Black Scottish/British minority ethnic group due to lack of representation of this group in phase one. ↑
Anyone agreeing with the statement “I’m still not convinced that climate change is happening” was screened out at the recruitment stage to help ensure that those convened to engage in the dialogue could focus on how the costs/benefits of the changes could be distributed fairly to reach net zero (not whether changes should happen at all, though views on this – where expressed – were noted). ↑