
To achieve our climate goals, the people of Scotland will need to make significant changes to the way we work and play. Behavioural science can offer valuable insights for climate policymaking and can help to encourage behaviour change, but only a fraction policy decisions are currently informed by this research.
In September 2025, we held a roundtable with the Scottish Government to explore how behavioural science can be better integrated into climate and environmental policymaking. Academics and senior civil servants worked to identify new projects or approaches to trial in Scottish Government over the next six months. This report summarises the key discussions and proposed projects from the event.
Key discussions and proposed projects
Roundtable participants discussed the following three key challenges related to integrating behavioural science into climate policymaking – each time asking ‘What can we try in the next six months to address this?’:
- Challenge 1: Prioritising where to embed behavioural science
- Challenge 2: Engaging policymakers with behavioural evidence
- Challenge 3: Improving the evaluation of behavioural interventions
From these discussions, participants identified six proposed projects:
- Develop a prioritisation matrix that ranks policy areas and their corresponding behaviours, based on a structured framework adapted to Scotland’s policy priorities.
- Hold a ‘mutual learning’ workshop for senior policymakers and behavioural researchers to explore climate policy, behavioural science in policymaking’ and opportunities for collaboration.
- Scope a project to integrate oral history or storytelling into policy design and public engagement.
- Scope the secondment of an academic behavioural researcher into the Climate Behaviours team.
- Co-create theories of change for three priority policy areas, compiling the data into a clear, simple tool that links to data sources monitoring and evaluating impact.
- Develop a ‘Key principles for behavioural evaluations’ document.
The Scottish Government Climate Behaviours Team will take forward the projects proposed in this report. Roundtable participants will be invited to a follow-up event in spring 2026.
If you require the report in an alternative format, such as a Word document, please contact info@climatexchange.org.uk or 0131 651 4783.
Learn more: ClimateXChange Programme Manager Anne Marte Berseng reflects on the roundtable event in her blog post ‘Making better use of behavioural science in policymaking‘.
Summary report from a science-policy roundtable held 2 September 2025
Research completed: November 2025
DOI: http://dx.doi.org/10.7488/era/6775
Introduction
In September 2025, ClimateXChange and the Scottish Government held a roundtable to discuss how the use of behavioural science can be embedded and accelerated in climate and environmental policymaking in the Scottish Government.
Significant behaviour change across the population is needed to reach Scotland’s climate goals. This behaviour change is not currently happening at anywhere near the pace or scale required. Making better use of behavioural science in policymaking, through a fundamental re-think of how the Scottish Government makes policy for people, has the potential to make a meaningful difference.
The roundtable with academics and senior civil servants had the aim of identifying two or three new projects or approaches to trial in the Scottish Government over the next six months. This paper sets out the main discussion points, and the projects proposed.
Annex B sets out further background to the roundtable and the questions participants discussed.
Challenge 1: Prioritising where to embed behavioural science
Methods and principles for prioritising
There are very many behavioural changes needed to reach climate mitigation, adaptation, and biodiversity goals. These behaviours have various levels of impact, and some are harder for governments to enable than others. The policy process needs to prioritise the embedding of behavioural science and behavioural research accordingly.
Structured frameworks offer a robust way to assess and prioritise policy areas. For example, the ‘APEASE’ framework, considers Acceptability, Practicability (including whether there is existing activity or insight to build on), Effectiveness (including whether policy can have meaningful influence on a behaviour), Affordability, Spill-over effects, and Equity. This framework could be adapted according to the Scottish Government context and priorities – for example, by giving particular weight to three considerations:
- Climate and environment impact: A part of ‘effectiveness’, this addresses the potential impact of behaviour change on reducing emissions, managing the impacts of climate change, and/or supporting biodiversity.
- Behavioural plasticity: A part of ‘practicability’, this is the extent to which behaviours can, feasibly, be changed. It includes a consideration of ‘moments of change’ – that is, key life transitions such as leaving home or retirement – when behaviours are more malleable and the potential of behavioural shifts can be maximised.
- Just transition: Perceived fairness is a key driver of policy acceptability, and just transition is central to both ‘equity’ and ‘acceptability’, and to Scottish Government’s climate policies. Importantly, fairness means considering whether interventions ignore or exacerbate structural inequalities, not only whether they are impactful or feasible.
Prioritisation could also be tailored according to specific local contexts, for place-based behavioural solutions.
Policy sectors of note
Alongside these principles, participants identified the following policy areas as worthy of particular attention:
- Agriculture and land management: Changes in land practices can have significant benefits across climate mitigation, adaptation and biodiversity. Scotland also has a relatively small number of large, influential landowners. This makes targeted interventions potentially more feasible and impactful, on behaviours such as tree planting, water management, and peatland restoration and management.
- Clean heating systems: A widespread switch to heat pumps or other low emission heating would give significant emissions reductions, and the choice between heating systems is mostly presented as a household decision – albeit one affected by wider factors including affordability. Clean heat is also an opportunity for innovation and community or area-based solutions.
- Electric vehicles: Access to charging infrastructure and cost remain barriers to the uptake of electric vehicles, which should be prioritised for their significant potential to reduce emissions. This could also be an opportunity to explore behaviours around vehicle sharing.
- Nature: For many people in Scotland, ideas about nature are closely linked to their identity and pride – both of which can be critical drivers of behaviour change. There are therefore opportunities for using behavioural insights in interventions around eating venison to manage deer populations, ‘greening’ gardens, and improving access to nature through both ‘green’ and ‘blue’ spaces.
- Reducing water consumption: Household water use in Scotland exceeds other UK regions. Given Scotland’s rainy climate, there is both low awareness of this issue and low motivation for change – despite areas of Scotland having experienced drought in recent years.
Proposed projects
Action 1:
Develop a prioritisation matrix that ranks policy areas and their corresponding behaviours, based on climate-adapted APEASE criteria.
Challenge 2: Engaging policymakers with behavioural evidence
Challenges and opportunities
Several significant reasons were identified for why behavioural science does not have a more central role in policymaking: a lack of clarity on the root causes of the policy problem; a lack of time available to consider behavioural insights; and a lack of capacity to analyse potentially conflicting evidence. Time pressures create a bottleneck where particularly senior leaders are unable to devote time and resource to consider the full breadth of available evidence to inform complex policy options. It can also be a challenge that behavioural science does not often lead to one clear policy option. Conversely, there is a need to increase capability among academics to present behavioural insights in a way which is useful within the complicated policymaking process.
This raises several opportunities: working to increase mutual understanding between policymakers and academics can help build relationships that survive the churn of officials, and can foster more widespread understanding of how to use behavioural evidence. This could also be pursued by ‘raising the floor’ across the board by increasing policymakers’ understanding of and engagement with behavioural science. That would allow policymakers to better identify the behavioural components of their policy problems and communicate these to academics.
Finally, there is also an opportunity to find more effective means of distilling and sharing key evidence, by using trusted knowledge brokers to engage with senior leaders. For example, climate action can be politically difficult to drive, so storytelling approaches could be brought more into policymaking. This has the potential to better capture the public imagination and to use public participation and engagement to build trust and support for more contentious proposals.
Possible actions and approaches
Action 2:
Hold a ‘mutual learning’ workshop between senior policymakers and behavioural researchers in a priority policy area (see Action 1). This session should cover fundamentals of ‘the practical use of behavioural science in policymaking’ and ‘the realities of climate policymaking’. It should also include an exercise to identify short- and longer-term opportunities for collaboration.
Action 3:
Scope a project to introduce oral history or storytelling expertise as part of policy design and public engagement. The project would seek to understand the different ways that the sharing of stories, experiences and perspectives can have influence on policymaking, and on engagement with the public.
Action 4:
Scope the secondment of an academic behavioural researcher into the Climate Behaviours team (to start in spring 2026), being clear on the purpose. See Annex A for a case study of the secondment of a behavioural scientist into the Cabinet Office.
Challenge 3: Improving the evaluation of behavioural interventions
Challenges and opportunities
Evaluating the impact of behavioural interventions is important to generate evidence of what works, and why. However, it is challenging and resource-intensive to test and track the direct impact of policies on behaviours.
The fast-paced and non-linear nature of the policy cycle can be at odds with evaluation practice, as new priorities often emerge before there is time to assess the impact of existing interventions. In a policy environment where demonstrating short-term impact is important to justify investment, it can be difficult to pursue evaluations which seek to understand what works over time. It is often not possible to meaningfully demonstrate the effect of an intervention over a single electoral cycle.
When evaluations do occur, there can be an emphasis on demonstrating immediate impact, or solely proving which aims have been reached – rather than a more holistic focus on the wider changes which an intervention is contributing to. Indeed, articulating the relative contribution which an intervention has made is also a challenge.
Three practical elements can be the foundation for building evaluation practice into policymaking:
- A simple theory of change that clarifies how the intervention is expected to reach its desired objectives, and which is broadly understood by the policymakers and analysts involved.
- Clear, evaluative questions based on the theory of change, and a record of what is being achieved.
- Proportionate data to track each element – which incorporates (as appropriate) qualitative and quantitative data and is of ‘good enough’ quality.
A Bayesian approach – which looks at the accumulation of knowledge and learning – could help to guide evaluation strategies which span multiple, shorter-term interventions. Whereas traditional evaluation methods use data to provide singular answers on the success (or not) of an intervention, Bayesian approaches suggest the confidence or likelihood of an intervention’s success, based on both the data and what is already known.
Possible actions and approaches
Action 5:
Co-create theories of change for three priority policy areas (see Action 1), and collate the data to feed into this. Provide this in a simple, clear tool for each policy area, which also links to data sources for monitoring and evaluating impact.
Action 6:
Develop a short document with ‘Key principles for behavioural evaluations’, including principles, case studies from the Scottish Government’s Centre of Expertise in Appraisal and Evaluation, and contact details for experienced individuals.
Taking action
The Scottish Government Climate Behaviours Team will take forward the projects and actions proposed in this roundtable summary. They will collaborate with and involve Scottish Government colleagues and other roundtable participants as relevant. The roundtable participants will be invited to a follow-up event in spring 2026 to take stock, and review and reflect on progress.
Annex A:
Case study: Reviewing knowledge, skills and training needs across the Civil Service in behavioural research
Dr Marie-Louise Sharp is seconded to the Cabinet Office as part of the National Capability in Behavioural Research Programme (NCBR). Her secondment runs for four years from February 2025.
“My fellowship workplan is to scope and develop training interventions to increase capability and upskill Civil Servants in their knowledge, skills, networks and use of behavioural research, with the intention of more systematically embedding behavioural research evidence and methods into policy, strategy and delivery processes in the work of Government in the future.
“The first phase of the fellowship will focus on mapping behavioural research knowledge and capability in the Civil Service, whilst also scoping where gaps might be, and what training/interventions might be needed in the future to serve different groups in the Civil Service. These groups might cover behavioural research specialists, different professions, and those who commission behavioural research. It is also important to consider what baseline level of knowledge and training is needed for everyone to improve their behavioural literacy.
“Additionally, the scoping work will look more broadly at systems and cultures within the Civil Service to identify both barriers and enablers of Civil Servants being able to apply behavioural research skills in their day-to-day practice. I will be looking at leadership and ultimately, with any intervention, where the most impact might occur from any upskilling programme.
Dr Sharp is seconded from the Centre for National Training and Research Excellence for Understanding Behaviour (Centre-UB) hosted by the University of Birmingham as part of a £17m investment from ESRC into Behavioural Research in the UK
Annex B: Roundtable pre-read
Accelerating the use of behavioural science in climate policymaking
A pre-read for participants in the roundtable on 2 September 2025
Professor Linda Bauld, Professor Lorraine Whitmarsh and Professor Paul Cairney
Key points: Why are we holding this roundtable?
The focus: This roundtable will discuss how the use of behavioural science can be embedded and accelerated in climate and environmental policymaking in the Scottish Government (SG).
The context: Scotland will not reach our climate goals without significant behaviour change across the population. This behaviour change is not currently happening at anywhere near the pace or scale required. Making better use of behavioural science in policymaking, through a fundamental re-think of how we make policy for people, has the potential to make a meaningful difference to how we work on climate as a government. Despite the abundance of behavioural research and strong evidence of its value to policymaking[1], only a fraction comes to influence policy choices. Significant hurdles to embedding behavioural science in climate policy remain.
The challenge: This roundtable with academics and senior civil servants aims to identify two or three new projects or approaches to trial in SG over the next six months. Together, we will consider how we prioritise action where it is needed most; how to overcome the challenge of making evidence more accessible and usable to policymakers, and how to empower them to use it effectively; and to better demonstrate of the impact of behaviour change via a more systematic use of evaluation. Participants are asked to consider examples that have worked well and what factors made them successful, as well as lessons learned from examples that did not cut through.
Specifically, we’ll discuss three challenges – each time asking, ‘What can we try in the next six months to address this?’:
- There are very many behavioural changes needed to reach SG’s climate mitigation, adaptation, and biodiversity goals. These behaviours have various levels of impact, and some are harder for SG to enable than others. We need to prioritise the embedding of behavioural science accordingly.
- Not enough policymakers in Scottish Government are seeking out behavioural evidence and expertise when making climate and environment policy. The evidence they do find is often densely academic and hard to apply.
- Evaluating the impact of behavioural interventions is important for generating evidence of what works, and why. However, it is challenging and resource-intensive to test and track the direct impact of our policies on behaviours.
The following paper sets out the context for this roundtable.
What do we mean by ‘behavioural science’ and ‘behaviour change interventions’?
Behavioural science (or ‘behavioural research’) is the study of how people behave and make decisions. Using data, behavioural research seeks to understand what drives people’s actions. This includes individual, social and material factors. It is a multidisciplinary field that examines human behaviour by combining insights from a range of academic disciplines including psychology, sociology, neuroscience, economics and others.
Behaviour change interventions are a coordinated set of activities designed to change specified behaviour patterns – these patterns that are measured in terms of the prevalence or incidence of particular behaviours in specified populations.[2] Behaviour change interventions need to take into account individual factors (capability and motivation) but also, importantly, context (social and environmental factors).[3]
Why is behavioural science particularly important in climate policymaking?
Scotland will not reach our climate goals without significant behaviour change across the population. This behaviour change is not currently happening at anywhere near the pace or scale required. To reach net zero by 2045, we need car use to reduce significantly (by at least 20%) and for almost every new car sold to be electric (currently, it’s 1 in 7); we need 92% of homes to have installed clean heating (currently, it’s 11%); we need land managers to be planting more trees and to be restoring and maintaining two-thirds of our peatland (currently, it’s less than one-third).
The First Minister’s Environment Council recently recommended that the SG accelerates the use of behavioural techniques in climate policy. Importantly, this does not mean locating responsibility for these changes with individuals – policies are needed that remove the barriers to action. Behavioural science can increase the chance that ‘the public’ accept and co-operate with policies.
Understanding behaviour is relevant for all stages of the climate policymaking cycle, from problem definition to evaluation. For example:
- At the problem definition or agenda-setting stage, important behavioural questions need to be asked, including, which behaviours and whose behaviour does the policy seek to address/reach/change.
- During policy formulation, consideration of how alternatives will affect behaviour is important, as it is when considering policy alternatives and policy design.
- During implementation, the success of a policy is often determined by behaviour (by governments, delivery partners, and communities affected).
- Including behavioural research in the evaluation can support our understanding of whether the policy succeeded or failed or how it can be improved in future.
Behavioural science is of course not a silver bullet, leading to one clear policy option. Policy choices will still be complex and difficult, but by using evidence from behavioural research and insights, these choices will be more fully informed, and decisions will have a greater chance of succeeding.
How does SG currently use behavioural science in climate policymaking?
Many climate and environment policymakers use ‘person-centred’ principles in their work and intuitively think about citizens’ behaviours. SG has dedicated resource to ensure that this work is consistent, well-documented, and using the latest behavioural insights.
SG has a ‘Climate Behaviours’ team of four people
Their role is to support SG policymakers and partners to use the latest behavioural insights when developing and delivering climate change policy and projects. They have worked closely with 12 policy teams and with external partners; support a cross-directorate Climate Behaviours network; routinely share latest behavioural evidence with policymakers; and deliver a nationwide climate marketing campaign each year. The team’s recent projects include:
- co-designing 10 new behavioural interventions to enable more farmers to plant trees, which agriculture colleagues are now working to deliver
- conducting a ‘sludge audit’ of the heat pump grant and loan scheme, in order to increase the number of people installing heat pumps
- overseeing the design of a behaviourally-informed Household Flood Plan template, to enable more people at risk to prepare for flooding.
Central behavioural expertise
To support behavioural science in policymaking more broadly, SG seconds behavioural researcher Professor Linda Bauld as Chief Social Policy Adviser. There is also a team of three social researchers within Central Analysis Division (CAD) who support a cross-government ‘Behavioural Insight Network’. Professor Bauld and these social researchers (with support from others including academics) have developed a Behavioural Science Toolkit that is available via SG’s internal learning portal. CAD colleagues and Professor Bauld, working with SG communications and others, also contribute to UK and international networks on behavioural science in health.
Enabling the uptake of behavioural science
- In the Climate Behaviours team’s experience factors which best enable the uptake of behavioural science are: Dedicated capacity to stay abreast of latest behavioural insights and identify timely opportunities for these to be applied to government’s strategic priorities (i.e. in areas with momentum and decisions to be made);
- Buy-in and attention from senior leaders who give policymakers the mandate to dedicate time and resources to behavioural work; and strong working relationships between grassroots policymakers and the Climate Behaviours team, collaborating on discrete projects through in-person workshops to build capacity and relationships.
Why is it difficult to embed behavioural science in climate policymaking?
There are significant hurdles to embedding behavioural science in climate policy. Behavioural science is an evolving and multidisciplinary field, and behaviour changes can be slow and difficult to measure, often making it costly to evaluate interventions and to learn what works.
Added to this, climate policy is highly cross-sectoral, politically sensitive and operates in a complex global landscape. A systemic approach to climate policy is needed to address the multiple factors that shape society. This combines regulation, infrastructure and market incentives (upstream interventions) with development of skills and services (mid-stream), and communication and engagement with communities, businesses and individuals (downstream).[4] Governments tend to focus on individual-level rather than system-level interventions. This ‘downstream’ focus can exacerbate inequalities by not removing structural barriers to action. Effective interventions tackle institutional barriers, skills gaps and power structures.
Despite the abundance of behavioural research, only a fraction comes to influence policy choices. Findings are context-dependent so conclusions can be contradictory, e.g. ‘the best mode of communicating about climate change depends on the audience’. This can make it difficult for policymakers to find the top line or overall narrative and prioritise actions.
Conclusions from behavioural research can be broad principles for good practice. Policymakers sometimes struggle to relate that to their specific policy context or issue. Additionally behavioural studies may not measure economic aspects of an intervention, which are often important to policymakers.
Further to this, the Scottish Government Climate Behaviours team have identified the following primary challenges to their work:
- Low awareness of behavioural science as a tool, and misunderstanding at all levels of government as to what it offers. There are widespread misconceptions that enabling behaviour change is the work of communications, is simply about ‘nudges’ (when it is much broader than that), or that the tools are complex and inaccessible to policymakers.
- Few senior leaders are calling for climate behavioural work meaning few policymakers feel they can dedicate resources for ‘nice to have’ behaviours work.
- There are no mechanisms for systematically requiring behavioural evidence in policymaking.
What are the barriers to using evidence in policymaking?
A wealth of research demonstrates an often-large and enduring gap between the supply and demand for research evidence in policy making. These challenges are not exclusive to behavioural science – there are barriers (and enablers) to the full use of all types of evidence in policymaking. There are no simple and obvious solutions to this problem. Rather, we focus on how to understand and respond to three general issues:
Limited coordination and control over policy outcomes
Simple aspirational models of policymaking give the impression of an orderly cycle of activity coordinated from a government, with clear opportunities to use evidence when defining a problem, generating solutions, and evaluating outcomes.
Real-world policymaking involves policy outcomes that emerge from the interaction between many choices made at different times by many different policymaking organisations, making it difficult for researchers to know where and when to act to make an impact with evidence. This issue has prompted attention to a range of approaches and aims to foster policymaking integration, policy coherence, or systems approaches to problems and policymaking.
Limited agreement on what counts as ‘the evidence’
If you engage with a diverse range of researchers and policymakers, you will find a range of ideas on what constitutes good evidence. For example, there is debate within research about what constitutes high quality evidence and which methods to prioritise. Policymakers and researchers may also prioritise different criteria to determine usability, such as to emphasise the methods to produce and evaluate evidence or its timeliness, brevity, and relevance to policy agendas.
Limited resources to gather, understand, and use evidence for policy
Researchers often describe filling gaps in knowledge with more information, to reduce policy uncertainty by improving our understanding of the technical feasibility of solutions. Time-pressed policymakers need reliable ways to filter out most information, seeking a small number of routinely trusted sources. They also use their values or beliefs to reduce policy ambiguity (which describes many ways to interpret the same problem) and seek to engage with a diverse range of stakeholders to improve the political feasibility of solutions. Hence, the disconnect can relate to different activities: researchers seeking more effective ways to communicate technically feasible solutions; and policymakers seeking solutions that would work politically as well as technically.
Appendix A – For those less well-versed in behavioural science: How is behavioural science used in policymaking?
To inform different scopes of policy
- Behavioural intervention: Behavioural science can be used to target individual actions through behavioural interventions.
- Single policy: It can support the development of individual policy tools, by guiding policy choice and design with an understanding of behavioural factors.
- Policy mix: It can align multiple policy tools to work together towards a shared objective, informed by relevant behavioural factors.
- System: And behavioural science can be used to pinpoint leverage points to achieve a more cohesive, well-functioning system.
To inform different stages in the policymaking cycle
When designing policy, we can use evidence to identify the behavioural changes which can benefit our society, and which we can fairly ask the public to make. We can use behavioural models to design policies and policy mixes which are most likely to be effective.
For example: The Behaviour Change Wheel [5] sets out the full range of policy levers which can be pulled to enable behaviour change. It suggests that multiple policy levers are necessary, without over-reliance on one.
When delivering policy, behavioural models help us understand the barriers preventing people from responding the way we intended them to. They help us to see how to overcome those barriers and to course-correct.
For example: The EAST Framework [6] proposes that policy needs to make a behaviour Easy, Attractive, Social and Timely. If a policy isn’t achieving each one, then gaps should be addressed.
When evaluating policy, behavioural data can be used to measure impact, and to understand the reasons for that.
For example: The COM-B Model [7] proposes that people need Capability, Opportunity and Motivation in order to act. We can measure each of these through surveys and focus groups, to help understand levels of uptake of the desired behaviour.
To inform different types of policy
Behavioural science sets our policy as being Upstream, Midstream, or Downstream:
- Upstream (e.g. focusing on systemic and structural factors at societal level)
- Midstream (targeting the context and environment to make positive behaviours easier and more likely)
- Downstream (addressing individual behaviours and providing targeted support to those who need it)
To enable systems thinking
By combining evidence on individual behavioural factors and influences with an understanding of the context within which behaviours occur and the dynamic interactions and feedback loops within complex systems[8].
End notes
Ruggeri, K., Stock, F., Haslam, S.A. et al. (2024) A synthesis of evidence for policy from behavioural science during COVID-19, Nature, 625, 134-147, doi: 10.1038/s41586-023-06840-9 ↑
Michie et al (2011) The behaviour change wheel: a new method for characterising and designing behaviour change interventions, Implementation Science, 6, 42, doi: 10.1186/1748-5908-6-42 ↑
Davis, R, Campbell, R, Hildon, Z, Hobbs, L, Michie, S (2014) Theories of behaviour and behaviour change across social and behavioural sciences: a scoping review. Health Psychology Review, 9, 3, doi: 10.1080/17437199.2014.941722 ↑
Pidgeon, N (2025), Example Behaviour Change Interventions in the Domain of the Environment, Internal briefing to Scottish Government Chief Scientific Adviser ↑
Michie, S, Van Stralen, M, West, R (2011) The behaviour change wheel: a new method for characterising and designing behaviour change interventions. Implementation Science, 6, 1, doi: 10. 1186/1748-5908-6-42 ↑
The Behavioural Insights Team. (2014) EAST: Four Simple Ways to Apply Behavioural Insights; Behavioural Insights Team: London, UK. ↑
Michie, S, Van Stralen, M, West, R (2011) The behaviour change wheel: a new method for characterising and designing behaviour change interventions. Implementation Science, 6, 1, doi: 10. 1186/1748-5908-6-42 ↑
Parkinson JA, Gould A, Knowles N, West J, Goodman AM (2025) Integrating Systems Thinking and Behavioural Science. Behav Sci, 15(4) 403. doi: 10.3390/bs15040403
How to cite this publication: Whitmarsh, L., Cairney, P., Bauld, L., Bartholomew, K., Creamer, E. and Bergseng, AM. (2025) ‘Accelerating the use of behavioural science in climate policymaking’, ClimateXChange. http://dx.doi.org/10.7488/era/6775
© The University of Edinburgh, 2025
Prepared by ClimateXChange, The University of Edinburgh. All rights reserved.
While every effort is made to ensure the information in this report is accurate as at the date of the report, no legal responsibility is accepted for any errors, omissions or misleading statements. The views expressed represent those of the author(s), and do not necessarily represent those of the host institutions or funders.
This work was supported by the Rural and Environment Science and Analytical Services Division of the Scottish Government (CoE – CXC).
ClimateXChange
Edinburgh Climate Change Institute
High School Yards
Edinburgh EH1 1LZ
+44 (0) 131 651 4783
If you require the report in an alternative format such as a Word document, please contact info@climatexchange.org.uk or 0131 651 4783.
Event date: 4 February 2025
DOI: http://dx.doi.org/10.7488/era/5747

Summary of all sessions from the conference by graphic recorder Eddy Phillips. For a high-resolution version click here.
Aims and highlights
With the next Scottish Government Climate Change Plan due to cover the period to 2040, Scotland is at a critical point for climate action to reach net zero and build climate resilience. The aim of the Climate Horizon 2040 Conference was to generate ideas and insights on emerging research and developments to inform realistic and achievable climate policy in the 2030s and 2040s.
Nearly 170 delegates signed up for the event. They included a mix of experts from academia, business, the third sector and the public sector. The conference was an opportunity for them to connect with each other and take inspiration from the sessions for their work. As a delegate said after the conference: “Networking was really good – and the interactivity of the sessions made it feel more engaging and rewarding”.
The event was very popular – ClimateXChange received a total of 36 proposals and had to whittle them down to 7 sessions. Sessions discussed public perceptions of climate change and action, mitigation and adaptation, the potential role of AI, carbon pricing policies, financing place-based home retrofit, land use scenarios and designing cities.
For the final session, delegates sat in groups aiming to answer questions about strategies that could help mobilise climate action in relation to market mechanisms, industry, behaviours, finance and investment, and regulation.
The conference highlighted the urgency of embedding adaptation into Scotland’s net zero strategy, integrating technological and financial innovations while ensuring a just transition. The roundtable discussions produced key recommendations including:
- Strengthening policy alignment of mitigation and adaptation measures
- Scaling up finance mechanisms for public and private climate action
- Investing in resilience
- Enhancing public engagement to drive behavioural change
- Leveraging innovation
- Collaborating across sectors and organisations
- Learning from EU countries
This report summarises the key issues raised and discussed at the conference, the major challenges expected and big things on the horizon. The ClimateXChange podcast features a summary of the conference.
Main issues discussed
1. Future-proofing climate action: Integrating mitigation and adaptation
Led by Sustainable Scotland Network adaptation sub-committee
The synergies between mitigation and adaptation are discussed frequently, yet, mitigation and adaptation efforts are often still considered separately. This is problematic not only because both are necessary to address climate change, but also because mitigation measures can limit adaptation options or even create new challenges for adaptation, and vice versa.
For example, if a low-carbon, sustainable new build is located on a flood-plain or is not adequately insulated and ventilated to deal with increased heat events, then costly modifications or maintenance will need to be completed. This can lead to unnecessary, additional greenhouse gas emissions and costs throughout the building’s lifetime.
This panel discussion with researchers and practitioners in the public sector discussed how they have successfully integrated mitigation and adaptation and the challenges they faced in doing so.
Conversations highlighted that despite efforts to reduce emissions, continued adaptation is essential due to climate change.
In particular, the panel discussed the value of adapting strategies to prevent worsening of public health and ensure benefits from land use. While there is some political resistance and planning uncertainties, panellists gave successful local examples that demonstrated practical integration of adaptation measures.
They also highlighted that transformative changes and improved communication would help align public understanding and actions with increasingly urgent climate realities.
Key points from the discussion:
- Why do we need to future proof climate action? Even if we meet net zero goals, the globe will continue to warm so we need to continue to adapt. Climate change adaptation must be embedded in mitigation strategies to build resilience.
- Uncertainty remains a key challenge in integrating adaptation into policy.
- Land use is responsible for 40% of Scotland’s net emissions. Land must be managed for multiple benefits and guard against multiple risks such as biodiversity, flood prevention, carbon sequestration – this is very different from the historical status quo.
- Some local governments show political resistance to adaptation, yet they are already implementing practical measures eg adaptation measures in net zero social housing.
- The concept of “climate-resilient net zero” must be central to planning, avoiding the carbon costs of rebuilding after climate disasters.
- “Climate is a health emergency as well as a planetary emergency”. It is important to plan our mitigation measures with climate impacts in mind so as not to exacerbate health impacts. For example, active and public transport is a win-win-win for mitigation, adaptation and health.
- Regardless of taking the approaches of incremental or transformative adaptation, we need to be in control of the change rather than wait for impacts.
2. AI for energy justice
Led by Professor Aristides Kiprakis, University of Edinburgh
Artificial Intelligence (AI) has the potential to create a system that is not only more resilient, efficient and sustainable, but also more equitable and inclusive. However, there are challenges associated with AI. Making AI accessible to all citizens, including those in fuel poverty, requires careful consideration, so that no one is left behind.
In this session, experts and stakeholders on AI, social science, energy systems and energy policy shared their views on how to tackle those challenges.
Discussions centred on AI’s potential to tackle fuel poverty and enhance energy distribution efficacy. Panellists highlighted that using data from AI’s capabilities in grid monitoring and behaviour analysis could help optimise energy use and address fuel poverty.
However, they also discussed ethical concerns related to integrating AI, such as privacy in healthcare and biases in algorithms. Discussions acknowledged the potential of AI to improve energy efficiency through smarter infrastructure and demand-side management, yet scepticism remains about AI’s role in overcoming fundamental societal inequalities in energy access.
Highlights from the session included:
- The first step is to use AI to use existing infrastructure more flexibly and smartly. For instance, AI could help monitor household energy needs, as Scotland faces growing fuel poverty (31% of households).
- AI could help save on capital investments in new infrastructure.
- AI could help optimise energy systems, predict grid failures and improve efficiency, but it must be applied equitably. To this end, the role of AI in energy systems should prioritise energy distribution over generation, ensuring equitable access.
- Challenges include high energy use in AI models and concerns about data privacy and embedded bias.
- Innovative solutions, such as using data centres to heat homes, are already being piloted in Edinburgh.
3. Carbon pricing policies
Led by Dr Vera Eory and Professor Klaus Glenk, Scotland’s Rural College
According to research into how farmers in Scotland view carbon schemes and how scheme design preferences affect intentions to uptake, there is considerable interest in carbon schemes if certain conditions are met. However, there is much variation in farmers’ preferences for contractual obligations, suggesting that a careful exploration before implementation could improve participation.
This session considered the wider aspects of carbon pricing policies in Scotland, especially in agriculture and other four sectors not included in the UK Emission Trading Scheme. The discussion included the role of carbon markets currently and in the short- and medium-term.
Highlights from the session included:
- Discussions explored carbon pricing mechanisms, including Emissions Trading Schemes (ETS), taxation and market-based incentives.
- Farmers and land managers expressed concerns about how carbon pricing might impact agriculture.
- There is a need for blended finance approaches that combine public and private investment.
4. Financing place-based home retrofit
Led by Dr Ian Cochran, Changeworks
Place is an important part of the Scottish policy approach. “Place-based” is increasingly widespread in describing how cross-sector decarbonisation can offer opportunities for economies of scale, social and economic benefits as well as combining the multiple interventions needed in targeted zones at once.
The session aimed to provide an understanding of what we need to get right to bring life to place-based to provide important insights for policy. Given fiscal constraints across the public sector, both Scottish and UK government have expressed interest in exploring the financial benefits.
The session discussed what would good place-based action look like in 2040 and how to take action from today for 2040. Highlights from the session included:
- Climate finance must shift from extractive models to regenerative investments that retain wealth locally.
- Community-led energy and retrofit projects require accessible funding mechanisms and streamlined processes.
- Case studies highlighted the need for scalable and replicable funding models to support neighbourhood-level transitions to net zero.
- Long-term investment strategies must prioritise system-wide change rather than isolated pilot projects.
5. Building net zero land use scenarios with Lego
By Anna Sellers, LUNZ Hub
To get delegates energised after lunch, they had a choice of two interactive sessions. In this session, they were asked to play an interactive game using Lego.
Delegates built net-zero land use scenarios and explored trade-offs between competing interests and priorities for land use in coming decades. The following figure summarises scoring across actions and variability across the groups.

The session got delegates considering that the net zero target extends beyond reducing carbon emissions to include biodiversity, water management and flood prevention.
Participants highlighted the complexity of behaviour change and criticised the focus on biomass and mono-culture tree planting. Furthermore, they discussed actions such as reducing livestock numbers both as challenges requiring behaviour change to prevent increased meat imports, and as opportunities to enable broader environmental benefits. Discussions highlighted nature such as peatlands and forests as more than a carbon sink, and the importance of balancing interventions between nature-based and farming practices.
Highlights from the session included:
- Peatland restoration, tree planting and habitat creation emerged as priority land-use strategies.
- Reducing ruminant livestock herds was debated, with concerns over offshoring emissions.
- Participants emphasised the need for evidence-based approaches to increasing soil carbon and the role of agroforestry in helping to achieve Scotland’s net zero goals.
A complete report of the session is on the LUNZ Hub website.
6. Co-designing Glasgow’s future net zero hospitals
Led by Professor Paul Rodgers, University of Strathclyde
A parallel interactive session explored how NHS Scotland’s hospitals in Glasgow can transition to net zero by 2040. As key public institutions, hospitals can serve as models for broader net zero adoption. Groups were asked to design what Scotland’s net zero health care ecosystem could look like in 2040.
Participants took part in an interactive exercise with maps and Plasticine to explore how the city’s health and social care infrastructure can become sustainable while maintaining high care standards. The focus was on sustainable energy, green spaces, transport and waste management infrastructures.
The session showed how net zero is an opportunity to reimagine the way a city works. One of the examples discussed was that of re-purposed buildings such as disused churches that could be used for drop-in health centres, improving access and connectivity.
Highlights from the session included:
- NHS infrastructure and transport networks can be decarbonised and made climate resilient.
- Waste heat from NHS facilities could be repurposed to heat neighbouring communities.
- Local travel can be smoother and help achieve the health and environmental targets.
- Strategies for integrating sustainability into healthcare infrastructure were explored, including solar panels, heat networks and energy-efficient retrofits.
Reflections
The final session of the event was an opportunity for delegates to reflect on the discussions held throughout the day.
They could share their thoughts on research needs and recommendations for the Scottish Government on market mechanisms, industry, behaviours, finance and investment and regulation, while also discussing what more Scotland can do to reach net zero.
How can market mechanisms and incentives be used to deliver emissions reductions?
This discussion explored various aspects of carbon market operations, particularly the Emissions Trading System (ETS). Key points included the effectiveness of carbon pricing and the allocation of free allowances, which has proven successful in sectors like energy that received no free allowances.
The debate extended to the potential inclusion of household fuel and agriculture in the ETS, with suggestions for different ETS setups reflecting specific industry needs and minimising significant economic impacts on certain sectors.
Delegates also discussed transport’s integration into ETS by 2029 and shipping by 2026, along with dynamic pricing models like road pricing during peak times.The conversation touched on the broader political and economic contexts, such as subsidies in aviation fuel and the challenges of a just transition, especially relating to older and electric vehicles. Discussions around financing mechanisms like zero-interest loans for second-hand EVs and grants for heat pumps, highlighted the need for financial and carbon literacy to navigate these incentives effectively.
Participants noted that aligning financial instruments with emission reduction targets is complex. They emphasised the necessity of clear, targeted policies to facilitate a transition to low-carbon alternatives.
The discussion also explored market mechanisms for emissions reduction, highlighting their impact on socio-economic disparities, especially for lower-income groups in Scotland and inter-generational justice in Wales.
Which industries and sectors are in a position to lead on the transformation to net zero, and how do we encourage that leadership?
Given their contribution to greenhouse gas emissions, the session identified oil and gas, construction, transport, electricity and textiles as key sectors that could lead the transformation to net zero. Delegates highlighted the potential role of creative industries in making change through creativity, design and innovation.
Building on existing leadership and expertise, particularly in energy and construction, is crucial. Encouraging leadership involves harnessing the skills of individuals in longstanding industries to lead newer, sustainable sectors.
Delegates also highlighted the need for regulatory support, improved training for retrofit assessors and innovative financial products to encourage retrofitting.
They recommended that policymakers create a level playing field through regulation, set consumption-based targets and support crucial network and SME infrastructure developments for a smoother transition to net zero.
What strategies can help shift behaviours and mobilise climate action by major emitters and the wider public/communities?
The discussion emphasised creating an environment where eco-friendly choices are the most appealing and accessible. Learning from the Covid-19 pandemic, the strategy involves a mix of incentives and penalties. Participants suggested financial incentives for individuals and strict regulations for major emitters. Additionally, participants highlighted the need for a social and wellbeing economy, addressing property ownership issues in Scotland.
Delegates suggested behaviour change tactics such as leveraging consumer power, promoting sustainable travel and localising decision-making. An emphasis on extensive collaboration, both domestically and internationally, is crucial for addressing large-scale emitters. Creative, long-term engagement supported by local authorities, combining technology, legislation and public information, is vital for encouraging widespread adoption of climate-positive behaviours.
The session advocated for both top-down and bottom-up approaches, stressing the importance of co-benefits linking climate actions to other community benefits, like health, to resonate more effectively with the public.
How can we mobilise finance and investment to fund effective climate action in Scotland, including securing public and private sector contributions?
It is crucial to make climate projects investible and de-risking investment. To attract both public and private sector funding, projects need a strong business case that demonstrates both financial returns and climate risk mitigation. There is a need for clearer evidence on risk profiles and investment benefits to increase investor confidence.
Blended finance approaches such as public-private partnerships can help de-risk projects, making them more attractive to investors.
With regard to policy and incentives to drive climate investment, delegates suggested that the Scottish Government could incentivise net zero outcomes rather than funding specific measures, allowing businesses to innovate in achieving climate goals. Government could explore a mix of policies to better align public and private sector investment. Delegates also highlighted that greater investment is needed in areas without a clear revenue mechanism, such as home insulation, where financial benefits are indirect but significant (eg reducing NHS costs from cold-related illnesses).
It is also important to shift investment and valuation approaches. The discussion highlighted the need to rethink how we value climate action, moving away from purely financial metrics and toward societal and environmental benefits. Pension funds and other institutional investors face challenges balancing financial returns with ethical and fiduciary responsibilities. Delegates suggested taking a whole-systems approach to understand policy interdependencies, such as transport and heating schemes, which can generate broader economic and social benefits.
Which regulatory or non-financial policy measures could have the biggest impact on reducing emissions in Scotland?
Key principles suggest that regulation should heavily target high emitters while facilitating grassroots and community initiatives. Delegates suggested taking an assertive approach, similar to France’s ban on oil-fired heating, for phasing out gas boilers.
Participants also suggested tightening regulations on environmental claims about products and services, akin to measures in France and Belgium. Additionally, regulating the embodied carbon in building constructions, a common practice in Nordic countries and soon to be implemented EU-wide from 2028, could further lower emissions.
Another proposal is to open up the energy market to allow peer-to-peer electricity sharing. Increasing the accountability of large landowners could also drive reductions in emissions.
Big things on the horizon
The conference highlighted aspects related to climate change action that are likely to become key policy priorities such as more resilient infrastructure, innovations, considerations for a just transition and climate finance.
1. The need for climate-resilient infrastructure
- Flooding and extreme weather events will continue to escalate, requiring adaptation in housing, transport and utilities.
- Infrastructure investment must consider long-term resilience rather than short-term cost savings.
2. Policy and regulatory innovations
- Moving towards a wellbeing economy means that carbon pricing and regulation align with climate justice goals.
- It’d be beneficial for new policies to focus on consumption-based emissions rather than just production-based metrics.
3. Just transition and equity considerations
- A just transition to net zero ensures that low-income communities are not disproportionately impacted.
- Energy pricing mechanisms should consider affordability while driving emissions reductions.
- Public engagement strategies can bridge the gap between early adopters of net zero technologies and those unable to afford the transition.
4. Expanding climate finance and investment
- Private investors need clearer risk assessments and investment benefits to scale up climate projects.
- Pension funds and institutional investors must balance financial returns with ethical responsibilities.
- A whole-systems approach can help integrate transport, heating and energy infrastructure into net zero planning.
5. Leveraging AI and digital solutions
- AI has the potential to enhance real-time climate action by optimising grid management and energy efficiency.
- However, digital solutions must be accessible and not exacerbate existing inequalities in energy access.
- Further research is needed to understand the long-term role of AI in achieving Scotland’s climate targets.
Conclusion and recommendations
The Climate Horizon 2040 Conference highlighted the urgency of embedding adaptation into Scotland’s net zero strategy, integrating technological and financial innovations while ensuring a just transition. Key recommendations include:
- Strengthening policy alignment: Ensure adaptation and mitigation policies are integrated to prevent unintended consequences.
- Scaling up finance mechanisms: Streamline funding for community-led climate action and incentivise private sector investment.
- Investing in resilience: Prioritise climate-proofing infrastructure to mitigate long-term risks.
- Enhancing public engagement: Develop clear, accessible communications to drive behavioural change and climate action.
- Leveraging innovation: Ensure AI and digital tools contribute to equitable and effective climate solutions.
- Collaborating across sectors and organisations: For instance, a coordinated plan with combined effort could help achieve a balance of pragmatism (especially with regard to cost) and politics (such as achieving public buy-in). This is at the core of accelerating climate action and achieving climate targets.
- Engaging with EU countries: Learning from other countries about measures that are are already being implemented.
DOI: http://dx.doi.org/10.7488/era/5747
© The University of Edinburgh, March 2025
Prepared by ClimateXChange, The University of Edinburgh. All rights reserved.
While every effort is made to ensure the information in this report is accurate, no legal responsibility is accepted for any errors, omissions or misleading statements. The views expressed represent those of the author(s), and do not necessarily represent those of the host institutions or funders.
ClimateXChange
Edinburgh Climate Change Institute
High School Yards
Edinburgh EH1 1LZ
+44 (0) 131 651 4783
If you require the report in an alternative format such as a Word document, please contact info@climatexchange.org.uk or 0131 651 4783.
Why it is important
The Scottish Government aims to reduce the number of car kilometres by 20% by 2030, compared to 2019.
The Scottish Government asked ClimateXChange (CXC) to assess the evidence base on what works to reduce car use, including shifting to a different transport mode and behaviour change.
CXC commissioned a suite of three studies looking into a range of measures that could help reduce car use: the impact of parking policies, how to encourage sustainable travel among under-18s and their families, and the benefits of sustainable travel to local high streets and town centres.
How ClimateXChange supported policymakers
To build strong, practical evidence of what works in reducing car use, the studies looked for long-term and robust evaluations of the impact of interventions, and evaluations that capture a range of benefits across economic, environmental and social factors.
This was challenging because many interventions have not been robustly evaluated, nor have baseline data for such evaluation.
Each project report sets out how robust the evidence is and the strength of the impact evidence.
The project looking at the benefits of sustainable travel to local high streets and town centres also produced a suite of engagement materials for those promoting, campaigning on, designing and delivering sustainable travel measures. The materials can be used when engaging with communities, businesses and local representatives.
They also produced a guide on how to run such engagement processes as part of local planning and development. The materials were based on findings from the study, engagement expertise and tested approaches with potential users.
All three reports set out priority actions and include clear and easy to find recommendations for practical action, making the research relevant and valuable for policymakers in national and local government.
Impact
Findings from the three studies have informed the development of an updated car use reduction route map.
The findings of the study on encouraging sustainable travel behaviour in children and young people in particular, have helped the Scottish Government to plan future work with schools, especially Eco-Schools. Sustainable travel is part of the curriculum of Eco-Schools, which have dedicated sessions on sustainable living and climate mitigation measures – the findings informed the development of these sessions.
“The work on travel behaviour in children and young people was innovative. It has given us the foundation for potential targeted messaging around car use reduction to young people and their families.”
– Bertrand Deiss, Head of Transport Climate Change Strategy & Engagement
Transport Scotland, Scottish Government
The Scottish Government has shared with local authorities the materials produced in engaging with their communities. The study provided them with evidence that interventions to make local streets and town centres more sustainable will bring money to city centres.
Finally, the research into the impact of car parking restrictions can be used in local development plans and local transport strategies to encourage a shift to active travel and public transport.
Taken together, the reports set out a suite of intervention ideas and provide evidence to inform local and national debates on which interventions may be most useful to meet local transport needs.
Related reports
Reducing car use through parking policies: an evidence review
Encouraging sustainable travel in under-18s and their families
The benefits of sustainable travel to local high streets and town centres
Related links
A route map to achieve a 20 per cent reduction in car kilometres by 2030
The Scottish Government’s approach to climate change is underpinned by a commitment to deliver a just transition. The Climate Change Plan 2018-2032 update emphasises that a just transition “puts people, communities and places at the heart of our approach to climate change action.”
The concept of ‘fairness’ is fundamental to delivering a just transition. However, determining what ‘fair’ means in practice, particularly when seeking to deliver a fair distribution of costs and benefits from the transition (i.e. distributive justice), raises complex moral and ethical questions.
This study carried out a programme of deliberative public engagement to inform the design and delivery of Just Transition Plans in the transport, built environment, and land use and agriculture sectors.
Through carefully designed and facilitated deliberative engagement methods, this project gathered well-considered and informed public views on how to ensure distribution of costs and benefits of the transition to net zero is fair for all. The project also gathered views on how specific policy options within the transport, built environment, and land and agriculture sectors could be implemented fairly.
Findings
Participants felt that we all have something to contribute towards the costs of the transition to net zero, including the Scottish Government, businesses and citizens.
They wanted to see an equitable approach, meaning that everyone contributes but not all in the same way or by the same amount. They felt that a fair distribution of costs must take account of different circumstances, including:
- the amount of control someone has over their level of emissions
- the availability of lower carbon alternatives
- their ability to pay.
They also supported a progressive form of taxation to fund some of the changes required across key sectors, with higher income individuals and businesses paying more.
The report sets out specific findings relating to the transport, built environment and construction, and land use and agriculture sectors.
If you require the report in an alternative format, such as a Word document, please contact info@climatexchange.org.uk or 0131 651 4783.
Measuring a just transition
Monitoring and measuring a just transition is important to achieve a fairer, greener future for all, and to ensure the process is a partnership with those impacted by the transition to net zero.
To help the Scottish Government develop it’s just transition monitoring framework further reports summarise approaches to just transition monitoring and evaluation in other jurisdictions, and identify possible baseline variables to include in the framework.
Monitoring and evaluation of a just transition in Scotland – Summary report on international lessons
Proposed just transition baseline variables built environment and construction sector
Proposed just transition baseline variables land use and agriculture sector
Proposed just transition baseline variables energy sector
Proposed just transition baseline variables transport sector
Just Transition Commission: Measuring and Evaluating Success in the Scottish Just Transition
Research completed in May 2024
DOI: http://dx.doi.org/10.7488/era/4964
This work was carried out in accordance with the requirements of the international quality standard for Market Research, ISO 20252
Executive summary
Aims
This study carried out a programme of deliberative public engagement to inform the design and delivery of Just Transition Plans in the transport, built environment and construction, and land use and agriculture sectors.
This report summarises findings from two phases of public engagement that aimed to:
- uncover informed, considered and collective public opinion on the fair distribution of costs and benefits in the transition to net zero emissions in these three key sectors (phase one)
- gather learning into the factors influencing any changes in participants’ attitudes, beliefs or values as a result of engaging in this deliberative process (phase one)
- gather views on how specific policy options within the transport and built environment sectors could be implemented fairly (phase two).
Overall findings and implications
- We all have something to contribute towards the costs of the transition to net zero, including the Scottish Government, businesses and citizens.
- Participants wanted to see an equitable approach, meaning that everyone contributes but not all in the same way or by the same amount. They felt that a fair distribution of costs must take account of different circumstances, including:
- the amount of control someone has over their level of emissions
- the availability of lower carbon alternatives
- their ability to pay.
- Participants supported a progressive form of taxation to fund some of the changes required across key sectors, with higher income individuals and businesses paying more.
- Participants emphasised the need for systems that protect those least able to afford transitions, including exemptions and support for low-income individuals and for those facing health or disability challenges.
- A combination of incentives and disincentives was broadly supported and was considered the most effective way to encourage (and discourage) certain behaviours.
- The timing of any new taxes, charges or penalties was felt to be a key consideration for ensuring a balance between motivating people to change while not unfairly penalising them. A phased, staggered approach was seen as one way of achieving this balance.
- The importance of clear and transparent communication with the public was emphasised. It was agreed that the public should feel part of the decisions that affect them through ongoing public engagement.
Deliberative process and impact on views
- Participants said they had developed and deepened their understanding of the scale and complexity of a just transition to net zero, in this deliberative process.
- Initially, participants thought that those who emit the most should contribute the most. However, upon further deliberation and consideration of the impacts of this on different groups, they had a strong sense that this approach would be unfair if it did not consider those who have more limited control over their emissions (such as some businesses or people living in rural areas).
- The factors that contributed most to participants’ views deepening or shifting were hearing from participants with different backgrounds; learning from experts; engaging with hypothetical scenarios and considering impacts from a range of perspectives; consolidating their views through voicing them in group discussions; and having time to reflect on the issues between sessions.
- Overall, participants valued the opportunity to learn about, discuss and contribute to Scotland’s just transition. They emphasised the importance of ongoing engagement with the public, through these types of engagement.
Key messages for the transport sector
- Achieving a decarbonised transport system will require significant investment in infrastructure across Scotland.
- For any form of Road User Charging to be considered fair, participants concluded that different circumstances and needs should be considered, rather than taking a blanket approach. They felt there should be concessions or exemptions for some groups, including people on low incomes, those with health conditions or disabilities, elderly people, those living in rural communities and those who rely on their car for their livelihoods.
- Participants felt that Road User Charging would be unfair in rural areas unless there was improved access to public transport.
- They also highlighted the importance of allowing sufficient time for people to prepare for any changes being introduced.
Key messages for the built environment sector
- Participants suggested that those who profit from buildings – including businesses in the construction sector and those owning multiple properties – should pay for the changes needed to lower the carbon emissions of those buildings.
- To ensure the heat transition is paid in the fairest way possible:
- There should be support available to all households but the amount of support should vary depending on circumstances, with those on low incomes and those with older properties entitled to the most government funding.
- There should be protections in place, such as exemptions from penalties for vulnerable groups, rent increase caps to protect renters, regulation on the installation of new heating systems and a fair appeals process.
- Other considerations included careful consideration around loans to avoid pushing anyone into financial hardship, reassurances around the efficacy of new heating systems and clear communication with the public about the changes required.
Key messages for the land and agriculture sector
- Participants agreed that the costs of adopting a more climate friendly approach to food should be shared between the Scottish Government, businesses (including farmers but also other businesses along the supply chain such as supermarkets) and consumers. It was also felt that landowners should bear some of the costs.
- Suggestions to ensure a fair transition in the way we produce and consume food:
- Consider people’s ability to pay, with protection in place for low-income consumers.
- Subsidise farms, favouring smaller farms with less income. Support payments should be specifically allocated towards covering the costs of reducing carbon emissions.
- Give farms sufficient time and opportunity to change and reduce emissions before introducing any financial impacts such as additional tax.
- Ensure that consumers have easier access to sustainable food options.
Introduction and method
This report presents the findings from public engagement regarding a just transition to net zero in three key sectors: transport, built environment and construction, and land use and agriculture. The research was carried out by Ipsos on behalf of ClimateXChange and the Scottish Government.
Background to the research
The Scottish Government’s approach to climate change is underpinned by a commitment to deliver a just transition. The Climate Change Plan 2018-2032 update[1] emphasises that a just transition “puts people, communities and places at the heart of our approach to climate change action.” The plan recognises climate change as a human rights issue and the transition to net zero as an opportunity to tackle inequalities.
The Climate Change (Emissions Reduction Targets) (Scotland) Act 2019[2] places statutory obligations on the Scottish Government to develop Climate Change Plans and demonstrate how just transition principles have been taken into account when preparing these.
The 2019 report[3] from the Just Transition Commission outlined recommendations for achieving a just transition to net zero. In its response, the Scottish Government set out its Outcomes, as part of its National Just Transition Planning Framework, and committed to producing Just Transition Plans for high-emitting sectors, sites and regions.[4] The draft Energy plan was published for consultation in January 2023[5]. Plans for transport, built environment and construction, and land use and agriculture are currently in development.
Alongside these policy commitments, the Scottish Government has also emphasised the importance of public engagement in the transition to a net zero and climate ready Scotland. The Climate Change Public Engagement Strategy (Net Zero Nation)[6] sets out the framework for engaging the Scottish public in the transition to net zero, including the objective “people actively participate in shaping just, fair and inclusive policies that promote mitigation of and adaptation to climate change.”
Objectives
Against the policy background outlined above, ClimateXChange and the Scottish Government commissioned a programme of deliberative research to inform the design and delivery of the outstanding Just Transition Plans in transport, built environment and construction, and land use and agriculture. The research initially had two objectives:
- To uncover informed, considered and collective public opinion on the fair distribution of costs and benefits in the transition to net zero emissions in the three key sectors.
- To gather learning into the factors influencing any changes in participants’ attitudes, beliefs or values as a result of engaging in this deliberative process.
As the research progressed, a third objective was introduced:
- To gather views on how specific policy options within the transport and built environment sectors could be implemented fairly.
Ultimately, the research aimed to directly inform the Just Transition Plans and wider work on the transition to net zero across relevant policy areas.
Methodology
Deliberative approach
A deliberative approach was chosen for this research due to the complex and multi-faceted nature of Scotland’s just transition to net zero. Deliberative engagement is about putting people – through informed discussions, involving diverse perspectives, and understanding lived experiences – at the heart of decision making. It differs from other forms of engagement in that it allows those involved to spend time considering and discussing an issue at length before they come to a considered view. Previous research has noted that the complexity of views around climate change means that this topic lends itself well to deliberative forms of engagement.[7]
This deliberative research used a public dialogue approach,[8] a process whereby members of the public interact with experts and policy makers to deliberate on issues relevant to future policy and research decisions. The research was delivered in two phases, each of which are outlined below.
Phase one overview
Phase one brought together a group of 30 people from across Scotland to address the first two objectives (gathering views on a fair distribution of costs and benefits in the transition to net zero emissions, and gathering learning into the factors influencing participants’ attitudes as a result of engaging in a deliberative process). They met online for six workshops held between August and October 2023, each lasting between two to three hours, with the overall aim of answering these overarching questions in relation to each sector:
- As we transition to net zero, who should pay for the changes that will be needed?
- How can we make sure that system of payment is fair?
- How can we make sure that everyone benefits?
An outline of the process and each workshop can be found in the Appendix A.
Online community
Alongside the workshops, an online community helped support ongoing engagement with the participants, facilitating continued discussion and reflection. The online community was hosted on Community Direct (an Ipsos proprietary platform) and discussion was moderated by Ipsos researchers.
Recruitment
The aim was to achieve a sample of at least 30 participants with over-recruitment to account for potential cancellations or drop-outs. In the end, 30 participants started the process and 27 continued to the end.
Participants were recruited by Fieldmouse, a specialist recruitment organisation, who contacted members of their existing panel of potential research participants by telephone. A screening questionnaire was used to capture demographic information about the participants, designed to help ensure the group’s profile was broadly reflective of the Scottish population. Quotas were set on various characteristics (see Appendix B) in line with national population data. However, those living in a remote rural or island area, from an ethnic minority group, with a disability or long-term health condition, or on a lower income were over-sampled to ensure sufficient representation of these groups.
To support and enable participation in the research, and in line with industry standards, each participant was paid £400. Where necessary, training was provided on how to use the technology and access the meeting platform. This allowed Ipsos to enhance the diversity of those taking part. Workshops were also arranged to take place outside of regular office hours to increase participation.
Materials
Discussion guides (Appendix C) and stimulus (Appendix D) were developed by Ipsos and approved by ClimateXChange and the Scottish Government. A range of specialists joined at different points in the dialogue to provide information that would be useful for participants’ learning and deliberation. Presentations were developed by specialist speakers, in consultation with Ipsos, and these presentations were given live during the main plenary sessions. The specialists were available to answer questions from participants in sessions. Presentation recordings were hosted on YouTube and shared via private links for members to watch again in their own time in preparation for subsequent sessions.
Stimulus were used to encourage participants to consider different impacts of the transition. Ipsos developed fictional characters to help participants think about the impact of potential changes on different groups; and fictional future systems of payment to help participants consider what a fair distribution of costs would look like.
Fictional characters used throughout the workshops
Alice is 28. She lives in Dundee in a third-floor flat that she shares with two other friends. Alice works as a nurse in Ninewells Hospital. She works shift patterns, meaning that she often finishes after 10pm. Alice’s income is £28,000 per year.
David and Sarah are married. David is 42and Sarah is 40, and they have two children, Noah (10) and Katie (7). David works as a financial advisor and Sarah works as a website designer. They live in Bearsden, on the outskirts of Glasgow. David and Sarah’s combined income is £105,000 per year.
Lorraine is 60. She lives on a farm in rural Aberdeenshire where she raises cattle and turkeys. Lorraine employs staff who work on the farm and the farm shop. Her son and daughter also work for the business. Lorraine’s income is £55,000 per year.
Maria is 36. She lives in a flat in Moffat with her daughter, Ella (3). Maria has mobility issues and a respiratory condition that sometimes affects her breathing. Maria looks after Ella full time and does not have another job. Maria’s income from benefits is £21,500.
Nadeem is 50. He lives on the Isle of Lewis, about 10 miles from Stornoway. He lives with his son, Ajay (23). Nadeem is a builder and Ajay works in a shop in Stornoway. Nadeem’s income is £45,000 per year and Ajay’s income is £24,000 per year.
Phase two overview
Phase two brought together a group of 20 people from across Scotland to address the third research objective (exploring specific policy options). They met online for three workshops held in March 2024, each lasting between two and three hours. An outline of the structure of each workshop is shown in Appendix A.
Recruitment
The aim was to achieve a sample of at least 15 participants with over-recruitment to account for potential cancellations or drop-outs. In the end, 20 participants started the process and 19 continued to the end.
Participants were recruited by telephone using a screening questionnaire, as per phase one (see Appendix B for quotas and over-sampled groups). Participants were each paid £140 for their participation.
Materials
Discussion guides (Appendix C) and stimulus (Appendix D) were developed by Ipsos and approved by ClimateXChange and the Scottish Government. Presentations given in session one were developed by specialist speakers and Ipsos. Presentation recordings were hosted on YouTube and shared via private links for members to refer back to.
In the remaining workshops, participants focused on two policies; Road User Charging (RUC) and the heat transition in domestic properties. For each policy, they explored two approaches before forming conclusions. Some of the fictional characters from phase one were used to help participants think about the impact of different approaches on a range of groups and to consider trade-offs.
How to read this report
The main body of this report provides a summary of key findings, while appendices 1-3 provide more detailed discussions relating to each sector.
Readers are reminded that the report contains findings from two deliberative processes which were staged in two phases. Phase one’s remit was to consider the broader principle of fairness across three sectors, while phase two’s remit was to consider how specific policies could be implemented fairly within two of those sectors. Findings related to specific phases are highlighted at appropriate points, however, some chapters draw on both to minimise repetition (for instance, in the next chapter, where the starting points for both cohorts were similar).
More broadly, the conclusions set out and discussed in this report are intended to inform the Scottish Government’s development of Just Transition Plans. The report includes verbatim assertions by participants and their understanding of the issues. These are not intended as authoritative statements of fact, but they tell us something valuable about how key issues have been perceived and understood by members of the public.
It should also be noted that, at different points in the dialogue, participants engaged with hypothetical scenarios and policy approaches designed to help participants engage with the issues. They were not necessarily reflective of the Scottish Government’s powers or its intended course of action.
Further, it should be noted that whilst the method of qualitative analysis is systematic and rigorous and the conclusions robust (being based on groups that are reflective of the diversity of the wider public), the analysis does not seek to quantify findings nor does it indicate statistical significance from a representative sample. This report offers a valuable insight into public perspectives on the key questions posed to them after receiving and deliberating on key information relevant to the questions. It will also provide valuable insights for engaging the public on policies which will have a significant impact on their lives.
Participants’ starting point
This chapter outlines the initial views of participants as they began the dialogue. It includes the views of both cohorts (i.e. participants taking part in phase one or phase two) in their respective first workshops, which covered similar content.
Familiarity with key terms
In both phases, participants were generally aware of and familiar with the term “net zero”. When asked to describe what this meant, they used words such as “reducing”, “balancing” or “offsetting our emissions”. Reference was also made to specific behaviours linked with the transition to net zero, such as changing modes of transport, using renewable sources of energy, and eating less meat or dairy. At this early stage there was some concern about the scale of the challenge of reaching net zero, and a desire to learn more about how we get there.
“I recognise it’s something we should work towards but there are so many challenges to cancel out what we are doing. It would take radical changes to people’s lives. I find it hard to work out how on earth we will get there, which is why I really want to listen to the experts.” (Participant, phase 1, workshop 1)
There was also some scepticism about how the term “net zero” was used, with some asking whether it actually translated into real change, and others asking whether the target was long term enough. This reflected fairly high levels of concern about climate change among these participants, and a desire to see action as a result of the dialogue.
Participants were much less familiar with the term “just transition”. Among the few participants who had heard the term, they understood it to mean the sharing of responsibility for the transition to net zero, while protecting groups such as those in rural areas and those struggling financially. Others spoke of it specifically in terms of jobs, and the aim of protecting people who worked in traditional fossil fuel industries that may become obsolete (using the example of oil workers in Aberdeen). Overall, a just transition was seen as challenging and questions were raised such as “is it achievable?” and “who can be trusted to take the lead on this?”
Participants expressed a general interest and concern in the topic of climate change and hoped to learn more about the policy developments, explore how they as individuals could act to help tackle climate change, and to both hear from others’ perspectives and feel that the Scottish Government is listening to their views.
“There’s such a lot of different opinions, and living in a rural area we might have different opinions to those in a town or city. I wanted to find out more and join in.” (Participant, phase 2, workshop 1)
Reactions to the first presentations
In the first workshop of phase one, participants learned about key concepts that would help them in later deliberations. They heard three presentations which covered: Scotland’s current approach to net zero targets; the principle of a just transition and the work of the Just Transition Commission; and the Scottish Government’s Just Transition Plans for the three key sectors.[9] Phase two participants heard similar introductory presentations, but the second one focussed on the Scottish Government’s Just Transition Plans for the three key sectors; and the third one on wider public engagement on Scotland’s just transition.
As well as generating a number of questions (which were responded to by expert presenters) the presentations highlighted some broader issues of importance for participants. Some emphasised their concern about the scale of change required to reach net zero and how challenging it will be to change attitudes and behaviours. Others felt that achieving a just transition would be very difficult due to the range of different circumstances to be taken into consideration, particularly the differences between urban and rural areas.
“It’s a huge undertaking. I don’t think we can accommodate for every single person in the country not to be left behind.” (Participant, phase 1, workshop 1)
Some felt reassured by the existence of the Just Transition Commission and the Scottish Government’s Just Transition Plans, but there was also a lack of clarity for others around the measures that would be put in place to ensure a just transition. There was therefore a broad interest in understanding more about what these would mean in practice.
“We’ve heard all of this before. I want some of this to get put into practice. I haven’t seen anything […] We talk about emissions and everything but nothing has been put into practice to say “we start from here”. We don’t even know where the money is coming from. The transition part is expensive for ordinary households.” (Participant, phase 2, workshop 1)
In phase two there was some scepticism among participants about the Scottish Government’s ability to implement changes fairly (based on perceptions of how LEZs in Glasgow and Aberdeen had been introduced). Given the focus on phase two on specific policies in the transport and built environment sectors, there were also concerns raised about the high upfront costs of switching to EVs or making home energy improvements (based on participants’ own experiences). Participants wanted to see more evidence of the efficacy of low carbon technologies before they would be willing to spend money on them.
Overall, participants generally found the information in the presentations useful and informative. They stressed the importance of the wider public being made aware of Scotland’s net zero targets and the scale of changes required to meet them – the types of information that participants had just heard.
“We need to make sure that people in this country know how [the transition] is going to affect them. You need to give real examples, concrete examples of what is going on in Scotland.” (Participant, phase 1, workshop 1)
Early thoughts on fairness
At the end of the first workshops (in both phase one and two), participants shared their reflections on what a just transition to net zero would mean. Their responses highlighted that, despite a lack of familiarity with the term, participants were engaging with some of the principles that underpin a just transition. These early themes included the following:
- Costs should be distributed. Participants felt there should be some form of shared responsibility. There was a broad sense that everyone should contribute something, but it was also highlighted that these contributions would not be equal (as people would not be starting from equal positions). It was also felt that some individual actions would need to be supported by systemic changes.
- Different needs and circumstances should be taken into consideration. In particular, fairness was linked to acknowledging people’s different financial circumstances and ability to afford the changes that might be expected of them. It was also linked to understanding the differences between urban and rural communities in relation to access to transport infrastructure.
- Awareness-raising and public engagement are important to help people to understand why change is needed and what changes we can all make. It was stressed that consultation and engagement should focus on those who are most likely to be affected by the transition.
- The transition should not result in further inequality and could even be an opportunity to tackle existing poverty and inequality. Particularly among participants in phase one, there was an aspiration that the transition to net zero should not results in the loss of jobs or communities.
These early themes were revisited and developed further by participants in the remaining workshops, as they learned about specific sectors, deliberated on a fair distribution of costs and benefits, and (in phase two) considered different policy options.
Principles of fairness across sectors
In phase one, individual sectors were covered in three separate workshops on transport, built environment and construction, and land use and agriculture. In these workshops participants heard presentations which outlined some of the changes that may be needed in the sector.
Participants were presented with a vision for the sector in 2040 based on the Scottish Government’s discussion papers and explored this in the context of different fictional characters and how they might be impacted. The visions for each sector outlined changes such as:
- Transport – private cars produce fewer emissions; alternatives to private cars (e.g. public transport, car sharing etc) are readily available; there are measures to discourage car use (e.g. road charges); and new transport jobs have been created.
- Built environment and construction – buildings are more energy efficient; places are designed and used differently (e.g. to cope with extreme weather, or reduce flood risk); the construction sector is more sustainable, using more locally sourced and natural supplies; and new construction jobs have been created.
- Land use and agriculture – land is used differently, with less dedicated to food production and more to planting trees, peatland restoration and supporting biodiversity; people are encouraged to consider the climate impacts of food and waste less food; and land and agriculture based jobs have changed.
Using these examples, and based on their own lived experiences, participants answered these questions for each sector:
- As we transition to net zero, who should pay for the changes that will be needed?
- How can we make sure that system of payment is fair?
- How can we make sure that everyone benefits?
- Answers to those questions were developed in detail in the final workshop and are outlined in the conclusions to phase one. Five common, cross-cutting themes emerged across sectors that are summarised below.
Cross-cutting themes
Support for those most impacted by the transition
Having heard about the potential changes that may be required to reach net zero in each sector, participants identified certain groups that were likely to be impacted more than others. It was felt that these groups would require support so that they did not experience financial or other types of disadvantage as a result of the transition. These groups were:
- Individuals and businesses in rural communities. Across all sectors, it was felt that rural areas would face specific challenges in meeting the aspirations outlined in the sectoral visions. These barriers included: a greater reliance on cars and a lack of public transport infrastructure; high costs of upgrading heating systems due to older, less energy efficient properties; and less easy access to sustainable food options in shops. It was felt that these types of barriers should be accounted for in the planning for the transition.
- People who are unable to afford to make changes. Having heard about the potential changes needed in all three sectors, participants felt that these were likely to be expensive. There was particular concern about the impact of those costs on people who would already be considered financially vulnerable, including those on lower incomes and those struggling with the cost of living. This concern carried through to participants’ later views on fair systems of payment, and the importance of considering an individual’s ability to pay.
- Businesses unable to afford to make changes. Smaller businesses, including small farms, were viewed as being more financially vulnerable and less likely than larger companies to be able to cover costs of the transition.
- People working in jobs most likely to be impacted by the transition. This included: farmers who may be required to change the way they use land and produce food; those who drive for a living who may be impacted by the move to a decarbonised transport system; and the construction sector, who would need to reskill people to retrofit or build new energy efficient buildings.
Shared responsibility for paying for the transition
A theme throughout the sector-focussed workshops was that we all have something to contribute. When discussing each sector, it was felt that the costs of transitioning to net zero should be shared among the Scottish Government, businesses and citizens:
- The Scottish Government should fund infrastructure that helps the public to make lower carbon choices (e.g. funding EV charging infrastructure, free public transport) and provide grants or loans to help people with upfront costs such as replacing heating systems. This support was seen as essential to help those who would not be able to afford these changes. It was also felt that the Government should continue to subsidise farmers, as without these subsidies farms may not survive.
- Businesses should pay for making changes, particularly if they are going to benefit financially. This was seen as particularly the case for the construction sector and parts of the transport industry, but also extended to farmers and the wider food supply chain. The overriding theme was that profit-making businesses would both have the ability to pay (because they could afford to) and a responsibility to pay (if they would benefit from the changes).
- Citizens. It was felt that the public bears some responsibility to pay for changes to our homes, our forms of transport, and the food we consume. It was also agreed that those continuing to make high carbon choices should bear the cost of those choices. However, there were a number of important conditions to this, including the affordability of the changes, and the extent to which someone has alternative choices available to them. These conditions, and how they would be accounted for, were explored in more detail in later workshops.
There were also some specific groups identified as being responsible for changes within individual sectors, including landlords and property owners who it was felt should be responsible for making properties more energy efficient or transitioning to clean heating systems; and landowners who participants suggested should be taxed to help pay for some of the changes to land use needed.
No ‘one size fits all’ approach
Reflecting the points above, it was felt that different approaches would be needed to accommodate the circumstances of and likely impacts on different groups. Across the sectors, the following characteristics were seen as important to bear in mind:
- The extent to which there are options available to support low carbon choices. For example, if there is a lack of public transport options (as in rural areas) or if the use of EVs is not practically feasible, then it would be unfair if people in those areas had to pay to fund EV or public transport infrastructure.
- The ability to pay, so that those on lower incomes are not further disadvantaged by having to pay for changes they are unable to afford. This extended to businesses, as it was felt that farmers, small businesses, and those struggling financially should be provided with support towards making changes.
- Having needs that may impact on behaviours, such as having a disability or health conditions that requires use of a car.
In these sector-focussed workshops, there were mixed views on the extent to which systems of payment should be based on levels of emissions. On the one hand, there was a view that individuals who continue to drive high emitting vehicles or property owners who had neglected to make the necessary changes should be obliged to pay more. On the other hand, it was felt that higher emitters may not have a viable alternative, either because of where they live (i.e. those in rural areas may have no alternative to cars) or because of income (i.e. being unable to afford an EV or to make energy efficiency improvements in their homes).
These views on fair systems of payment were explored in more detail, using hypothetical scenarios, in the penultimate workshop.
Acceptance of the possibility of taxation
- Before they had explored potential systems of payment in detail, participants had already discussed the possibility of taxation to support the costs of the transition. While there was an expectation that the Scottish Government would contribute towards the costs (as noted above), it was also acknowledged that those costs paid could end up being borne by the individual anyway through taxation. A progressive tax was supported in principle, based on both ability to pay and ability to choose, but participants did not discuss (at this stage) the details of how that would be implemented.
- Some participants felt that payments should be covered by a tax on larger, profit-making businesses, particularly whose practices are not climate-friendly (e.g. those who import food from overseas). At the same time, there was recognition that penalising businesses too harshly could force them to leave Scotland which would risk jobs and move carbon emissions elsewhere. There was some support for a “food miles tax” or other form of high carbon products tax, but only if other more sustainable food options were available and affordable.
Need for education and time
When reflecting on the likely changes in each sector, participants felt there was need for further education, engagement, and public consultations around the transition. They felt that the necessity and benefits of transitioning to net zero should be clearly communicated to all citizens.
It was also stressed that people and businesses would need sufficient time to adapt to the changes required for the transition to net zero, and that this would require advance notice of regulations, taxes or other charges, or incentives.
How our fictional characters fared across all sectors
When reviewing the impacts of the transition on our fictional characters, participants highlighted many of the points raised above, particularly the importance of taking into account factors such as location (whether they lived in urban or rural areas), ability to choose, tenure, income, occupation and other lifestyle factors.
Who benefits from changes?
Alice benefits from improvements to public transport which she could use to go to work in Dundee, rather than relying on her petrol car. However, it was pointed out that more regular buses would not necessarily make her feel any safer travelling to work at certain times (one of the main reasons she avoided using public transport). It was felt that Alice would also benefit from improved energy efficiency in her rented flat, provided upgrades were carried out by her landlord and that additional costs associated with this were not passed on to her. She would also benefit if she was able to afford a high-quality new build in future (as she was hoping to buy a property).
An improved public transport system would benefit Maria, who did not drive. This would mean she would be less reliant on taxis, saving her money. As a tenant (in a flat with an EPC rating of C), she might also benefit if the housing association made her home more energy efficient and if appropriate measures were introduced to reduce the risk of flooding to her property (her ground floor flat was located in a flood risk area).
Nadeem (a builder) could benefit from an increase in demand in the construction sector and from training opportunities available on new construction techniques, provided these are accessible to him and his staff.
David and Sarah would benefit from the move to a more sustainable food system because their lifestyle choices were already in line with this vision (as they largely bought locally produced food, and were on the waiting list for an allotment), and they could afford to make further changes or absorb increased costs.
Who might be negatively impacted?
Lorraine would be negatively impacted across all sectors. As a farmer, she may be required to change her use of transport but have limited low carbon alternatives for agricultural vehicles and personal car use (based on the view that the sort of rural area where she lives is unlikely to have the level of integrated transport needed). It was also noted that her property would likely require a lot of work to make it more energy efficient, which she may not be able to afford. Lorraine’s livelihood was also identified as at risk given the challenges of diversifying land use and the need to increase prices to cover the cost of making those changes. Her age was noted as a factor in that she may not have time to benefit before she retires.
It was felt that Nadeem would be negatively impacted because of his reliance on a van for his work and the fact that he lives and works on the Isle of Lewis. Based on the assumption that public transport would not be a viable alternative, it was considered unfair that his earnings would be affected by road charges. Nadeem and Ajay (both vegan) may lose out if a focus on local food products means they have less choice in their diet. This could be exacerbated by additional challenges transporting goods to where they live. Ajay’s job in a food shop might be at risk if it is adversely affected by increased prices.
It was felt that Alice may see her rent increased to cover the costs of making her home more energy efficient. This would affect her ability to save for a new property, especially if very high energy efficiency standards led to increased costs for new builds. Alice and Maria were both identified as at risk of losing out if food prices increase because of their concern about the current cost of groceries. They may also struggle to access local produce; Maria because of her child care requirements, and Alice because of her shift patterns.
Although David and Sarah would have to adapt their lifestyle in relation to transport (e.g. they would likely have to reduce their use of two cars) it was felt they would be able to adapt and absorb the costs with their income. However, it was recognised that there would need to be some flexibility or exemptions given for their use of the car when travelling with their disabled son.
Fair systems of payment in practice
In the penultimate workshop participants explored what a fair system of payment might look like across all three sectors. Hypothetical scenarios were created and used as a way of testing participants’ views of fairness. These were based on information provided in the workshop presentations and ideas raised by the participants themselves during breakout discussions, and were not necessarily reflective of the Scottish Government’s powers or its intended course of action. It should also be noted that participants’ interpretations of the scenarios should not be read as authoritative statements of fact, but rather reflect how key issues were perceived and understood.
Hypothetical scenario 1: Those who earn the most pay the most
In this scenario, costs would be covered through a progressive form of “net zero” tax applied to people in Scotland earning over a certain amount (see figure 4.1).
Figure 4.1. Scenario 1: those who earn the most pay the most

What appealed?
There was broad support for the idea of providing free public transport for those on low incomes, given the strong view that this group should be protected as we transition to net zero. However one participant raised the possibility that people on low incomes might already use public transport more than other groups, so felt that incentivising public transport use among those on higher incomes might have more impact.
Providing grants for purchasing EVs was also an appealing aspect of the scenario, as it too would benefit those on lower incomes. However, it was felt that this policy could be more targeted in areas where public transport was not as available, such as rural areas.
“Why would you give a grant to someone on a low income to buy a car in Glasgow or Edinburgh? People in rural areas don’t have a choice, they have to have a car. Giving them a grant could be a really useful thing, to make sure they’re able to get about.” (Participant, workshop 5)
What were the concerns?
Participants felt that middle income earners would potentially lose out under this hypothetical scenario if they would not qualify for grants or free public transport, but would still struggle to afford an EV or to make significant changes to their home.
“It’s a bit vague, ‘low income’ versus ‘high income’. Those on a middle income fall between the cracks, and they can’t afford an electric vehicle or to make the home improvements.” (Participant, workshop 5)
This fed into broader discussions around income, and participants felt that this would not necessarily correlate to ability to pay. Some reflected on their own situations as they considered the scenario, sharing that they had wanted to improve the energy efficiency of their homes but were unable to afford the changes.
There was broad agreement that it would be unfair to fine people, especially those less well off, if they could not afford to upgrade their home. It was therefore felt that a more nuanced consideration of financial ability would need to be considered. Participants were supportive of the suggestion of a progressive “net zero tax”, using small income bands to avoid stark increases in taxation and ease the impact on households.
Participants were aware of potential unintended negative consequences of this scenario. For instance, if landlords struggled to afford the changes they might choose to sell which could impact rental supply and lead to rent increases. There was some debate around whether all landlords should be ineligible for grants, or whether there should be scope for smaller landlords (i.e. with fewer properties) to be eligible, similar to the support offered to smaller farms in this scenario. However, no firm conclusions were reached on this.
As highlighted in the transport workshop, participants remained concerned that a lack of EV charging infrastructure in rural areas would mean rural and island communities missing out.
How our fictional characters fared in scenario 1
Who benefits?
Participants felt that Maria would benefit from free public transport, while Alice could use a grant to switch her petrol car to an EV.
Who might be negatively impacted?
Lorraine was considered to be a middle income earner who could miss out on financial support. Participants felt that she would be “hammered” under this scenario, given her home has an EPC rating of D and she may not be able to afford the necessary changes to bring it up to an energy efficient rating. With the requirements to reduce emissions on her farm as well, it was felt Lorraine would be negatively impacted in several ways.
David and Sarah (owners of a rental property) were also identified as potentially being impacted through the net zero tax and requirements to change EPC ratings in rental properties, but being ineligible for grants. Although it was felt that they could and should pay a higher share based on their income, seeing the various ways in which they would be charged under this scenario, while caring for a disabled son, gave participants a more nuanced perspective which reinforced the view that income alone does not necessarily equate to affordability.
A fair distribution of costs
Participants felt the ‘Those who earn the most pay the most’ scenario could be fair in theory, but in practice would depend on how it was funded; how much time would be given to prepare for the changes; the infrastructure that would be put in place; and how “low income” would be defined. Participants reiterated the view that personal circumstances would need to be taken into account.
Participants also identified a need for awareness raising to ensure fairness in this scenario. They felt that individuals would need to be given guidance on what changes they needed to make and what support would be available for them, recognising that not everyone knows what their home’s EPC rating is.
A key caveat to the discussions was that the role of industry must also be considered alongside public behaviour change and cost-bearing. This was prompted by the risk of food prices increasing as farmers pass costs on to consumers, which would add to the financial burdens already placed on individuals.
“Things are constantly going up, then with this added cost and figuring out if you pay for costs of your home being energy efficient, it seems a difficult and expensive thing to be going through and I’m not sure how this will be managed.” (Participant, workshop 5)
Food price increases were felt to be somewhat inevitable when discussed in the land and agriculture workshop, but in the context of these scenarios were considered to be unfair, especially if big corporations were not doing their bit. It was suggested that “middle businesses” in the supply chain (such as supermarkets) could absorb more of the costs to minimise the impact on farmers or consumers.
Hypothetical scenario 2: Those who emit the most pay the most
Scenario 2 focused on a system of payment whereby those who emit the most pay the most. Costs would be covered through taxing higher emitting industries and other charges for people who contribute the most emissions (see figure 4.2).
Figure 4.2. Scenario 2: those who emit the most pay the most

What appealed?
There were fewer aspects of this scenario that appealed compared to the others. The tax on high carbon food was identified by some as an effective way to encourage people to change their eating habits. Those who were in favour felt that products like meat becoming a ‘luxury’ would make them be more frugal and cut back on certain foods.
“It might encourage me to think more carefully about what I’m buying, maybe being a bit more frugal in terms of what’s used. I see that as a good thing. I’d be quite happy with less choice in some ways because I feel we’ve got way too much choice now.” (Participant, workshop 5)
However, the high carbon food tax was also criticised for making certain food products unaffordable, which was not considered fair. For some, this was based on the view that meat and dairy products were part of a nutritional diet and should not become a luxury. For others, it was about understanding the demands on peoples’ time and ability to pay for fresh, seasonal produce.
“People don’t buy rubbish food because they love it, sometimes it’s because they don’t have the choice […] I love spending too much money in Real Foods, but not everyone has the ability to do that. It’s making sure we’re not leaving people behind. The affordable choice should be for the environment and the health of the people.” (Participant, workshop 5)
What were the concerns?
The main concern around the ‘Those who emit the most pay the most’ scenario was that some people and businesses were higher emitters due to circumstances outside their control. This echoed a strong theme, which emerged early in the dialogue, that people without low carbon alternatives available to them should not be penalised. The construction and farming industries were highlighted as examples where the costs of decarbonisation could be prohibitive and threaten livelihoods. It was also felt that costs could be passed onto consumers, meaning that it would not just be high emitters who would pay the most.
Participants also expressed concern for homeowners and questioned the cost, feasibility and fairness of requiring homeowners to bring their homes to an EPC rating of C by 2033.
“I think the timescale is an important factor here. At the moment, it’s 10 years away. By the time this is made law, it’s probably only going to be 7 years away. It’s what ability is there to do changes in the 7 years.” (Participant, workshop 5)
It was felt that EVs would not be feasible for those living in rural areas, so they would be subject to road user charging despite having no viable alternative. There was some criticism of LEZs in particular, which were seen to have been unfairly implemented in some areas.
“At Keith [in Moray] they were going to create a LEZ but anyone coming from Shetland, if they needed a car, that’d be taxed by the emissions zone [so] they don’t have a choice.” (Participant, workshop 5)
How our fictional characters fared in scenario 2
Who might be negatively impacted?
Nadeem’s livelihood as a builder was felt to be at risk given the additional costs to his business, such as road user charges (if he was not able to switch to an EV) and paying penalties (if he was not able to reduce emissions). Similarly, it was felt Lorraine’s farm would be penalised and her business would be vulnerable if she could not easily change the use of her land.
Who benefits?
Participants felt that the characters living or working in cities, including Alice, Maria and David and Sarah, would benefit from the LEZs due to cleaner air. Given Nadeem and Ajay are both vegan, it was also felt that they would not be penalised for buying high carbon produce such as meat; “lack of penalty is kind of a benefit”.
A fair distribution of costs
Participants consistently felt an emissions-based approach would be unfair:
“I think it’s penalising. There isn’t a lot of incentives there. It’s very directive, ‘You will do this or you will get fined.’ There isn’t a lot of, ‘We are supporting you’. It’s not a kind system […] It’s very harsh.” (Participant, workshop 5)
They felt this system of payment would need a nuanced approach, recognising that some people and businesses have more limited control over their emissions than others, and they would be unfairly penalised if these differences were not considered.
For the introduction of LEZs to be considered fair, improvements to the public transport infrastructure were considered to be a prerequisite.
“There needs to be reliable, good quality transport. And we should start from that. If we start with installing Low Emission Zones, before we improve public transport, it will make people very hostile towards the idea. (Participant, workshop 5)
Additionally, participants felt that there needed to be more of a balance between penalties and incentivisation to help facilitate low carbon choices. Awareness-raising, education and engagement was felt to be an important part of helping people transition, otherwise:
“You are going to disengage and alienate the population and any change becomes a bigger challenge, dramatically. This is going to affect every single part of life.” (Participant, workshop 5)
Hypothetical scenario 3: Incentives for making low carbon choices
Scenario 3 focused on a system of payment where there are incentives for making low carbon choices. Costs would be covered through general increased taxation and through profits generated from certain businesses benefitting financially from the transition (see figure 4.3).
Figure 4.3. Scenario 3: there are incentives for making low carbon choices

What appealed?
Participants were initially drawn to the supportive nature of this scenario, with its emphasis on incentivisation. The provision of subsidised public transport was widely supported.
“If you’re told you’ll get a bit of help, it’s more positive and people will more likely want to carry out and make these differences, but if they have to pay for it and take care of a family, they won’t want to do it. Incentives are always a good thing.” (Participant, workshop 5)
Prioritising high emitting homes for grants and retrofitting schemes were deemed sensible and effective ways of bringing emissions down quickly. Participants living in higher emitting homes said they would appreciate the support to make improvements. Those who rented were more sceptical about this, as they worried that rent prices would be increased by landlords to make the changes, even if they were receiving grants.
While there was a preference for incentives over penalties, there was a view that “there will always be people who can’t be bothered” to change. Participants also highlighted a risk that money could be wasted if it does not target those who need it most. For example, some questioned whether everyone should be eligible for an EV grant or only made available to those who would be unable to afford one without support.
“The bits about grants for all electric vehicles, some people will be able to afford them so they won’t need them. That money could be used for something else.” (Participant, workshop 5)
What were the concerns?
Despite initial positivity towards the ‘Incentives for making low carbon choices’ scenario, concerns grew over how the various financial supports would be paid for and how effective a system based on incentives would be for reaching net zero targets. The idea of general increased taxation was a less appealing aspect of this scenario, as it was felt that this would ultimately result in everyone paying more, and would place an unreasonable burden on people in the context of a cost of living crisis:
“I think we’ve reached a point where we’re all groaning from increase in taxation and cost of living.” (Participant, workshop 5)
Specifically, and echoing earlier findings, middle income earners were identified as a group who were more likely to bear the brunt of general taxation but not see the benefits through grants and subsidies.
“When you talk about general increases in taxation it’s always the middle income owners hardest hit. They earn more so they pay more tax, they then never get the benefits available. They may be £1 over the cut off but they are taxed higher and get no benefits.” (Participant, workshop 5)
How our characters fared in scenario 3
Who benefits?
Participants felt that David and Sarah and Lorraine would benefit as their low EPC-rated properties (David and Sarah’s rental property was D, Lorraine’s home was E) would be prioritised for retrofitting schemes and grants. Profit-sharing for reskilling initiatives were seen to be beneficial for Lorraine too, as well as for Nadeem and his employees.
A fair distribution of costs
While the use of incentives was seen as a kinder approach than penalties, it did not necessarily follow that this system of payment would be fairer. As highlighted above, participants raised concerns about a general taxation putting pressure on some groups, while open incentivisation might mean grants and subsidies were taken up by those who were better off rather than those with the greatest need. Participants therefore felt that a fair distribution of costs under this system would mean more targeted support through grants and subsidies, in combination with a general taxation. The availability of grants and subsidies would also need to be widely publicised and not administered on a first-come-first-served basis to minimise the risk of people losing out.
“Limiting the cash benefits to any group or individual is the key thing, because this is too open-ended.” (Participant, workshop 5)
As with other systems of payment, it was perceived that the current infrastructure – particularly for public transport and EV charging – was too “fragmented”. It was strongly felt that these issues would need to be addressed first, to ensure people were able to make low carbon choices.
This highlighted the importance of timing and sequencing for a just transition to net zero. The system of payment based on incentives was initially more appealing, but it was also felt that some charges might be necessary once people have had time and encouragement to make the necessary changes.
“On the road to net zero it will probably not be fair to charge based on emissions before we reach the points at which changes SHOULD have been made… Emissions charging should be the “stick” coupled with the “carrot” of a really rigorous and case specific package of support to enable homeowners to make the necessary changes.” (Participant, online community)
Summary on systems of payment
These hypothetical systems of payment highlighted the range of complexities inherent in the different approaches to distributing the costs of the transition. Participants were not asked to choose any one scenario over another, but instead discussed how each scenario might impact different groups and raised key considerations for making these approaches as fair as possible. Their key points are summarised in the following table:
Exploring policies
In phase two of the research, a new group of 20 people from across Scotland were convened to learn about and deliberate on potential policy options within two of the key sectors that were focused on in phase one; transport and the built environment. The two policy options were:
- Approaches to Road User Charging (RUC), involving a charge on car usage based either on distance driven or on a defined geographic area.
- Approaches to funding the transition of domestic properties away from gas or oil-based heating systems to clean heating systems (such as heat pumps or district heat networks).
Picking up where the first cohort left off, they considered the benefits and challenges of these policy options, before providing conclusions on how they should be implemented fairly.
Road User Charging
Views on Road User Charging are explored in more detail in the transport chapter. A summary of the key findings is presented here where participants were shown two possible options to road user charging, presented in the following table:
|
Option 1 – UK national road pricing |
Option 2 – Urban local road user charging |
|
|
Views on option 1: UK national road pricing
UK national road pricing was introduced as a possible approach to RUC that would cover all of Scotland’s roads and involve a charge on drivers based on distance driven.
A perceived general benefit of this form of RUC was that those who drove for convenience might be encouraged to choose public transport instead. In turn, the reduced traffic would improve air quality and bring health benefits. That funds raised would be invested in improvements to public transport was widely welcomed, and it was agreed that rural areas should be prioritised for funding, as public transport was considered to be less available and accessible in these areas.
“A good thing about it is that the money raised is put towards public transport. If the money is invested into rural areas, that’d be really good. That’s where the money should go because they need transport.” (Participant, phase 2, workshop 2)
The challenges participants were keen to ensure were considered and addressed included:
- Taking different circumstances into account: It was felt that some groups would be unfairly impacted as their access to alternative options would be limited (e.g. those who rely on their car because of a disability or health condition, those who have to drive long distances for work, or those who live in rural areas where public transport alternatives are not available). It was agreed that exemptions or permits would need to be in place for these groups and these should be clearly communicated:
- “It would be unfair for those that live in rural areas to pay the same when they don’t have a choice in transport.” (Participant, phase 2, workshop 2)
- Balancing incentives and disincentives: It was surprising to some that EVs were not exempt. There were mixed views on the fairness of this which hinged on the risk of discouraging people from switching to lower carbon alternatives versus the overall objective of reducing distances travelled by car. It was therefore suggested that EVs should not be charged as much as petrol/diesel cars to incentivise lower carbon choices.
- How the charge is paid: It was not considered fair to present drivers with an annual one-off charge, as this could come as a shock and be difficult to pay in one go. Instead, it was suggested that the costs should be spread out. It was also felt that consideration should be given to when the charge is applied (with a suggestion for it to be lower or lifted during the night to ensure those travelling for night shifts are not restricted).
Views on option 2: urban local road user charging
Urban local road user charging was introduced as another possible approach to RUC that would involve a charge to drive into specific parts of an urban area.
The benefits highlighted were similar to those raised in response to option 1 (cleaner air and improved public transport infrastructure). For some, this option was considered to be fairer than national road pricing because it was assumed it would be implemented in areas with readily available public transport alternatives.
“This one is targeting particular areas and not all journeys. You’re given an option to use your car or public transport to get into the city.” (Participant, phase 2, workshop 2)
There were still challenges that participants raised in relation to this approach, including:
- How those who living and working within the charging zone would be treated: It was agreed that exemptions would need to be made for such groups.
- Considering the differences between types of urban areas: Inverness, for instance, was felt to be a different type of urban area to Glasgow or Edinburgh, as it served as a connecting transport hub for those in rural areas.
- Ensuring access to alternatives: It was felt that adequate public transport infrastructure would need to be in place before RUC was introduced to an area.
Funding the heat transition in domestic properties
Views on the heat transition in domestic properties are explored in more detail in the built environment and construction sector. A summary of the key findings is presented here, where participants were shown two possible options to funding the heat transition, detailed in the following table:
|
Option 1 – widely available public funding, stricter penalties |
Option 2 – targeted public funding, softer penalties |
|
|
Views on option 1: widely available public funding
Participants considered a scenario in which Scottish Government grants and loans would be available to all households to improve energy efficiency and install a clean heating system. In this scenario, there would be penalties for non-compliance by the deadlines set out.
As well as considering the general benefits of the clean heat transition (such as the need to use less energy to warm homes, and reduced emissions), participants also felt that the combination of widely available funding and strict penalties would encourage people to make the changes. The presence of exemptions for certain groups, protections for renters, and an appeals process were all welcomed.
Participants also highlighted a number of challenges:
- The 2028 deadline for landlords making home energy improvements was felt to be too close and not enough notice. There were also concerns raised that landlords would choose to sell rather than make the required changes, which would mean fewer homes available to rent.
- Conversely, the 2045 deadline for clean heating systems to be installed was considered to be too far away and raised concerns that people would not be motivated to act quickly enough.
- The availability of funding to all households drew mixed views:
- On the one hand, it was not considered fair to fund households that could afford to pay for changes, while others unable to afford the changes may not receive enough to cover their costs:
- “If you’re really rich, you can pay for it, why should you get a grant for it?” (Participant, phase 2, workshop 2)
- On the other hand, it was considered fair that all households receive some support since the changes were being required of them:
- “I think it would be fair to give grants to all households because they’re enforcing it. If they want people to do it, they’ll need an incentive.” (Participant, phase 2, workshop 2)
In drawing conclusions, there was general agreement that while there should be support available to all households, this should vary depending on circumstances (with those on lower incomes and those with older properties being entitled to the most government funding).
- There was some discomfort around the idea of people taking out loans to cover any remaining costs, particularly for those seeking to avoid debt or already struggling with existing financial commitments.
- While welcomed, there were concerns that that an appeals process could be difficult and stressful which would be off-putting to some.
- Building trust in the efficacy of the clean heating systems was felt to be a necessary pre-requisite to people installing them in their homes, and participants expressed a desire to see evidence of this:
- “More trials, more comparisons and more information. I think if people have that then more people are going to go, ‘We see where you’re coming from, we understand and can get behind it.’” (Participant, phase 2, workshop 2)
Views on option 2: targeted public funding
Participants considered another scenario in which Scottish Government grants and loans would be available to households on lower incomes to improve energy efficiency and install a clean heating system (but not to higher income households, landlords or owners of second properties). In this scenario, there would be penalties for non-compliance on energy efficiency improvements, but penalties for not installing a clean heating system by 2045 would not be enforced straight away.
The flexibility in when and how penalties would be applied was welcomed in this scenario. While there were concerns raised initially about landlords being able to increase rent (as in option 1), it was also recognised that there could be a positive impact for tenants if the properties energy efficiency is improved, leading to better living conditions and cheaper energy bills. It was agreed that a rent cap would be important to protect tenants from sharp rent increases.
Similar challenges identified with a targeted funding approach as were raised in relation to widely available funding, which included concerns around the deadlines (2028 being too near and 2045 being too far), the push towards loans, and the need for clear and comprehensive communications to raise awareness of the changes that people would be required to make.
Other challenges identified with this approach to funding the clean heating transition included:
- A lack of clarity around the penalties, with some being enforced as soon as the deadline expires and others not being enforced right away. This was felt to be problematic and an ineffective way of encouraging people to act:
- “If you say you’ve got to do something by 2045 but there are no consequences for not doing it by 2045 [..] do they really have to do it?” (Participant, phase 2, workshop 3)
- The targeted nature of funding drew mixed views. For some it was felt to be fairer as financial support would be offered to those who need it most, while others felt that targeted funding would result in those just over the qualifying threshold being put under financial pressure. There were also concerns that targeted funding would limit the effectiveness of the policy, with those not eligible being less inclined to act.
- There was a strong view against private financing, which was underpinned by a perception that private sector organisations were motivated solely by profit. If loans were to be offered, it was felt that these should be administered by Scottish Government:
- “I don’t think private sector should offer loans in the first place. The government wants you to do this so they should offer the loan themselves or provide the grant.” (Participant, phase 2, workshop 3)
- As well as providing communications around the efficacy of clean heating systems, participants also felt there should be clear advice on the running costs after installation and reassurance that these would be long-term solutions.
Conclusions
This chapter brings together conclusions from across both phases of the research. Conclusions were reached as participants drew on what they had learned over the course of the dialogue:
In phase one, conclusions were developed iteratively by participants over the course of the dialogue, but were developed in detail in the final workshop and focused on answering the over-arching questions:
- As we transition to net zero, who should pay for the changes that will be needed?
- How do we make that system of payment fair?
- How can we make sure that everyone benefits?
In phase two, conclusions were reached at the end of each sector-focused workshop and concentrated on the fair implementation of Road User Charging, and the funding of the heat transition in domestic properties.
Conclusions have been written using the participants own words as much as possible. Where any edits to wording were made by Ipsos, this was to correct repetition or duplication, or to reorder points into a more logical flow.
As we transition to net zero, who should pay for the changes that will be needed?
The overarching message was that we all have something to contribute. Specific contributions from three broad groups were identified:
Government
The Scottish Government should fund (in an efficient and timely manner):
- Public charging infrastructure for electric vehicles.
- An integrated, accessible, and reliable public transport system.
- Grants and interest-free loans for retrofitting existing homes (available to homeowners and long-term tenants) and purchasing electric vehicles.
- Subsidies and research grants for farmers and other small businesses. This should include support towards the cost of changing land use, encouraging development of lower carbon materials or produce, and reskilling and training initiatives.
- Education and awareness raising programmes.
- Research into low-carbon technologies (e.g. wave power).
- An apolitical body to provide the lead in scientific and evidence-based practice.
- As well as the Scottish Government, local authorities and other public sector bodies also have a big part to play and should cover some of the costs.
Business
Businesses (including landowners and private landlords) should pay for the changes they need to make. This should be through taxes and other means, and with some support from the Scottish Government.
Businesses are especially responsible for costs where:
- There is an opportunity for them to profit from the changes.
- They contribute higher emissions where lower carbon alternatives (e.g. alternative land uses, lower carbon transport options or building materials) are possible.
- They are landlords with a certain number of properties / making a certain amount of money (to be defined).
- They can take on apprentices / reskill people.
- They have a responsibility (e.g. private landlords would be responsible for insulating homes and improving energy efficiency; construction businesses would be responsible for switching to low-carbon materials and technologies; landowners would be responsible and accountable for making changes to the land use).
There should be differentiation between small and large businesses, with support available towards the cost for smaller businesses.
Citizens
All citizens should contribute in some way, whether that’s:
-
- Paying tax fairly.[10]
- Changing how we get around (switching to electric vehicles, using public transport and more active travel) or paying charges for continuing to use high-carbon forms of transport when good low-carbon alternatives are readily available, feasible and appropriate to use.
- Making changes to our homes where applicable (acknowledging that some changes may not be appropriate for older homes), with advice and support available.
How do we make that system of payment fair?
While participants did not settle on one specific system of payment, they did highlight some key aspects of what a fair system would like look. These fall broadly under six themes, as outlined below:
EQUITY
- Make the system equitable, meaning that everyone contributes but not all in the same way or by the same amount.[11]
- Decide what an individual contributes based on their ability to pay (through a means-tested approach) or their ability to act. An independent body should decide on this system of payment (see leadership and accountability section).
- Recognise the range of potential impacts on individuals and communities, and reflect individual circumstances when deciding how much different groups should pay. This should take into account location (differences by urban and rural areas), income and the needs of those with disabilities or long-term health conditions.
- Support those on low incomes, so that they are not disadvantaged by the changes and to avoid people being left with no help.[12] “Low incomes” should be clearly defined and consider overall financial position, including assets and savings. Support could include discounts on travel depending on circumstances.
- Public engagement
- Regularly consult and engage with the public on these difficult decisions.
- Consultation and engagement should be accessible and include a diverse range of groups. These engagements should be representative but small in scale and with a clear timeframe in mind.
- Findings from these consultations should be reported on.
- They should be a joint effort between the Scottish Government and local authorities, allowing for locally-focussed consultation (as national campaigns can miss parts of Scotland and might not reach everyone).
Transparency
- Provide education and information about why we need to make changes to reach net zero and what the impacts will be.[13]
- Be transparent about how taxes, charges, grants and loans related to net zero are decided upon, and about how the Scottish Government is contributing to costs. Make this available to the public in a clear and accessible way.
Infrastructure
- Improve infrastructure across Scotland so that it is easier for people to make low-carbon choices. This should include more access to integrated public transport including in rural areas, affordable or free electric vehicle charging points, measures to make homes more energy efficient and more availability of low-carbon food.
Regulation
- Introduce regulation to control how much businesses (e.g. landlords, supermarkets, energy companies) can pass costs on to consumers. Businesses that don’t comply should be fined.
- Prevent people and businesses from gaming the system or exploiting loopholes (e.g. higher earners, multinationals or landowners receiving more financial support than needed, or paying the charges to avoid making changes that others have to make).
Leadership & accountability
- Have clear leadership and accountability from the Scottish Government, following science and evidence (not politics).[14]
- The Scottish Government should be responsible for setting up a non-political body, overseeing discussions between all the interested parties to take the lead on the just transition (including specialists in all relevant areas). They could take the lead on deciding who pays and ensure it is fair.[15]
- Government-tendered contracts should have a large net zero element and not just who is going to do it cheapest. The independent governing body should review these decisions.
How can we make sure that everyone benefits?
Participants conclusions related to benefits showed similar themes to those relating to systems of payment. Key themes, once again, were of addressing inequality, education, supporting people to make changes and leadership from the Scottish Government.
Reducing inequality
- Use the transition to net zero as an opportunity to reduce other inequalities and make Scotland a fairer society. This could be done by, for example, closing the urban/rural divide, reducing health inequalities, reducing reliance on oil and gas and combatting extreme poverty.
Education and support
- Help all people (adults and children) to understand what outcomes they are contributing to and why it makes a difference.
- Communicate changes in a positive and honest way, emphasising the benefits of net zero for future generations, while acknowledging that changes are unavoidable and will mean sacrifices.
- Proactively tell people what costs and other changes are coming, what support is available to them and what will happen if we don’t make those changes. Proactively combat misinformation. This can be through multiple channels, including TV campaigns and population wide texts.
- Provide easily accessible and accurate information from credible sources.[16] This should include individual calculators/tools to help people determine the impact of their own choices and the support available to them.
- Give people time and support to make these changes (they won’t happen overnight).
Encouraging behaviour change
- Empower[17] individuals and businesses to make low-carbon decisions (where changes are viable) through a mix of “carrot” and “stick” initiatives.[18]
- “Carrots” would be incentives to make low-carbon choices (e.g. tax breaks, grants, subsidies). These should come first and be widely publicised including the consequences of not taking them up (i.e. subsequent “sticks”).
- “Sticks” would be restrictions or charges for making high-carbon choices once low-carbon choices are readily available. These should come after “carrots” and only if there are reasonable, economically viable alternatives already in place.
Business & skills
- Encourage and incentivise key industries to reduce emissions and support small businesses to innovate and come up with solutions.
- Ensure there is an equitable distribution of Scottish Government support across different sectors.
- Ensure that new jobs become available as old jobs become obsolete and that upskilling keeps pace with that.
Planning
- Set milestones so that changes are introduced in a gradual and ordered way, rather than in a late rush nearer to 2045. As part of this:
- Ensure changes are thoroughly planned for first.
- Prioritise changes, so it is clear to people what needs to happen when.
- Continually review progress and adapt plans as needed.
- Be prepared to adapt milestones and follow the science if things change.
Leadership
- Make sure the Scottish Government are leading from the front and setting an example.
What needs to be in place to make Road User Charging fair?
If RUC was to be introduced to reduce emissions within the Scottish transport sector, and to ensure it was implemented fairly, participants concluded that:
It should be implemented with different circumstances and needs to be taken into consideration.
There should be exemptions or concessions for some groups (e.g. people with disabilities, those who live or work in areas where RUC has been introduced, those living in rural areas and those on lower incomes).
Ensure there is reliable, frequent and more integrated public transport infrastructure before RUC is introduced.
Those were the conclusions that participants most strongly agreed upon. But other conclusions reached included that:
- There should be more incentives as well as disincentives (e.g. not charging EV drivers the same as petrol/diesel drivers, and rewarding those who take fewest journeys).
- Changes should be introduced carefully, gradually and the public should be clearly informed about them.
- The changes should be considered in a holistic way, with consideration given to things like the affordability of housing (affecting where people can live and what options they have for getting to work), and the possible impact on tourism in areas where RUC is introduced.
It should be noted that there were mixed views on the principle of RUC, whichever way it is implemented. While it was generally considered to be acceptable if the above conditions were met, there was also a strong and persistent (albeit more exceptional) view that RUC would be intrinsically unfair as it would limit the choices of those less able to afford the charges.
What needs to be in place to ensure funding for the heat transition is fair?
To ensure the costs of the heat transition are distributed fairly, participants concluded that:
There should be support for all, but the share of funding should vary depending on circumstances, such as income and age of property.
Exemptions from penalties should be in place, with a fair appeals process.
Those were the conclusions that participants most strongly agreed upon. But other conclusions reached, which for some were fundamental to any clean heat transition being implemented fairly, included that:
- There should be a proportionate approach that incentivises and supports people to make changes, and allows sufficient time for changes to be made before penalties are imposed.
- The use of loans should be considered carefully, with long and flexible repayment plans that are sensitive to peoples’ circumstances. Ultimately, it was agreed that nobody should be forced to take out a loan.
- There should be reassurances around the efficacy of clean heating systems, grounded in evidence that is clearly communicated with the public. This should be supported by regulation of new technologies being installed.
- There should be a wide-reaching and transparent communications campaign to ensure people understand what’s needed, why it’s needed and what support is available.
Participants’ learning journey
An objective of phase one of the research was to gather learning into the factors influencing any changes in participants’ attitudes, beliefs or values as a result of engaging in this deliberative process. This chapter summarises findings in relation to this objective and draws only on findings from the cohort taking part in phase one.
Extent to which views changed
Early views
As outlined at the start of this report, participants began the process with a fairly good grasp of the term net zero, but less so with the concept of a just transition. Though they had some ideas of the types of change that might be required to reach net zero (such as less reliance on cars, changes to our diet, and different ways of using energy in our homes) they were unsure of the detail about what a just transition to net zero might involve.
Participants started the process slightly daunted by the challenge ahead, but nonetheless open-minded and keen to learn more from experts and from each other. They shared a sense of hope that this deliberative process might lead to some positive action. They also conveyed a sense of the responsibility in their own role in the process, and were keen to make a valuable contribution to the dialogue. However, there was also a note of scepticism about how much impact the process could have, and some questioned whether any action would be taken by the Scottish Government as a result.
Participants’ gradual learning process
As they moved through the process, it was clear that participants were gradually learning new information. During the sector-focussed workshops (workshops two, three and four), participants expressed notes of surprise at some of the information in the expert presentations, which had raised new issues for them or new ways of looking at things. For example, there was surprise at the scale of reduction in car use needed, at the costs of installing heat pumps in homes, and at the level of financial subsidies received by farms.
Learning about the types of changes required to reach net zero also caused some concern among participants, as they appreciated the scale of the challenge ahead and the potential financial implications of those changes. This caused some participants to push back stressing that some changes would be too difficult to implement in certain parts of the country, particularly rural communities, or too costly for certain people.
“It’s hard to imagine me being able to take on any more costs, as someone in fuel poverty. I can’t afford to replace the boiler if it breaks. It seems a bit ambitious, scary. Especially where I live, I am not the worst off, but I struggle to heat the home and then adapt to new technologies.” (Participant, phase 1, workshop 3)
As they discussed the issues further in the sector-focussed workshops, participants said that they had developed a greater appreciation of the need for collective action to reach net zero and for costs to be distributed. Some said they had moved away from a feeling that responsibility lay mostly with the Scottish Government, local authorities or businesses, to feeling that societal-level change was required. However, they acknowledged that sharing of responsibility, and distribution of costs, would be complicated and would require thoughtful decision-making supported by education and awareness raising.
“One of the things that struck me, the just transition will have to be government but also society in general. Society itself has to be a driver. The education value and sharing why this is important will make all the difference.” (Participant, phase 1, workshop 2)
This sense of collective responsibility was a position that they brought into the final workshops, as they started their detailed deliberations and conclusion-forming.
Views at the end of the process
In the final session, participants reflected on whether their views had changed over the course of the process. The overall message was that they had developed and deepened their understanding of the issues, more so than having changed their opinion or position.
Participants noted that, as a result of taking part in the dialogue, they had developed more understanding of the scale and complexity of the challenge of a just transition to net zero. Participants started the process appreciating the importance of reaching our net zero targets, but by the end they had more of an appreciation of how important, but also how difficult, it will be to ensure a just transition.
“I haven’t necessarily changed my views on anything, but it’s forced me to think about this intensely and it’s driven home how important this is.” (Participant, phase 1, workshop 6)
As noted above, there was a greater sense of shared responsibility, and need for collective action to achieve a just transition. At the same time, participants said they had more appreciation of the impacts of the transition on different groups, and for individual circumstances to be born in mind in deciding how costs should be distributed. Indeed, this was one of the strongest messages that participants shared towards the end of the process, and which was reflected in their conclusions. Linked to this, the need to protect the most vulnerable in society was a key theme throughout the process.
“At the start I’d quite naively said the Scottish Government (should be responsible) but I’ve learned a lot and changed my mind…from hearing from the professionals and talking to people in the groups.” (Participant, phase 1, workshop 6)
In addition to the deepening of understanding, one area where views did change somewhat was in relation to systems of payment. In the early stages of the process, some participants felt that responsibility for costs should lie with those who contribute the most carbon emissions. This, they felt, was the fairest way of allocating responsibility for costs. However, as noted in chapter 4, when discussing the scenario of “those who emit the most pay the most”, participants strongly felt that this would not be fair. Having deliberated and considered the impacts of different groups, they felt that some people and businesses have more limited control over their emissions than others. They therefore felt that a more nuanced approach would be required, and that some people and businesses would be unfairly penalised if these differences were not considered.
“I felt it was more apt for the people that produce the most carbon to take the lead…but hearing about farmers and how they don’t really earn money, that really took me aback.” (Participant, phase 1, workshop 6)
Views on who should take the lead
In the first workshop, participants were asked a live-polling question “who should take the lead in tackling climate change in Scotland?” At that stage, around two thirds said it should be everyone (individuals, businesses and the Scottish Government) while two-in-five said the Scottish Government and one-in-five said all individuals in Scotland.
Participants were asked the same question in the final session. As shown in figure 7.1, views did not change to a great extent. The most common answer once again was for everyone to take the lead. However, there was more emphasis placed “certain groups of people” and slightly more on the Scottish Government.
Figure 7.1: Findings from “live polling” question asked in workshops 1 and 6

Participants felt the relative emphasis on the Scottish Government highlighted a need for “leadership from the front”, a point that was highlighted in participants’ conclusions. They also noted that the slight change in the findings between sessions reflected the difficulty of placing responsibility on any one group.
“We all have a part to play but taking a lead, someone has to be in the front. The fact that more people were choosing the Scottish Government and certain businesses and actors, it possibly reflects the complexities of the situation.” (Participant, phase 1, session 6).
In discussing the results of the poll, participants emphasised the distinction between taking action to tackle climate change and taking the lead. It was highlighted that while we all bear responsibility for making changes, there was an expectation that leadership should come from the Scottish Government.
What contributed to views changing
Participants identified a range of factors that had contributed to their learning journey and to their views either deepening or changing. In summary, these were:
- Hearing from each other. Participants felt that having the chance to discuss issues as a group helped them to appreciate different perspectives on the issues and different circumstances. The experiences of rural participants were highlighted as being particularly valuable:
- “I had only thought about my own situation but have learned from people in completely different areas of Scotland and stages of life.” (Participant, phase 1, workshop 6).
- Expert speakers, through their presentations at the workshop and their responses to participants’ questions.
- Characters and scenarios had helped participants to consider the various aspects involved in the transition to net zero and to appreciate how different impacts might be felt by different people.
- Being asked to articulate their views in the sessions helped to clarify and strengthen their own positions:
- “Being asked to speak out, it makes your position clearer. It makes you put it into words, so you’re more aware of your opinion.” (Participant, phase 1, workshop 3).
- Time to think and reflect about the issues, both between the sessions and over the course of the whole dialogue.
Implications from the research
The key outcome of this process was a set of conclusions (shown above) which provide clear suggestions for the Scottish Government to consider as it develops Just Transition Plans. This includes conclusions around specific policy options that were tested in relation to the transport, and built environment and construction sectors. The research also has a number of broader implications for future policy in this area, which are set out below.
- A fair system of payment must consider different circumstances.
When considering three hypothetical payment systems (based on ability to pay, level of emissions, or incentivisation), there were elements of each that were appealing and problematic. While it was recognised that placing responsibility on those who contribute most emissions was fair in principle, there were also concerns that this could be unfair if applied to those without the ability to choose lower carbon alternatives. Meanwhile, a system that considers ability to pay was seen to be more aligned with their overall principles of fairness but would require careful implementation to avoid negative impacts on some groups. Research has shown that there is a disparity between the carbon footprints of high-income and low-income households,[19] which suggests that higher emitters would also be those more able to pay. Ultimately though, participants’ views aligned with the existing National Just Transition Outcome,[20] of a fair distribution of costs and benefits that consider different circumstances.
- There was support for a progressive form of taxation, with higher income individuals and businesses paying more.
It was acknowledged that Scottish Government grants, financial incentives, and wider investment in infrastructure would require additional funding. It was therefore seen as somewhat inevitable that new or different forms of taxation would apply. However, there was resistance to the idea of a general taxation on the basis that this may create financial hardship for those unable to pay more. Instead, participants supported a form of progressive taxation, reflecting the principle of ability to pay noted above. Though not discussed in as much detail, there were also suggestions of taxing larger high-emitting businesses, energy companies, landowners, and a tax on high-carbon products.
- Protecting the most vulnerable in society was seen as a fundamental requirement for any future systems of payment.
Whether discussing broad principles of fairness, or how specific systems of payment or policies should be implemented, participants strongly felt that protections or exemptions should be in place for those least able to afford the payment. Participants also stressed the importance of supporting those with other needs or challenges related to health, disability and life stage.
- A balance between incentives and disincentives may have the greatest appeal and impact.
The use of incentives (such as grants for EVs and clean heating systems, funded retrofitting schemes, tax breaks for businesses that meet emission targets) was considered a more supportive and kinder approach to encouraging behaviour change than using penalties or charges. But they were not universally supported, and some felt they did not go far enough towards encouraging the level of changes required to reach net zero. Disincentives (such as Road User Charging) were broadly accepted on the basis that they would help to discourage car use. However, for both incentives and disincentives to be considered fair, it was felt that they needed to reflect individual circumstances and (as outlined above) ability to pay.
- The timing of any new taxes, charges or penalties will be important.
Introduced too soon, and these pose the risk of placing individuals in financial difficulty and may be met with resistance. Introduced too late and they may not be enough of an incentive to encourage, and instil a sense of urgency in, behaviour change. This was clear when participants discussed the heat transition; they felt that a target of 2028 or 2033 for homeowners to make energy efficiency improvements was too soon, but a target of 2045 for installing clean heating systems was too far away. The most appropriate timing will therefore require a balance between motivating people to change while not unfairly penalising them. A phased, staggered approach was seen as one way of achieving this balance.
- It will be important that the public feel part of the decisions that affect them.
The Just Transition Commission highlighted that “the time for difficult conversions is now”[21] and emphasised the importance of communication and engagement. Participants echoed this sentiment, emphasising the importance of clear and transparent communication about the need for changes in each of the sectors, and the need for ongoing public engagement.
This will be particularly important when it comes to communicating changes such as those outlined in the Heat in Buildings bill. As highlighted in Appendix 2, participants perceived that heat pumps might not be suitable for all environments and there was an appetite for evidence to show their efficacy. A recent study from Energy Systems Catapult found that heat pumps were widely suitable across a broad spectrum of housing types, and that most heat pumps were installed without requiring other energy efficiency upgrades.[22] Communicating such evidence clearly and accessibly will therefore be vital to encouraging uptake.
Learnings from this deliberative process for future public engagement
Reflecting on their involvement in this deliberative research, participants raised a number of considerations to ensure meaningful public engagement on this topic in future. As highlighted in the previous chapter, engaging over a longer period of time enabled participants to consider complex issues more fully than would have been possible with other form of public engagement.
Breakout groups changed between sessions and participants really valued the opportunity this gave them to discuss the issues with different people and to hear a wider range of perspectives. With a relatively small group of people coming together to discuss issues affecting Scotland as a whole, one participant raised a concern that some groups (e.g. those with disabilities) might have been missing from the discussions. Although those with disabilities were represented in the dialogue, this comment underscores the importance of ensuring that participants in public engagement understand why they have been invited to take part, how the group has been recruited, and where their involvement sits in relation to the wider landscape of public engagement on Scotland’s just transition.
Some practical reflections on the process also highlighted the importance of designing an accessible process. As this project sought involvement from people living across Scotland, an online approach was felt to be appropriate and in particular enabled those living in rural areas, those with disabilities, and those with caring responsibilities to take part. Ensuring the information was presented clearly by experts and facilitators was also important, as it enabled participants to engage on the topic and able to express their views in a safe and non-judgemental space. Valuing participants’ time was another factor that ensured an accessible process; as one participant pointed out, they had been set a big task and being paid made them feel that they could dedicate their time and engage meaningfully.
Participants also highlighted the importance (and challenge) of translating the work of the group into effective awareness-raising and engagement with the wider general public.
- “We have now spent almost 15 hours listening to experts and discussing this and we have grown, some have changed [views], some are simply [more aware]. To [share] that kind of information across a population of 5 and a half million…there is quite a gap, with a lot of [work needed] to go forward. Because it’s so complex.” (Participant, phase 1, session 5)
Appendix 1. Transport sector detailed findings
This chapter outlines participants’ views on a just transition in the transport sector. It provides detailed findings from both phases of research:
- Phase one, where a group of 30 people living across Scotland met over six online workshops and an online community to consider what a fair distribution of costs and benefits would look like. It focussed on three sectors, one of which was transport.
- Phase two, where a group of 20 people living across Scotland met over three online workshops to explore specific policy options. One of those workshops focussed specifically on transport, including the potential use of Road User Charging.
Summary of findings related to transport
- The vision for a decarbonised transport system in 2040 was considered difficult to achieve without significant investment in transport infrastructure across Scotland.
- Participants felt that the costs for the transition should be shared between:
- The Scottish Government in providing support and infrastructure.
- Businesses in the transport industry (with support for smaller businesses).
- Citizens, but based on use, access to and choice over lower carbon alternatives, and ability to pay.
- To ensure a fair transition, in which everyone benefits, participants felt that individuals’ circumstances needed to be considered and steps taken to address any barriers they might face. Groups identified as requiring additional support included:
- Those on low incomes.
- People with health conditions or disabilities.
- Elderly people.
- Those living in rural communities.
- Participants highlighted the importance of allowing sufficient time for people to prepare for any changes.
- Improvements to the current public transport infrastructure was seen as a prerequisite for a just transition.
- To ensure any form of Road User Charging is implemented fairly, participants concluded that:
- Different circumstances and needs should be taken into account, rather than taking a blanket approach.
- There should be concessions or exemptions for some groups, including those listed above and those who rely on their car for work.
- Charges should only apply where people have easy access to public transport.
- Road User Charging applied to a defined urban area was considered fairer than an approach based on distances travelled.
What changes were expected?
Early in each phase participants discussed the changes to transport that they thought would need to happen for Scotland to reach net zero. These included:
- A shift towards lower-emitting forms of transport, including more electric vehicles (EVs), car-sharing schemes, and public transport.
- Restrictions on car use in city centres, such as Low Emissions Zones (LEZs) which had already been observed in cities like Aberdeen and Glasgow.
- Electrification of rail and bus networks, with more frequent and efficient trains and ferries.
- Improving cycling infrastructure, including more cycling lanes and incentives for active travel.
- A reduction in the availability of domestic flights in favour of public transport alternatives.
It was felt these changes would be expensive, as the infrastructure in Scotland (for both public transport and EV charging) was perceived to be lacking currently. Participants agreed that the transport network would need to become more integrated for people to be less reliant on cars.
“When I try to travel down south by train, I have to drive to the railway station. That is defeating the object.” (Participant, phase 1, workshop 2)
A distinction was drawn early in the discussions between cities and rural areas which prevailed throughout both phases of the dialogue. Among those living in urban areas, the need to reduce car use and encourage use of public transport was considered a positive, if inconvenient, change. Among those living in rural areas, there was a strong view that insufficient public transport had rendered cars “an essential not a luxury”. Participants expressed concern that public transport would not be improved sufficiently and that rural communities would be forgotten about.
“I worry about rural areas as we have zero public transport. I walk to loads of places but can’t walk 45 miles to the nearest supermarket or 100 miles to the nearest hospital. I feel there’s no voice for rural areas, there’s dreadful infrastructure and I really worry.” (Participant, phase 1, workshop 2)
Overall, it was therefore considered unfair to ask people to rely less on their cars without providing improved public transport. It was felt that this would be particularly unfair on certain groups, such as those living in rural areas, young families, those with disabilities, and elderly people. Improvements that participants wanted to see in transport infrastructure included more frequent, reliable, direct, cost-effective and accessible services.
“Even if the buses were reliable, for what it would cost for a return ticket, you might as well put in the fuel and it works out cheaper.” (Participant, phase 2, workshop 2)
Reactions to initial presentations in phase one
Phase one participants heard introductory presentations providing an overview of the types of changes that would be needed to move to a decarbonised transport system. Following this, the scale of the challenge became more apparent and daunting to some.
“I just think there are some serious decisions to be made – in how we live our lives, do our work, what we feel is essential in our lives – to enable that to happen.” (Participant, phase 1, workshop 2)
As well as sparking further discussion about the potential costs (explored in detail below), the presentations also prompted participants to reiterate concerns about existing infrastructure (such as EV charging), which they felt would need to be significantly improved for this vision to be realised. Participants raised several questions about those infrastructure challenges.
After hearing the presentation about inequalities in the transport sector, participants identified several groups that they felt could be at risk of being left behind in the transition:
- Rural communities, particularly those living on islands, based on the points noted above about the current state of public transport in parts of Scotland.
- Women, noting a point made in the presentation that women were less likely to have access to a car and were more reliant on public transport.
- People on lower incomes, who participants felt may be trapped if they were charged more for using their car but could not afford to replace it with an EV.
- People with disabilities or additional needs, who it was recognised may not find public transport accessible.
- Small businesses, with concerns over potential job losses in the motor industry if EVs required less maintenance and for businesses struggling to absorb the costs of reskilling employees.
Overall, there was a sense that the changes represented an imbalance towards removing transport options without providing alternatives. One participant illustrated this with an example, describing an experience of their partner who sold their car because they could not afford to drive in a LEZ and could not get to work on time using public transport.
“I thought it was quite unfair. She wasn’t able to afford to buy a car she could have driven in the [LEZ] area […] and is now having to use mine […] She was really negative impacted. If she lived on her own she probably would not have been able to keep her job.” (Participant, phase 1, workshop 2)
Vision for the transport sector discussed in phase one
Phase one participants were presented with a vision for public transport in 2040 based on the Scottish Government’s discussion paper (see fig. 9.1) and explored this in the context of different fictional characters and how they might be impacted (see fig. 9.2). The vision was a high level scenario intended to encourage discussion and invite participants to consider its implications, based on the characters and their own lived experiences, before discussing what a fair distribution of costs and benefits would be.
Figure 9.1: Vision for transport

The role of transport for our characters
Alice has a small, petrol car. There is a bus route that can take Alice from the hospital to her flat. But because of her working patterns, Alice prefers to drive to work. Even though this is more expensive, she does not feel safe travelling by bus late at night.
David and Sarah have two cars: a diesel SUV and a mid-sized petrol car. David travels by car most days. Sarah mostly works from home. Either David or Sarah use one of their cars to drop-off and collect their children from school. Noah has a disability and uses a wheelchair.
Lorraine sells produce at a small shop on the farm and supplies local businesses, but most of it is sold to suppliers across Scotland and the rest of the UK. There is no public transport in the area, so Lorraine and her family rely on their cars and vans.
For weekly food shopping and other needs, Maria uses the local shops and services in Moffat. For anything further away, such as medical appointments for herself or for her daughter Ella, she takes a taxi. Those longer journeys would usually require two buses, which are not accessible for Maria.
Nadeem uses a diesel van that he drives most days for work. Ajay drives a small hybrid car, which he uses every day to get to work in Stornoway. He has a bicycle but rarely uses it as he does not feel safe cycling on the road. There is limited public transport where Nadeem and Ajay live.
Who could benefit?
Under this vision, there was a view that anyone in transport poverty[23] would benefit from having access to public transport for their everyday needs. However, there were questions around the extent to which public transport could replace all types of journeys in all places.
Participants felt that these changes might not feel beneficial to everyone immediately, as it would involve more effort and time to get around. Nevertheless, there was an acceptance that this would be a reasonable trade-off for a fairer, healthier society. A broader sense of duty was also felt, with participants recognising that they might not benefit directly from the changes themselves but future generations would.
Who benefits?
As they lived in urban areas and used public transport, participants identified Alice and Maria as two characters who would benefit under the vision, given the improvements to public transport. It was felt that Maria would be able to make more journeys using public transport and would be less reliant on taxis, saving her money. Alice could also use public transport to go to work rather than rely on her car. However, it was pointed out that more regular buses would not necessarily make her feel any safer travelling to work at certain times and that there would be other factors influencing this (such as the bus routes, behaviour of other passengers, and confidence in the driver to manage any issues).
Who might be negatively impacted?
The groups identified as potentially being negatively impacted under this vision were:
- Individuals and businesses in rural communities, if more accessible public transport systems did not reach all parts of Scotland (which some participants felt would be the case), but initiatives like road user charges did.
- Businesses in the tourism or hospitality sector, if road user charging put tourists off travelling to parts of Scotland.
- Families with children, who could find public transport difficult to use.
- People who drive for a living, if they were not exempt from road user charges.
- People with limited mobility, if they were not able to use public transport and were not exempt from road user charges.
Participants also commented on the intersectionality of these groups, and highlighted the need for different circumstances to be taken into account.
Who could be negatively impacted?
Although David and Sarah would have to adapt their lifestyle (e.g. use of two cars), it was felt they would be able to adapt and absorb the costs with their income, so they would not be at risk of losing out. However, it was recognised that there would need to be some flexibility or exemptions given for their use of the car when travelling with their disabled son.
Lorraine was identified as at risk given the impact of the changes on her farm and limited low carbon alternatives for agricultural vehicles and personal car use (based on the view that the sort of rural area where she lives is unlikely to have the level of integrated transport needed).
It was felt that Nadeem would also be negatively impacted because of his reliance on a van for his work and the fact that he lives and works on an island. Based on the assumption that public transport would not be a viable alternative, it was considered unfair that his earnings would be affected by road charges.
While it was recognised that society as a whole would benefit if this vision was achieved – due to reduced air pollution and increased social interconnectedness – doubts remained over whether it could happen, and whether it could be implemented in a way that everyone benefits from.
Phase one conclusions on a fair distribution of costs and benefits
As we transition to net zero in the transport sector, who should pay for the changes that will be needed?
There was a broad sense that the costs of transitioning to net zero in the transport sector should be shared and that no single organisation or group should bear sole responsibility. However, participants identified particular groups as being in a position to take more responsibility for these costs.
A common view was that the Scottish Government should pay a substantial share to help people make the transition to a decarbonised transport system and to encourage behaviour change in how people travel, through incentivisation such as grants for the purchase of EVs and private charging infrastructure, and free public transport.
“If the government wants everyone to change the way that we live, then they need to put more back in than us ourselves. If they want us to do so much more, they need to help out more than us personally.” (Participant, phase 1, workshop 2)
However it was also acknowledged that any costs paid for by the Scottish Government could end up being borne by the individual anyway through taxation. Participants’ discussions therefore focused on ways to make this fair (see fair payment systems).
It was also felt that the transport industry should take on some of the costs, especially where there was scope for businesses to profit (for instance due to increased demand and/or where they contribute higher emissions. Delivery companies had been mentioned in the presentation and it was felt that such businesses could bear the costs of decarbonising their fleets. However, it was also recognised that smaller businesses – such as local mechanics – would need financial support from the Scottish Government to make the initial changes required and to retrain the workforce in new green skills.
Participants recognised that all citizens would ultimately have to pay something to help reach net zero in Scotland’s transport sector, but identified certain groups that they felt should bear more of the costs. It was generally expected that service users – i.e. people already using public transport – would continue to pay for that, and those benefitting from specific aspects of the transport system (e.g. EV infrastructure) should contribute in some way. It was suggested that those contributions could be scaled according to ability to pay and based on some wider investment in infrastructure.
It was suggested that those who can avail of alternative forms of transport (but choose not to) should pay more for making choices that result in higher emissions, for example:
“If someone makes a choice to have two cars in 2040 where we have great transport links, they need to justify it or pay up.” (Participant, phase 1, workshop 2)
It was also suggested that tourists could pay a share of the costs through a tourism tax aimed at supporting changes in certain areas. However, as highlighted above, there were also concerns that such charges could reduce the number of visitors and negatively impact businesses that are reliant on tourism.
There were some references to high carbon emitters and suggestions that they might be expected to pay more e.g. businesses that have high emissions, or individuals that continue to drive petrol or diesel vehicles. It was pointed out that those on higher incomes would be more likely to be able to pay the charges and continue high emitting behaviours, or be more likely to afford the low carbon alternatives.
“The wealthy will always be able to do whatever they want to do. They will do however miles they want because they will pay the charges. The poor will be disadvantaged because they can’t pay.” (Participant, phase 1, workshop 2)
However, this point was qualified by a view that some high emitters may not have a viable alternative, either because of where they live (i.e. those in rural areas may have no alternative to cars) or because of income (i.e. some would not be able to afford the switch to EVs). Affordability, therefore, was seen an important consideration, even in the case of those contributing the highest emissions:
“Those with older vehicles, and so higher emissions, will be penalised but it might be unfair if those people cannot afford new, cleaner vehicles. This will disadvantage those who cannot use public transport as an alternative for whatever reason. People on lower incomes are always left behind.” (Participant, phase 1, online community)
A view shared by some participants was that there will be parts of Scotland that will lose out once the changes are implemented. This view was particularly held by those living in rural areas who did not feel that the vision for transport in 2040 was realistic for rural communities, and considered it unfair to expect those communities to cover the costs of changes that (some felt) ‘will make their situation worse’.
“It will not cover everyone’s needs here, the system and infrastructure is so dreadful they would need to start major roadworks now. I don’t see any of this helping rural areas at all.” (Participant, phase 1, workshop 2)
How can we make sure that system of payment is fair?
Thinking about individuals and groups in society who could pay for the changes needed to reach net zero, participants were supportive of a system of payment based on:
- Use, with those benefitting from a particular mode of transport, or from a part of the transport infrastructure, or using these more paying a higher share. It was also felt that those using forms of transport that carry higher emissions (e.g. petrol/diesel cars) should pay a higher share for that, but only if they can afford to do so and if other choices are available (as outlined in the next two points).
- Ease, availability and choice, with those who have services available to them paying, and correspondingly those who do not have services available or who are not able to use the services not paying. Choice was a particularly important factor in who should pay. Taking road charges as an example, participants felt it was not just important to think about proximity to public transport, but circumstances:
“I live in a rural area where the closest bus is a mile away and the closest train station is nearly 2 miles away. This means I’d have difficulty reaching either of those services, [and] when I am able to get there I’ve either had to walk or drive making it in my eyes a waste of time.” (Participant, phase 1, online community)
- Ability to pay. In defining what ability to pay means, views were mixed. Some suggested this should be linked to benefits (none specified), while others felt this would be unfair to those not on benefits but with low incomes. A more exceptional view was that there should be a flat fee applied to everyone. There was broad agreement, however, that those on lower incomes should pay a smaller share than those on higher incomes:
“It’s got to be based on what people can afford. In principle, it needs to be progressive, otherwise you will end up with poor people paying too much, and richer elements of society paying too little.” (Participant, phase 1, workshop 2)
Participants felt that a fair payment system would require individual circumstances to be taken into consideration, in particular the needs of those in rural communities. For example, it was felt that car users in rural communities should not pay for road user charging if lower carbon alternatives (i.e. public transport or EV infrastructure) were not available to them and they were still reliant on petrol or diesel cars.
“[For] people in rural communities who may struggle to transition to electric cars in particular (short range, financial challenge, no viable public transport alternative), will rural communities be given concessions, assistance?” (Participant, phase 1, online community)
A range of ideas were suggested for taking different circumstances into account. These included a points-based system with an annual self-declaration (considering a range of criteria such as location, mobility, age, and financial circumstances) or a carbon token allowance system for individuals and companies.
When considering the role of business in sharing the costs, participants worried that these could be passed onto the consumer (e.g. consumers paying more for items being delivered to their home or EV charging prices being increased while companies make large profits). It was therefore felt that there should be “checks and balances” in place to prevent this from happening. But there was also concern for smaller businesses being unable to adapt, so it was considered fair that they would be supported by government.
“The government, which has the power to force change must be aware of the negative effects of forcing costly change on businesses that may not be able to afford it. Appropriate support should be in place, this may be financial, educational or of other modes such as time limited exemptions”. (Participant, phase 1, online community)
In terms of the Scottish Government’s role in sharing the costs, it was recognised that some of the funding would inevitably be raised through taxation. A progressive tax was supported, based on both ability to pay and ability to choose.
“Everyone has to contribute, but what you contribute depends on what choices you are able to make. If you make personal choices that will have more of an impact, you should pay more for it. In many places, you don’t have the choice. You have to factor all that in.” (Participant, phase 1, workshop 2)
Overall, it was felt that any fair system of payment would need to give people time to make the changes required. In practice, this would mean giving plenty notice of the introduction of new regulations, taxes, charges, or incentives. Related to this, one suggestion was to introduce a sliding scale so that those not making the changes required are charged more as time elapses.
It was also stressed that certain groups will need additional support, or exemptions from the costs. Echoing earlier views, there was widespread concern about the impact of costs on those who were already struggling financially, particularly in the context of the cost of living crisis. There was therefore a strong desire to protect and support those least able to afford the changes, as well as those with restricted choices in their transport use (e.g. those with disabilities and those in rural areas with no accessible services).
How can we make sure that everyone benefits?
If the vision for a decarbonised transport system was realised by 2040 (and there was some scepticism over whether it would be), a number of broad societal benefits were identified, including:
- A more integrated, smoother and accessible public transport for Scotland (as outlined in the vision) improving health, wellbeing and social connectedness.
- More services for communities to support a thriving local economy, reducing the need for people to travel further for their everyday needs.
As with costs, participants highlighted that the benefits of the transition may not be the same for everyone. To ensure that everyone benefits from the transition, they therefore felt that specific circumstances of different groups should be acknowledged and steps taken to address the barriers they may face. This included the groups already mentioned: those on lower incomes and those struggling financially; people with health conditions, disabilities, and elderly people; and those living in rural communities.
Participants felt that further education and engagement on the benefits of the transition was required. Public consultations, particularly with those most likely to be affected, were suggested as an effective way of understanding the needs of these groups.
“At the moment there seems to be a disconnect between the current Scottish Government and the public; they are not listening to the genuine concerns of those who will be most affected and are least able to shoulder these burdens.” (Participant, phase 1, online community)
It was also felt that the necessity of transitioning to net zero in the transport sector (and the benefits of doing so) would need to be clearly and widely communicated to people living in Scotland. Related to this, a theme of transparency emerged, with participants highlighting the importance of the Scottish Government showing how funds raised were being used (e.g. to improve public transport infrastructure).
“You would need an acceptance from the collective good, that everyone is going to buy in from the system […] You have to take everyone with you on it, and that is a big challenge.” (Participant, phase 1, workshop 2)
There was a view that reducing the cost of public transport would not have an impact on vulnerable groups unless it was available or accessible to them. Infrastructure improvements were therefore seen as a prerequisite for all people benefitting from the transition to net zero in the transport sector.
“Older people already have free access to bus transport but if the buses don’t go where you need it’s no use.” (Participant, workshop 2)
Exploring transport policies in phase two
In phase two, participants discussed the potential application of Road User Charging (RUC) as a way of helping reduce our reliance on cars. They considered two possible approaches to this:
- UK national road pricing, involving a charge on drivers based on distance driven.
- Urban local road user charging, involving a charge to drive into specific parts of an urban area.
Participants explored each approach through scenario-based discussions and considered the implications for different people living in Scotland (using some of the same characters from phase one).
Initial views on the idea of Road User Charging
Before the two approaches were presented, participants shared their initial thoughts on the idea of RUC in principle. Some clear themes emerged, which included:
- Not implementing it as a blanket rule: while it was recognised that RUC could encourage people to reduce their reliance on cars, it was also felt that it could impact negatively on some groups (e.g. those on low incomes and those who rely on their car because of a disability or health condition, their work, or where they live). It was therefore agreed that exemptions or permits would need to be in place for these groups.
- Ensuring there are alternative choices available: initially it was felt that applying some form of RUC would be fair where public transport alternatives were readily available (e.g. in cities), but not in areas where cars are not a choice but a necessity due to a lack of accessible public transport option (e.g. in rural areas):
- “People who live in rural or isolated locations. It’ll be a struggle to get to public transport. I think it will be unfair to put charges on them when they don’t have an option.” (Participant, phase 2, workshop 2)
- Ensuring that funds raised through RUC are spent on public transport improvements, which highlighted the importance of transparency in the policy for the public to trust it:
- “The money raised needs to be used to directly improve the transport system rather than being gobbled up by the government.” (Participant, phase 2, workshop 2)
It was broadly felt that RUC would be acceptable to the public if they understood why it was being introduced and what the benefits would be. However, there was some opposition to the principle of RUC on the basis that it would restrict peoples’ autonomy. It was felt that this would impact those on lower incomes most, as they might have to make decisions based on where they can afford to travel to, while higher earners could absorb the cost and not have to change their behaviour, thus exacerbating current inequalities.
Views on UK national road pricing
UK national road pricing was introduced as a possible approach to RUC that would cover all of Scotland’s roads and involve a charge on drivers based on distance driven, as described in the following table: (see figure 9.3).
|
Option 1 – UK national road pricing |
|
A number of benefits to this approach were identified, such as cleaner air, improved health and wellbeing, and encouraging greater uptake of public transport.
Participants noted that the money raised would be invested in improvements to public transport and active travel infrastructure. It was agreed that this should be prioritised in rural areas where public transport was widely perceived to be less available and accessible.
“A good thing about it is that the money raised is put towards public transport. If the money is invested into rural areas, that’d be really good. That’s where the money should go because they need transport.” (Participant, phase 2, workshop 2)
Consideration for different circumstances
Reflecting one of the recurring themes from phase one, participants felt strongly that an approach like this would need to take account of different circumstances. It was reiterated that a charge on people living in rural areas who are reliant on their cars to access services would be unfair due to the lack of alternative options available to them.
“It would be unfair for those that live in rural areas to pay the same when they don’t have a choice in transport.” (Participant, phase 2, workshop 2)
Participants also discussed the impact on people they knew who travel long distances across the country as part of their jobs. With the prospect of national road pricing, it was felt that they would struggle to absorb these charges.
Participants noted from the scenario description that costs would vary depending on certain factors, such as the user’s disability status, and this was broadly welcomed.
“People who are dependent on cars with disabilities, there should be nothing stopping them using their cars, but people who could make small adjustments to their lifestyle, they should just have to bite it” (Participant, phase 2, workshop 2)
To ensure that national road pricing takes account of different circumstances, it was agreed that there should be clarity around who the charge applies to.
Who would be impacted more?
While it was felt that David and Sarah (a couple living on the outskirts of Glasgow with their two children) could afford the charges and make small adjustments to their lifestyle to reduce car use, it was also recognised that there would be circumstances where they would need their car to care for their disabled son and that they shouldn’t be limited in this circumstance.
This approach was also considered to be unfair for Nadeem (a rural builder), who would not have a choice but to transport his equipment and materials by van and incur the charge.
Balancing incentives and disincentives
When looking at national road pricing, there was some surprise among participants that EV users would not be exempt from the charge. There were mixed views on the fairness of this. On the one hand, it was felt that applying road pricing to EV users would act as a disincentive and would contradict other messaging that encourages drivers to switch to EVs. This concern was tied to a broader wariness around the potential that consumers would be faced with costs from multiple different angles.
“They’re trying to force you to buy an electric car, but once everyone has got an electric car, they’ll change the rules. As a consumer, I just pay, pay, pay.” (Participant, phase 2, workshop 2)
On the other hand, it was felt that EVs should be charged as they would still contribute to emissions through the manufacturing process, to wear on the roads. It was also felt that owners of EVs were more likely to be higher earners and therefore could afford the charge. If the objective is to reduce overall journeys by car, then exempting EVs would not help in achieving this.
It was suggested that this form of RUC would be fairer if EVs were charged less than petrol/diesel cars to encourage lower carbon choices, while also encouraging people to rely less on their cars overall.
“You could say you could be charged reduced rates for that purpose. You are contributing less compared with other people, so that could be one way around.” (Participant, phase 2, workshop 2)
How the charge is paid
The indicative cost of 3-10p per mile driven drew mixed responses. For some this amount was felt to be too low to have the desired impact, while others felt increasing the charge would place an unfair financial burden on people who are already struggling. It was suggested that charges could be increased over time to target those who choose to absorb the cost and continue to drive.
Participants also had questions around how drivers would be expected to pay the charge. It was highlighted that a one-off annual charge could come as a shock to some drivers and would be harder to pay in one go. Instead, participants suggested that the costs should be paid in instalments to ease any financial pressures.
It was also suggested that the charge could be lower (or lifted) during the night to ensure those working night shifts have more choices available to them. This was considered important in the case of people who may not feel safe using public transport at night.
“I think there are different circumstances between somebody travelling to work and somebody travelling for leisure. I’m not sure how you would separate the two for making a charge.” (Participant, phase 2, workshop 2)
Who would be impacted more?
When considering this approach in relation to Alice (a nurse living in a city), the safety concern around her using public transport for night shifts was discussed.
While one view was that Alice has the choice to drive or take public transport available to her and so it would be fair for her to pay the charges, another view was that it would be unfair for her to have to choose between her safety and her finances.
Building on the concern raised about mixed messages, rules changing over time, and the costs for consumers continuing to mount up, it was felt that any changes introduced should be for the long-term.
“If you’re going to have a just transition, make it sensible for the consumer and don’t make the consumer pay more and more.” (Participant, phase 2, workshop 2)
Views on urban local road user charging
Urban local road user charging was introduced as another possible approach to RUC that would involve a charge to drive into specific parts of an urban area, as described in the following table: (see figure 9.4).
|
Option 2 – Urban local road user charging |
|
This approach was considered to be fairer than national road pricing. While delivering the same benefits (e.g. cleaner air and improved public transport), participants also expected this approach to be implemented in areas where alternatives – such as public transport and park and rides – would be readily available. Participants were also reassured that similar systems had already been implemented in other cities.
“This one is targeting particular areas and not all journeys. You’re given an option to use your car or public transport to get into the city.” (Participant, phase 2, workshop 2)
Who could be impacted less?
This approach was considered fairer for Nadeem, as it was assumed that he would not be travelling into areas where RUC was in place and his rural building business would therefore be unaffected.
For David and Sarah, while it was recognised that RUC would likely affect them, they would have alternative public transport options available to them as they lived in a large urban area.
Offering alternatives
Reiterating earlier discussions around the importance of providing alternatives, it was strongly felt that adequate public transport infrastructure would need to be in place before RUC was introduced to an area.
“I think it would have to be done once the developments on public transport were completed and once the government had good confidence that public transport is efficient.” (Participant, phase 2, workshop 2)
Exemptions
Participants queried how those who live within the charging zone, or travel in and out of it for work, would be treated. While it was felt that some businesses would be able to absorb the costs or find alternatives, it was perceived to be unfair on those who already live or work within the RUC areas. There was broad agreement among participants that exemptions would need to be made for such groups. Similar to national road pricing, it was felt that some EVs should also be exempt, such as those used for work purposes.
“If you’re already living in an area and then you suddenly get told you’re going to have to pay £5 or £15 any time you take your car out purely because of where it is, I would say that would be quite unfair.” (Participant, phase 2, workshop 2)
Urban area differences
The definition of an “urban area” was also scrutinised, with a distinction drawn between cities like Glasgow or Edinburgh, and cities like Inverness. Inverness was considered to be a city that connects people by transport in rural areas to the rest of Scotland. If local road user charging was introduced here, there was a concern that it would limit the mobility of those living in the surrounding rural areas. This added to the concerns raised earlier about not taking a blanket approach, but considering different circumstances.
“In Inverness, you wouldn’t just be restricting the city centre, you’d be restricting other areas outside of that. Inverness city centre is a connecting point to get to other areas. I can’t see this working [there].” (Participant, phase 2, workshop 2)
What needs to be in place for Road User Charging to be fair?
Participants identified a number of conditions that would need to be in place to make Road User Charging fair (see conclusions section). In reaching their conclusions participants were broadly accepting of the principles of Road User Charging, based on the view that it could help encourage some of the significant changes needed for Scotland to reach its net zero targets.
A more exceptional view was that it would be difficult (and for one participant, impossible) to make RUC fair. Participants drawing this conclusion considered there to be too many variables to consider, and were concerned that RUC would ultimately deepen inequalities by limiting the choices of those less able to afford the charges.
“I can imagine if you’re already living hand to mouth, it would be very stressful to keep track of all your miles and try and work out exactly what you’re going to be paying.” (Participant, phase 2, workshop 2)
Appendix 2 – Built environment and construction sector detailed findings
This chapter outlines participants’ views on a just transition in the built environment and construction sector. It provides detailed findings from both phases of research:
- Phase one, where a group of 30 people living across Scotland met over six online workshops and an online community to consider what a fair distribution of costs and benefits would look like. It focussed on three sectors, one of which was the built environment and construction.
- Phase two, where a group of 20 people living across Scotland met over three online workshops to explore specific policy options One of those workshops focussed specifically on the built environment, including the transition to clean heating systems in domestic properties.
Summary of findings
The vision for the built environment and construction sector was viewed positively, but also as overwhelmingly ambitious. Participants felt costs should be shared between:
- The construction sector
- Multiple property owners
- Homeowners
- The Scottish Government
To ensure a fair transition, and that everyone benefits , it was suggested that:
- Those who profit from buildings should pay for the work needed to make them adequately energy efficient.
- Costs should be distributed based on ability to pay, which could include a means-tested approach to payment. Having more than one property was viewed, by some, as an indicator of wealth and that such individuals could afford to pay for changes to their properties.
- Landlords have a responsibility to pay for their properties and there should be regulation to ensure they do so without passing on costs to tenants.
To ensure the heat transition is paid for in the fairest way possible, it was concluded that:
- There should be support available to all households but that the amount of support should vary depending on circumstances, with those on low incomes and those with older properties entitled to the most government funding.
- There should be protections in place, such as exemptions from penalties for vulnerable groups, rent increase caps to protect renters, regulation on the installation of new heating systems, and a fair appeals process.
- Other considerations included careful consideration around loans to avoid pushing anyone into financial hardship, reassurances around the efficacy of new heating systems, and clear communication with the public about the changes required.
What changes were expected?
Early in each phase, participants discussed the changes they thought would be needed for the built environment and construction sector to reach net zero. Their suggestions covered people’s homes, commercial or public buildings, and the broader construction sector, including:
- Phasing out use of fossil fuels, for example shifting from gas and oil to cleaner heating systems in homes.
- More energy efficient buildings.
- Using more sustainable materials in construction.
- Increased regulation on standards and location of new builds, including ensuring buildings were weather-proof.
One of the key challenges participants identified at this stage was with retrofitting existing buildings. They felt this would be difficult due to the age and characteristics of a property (e.g. whether it would be possible to install cavity wall insulation), location (e.g. there was a perception that heat pumps did not work well in all environments), and the potential cost and disruption caused by making adaptations.
“It [is] easier to address environmental and energy issues when building new houses, most of the problems arise when we try to improve these issues in older housing stock. It means prohibitive costs to change heating systems and insulate old buildings. Who is going to pay for this?” (Participant, phase 1, online community)
Potential challenges were also raised specifically in relation to rural communities due to the nature of the existing housing stock, the climate, and the availability of skilled workers.
On heating systems specifically, participants raised concerns about the upfront cost, their perceived suitability for some properties (e.g. apartments with limited external space or coastal properties), and the efficacy of such systems based on what they had heard. One participant, who had seen planning applications for heat pumps as part of their job, highlighted that the process of installing can also be difficult.
“I’ve heard a lot of bad press about heat pumps not working properly […] I’ve heard people have installed them and removed them and gone back to boilers as they couldn’t get their house warm enough. It would be off-putting if you’re going to spend thousands.” (Participant, phase 2, workshop 3)
In discussing their expectations for the sector there were early suggestions of financial support for homeowners to make changes to their property in the form of means-tested grants.
Reactions to the initial presentations in phase one
Phase one participants heard a presentation outlining the Scottish Government’s vision for the future of the sector, the types of changes that would be needed to achieve it, and the benefits and challenges associated with decarbonising the sector. A second presentation then outlined the inequalities within the sector that would need to be addressed as part of the transition to net zero.
Echoing many of the sentiments raised in earlier sessions, some participants mentioned feeling overwhelmed about the scale of the challenge in terms of cost, feasibility of retrofitting, and extent of upskilling required.
“It will be difficult to bring current homes up to standard, mainly due to costs…I have an older, solid stone house, which is a nightmare to heat. It’s not on the gas grid, but uses electric and coal. It comes down to funding for me.” (Participant, phase 1, workshop 3)
In their initial reactions to the presentation, participants suggested that those profiting within the sector (landlords, energy companies, and construction companies) should bear a greater share of costs than the public should. Having heard about the costs associated with changes such as heat pumps, participants felt that financial support from the Scottish Government would be needed to help homeowners to afford those changes.
Participants also stressed the importance homeowners receiving trustworthy advice regarding the changes required to their properties, and of contractors carrying out high quality work. The need for regulation in the private rental sector was highlighted, as a way of ensuring that landlords did not pass on the cost of upgrades to tenants.
Vision for the built environment and construction sector discussed in phase one
Phase one participants had a chance to view a future vision for the built environment and construction sector on the online community and again in the workshop. The vision (shown in figure 10.1 below) was based on the Scottish Government’s discussion paper for the sector. As well as sharing their own views on the vision, participants revisited the five fictional characters (show in figure 10.2) and discussed how it might impact on them.
Figure 10.1. Vision for the built environment and construction sector

The role of the built environment for our characters
Alice lives in a three-bed flat with two friends. They rent from a private landlord and share responsibility for bills. The flat has electric heating. It has double glazing but is drafty and has poor insulation. She hopes to buy her own property when she has saved enough money.
David and Sarah live in a semi-detached house which they own. Their home has an EPC B rating. It has gas central heating, double-glazing, and loft and cavity wall insulation. They own a second property, which they rent out. This property lacks insulation and has an EPC D rating.
Lorraine lives in a 1920s home. It does not have central hearing. She uses a wood burning stove and electric storage heaters. She has external wall insulation, but the home still has a low EPC E rating. Her daughter wants to work in construction but there are not many local training opportunities.
Maria lives in a ground floor flat which she rents from the housing association. The flat is in a flood risk area. She requires a minimum level of warmth, meaning her heating is used all the time. The flat has an EPC C rating, with double glazing, central heating and loft insulation.
Nadeem and Ajay live in semi-detached property. The property has solar panels and a ground source heat pump. Nadeem is a builder and is working on more new builds. He feels he needs training on new construction techniques for him and his staff.
Who could benefit?
Participants identified groups who would benefit from the vision, provided certain measures were in place. The construction sector was identified as potentially benefitting from the additional work involved in retrofitting buildings, which could lead to profit and the creation of new jobs. Participants noted that construction firms that were already working in line with the vision would find the transition easier than those having to change practices.
“Most of the cost is in retrofitting older buildings. If you build a new building already to high standards the costs are reasonable. You could factor in a heat pump at the beginning. I think the building industry is perfectly able to adapt to that with minimal challenge.” (Participant, phase 1, workshop 3)
Participants felt that those currently living in an energy inefficient home would benefit from the energy efficiency improvements proposed under this vision. It was suggested that homeowners who could afford to make those changes would likely find this aspect of the transition easiest. It was felt that home buyers would benefit from new builds being built to high energy efficiency standards, as long as those new homes were affordable.
Participants also felt that social renters might face fewer challenges in implementing the changes needed, which was based on a perception that responsibility for making upgrades to their homes would lie with providers of social housing, such as the council. However, they also noted that a drawback for social renters was their lack of control over these types of decisions and that they would have to rely on providers of social housing to make improvements. There was equally a concern that private landlords would pass cost on to tenants.
Who benefits?
Nadeem was identified as benefitting from an increase in work for the construction sector and from training opportunities available on new construction techniques, provided these are accessible to him and his staff.
Alice would benefit from improved energy efficiency, provided upgrades were carried out by her landlord and that additional costs associated with this were not passed on to her. She would also benefit if she was able to afford a high-quality new build.
Maria was also identified as benefiting, if the housing association carries out upgrades and if appropriate measures were introduced to reduce the risk of flooding to her property.
Who could be negatively impacted?
Participants felt that there was potential for homeowners to be negatively impacted if they found energy efficient improvements unaffordable. There was specific concern about middle income earners, who it was felt might not qualify for financial support towards making their homes more energy efficient, yet may not be able to afford those changes.
“The asset rich cash poor single homeowner is going to be the one that’s hit most. You apply for the grant and they’ll say you have a pension and savings but, you can’t access it in the same way a council tenant can.” (Participant, phase 1, workshop 3)
Participants also felt that there would generally be higher costs associated with living in a rural area, which would impact on ability to afford upgrades. For example, it may cost more to transport construction materials to rural areas.
There was concern that new builds with very high energy efficiency standards would be more expensive which would affect home buyers or self-builders’ ability to afford a new property.
As well as barriers related to costs, participants also noted that it may not be possible to upgrade certain properties due to their age or location (e.g. listed buildings) meaning people living in these properties would not benefit from the vision. There was also concern about the possibility of property owners receiving bad advice about upgrades or work not being carried out to a high standard.
While the construction industry was identified as benefitting overall, participants emphasised that some workers could lose out if there were no local training opportunities available to them, or if they would find it difficult to reskill given their age or need for financial support.
Who could be negatively impacted?
Lorraine was identified as at risk because her property had a low EPC rating and would likely require a lot of work to make it energy efficient, which she may not be able to afford.
Reflecting the points raised above, it was felt that Alice was at risk of losing out if her landlord increased her rent to cover the costs of changes to the property. This would also affect her ability to save for a new property, especially if very high energy efficiency standards led to increased costs for new builds.
Phase one conclusions on a fair distribution of costs and benefits
As we transition to net zero, who should pay for the changes needed in the built environment and construction sector?
In the workshop, the types of costs covered by the expert speakers included those associated with the construction of new buildings, those required for the retrofitting of existing buildings (e.g. through insulation or heat pumps), and the training and reskilling of the construction workforce. Participants discussions therefore centred around these broad cost categories.
As with the transport sector, there was a sense among participants that the costs of transitioning to net zero should be shared and that no single organisation or group should bear sole responsibility. Groups that participants felt should contribute to paying for the changes included:
- The construction sector. As noted above, it was felt that the buildings and construction industry was likely to benefit from the changes needed to reach net zero, due to demand for new homes and the retrofitting of existing homes to bring them up to standard. As the industry would likely profit from an increase in demand, it was considered fair for them to pay a share of the costs. In particular, it was felt that the industry should bear the cost of reskilling the workforce, as this would ultimately benefit them (though some suggested that the Scottish Government and colleges or universities should also share some of this cost):
“The companies that are building the new properties should bear a reasonable chunk of [the cost] because they’re going to profit from selling the properties. And they have a duty to bring the properties up to some sort of [standard].” (Participant, phase 1, workshop 3)
- Those owning rental properties. There was an expectation that social landlords would bear responsibility, and therefore the cost of making changes. Further, there was a strong feeling that private landlords should pay to bring those properties to a suitable energy efficiency standard. Similar to the views about the construction industry, it was felt that those generating profit from the property market should and could pay for changes needed, and that they should be held responsible for ensuring properties reach the necessary standard of energy efficiency:
“If they can generate profit from just owning [an additional property], they should be expected to maintain the same or higher standards than private owners or council flats.” (Participant, phase 1, workshop 3)
- Homeowners. It was generally accepted that homeowners should contribute to the costs of making changes to their properties, as this was seen as part of the responsibility of owning a property. As the cost of making changes would potentially be very high, it was suggested that financial support should be made available for homeowners, ideally in the form of grants or interest free loans. Some felt that homeowners may benefit financially in the long term, as making the improvements to the property may save money on bills or increase its value, although this would depend on local circumstances. A tiered system of payment was therefore suggested, reflecting ability to pay and other circumstances (explained further below in relation to systems of payment):
“I think that low or no interest loans would be welcomed. It’s taken me this long to put together a 5% deposit. I’ve done the biggest bunch of [saving] that I can do … that would take the pressure off me.” (Participant, phase 1, workshop 3)
- The Scottish Government. Due to the scale of changes required to buildings (e.g. one of the expert speakers noted that almost 2 million homes will need retrofitting) and the level of costs (e.g. installing a heat pump was described by one of the experts as potentially costing up to £15,000 for some households), it was felt that individuals would require support from the Scottish Government. Some participants shared their own experiences of looking into heat pumps, saying that they were unable to get them because they were prohibitively expensive. Government support towards this, and other costs associated with retrofitting, was therefore considered necessary:
“I don’t think it’s doable to pay for this all on our own. Obviously this is something we all want and it needs to be done. But there does need to be funding or grants to help people.” (Participant, phase 1, workshop 3)
How can we make sure that system of payment is fair?
In discussing fair systems of payment, two clear themes emerged:
- First, that the built environment was complex, with many different players involved and different circumstances to be considered. As such, it was felt that while collective action was required to help reduce the emissions from our buildings, there was no “one size fits all” approach to covering the costs.
- Second, that those who were unable to afford the changes, particularly those on lower incomes, should be provided with support. Of the potential systems of payment discussed in the workshop and online community, the approach that was met with most support was one based on addressing inequality and ensuring that those on lower incomes did not get left behind.
There was at least some level of support for the following systems of payment:
- Ability to pay. It was felt that individuals all have a part to play, but there should be a tiered, perhaps means-tested, approach to payment. This would mean that those most able to afford changes would make higher contributions, potentially through a tax-based system of payment. There was some discussion of the pros and cons of means testing given the bureaucracy this would require, balanced with a need to act quickly in order to reach net zero by 2045.
“The people who build the biggest and poshest houses, there should be some kind of tax on them to help insulate the people at the bottom of the market… A bit of taxation redistribution there would be useful.” (Participant, phase 1, workshop 3)
- Profit-sharing. As noted above, a strong sentiment in the workshops was that those who made profit from buildings (both from their construction and from leasing them to tenants) could and should pay for the work needed to make those buildings adequately energy efficient.
- Number of properties. Having more than one property was viewed, by some, as an indicator of wealth and that such individuals could afford to pay for changes to their properties. However, some challenged this by saying that having a second home did not automatically mean that they could cover the high costs of installing heat pumps or similar measures.
“Unless there are solid reasons why the individual owns more than one home, then they should incur more cost and inconvenience than those living in properties which are appropriate to their needs.” (Participant, phase 1, online community)
- Ability to make changes. Linked to the point above, it was felt that landlords (both private and social) have a responsibility to pay for their properties, and that tenants should not be obliged to cover the costs. It was seen as unfair for landlords to pass the costs of improvements on to tenants – otherwise, the already challenging costs of renting and attempting to purchase a home would become even more prohibitive. This led participants to suggest regulation of private landlords to ensure they bring their properties up to standard and prevent them from passing these costs on to tenants.
“If they talk of passing on costs to the renter, if there are not things like rent controls, then the housing situation will become so bad that no one will be able to afford to live anywhere.” (Participant, phase 1, workshop 3)
- Some participants with experience of renting or owning a property within a building with shared ownership felt it would be unfair if they had to pay costs that they had not agreed to or that would not be borne by social renters.
Opinion was split on whether a payment system based on level of emissions (i.e. with those living in higher emitting homes paying more) was fair. On the one hand, there was a view that property owners who had neglected to make the necessary changes should, after time, be obliged to pay more. On the other hand, there was a view that those in less energy efficient properties may also be those with the lowest incomes, they should not be penalised for not being able to afford the changes needed. Indeed, it was suggested that these properties should be prioritised for support.
“Some houses are not able to have all the new fancy equipment and insulation fitted to them… people living in such buildings should be offered more help and not penalised. However, that being said if such houses have refused to update their homes and continue to use excessive carbon emissions without trying to cut down then, yes, they should pay more.” (Participant, phase 1, online community)
Participants also recognised that building standards have changed over time so it would not be fair to penalise owners who have “inherit[ed] decisions made by previous owners…that were taken in good faith”. More broadly, participants emphasised the need to consider links between sectors when it comes to an overall system of payment.
“I suggest a nuanced, means-tested approach, which is tailored to each person’s circumstances. I also suggest that this approach takes into account the overall carbon emissions caused by an individual’s lifestyle…Treating these as separate issues seems to be missing the point.” (Participant, phase 1, online community)
How can we make sure that everyone benefits?
To ensure everyone benefits from the transition, the general feeling was that appropriate financial assistance should be provided to those on lower incomes and those with particular support needs (on account of their age, health, or disability). Participants therefore suggested financial support for homeowners to retrofit their properties, ideally in the form of a government grant reflective of ability to pay.
Other specific suggestions included assistance in the form of a scheme similar to ‘Help to Buy’ but for energy efficient new builds, and a loan encompassed with mortgage to help owners replace heating systems.
“The people who will find it most difficult are the people that have been in their family home for 40 years and it’s their responsibility to fit it. The support seems patchy for people trying to make these changes…so ultimately homeowners need the most help.” (Participant, phase 1, workshop 3)
Protecting private renters was also seen as important. It was felt that private renters may be at risk of being left behind if the focus of support was on homeowners. Their concern that some landlords may not be able to afford to make the changes required to their rental property (e.g. if also making changes to the home they live in), therefore leaving renters in energy inefficient properties. To make sure that renters benefit from the changes, there was a suggestion of both regulation for landlords (outlined above) and financial support if necessary.
The importance of awareness raising was also highlighted as a way of ensuring everyone benefits. Specifically, it was seen as important to ensure that everyone understood the EPC rating system, what changes they would need to make to achieve the new requirements, and what support would be available.
Finally, it was noted that rural areas may need different solutions and retrofitting may be harder in rural properties. Several factors were highlighted including age of property, local climate, availability of tradespeople, and additional costs or logistics associated with each of these factors. The importance of adapting to the needs of rural areas was therefore highlighted as a way of ensuring people living in rural areas are not left behind and that people are not discouraged from moving to a rural community.
Exploring policies related to heating systems in phase two
In phase two, participants discussed the transition to clean heating systems in domestic properties (i.e. homes that people live in, whether owned, private-rented, or social-rented) and considered two possible approaches for funding and implementing this:
- Widely available public funding, with stricter penalties for non-compliance.
- Targeted public funding, with softer penalties for non-compliance.
Participants explored each approach through scenario-based discussions and considered the implications for different people living in Scotland (using the same characters from phase one of the research).
Initial views on the idea of a clean heat transition
Before the two approaches were presented, participants shared their initial thoughts on the idea of transitioning domestic properties to clean heating systems and making energy efficiency improvements in principle.
The Scottish Government support currently available for people switching to clean heating systems (in the form of grants and interest free loans) was viewed positively and the timescales for this (i.e. prohibiting polluting heating systems by 2045) were considered reasonable. However, several practical questions were raised around: how homeowners and landlords would go about installing clean hearing systems ; how suitable they would be for some types of properties (one participant had used support from Home Energy Scotland and was advised that a heat pump was not viable); how listed buildings would be protected; and what the ongoing costs of clean heating systems would be.
The energy efficiency improvements were also viewed positively in terms of the impact they would have on properties’ ability to retain heat. These changes were also considered to be easier, cheaper and more manageable to make than the heat system changes. However, participants questioned the availability of tradespeople, with one participant having been unable to find someone to install loft insulation despite receiving support for that.
Some broader themes also emerged that remained prominent through later discussions:
- Concerns around the upfront costs and the impact on certain groups (e.g. students, elderly people, those with disabilities or health conditions, people with older properties, landlords[24] having to absorb the costs, and tenants who might be subject to rent increases).
- A view that grants should be limited to those on low incomes or those in older properties who have to make the biggest changes.
- A perception that rent freezes or caps would be necessary to prevent renters experiencing the shock of sudden rent increases.
- An appetite for more evidence from trials and system comparisons to reassure people that the solutions proposed are the right ones and are for the long term.
Views on widely available public funding
Participants considered a scenario in which Scottish Government grants and loans would be available to all households to improve energy efficiency and install a clean heating system. In this scenario, there would be penalties for non-compliance by the deadlines set out (see figure 10.3 below).
Figure 10.3: Widely available public funding with stricter penalties

It was felt that widely available funding would prompt more people to be proactive and make changes to their homes earlier rather than waiting until the last minute. This, coupled with stricter penalties, was considered an effective way of encouraging people to switch.
The fact that exemptions would be in place for some homeowners based on certain circumstances was “heartening” for participants. It was felt that people with disabilities, health conditions, pensioners and people living in older properties (who would find the changes most difficult) should be exempt. Participants were also supportive of an appeals process being in place to enable people to challenge penalties.
Who would be impacted more?
Participants identified Lorraine (a rural farmer with an older property) as someone who should be exempt. In her case, being exempt was felt to be important to protect her from further financial precarity, as an older person living in an older property who was already paying off debts.
Participants were also reassured by the fact that tenants would be protected from rent increases, although there were some concerns raised about landlords ignoring the regulations or exploiting loopholes (e.g. by increasing rents before making the required changes).
Deadlines and penalties
The 2028 deadline for private landlords making home energy improvements was felt to be too close, and that introducing penalties without a longer notice period would be unfair. While some welcomed the fact that landlords would not be able to pass along additional costs to tenants, others raised concerns about the potential consequences of this. One participant highlighted the risk of landlords (including her own current landlord) deciding to sell in response to the 2028 deadline, penalties and restrictions, which would mean fewer homes available to rent.
“Very many landlords will simply sell their properties rather than fork out such a large sum of money, this will, of course remove even more homes from housing stock when there is already a housing crisis.” (Participant, phase 2, workshop 3)
The 2033 target for homeowners to make energy efficiency improvements was also considered too soon. For this funding approach to be made fairer, participants suggested that homeowners and small business landlords should be given more time to make the necessary changes before penalties are introduced. Exemptions from penalties were also considered to be fair if homeowners and landlords could demonstrate that they had made some effort towards meeting the targets or that they cannot afford to make them.
“If you make an effort and don’t achieve the target, it seems unfair to give you a penalty. The people who do make an effort and achieve it, fair enough. It depends if the target is achievable or not. Be fair about it all and make the target reasonable and achievable.” (Participant, phase 2, workshop 3)
The 2045 deadline for clean heating systems to be installed, however, was considered too far away. There were concerns that this timescale would not provide enough motivation for people to act quickly.
“How are you going to get people interested at all when the penalties don’t kick in for another 20 years?…It feels too distant.” (Participant, phase 2, workshop 3)
While the appeals process was welcomed, there were concerns that it could be a difficult and stressful process which would be off-putting for some.
Availability of funding
The availability of funding to all households drew mixed views. Some participants felt this was unfair, as wealthier households could afford to make the changes without funding support, while those struggling financially would be reliant on support.
Other participants felt that the Scottish Government should provide financial support to everyone if the changes were being made compulsory. Broader availability of funding was also considered fairer than the alternative, as there was a perceived risk that targeted funding could lead to some households not being eligible for funding but still being put under financial pressure.
“If the government were to enforce this, I think it wouldn’t be very fair to give grants to some and some to not…If they want people to do it, they’ll need an incentive.” (Participant, phase 2, workshop 3)
There was some discomfort around the idea of people taking out loans to cover the remaining costs, particularly for those seeking to avoid loans or already struggling with debt.
“I went through my life trying to avoid debt. Taking on debt in your 80s, you’ve had a lifetime not owing anybody then because someone has decided your gas boiler is out of fashion you have to find £15,000.” (Participant, phase 2, workshop 3)
If loans were to be offered, participants agreed that long repayment plans should be available to ease any financial burdens, particularly for those paying off existing debts. Among participants who preferred targeted funding, it was felt that lower income households should be given higher grants so that they would not have to take out a loan.
“If giving you a loan, it’s on top of the debts I already have. If [repayments] don’t eat into my pay, maybe it’s manageable, but trying to squeeze the little I earn to then pay for the renovations I don’t need, it’s a bit too much.” (Participant, phase 2, workshop 3)
Trust and transparency
Discussions on the heat transition highlighted issues of trust in systems such as heat pumps and heat networks. Participants sought more reassurances around the efficacy of these systems and felt that there would need to be a campaigns on a continual basis to raise awareness among the public (using a range of methods such as letter, billboards, and social media). One participant suggested reaching people through alerts on their phones, highlighting the sense of urgency and scale required to make sure the public are aware so that they can start to prepare.
While the focus of these discussions was on homeowners and landlords making the heat transition in their properties, it was also felt that housing developers should be responsible for installing heat pumps in new builds, or connecting them to heat networks. This was linked to a broader sense that these policies were placing an unfair burden on consumers without systemic action or leadership being demonstrated by industry or government.
“They’re still putting gas boilers in. Why don’t they put heat pumps in new builds so people know how they work. It feels like it’s just the stick at the moment, there’s no carrot.” (Participant, phase 2, workshop 3)
Views on targeted public funding
Participants considered another scenario in which Scottish Government grants and loans would be available to households on lower incomes to improve energy efficiency and install a clean heating system (but not to higher income households, landlords or owners of second properties). In this scenario, there would be penalties for non-compliance on energy efficiency improvements, but penalties for not installing a clean heating system by 2045 would not be enforced straight away (see figure 10.4 below).
10.4: Targeted public funding with softer penalties

Those who preferred a more targeted funding approach saw this as fairer than the option of broadly available funding, as they felt it would support those who needed it most. As well as people with low incomes, people with disabilities were also identified as a group who should be eligible for grants.
While there were concerns raised initially that private landlords being able to increase rent would negatively impact tenants, it was also recognised that tenants could benefit from their homes being made more energy efficient, which in turn could lead to better living conditions and cheaper energy bills. It was agreed that a rent cap would be important to protect tenants from sharp rent increases.
Deadlines and penalties
As highlighted in discussions around the timescales for implementing changes in option one, it was felt that some deadlines (e.g. 2028 for landlords to meet a minimum energy standard)) were too soon and would not provide enough notice, while others (e.g. 2045 for switching to a clean heating system) were too far away and would not instil enough of a sense of urgency in the changes required.
In discussing the introduction of penalties for non-compliance, participants raised concerns that this would lead to people rushing to install the technologies before the deadline and mistakes being made. This prompted questions around how the clean heating systems would be installed and regulated.
“I think penalties scare people off more and maybe they’ll do things quickly and they’ll be done wrongly. Who’s checking these things? Are there people checking it’s done correctly? It could be a cowboy builder doing things that are wrongly done and then you get penalties for something that you thought was right.” (Participant, phase 2, workshop 3)
There was also a lack of clarity around the timings of the penalties, with some being enforced as soon as the deadline expires and others not being enforced right away. This was felt to be problematic and an ineffective way of encouraging people to act.
“If you say you’ve got to do something by 2045 but there are no consequences for not doing it by 2045, [it] doesn’t make sense. I could say anyone has to do something but if there are no consequences, do they really have to do it?” (Participant, phase 2, workshop 3)
Participants suggested that the penalties should be made clearer, but agreed that there should be some flexibility in how and when they are applied by taking the household’s circumstances into account first.
Targeted funding
Although some participants supported a more targeted funding approach, there was also a strong view that targeted funding could create financial hardship and worsen the cost of living crisis. It was also felt that targeted funding could limit the effectiveness of the policy, with those not eligible for funding being less inclined to act.
As in the previous scenario, some were not comfortable with people being pushed into any form of debt, even with some of the costs covered by grants.
“They’re saying 0% interest loans, but you’re putting a heap of people into debt, vulnerable people, young people. I think this would be quite horrible.” (Participant, phase 2, workshop 3)
There were strong views against private financing, which were underpinned by a perception that private sector organisations – and energy companies in particular – were motivated solely by profit. If loans were to be made available, it was preferable that these be Scottish Government-administered and not privately financed.
“I don’t think private sector should offer loans in the first place. The government wants you to do this so they should offer the loan themselves or provide the grant.” (Participant, phase 2, workshop 3)
While some were not comfortable with private financing in the form of loans, there was some openness to other forms of private financing, such as discounts on energy bills in return for making energy efficiency improvements. Alternative sources of funding for the heat transition were also suggested, such as a tax on the profits of energy providers.
Trust and transparency
As in the previous scenario, participants felt that there would need to be clear and comprehensive communications with the public to raise awareness of the changes that homeowners and landlords would be required to make. Building on this, participants expressed a clear appetite for these communications to provide reassurances around the reliability of the clean heating systems and the ongoing running costs as well as installation costs.
“If I knew that my energy bills were going to drop sufficiently then it wouldn’t bother me at all having to try and fund it from a low interest loan. But I would feel extremely nervous on going that it might. It’s a big jump to take just based on faith.” (Participant, phase 2, workshop 3)
Related to this was an unease around the longevity of the policy, the risk of requirements changing in future, and the cost of this to consumers in future.
“Scottish Government years ago encouraged people to buy diesel cars, and now diesel is dreadful, encouraged to install wood burning stoves and central heating, again now it’s wrong. How many times are the public expected to listen to the government and spend money converting to whatever it is only to be told within a short time that it’s wrong.” (Participant, phase 2, workshop 3)
Appendix 3 – Land use and agriculture sector detailed findings
This chapter discusses participants views on a just transition for land use and agriculture. As with the previous sector-focussed chapters, it describes initial views on changes needed, learning during the workshop, and conclusions in relation to the three questions. Policy options for the land and agriculture sector were not explored as part of phase two of the research, so the findings presented here are in relation to phase one only.
In agreement with ClimateXChange and the Scottish Government, the workshop dedicated to this sector focussed on what the transition to net zero means for food production and consumption. Recognising the scale and complexity of the land and agriculture sector, this topic was chosen as an area in which participants would be able to relate to their everyday lives.
Summary
Participants supported the move towards more climate friendly approach to food, but were concerned the overall fairness of the vision and impact on rural communities.
Participants felt costs should be shared between:
- The Scottish Government
- Farmers
- Other businesses (e.g. supermarkets)
- Consumers
- Landowners
To ensure a fair transition, in which everyone benefits, it was suggested that:
- People’s ability to pay is taken into account, with protection in place for low-income consumers.
- Farms are subsidised, favouring smaller farms with less income. Support payments should be specifically allocated towards covering the costs of reducing carbon emissions.
- Farms should be given sufficient time and opportunity to change and reduce emissions before introducing any financial impacts such as additional tax.
- Ensure that consumers have easier access to sustainable food options.
What changes were expected?
Before the workshop, participants used the online community to discuss the changes they thought would be needed for the land use and agriculture sector to reach net zero.
They anticipated changes to the way we buy and eat food. There was a widespread sense that people should eat more local, seasonal and sustainable produce, with fewer products imported from abroad. Many participants interpreted this as a climate friendly diet. It was also suggested that we may need to reduce meat consumption, especially imported meat. While it was noted that these changes would likely reduce the range of foods available, participants were generally very positive about the environmental and health benefits they could bring. However, some participants felt that it would be difficult for consumers and the wider food industry to adapt to these kinds of changes, and that this could have economic consequences.
“The range of food we have readily available may be reduced. I don’t have a problem with that and feel it is something we should make the best of in terms of reducing food miles and eating found produced as near to home as possible.” (Participant, phase 1, online community)
Changes to farming practices were also anticipated, with a strong focus on farming practices being more “ecologically friendly”. Participants suggested that there may be move towards more organic farming, vertical farming (i.e. growing crops in vertical layers) to make space for rewilding, and regenerative practices (e.g. techniques that preserve and enhance soil quality). It was also suggested that our approach to land management more broadly may need to change, with greater emphasis on tree planting, biodiversity and creation of more carbon sinks.
Participants were generally positive about the types of changes to food production described above, though some felt that food price rises for consumers were inevitable. Others emphasised that farming should be supported to become profitable without passing on costs to consumers. There was therefore support for subsidies for farmers, as food production was considered a “vital” industry, but not for “wealthy landowners”.
Overview of presentations and reactions to them
At the workshop, participants heard two presentations delivered by experts. The first outlined the Scottish Government’s vision for the future of the sector, the types of changes that would be needed to achieve it, and the benefits and challenges associated with reducing emissions in the sector. The second outlined the inequalities within the sector that would need to be addressed as part of the transition to net zero.
Participants were struck by the complexity of the topic and emphasised a need for more public education around food production and consumption. Several participants were unaware that the sector received financial support from the Scottish Government, and were surprised at the extent to which businesses relied on this subsidy (e.g. the presentations had explained that without support payments, many farms would be in deficit). This led to a feeling that many farms were financially vulnerable and in need of ongoing support, which set the context for the later discussions around who should pay.
“Farming is already so heavily subsidised. One can’t imagine it continuing in any shape or form without large subsidies in the future, unless we were to lose the farming industry…I can’t imagine the rug being whipped from the farming industry.” (Participant, phase 1, workshop 4)
There was some surprise at how much food was imported, particularly fruit (the presentation explained that 16% of our fruit was produced domestically). There was also discussion on the average age of farmers, and about the need to encourage young people into the sector.
Some participants stressed the importance of considering wider aspects of land use which they felt impacted efforts to reach net zero. This echoed their initial thoughts on changes needed and included aspects like deer management, shooting estates and carbon credits. These are explored in more detail below.
Vision for the land use and agriculture sector
Participants had a chance to view a future vision for the land use and agriculture sector on the online community and again in the workshop. The vision (shown in figure 11.1) was based on the Scottish Government’s discussion paper for the sector. As well as sharing their own views on the vision, participants revisited the five fictional characters and discussed how it might impact on them.
Figure 11.1: Vision for the land use and agriculture sector

The role of land use and agriculture (particularly food) for our characters
Alice picks things up on her way to and from work. She doesn’t have a lot of time to cook and gets a takeaway or delivery a few times a week. Alice feels that she spends too much on food. She would like to eat more fresh fruit and vegetables and better-quality meat, but these are not easily available in the shops close to her flat.
David and Sarah have a large garden. They buy locally produced food as much as they can, even if it is more expensive. They get their weekly food shop from several places. They have reserved a space at a local community allotment.
Lorraine’s farm specialises in cattle and turkeys. She is planning on making changes to the business to help reduce its emissions. These changes would increase the cost of producing food and the business would not be able to absorb these costs.
Maria gets all her food shopping delivered from the supermarket and has a strict weekly food budget. She choses whichever products are cheaper. She tries to ensure that her daughter eats a healthy diet, but this can be difficult within her budget.
Nadeem and Ajay have a vegan diet. They get their weekly groceries from the supermarket. Buying food that suits their diet is more important to them than where it comes from. Ajay works at a small food shop. If farmers increase their prices, the shop will increase the price it charges consumers.
From the outset, the potentially negative impacts of the vision on rural communities were noted, particularly in relation to the suggestion that less land would be dedicated to food production. There was a sense that crofting land would not be suitable for other uses and so crofters may lose out if they are not able to continue current practices.
“Crofting is environmentally friendly. There’s no fertiliser use, it’s a very natural way of farming and yet that’s the one that’s going to be penalised against much more intensive farming in arable areas. That’s the wrong note to hit, the wrong balance.” (Participant, phase 1, workshop 4)
There was also some resistance to using more land for tree planting. One reason for this was the perception that would reduce the potential for farmers to earn money, as they would be giving up land used for grazing or meat production in favour of forestry. Another reason was in relation to the impacts on communities, with some participants describing how plantations had led to a sense of isolation for their community and a feeling that they were “cut off” as result of being surrounded by trees.
Reflecting their initial thoughts on the changes needed in the sector, there was support for importing less and eating more local and seasonal produce, and for continued support for food producers. However, there was discussion of the difficulty of changing consumer habits, especially in the context of the cost-of-living crisis, and the challenges that some might face in accessing climate friendly food.
Who could benefit?
Under this vision, participants felt that farmers who were able to diversify could benefit if the changes resulted in a more financially sustainable business, provided there was support and advice available to help them do so.
Participants felt that consumers could see health benefits from access to more quality, nutritious produce, and if there was more education on how to cook meals from scratch. It was also felt that communities could in turn see economic benefits from more people shopping locally.
Participants felt that wealthier consumers would find the transition easiest as they could absorb an increase in food prices. Similarly, participants felt that wealthier farmers would be able to afford to make changes to their business. There was also a sense that the scale of change required for businesses in the wider supply chain (e.g. larger supermarkets, retailers and distributers) would be smaller than for food producers directly.
Overall participants recognised that consumers who were already eating a sustainable diet or businesses whose practices were already in line with the vision would find the transition easier as they would need to make fewer changes.
Who benefits?
It was felt that David and Sarah would benefit because their lifestyle choices were already in line with the vision, and they could afford to make further changes or absorb increased costs.
Who could lose out?
Participants highlighted farmers and crofters who specialise in livestock may lose out, as their ability to do so may be restricted if more land is dedicated to forestry. There was a suggestion that the vision would “decimate” these communities in the north of Scotland. It was also felt that, if farmers were growing less food, there may be knock-on impacts on others working in the food sector and potentially job losses.
Participants felt that food price rises were inevitable and therefore that people on low incomes would lose out.
“All the changes will come with a cost. We already have a lot of food banks and people struggling. Those people will be impacted even more than they are now. It’s difficult to tell what would make it fairer. How can we help the poor more than we are helping now with food banks.” (Participant, phase 1, workshop 4)
There was a view that consumers may lose out if they were not able to grow their own food (some participants, especially in urban areas, felt this would be difficult for them to do), or were not able to access sustainable produce.
“Consumers are going to miss out if there are no local food co-ops, food sharing, food communities. Some people are surrounded by takeaways and corner shops. They don’t necessarily have access to local foods because of where they live.” (Participant, phase 1, workshop 4)
Who could lose out?
Lorraine’s livelihood was identified as being at risk given the challenges of diversification and the need to increase prices to cover the cost of making changes. Her age was also noted as a factor in that she may not have time to benefit before she retires.
Alice and Maria were identified as at risk of losing out if prices increase because of their concern about the current cost of groceries. They may also struggle to access local produce; Maria because of her child care requirements, and Alice because of her shift patterns.
Nadeem and Ajay may lose out if a focus on local products means they have less choice in their diet. This could be exacerbated by additional challenges transporting goods to where they live. Ajay’s job might be at risk if the viability of the shop where it works is affected by increased prices.
As we transition to net zero, who should pay for the changes needed in the land use and agriculture sector?
The types of costs that were outlined in the presentations and that participants explored in their discussions included: the costs associated with change the way land is used and food is produced, the costs associated with the wider food supply chain and distribution network, and the costs of food for consumers.
Generally, it was felt that costs should be paid for by a balance between government, industry and consumers. Specific groups that they felt should be responsible for some of the costs of the transition included:
- The Scottish Government. Farming subsidies were described as a “practical necessity” in order to sustain the industry and keep prices affordable. It was therefore felt that some level of subsidies should continue, and that these could help to fund some of the costs associated with the transition. However, it was also suggested that not all farms should be supported to the same extent and that subsidies should vary to reflect the size and financial performance of the farm (outlined further in the next section).
- Farmers. It was felt that farmers should cover some of the costs associated with changes to land use or food production, especially if they would benefit directly from the changes (e.g. if the changes to practices helped with their operational efficiency, helped them to generate income, or added value to their business). However, participants stressed that farmers would unlikely be able to incur significant additional costs without becoming financially unviable. It was therefore felt that, as noted above, ongoing financial support for farmers would be required.
“It will have to be [supported by] the government…I don’t see it being viable without subsidies. Loads of farms will just go out of [business].” (Participant, phase 1, workshop 4)
- Consumers. There was a sense that an increase in food prices for consumers will be “inevitable” and that those who can afford to pay should share some of the costs. With this came a sense that consumer behaviour would also need to change, with more of a focus on eating a climate friendly diet. Some participants supported prices rises to encourage consumer behaviour change. However, there was a sense that consumers have less responsibility for paying for changes than other businesses as they do not have a direct say in the costs.
“We eat like kings, all of us, and we need to come back to [eating] more sustainable things.” (Participant, phase 1, workshop 4)
- Other businesses. While not a common theme, it was suggested that businesses in the wider food supply chain should also share some of the costs. In particular it was felt that large, profit-making businesses such as supermarket chains would be able to afford some of the costs (e.g. for reducing or replacing packaging), rather than farmers and consumers.
“It’s those businesses in the middle that should pay because the consumer and the farmer don’t have the money… commercial businesses who are making big profits, they should make more of a contribution to this process to make this fairer.” (Participants, phase 1, workshop 4)
- Landowners. From the outset, some participants raised issues with the current structure of land ownership in Scotland, with a perception that absentee landowners earn from large shares of land that might otherwise have been used for food production. It was suggested that these landowners should be taxed to help pay for some of the changes need to land use. As previously noted, there were also calls for wider land reform which, for some participants, was seen as inextricably linked to viability of the farming industry.
“One of the biggest factors affecting the viability of Scottish farming is land ownership…the fact that huge swathes of good land are owned by…absentee landlords leaving very little for homegrown farmers.” (Participant, phase 1, online community)
How can we make sure that system of payment fair?
While acknowledging the scale of the challenge, participants showed at least some support for systems of payment based on:
- Ability to pay. Consumers on lower incomes were seen as likely to find any increase in food costs most disruptive and difficult. Echoing findings from the transport and built environment workshops, participants therefore felt that a future system of payment should take into account people’s ability to pay and protect low-income consumers. At the same time there was recognition that placing a greater burden of the costs on wealthier households could discourage them from making good choices which may be counterproductive.
- Subsidising some, but not all, farmers. As noted above, continuation of farming subsidies was considered a fair way of helping the sector to adapt to change. It was suggested that the subsidy system should favour smaller farms with less income (and therefore less ability to pay). It was also suggested that support payments should be specifically allocated towards covering the costs of reducing carbon emissions and making farming practices more sustainable. Recognising that some farms or crofts may already be operating sustainably, there was also a suggestion that a payment system should “penalise neglect”.
“[Financial] support can help the transition but should only be given where additional costs are incurred and not where changes may actually help profitability. This is one area where justice in transition could easily be lost as large farmers, forestry companies and green investors soak up ever larger sums of public money.” (Participant, phase 1, online community)
- Taxing larger businesses. Some participants felt that payments should be covered by larger, profit-making businesses, particularly whose practices are not climate-friendly (e.g. those who import food from overseas). They suggested taxing these businesses, or having a payment system that means these businesses absorb costs rather than passing them on to consumers. At the same time there was recognition that penalising businesses too harshly could force them to leave Scotland which would risk jobs and move carbon emissions elsewhere.
“What about taxing the big business that’s importing things from faraway countries that they could get here? People like Maria [one of the fictional characters used as stimulus for the discussion] don’t really care much about where food is from and how it’s sourced, it’s just about feeding their family.” (Participant, phase 1, workshop 4)
- Taxing high-carbon products. There was some support for a “food miles tax” or other form of high carbon products tax, but only if other more sustainable food options were available and affordable. It was also suggested that a tax on food waste (for supermarkets, not consumers) would help to reduce the amount of food currently wasted. However, some participants felt that it was not fair to base a payment system on emissions as some farms emit more than others depending on their produce.
To make the transition as fair as possible, it was also stressed that farms need to be given sufficient time and opportunity to change, diversify and reduce emissions before introducing any financial impacts such as additional tax.
How can we make sure that everyone benefits?
As well as a reduction in carbon emissions, participants identified a range of potential benefits from the future vision for the sector including: health benefits of eating more locally grown, quality food; physical and mental health benefits for individuals and communities growing their own food; economic benefits of supporting local businesses (though business viability was also seen as a risk); a reduction in food waste; more job opportunities within the land use and agriculture sector; and financial benefits for farmers from diversification.
An overarching message was that financial support was required to ensure that farmers and consumers could benefit from the changes. To make sure everyone benefits, participants also felt that we should:
- Provide people with the opportunity to eat the right kinds of food. It was felt that steps should be taken to ensure that low carbons foods remain affordable for people on low incomes. It was also suggested that more access to individual and community growing spaces and food sharing initiatives may help more people to benefit from these types of food, particularly for those who do not already have access to a garden.
“Consumers are going to miss out if there are no local food co-ops, food sharing, food communities. Some people are surrounded by takeaways and corner shops. They don’t necessarily have access to local foods because of where they live.” (Participant, phase 1, workshop 4)
- Improve communication and engagement with the public. Participants felt that there was need for more awareness-raising about how the food system works, the types of changes that will be necessary, and what types of food are more climate-friendly, and how to make healthy affordable meals. It was stressed that the public need to understand why change is necessary before they can accept those changes. Participants also advocated more community and local government involvement in decision-making about land use.
- Change the system of land ownership to provide more equitable access to land. A few participants felt strongly that widescale change to land ownership was required, so that smaller farms have more opportunity to be profitable and that there were more opportunities for young people to work in the sector.
Appendices A-D: Research materials
Appendix A – Structure of workshops
Phase 1
- The first workshop introduced participants to the process and key concepts. This was followed by three separate workshops on transport, built environment and construction, and land use and agriculture. In these workshops participants learned about key issues associated with the transition in each sector and shared their views, before answering these overarching questions in relation to that sector.
|
Date/time |
Objective |
Session description |
Presentations | |
|
Session 1 – Introduction |
10 August 2023, 6pm to 9pm |
Introduction to the process and aims. Participants learn key concepts. |
Introduction to the process. Participant introductions. Presentations from expert speakers (see right). Small breakout discussions followed by Q&A with speakers. Initial thoughts on a fair transition. |
Introduction to key concepts relating to climate change, just transition, net zero and Scottish Government plans. |
|
Session 2 – Transport Session 3 – Buildings and Construction Session 4 – Land use and agriculture |
15 August 2023, 6pm to 9pm 29 August 2023, 6pm to 9pm 14 September 2023, 6pm to 9pm |
Participants develop an understanding of each sector and form initial thoughts on a fair distribution of costs and benefits for that sector. |
Presentations from expert speakers (see right). Breakout discussion followed by Q&A with speakers. Breakout discussion of future vision in relation to fictional characters. Breakout answers to the overarching questions in relation to the sector. |
Future vision for the sector. Addressing inequalities in the sector |
|
Session 5 |
30 September 2023, 10am to 1pm |
Participants consolidate their views on a fair distribution of costs and benefits and form wider conclusions on cross-cutting elements |
Breakout discussion of future scenarios in relation to fictional characters. Breakout forming conclusions on a fair transition. |
No presentations |
|
Session 6 – Conclusions |
5 October, 2023, 6pm to 9pm |
Participants review, ratify and finalise their conclusions. |
Breakout discussion on answers to the overarching questions. Reflections on the process. Postcard to the future task. |
No presentations |
Phase 2
The first workshop introduced participants to the process and key concepts. This was followed by two workshops, each focussing on a policy area within the transport and built environment sectors. The transport sector session focused on two possible approaches to Road User Charging; UK national road pricing or urban local charging. The built environment sector session focused on two approaches to funding the heat transition in domestic properties; widely available funding (with stricter penalties) or targeted funding (with softer penalties).
|
Date/time |
Objective |
Session description |
Presentations | |
|
Session 1 – Introduction |
6 March 2024, 6.30pm to 8.30pm |
Introduction to the process and aims. Participants learn key concepts. |
Introduction to the process. Participant introductions. Presentations from expert speakers (see right). Small breakout discussions followed by Q&A with speakers. Initial thoughts on a fair transition. |
Introduction to key concepts relating to climate change and the move to net zero; concept of just transition and Just Transition Plans; previous public engagement on just transition. |
|
Session 2 – Transport |
14 March 2024, 6.30pm to 9pm |
Participants learn about Road User Charging (RUC) and discuss how to ensure this is implemented fairly. |
Presentation (see right). Breakout discussion considering two approaches to RUC in relation to fictional characters. Breakout answers to form conclusions on RUC. |
Introduction to RUC. |
|
Session 3 – built environment and construction |
20 March, 6pm – 9pm |
Participants learn about clean heat transition in domestic properties and discuss how to ensure this is funded fairly. |
Presentation (see right). Breakout discussion considering two approaches to funding the clean heat transition in relation to fictional characters. Breakout answers to form conclusions on clean heat transition. |
Introduction to clean heat transition and Heat in Buildings bill. |
Appendix B – Recruitment quotas
Phase 1
The quota targets were based on data from the Scottish Household Survey 2019, unless otherwise stated. Groups that were over-sampled are indicated with asterisk (*).
|
Variable |
% in population |
Target number |
Achieved number | |
|
Age |
16-24 |
11% |
4 |
4 |
|
25-34 |
18% |
6 |
4 | |
|
35-54 |
32% |
11 |
11 | |
|
55+ |
38% |
12 |
11 | |
|
Gender |
Woman |
52% |
17 |
17 |
|
Man |
48% |
16 |
13 | |
|
Non-binary/other |
No clear data |
No target |
0 | |
|
Region of Scotland (source: NRS mid-year population estimates) |
Central |
12% |
4 |
2 |
|
Glasgow |
13% |
4 |
4 | |
|
Highlands and Islands* |
8% |
5 |
5 | |
|
Lothians |
15% |
5 |
5 | |
|
Mid Scotland and Fife |
12% |
4 |
3 | |
|
North East Scotland |
14% |
4 |
4 | |
|
South |
13% |
4 |
3 | |
|
West |
13% |
4 |
4 | |
|
Ethnicity |
African, Caribbean, Black or Black Scottish/British* |
1% |
2 |
0[25] |
|
Asian, Asian Scottish or Asian British* |
3% |
3 |
3 | |
|
White Scottish/Other British/White Other |
96% |
27 |
25 | |
|
Other ethnic group or mixed/multiple ethnic groups* |
0% |
1 |
2 | |
|
Disability |
No long-term physical or mental health condition |
70% |
19 |
16 |
|
Long-term physical or mental health condition which is limiting* |
24% |
10 |
10 | |
|
Long-term physical or mental health condition which is not limiting* |
6% |
4 |
4 | |
|
Household income, per year |
Less than £10,000* |
9% |
4 |
3 |
|
£10,001 – £20,000* |
30% |
11 |
9 | |
|
£20,001 – £30,000 |
21% |
7 |
6 | |
|
£30,001 – £40,000 |
15% |
5 |
4 | |
|
More than £40,001 |
24% |
6 |
8 | |
|
Attitudinal measure (SHS 2019): Which of these statements, if any, comes closest to your own view? |
Climate change is an immediate and urgent problem |
68% |
Aim for mix |
17 |
|
Climate change is more of a problem for the future |
14% |
7 | ||
|
Climate change is not really a problem |
3% |
1 | ||
|
None of these / don’t know |
9% |
5 | ||
|
I’m still not convinced that climate change is happening |
6% |
Excluded[26] |
0 |
Phase two
The quota targets were based on data from the Scottish Household Survey 2019, unless otherwise stated. Groups that were over-sampled are indicated with asterisk (*).
|
Variable |
% in population |
Target number |
Achieved number | |
|
Age |
16-24 |
11% |
2 |
2 |
|
25-34 |
18% |
4 |
4 | |
|
35-54 |
32% |
6 |
7 | |
|
55+ |
38% |
8 |
7 | |
|
Gender |
Woman |
52% |
10 |
10 |
|
Man |
48% |
10 |
10 | |
|
Non-binary/other |
No clear data |
No target |
0 | |
|
Region of Scotland (source: NRS mid-year population estimates) |
Central |
12% |
2 |
2 |
|
Glasgow |
13% |
3 |
3 | |
|
Highlands and Islands |
8% |
2 |
2 | |
|
Lothians |
15% |
3 |
3 | |
|
Mid Scotland and Fife |
12% |
2 |
2 | |
|
North East Scotland |
14% |
3 |
3 | |
|
South |
13% |
3 |
3 | |
|
West |
13% |
2 |
2 | |
|
Urban/rural |
Urban |
83% |
15 |
15 |
|
Rural* |
17% |
5 |
5 | |
|
Ethnicity |
African, Caribbean, Black or Black Scottish/British* |
1% |
2 |
3[27] |
|
Asian, Asian Scottish or Asian British* |
3% |
2 |
2 | |
|
White Scottish/Other British/White Other |
96% |
15 |
14 | |
|
Other ethnic group or mixed/multiple ethnic groups* |
0% |
1 |
1 | |
|
Disability |
No long-term physical or mental health condition |
70% |
12 |
12 |
|
Long-term physical or mental health condition which is limiting* |
24% |
6 |
6 | |
|
Long-term physical or mental health condition which is not limiting* |
6% |
2 |
2 | |
|
Household income, per year |
Less than £10,000* |
9% |
2-3 |
2 |
|
£10,001 – £20,000* |
30% |
6-7 |
7 | |
|
£20,001 – £30,000 |
21% |
4 |
4 | |
|
£30,001 – £40,000 |
15% |
3 |
2 | |
|
More than £40,001 |
24% |
4 |
4 | |
|
Attitudinal measure (SHS 2019): Which of these statements, if any, comes closest to your own view? |
Climate change is an immediate and urgent problem |
68% |
Aim for mix |
17 |
|
Climate change is more of a problem for the future |
14% |
3 | ||
|
Climate change is not really a problem |
3% |
0 | ||
|
None of these / don’t know |
9% |
0 | ||
|
I’m still not convinced that climate change is happening |
6% |
Excluded[28] |
Appendix C – Discussion guides
Phase one, session one
Thursday 10 August 2023, 6pm-8pm
Overarching objective: introduce participants to key concepts and familiarise them with the online discussion format and their role throughout the dialogue. Opportunity for Q&A to develop understanding before moving into focused discussion on each sector in subsequent sessions.

Phase one, session two
Tuesday 15 August 2023, 6pm-9pm. Group of 30 participants, with 5 pre-assigned breakout groups (of 6 participants each).
Overarching objective: Participants develop an understanding of the vision for a transition to net zero in the transport sector and an understanding of the costs, benefits and challenges associated with that transition. Participants provide views on the fair distribution of costs and benefits.

Phase one, session three
29 August 2023, 6pm-9pm. Group of 30 participants, with 5 pre-assigned breakout groups (of 6 participants each).
Overarching objective: Participants develop an understanding of the vision for a transition to net zero in the built environment and construction sectors and an understanding of the costs, benefits and challenges associated with that transition. Participants provide views on the fair distribution of costs and benefits.

Phase one, session four
14 September 2023, 6pm-9pm. Group of 30 participants, with 5 pre-assigned breakout groups (of 6 participants each).
Overarching objective: Participants develop an understanding of the vision for a transition to net zero in the land and agriculture sector (with a particular focus on food production) and an understanding of the costs, benefits and challenges associated with that transition. Participants provide views on the fair distribution of costs and benefits.
|
Discussion structure |
Time allocated |
Objective |
Questions and materials |
|---|---|---|---|
|
Set-up: Facilitators check-in 25 mins |
17.30-17.50 |
Set up and test tech, and team preparation |
Facilitator and tech team only
|
|
Participant check-in 10 mins |
17.50-18.00 |
Ensure participants are supported with set up |
Participants log into the online session
|
|
Introductions and context setting 10 mins |
18.00 – 18.10 |
Re-familiarising participants with the process, settling back in. |
Ipsos Chair to welcome the room back (10 mins): Participants allocated to (new) break-out groups, but not put in them.
As we transition to net zero…
|
|
Move to breakout (18.10) | |||
|
Table introductions 5 mins |
18.10 – 18.15 |
Introducing participants to new group and reflections on previous workshop. |
Break-out group introductions and warm-up FACILITATOR INTRODUCES THEMSELVES AND THE GROUP’S NOTE TAKER, THANKS FOR CONTINUED PARTICIPATION. COLLECTS PERMISSION/CONSENT FOR RECORDING.
|
|
Move to plenary (18.15) | |||
|
Future land and agriculture sector 10 mins |
18.15 – 18.25/30 |
To introduce the types of changes needed and why they are necessary |
CHAIR TO INTRODUCE SPEAKER – ASK PARTICIPANTS TO NOTE DOWN ANY THOUGHTS AND/OR QUESTIONS AS THEY LISTEN, WHICH WE WILL RETURN TO LATER Plenary presentation: Vision for a future land use and agriculture (Scotland’s Rural College) Presentation to help participants understand the land and agriculture sector, the changes that are likely to be needed, and how this impacts on food. Covering:
|
|
How different groups might be impacted by the transition 10 mins 5 minute buffer built in |
18.25/30 – 18.40 |
To help participants understand potential inequalities, that the just transition hopes to address |
CHAIR TO GIVE PARTICIPANTS A MINUTE TO REFLECT ON PRESENTATION 1 AND WRITE DOWN ANY BURNING THOUGHTS/QUESTIONS BEFORE INTRODUCING SPEAKER. Plenary presentation: Impacts of the transition on different groups (Climate Change Committee). To help participants to understand the impacts of the transition, covering:
|
|
Move to breakouts (18.40) | |||
|
Future land and agriculture sector -discussion 25 mins |
18.40 – 19.05 |
Initial views on future costs and their fairness. Opportunity to clarify any points from presentation |
We have the opportunity now to reflect on that presentation and to ask questions.
FACILITATOR TO PREPARE TOP QUESTION (WITH TWO BACK-UP). ENCOURAGE VOLUNTEERS TO ASK QUESTIONS ON BEHALF OF GROUP. |
|
BREAK |
19.05 – 19.15 |
BREAK |
Break (10 mins) Chair to present screen advising on time to return from break. TECH TEAM KEEP BREAK OUTS OPEN UNTIL END OF THE BREAK. |
|
Move to plenary (19.15) | |||
|
Q&A 20 mins |
19.15 – 19.35 |
Q&A |
Q&A in panel-style, with both presenters. CHAIR TO FACILITATE Q&A SESSION, WITH FACILITATORS ASKING THE QUESTIONS FROM THEIR BREAK-OUT GROUP OR CALLING ON PARTICIPANTS TO. |
|
Move to breakouts (19.35) | |||
|
Deliberation on key issues 30 mins |
19.35 – 20.05 |
Deliberation on key issues – changes required, impact on different groups, and how that could be made more fair |
[10 MINS] We’re now going to look at a Vision for 2040, which describes a future land use and agriculture sector. This Vision is based on the changes that the Scottish Government believes are necessary if we are to reach net zero, and some of these have been mentioned already by [the speakers]. FACILITATOR SHOWS THE SLIDE WITH THE “VISION FOR LAND USE AND AGRICULTURE IN 2040” AND READS THROUGH. REMIND PARTICIPANTS THAT THE SCENARIO IS BASED ON A VISION FOR SCOTLAND’S FUTURE LAND AND AGRICULTURE SYSTEM, PARTICULARLY HOW THAT IMPACTS ON FOOD.
[20 MINS]
SEE SLIDES LABELLED – “CHARACTERS – LAND USE AND AGRICULTURE”. SHOW THESE ON SCREEN. AIM TO COVER 2 CHARACTERS IF THERE IS TIME.
|
|
BREAK |
20.05 – 20.15 |
BREAK |
Break (10 mins) Facilitator to advice their group on the return time (back into plenary). |
|
Deliberation on key issues 30 minutes |
20.15-20.45 |
Deliberation on key issues – specific costs areas and how they should be shared fairly |
DURING THESE FINAL DISCUSSIONS ENCOURAGE PARTICIPANTS TO REFLECT ON THEIR OWN CIRCUMSTANCES, THOSE OF THE OTHER PARTICIPANTS IN THEIR GROUP, AND THE TYPES OF PEOPLE THEY DISCUSSED IN THE PREVIOUS EXERCISE. We are going to use this final discussion to bring together everything we have been discussing so far. We will do this in the same way we did in the previous session. Remember, for tonight, we’re focussing only on the changes that will be needed in the land and agriculture sector.
IF NOT COVERED ABOVE: Should the system of payment be based on:
|
|
Move to plenary (20.45) | |||
|
Feedback in plenary |
20.45-20.55 |
Participants hear from each other |
Each facilitator to give a recap on the key themes coming out of their breakout discussions – focussing on the key themes of how we share costs and benefits fairly. |
|
Close 5 mins |
20.55-21.00 |
Close |
Chair to close the day:
Thank participants and close |
Phase one, session five
30 September 2023, 10am – 1pm. Group of 30 participants, with 5 pre-assigned breakout groups (of 6 participants each).
Overarching objective: Participants consolidate their views on the costs, benefits and challenges associated with the transition and form wider conclusions on the cross-cutting elements relating to a just transition (i.e. fairness). Findings from this session will feed into the final concluding session.
|
Discussion structure |
Time allocated |
Objective |
Questions and materials |
|---|---|---|---|
|
Set-up: Facilitators check-in 25 mins |
09.30-09.50 |
Set up and test tech, and team preparation |
Facilitator and tech team only
|
|
Participant check-in 10 mins |
09.50-10.00 |
Ensure participants are supported with set up |
Participants log into the online session
|
|
Introductions and context setting 10 mins |
10.00 – 10.10 |
Re-familiarising participants with the process, settling back in. |
Ipsos Chair to welcome the room back (10 mins): Participants allocated to (new) break-out groups, but not put in them.
|
|
Move to breakout (10.10) | |||
|
Table introductions 15 mins |
10.10 – 10.25 |
Introducing participants to new group and initial discussions around fairness. |
Break-out group introductions and warm-up FACILITATOR INTRODUCES THEMSELVES AND THE GROUP’S NOTE TAKER, THANKS FOR CONTINUED PARTICIPATION. COLLECTS PERMISSION/CONSENT FOR RECORDING.
ALLOW PARTICIPANTS A MINUTE TO REFLECT ON THAT QUESTION, AND NOTE DOWN THEIR THOUGHTS ON A PIECE OF PAPER BEFORE ASKING THEM TO SHARE.
|
|
Move to plenary (10.25) | |||
|
Introduce future scenarios 10 mins |
10.25 – 10.35 |
To introduce the future scenarios |
Plenary presentation: Future scenarios (Ipsos chair) The chair will talk everyone through the future scenarios and provide a brief explanation of the plan for the remainder of the session (emphasising that it is largely over to them now to deliberate, with the help of Ipsos facilitators). An overview of the scenarios are:
Chair will explain that the scenarios are based on the sorts of changes we have been discussing in the sector sessions, and the different ways in which these changes might be brought about. The chair will emphasise that these are all things that are being considered or are already being done around the world, and are options that could be considered in Scotland. The chair will remind participants that the task is not to focus so much on how likely or desirable the changes are in Scotland, but how we make sure the costs and benefits of these changes are distributed fairly IF they were to happen. Will also emphasise that the aim is not for participants to choose the “best” scenario or decide which once should be implemented – we are using these as a way of helping participants to think differently about the three big questions we are trying to answer. |
|
Move to breakouts (10.35) | |||
|
Future scenarios – part 1 discussion 40 mins |
10.35 – 11.15 |
Exploring first scenario in detail |
SCENARIOS SUMMARY. EACH FACILITATOR TO FORCUS ON TWO SCENARIOS, BUT WITH THE OPTION TO COVER THE OTHERS WITH ANY REMAINING TIME: FACILITATORS TAKE ASSIGNED SCENARIO FOR FIRST BREAKOUT: FACILITATOR SHARE SCREEN AND GO TO FIRST SCENARIO IN MIRO, USING DIGITAL POST-ITS TO RECORD CROSS-CUTTING THOUGHTS / EMERGING CONCLUSIONS THAT ARISE DURING DISCUSSION, PLAYING THESE BACK TO PARTICIPANTS. The first scenario we are going to look at is [read title]. We’ll read through it together and then have a discussion about it. FACILITATOR READ THROUGH SCENARIO AND ALLOW TIME FOR PARTICIPANTS TO REFLECT/NOTE THINGS DOWN. Initial reactions to scenario (10 mins)
Scenario + individual impacts (15 mins) Let’s now think about this scenario in terms of your own live, if you are comfortable sharing.
Scenario + character impacts (15 mins) Now let’s look at this scenario in relation to our characters. FACILITATOR MOVE ALONG ON MIRO BOARD TO CHARACTER SUMMARY CARDS AND READ THROUGH THESE, THEN MOVE ALONG TO SCENARIO AND CHARACTERS SHOWN TOGETHER WITH ICONS. FACILITATOR REFER TO EACH BOX IN SCENARIO AND ASK:
PLACE GREEN CHARACTER ICONS ON PARTS OF SCENARIO WHERE PARTICIPANTS THINK THEY WILL BENEFIT. PLACE RED CHARACTER ICONS ON PARTS OF SCENARIO WHERE PARTICIPANTS THINK THEY WILL LOSE OUT.
LET PARTICIPANTS KNOW THAT THEY MIGHT NOT THINK ANY OF THE CHARACTERS SHOULD PAY, AND THEY CAN ADD GROUPS THAT THEY THINK SHOULD PAY USING POST-ITS (E.G. GOVERNMENT, BUSINESS, OTHER GROUPS OF PEOPLE).
|
|
Stay in breakouts (11.15) | |||
|
BREAK |
11.15 – 11.25 |
BREAK |
Facilitator sends own group on break and advises on return time (ensuring everyone gets at least 10 minutes) |
|
Stay in breakouts (11.25) | |||
|
Future scenarios – part 2 discussion 40 mins |
11.25 – 12.05 |
Exploring second scenario in detail |
SCENARIOS SUMMARY. EACH FACILITATOR TO FORCUS ON TWO SCENARIOS, BUT WITH THE OPTION TO COVER THE OTHERS WITH ANY REMAINING TIME: FACILITATORS TAKE ASSIGNED SCENARIO FOR SECOND BREAKOUT: FACILITATOR TO USE DIGITAL POST-ITS TO RECORD CROSS-CUTTING THEMES THAT EMERGE DURING DISCUSSION, PLAYING THESE BACK TO PARTICIPANTS. The first scenario we are going to look at is [read title]. We’ll read through it together and then have a discussion about it. FACILITATOR READ THROUGH SCENARIO AND ALLOW TIME FOR PARTICIPANTS TO REFLECT/NOTE THINGS DOWN. Initial reactions to scenario (10 mins)
Scenario + individual impacts (15 mins) Let’s now think about this scenario in terms of your own lives, if you are comfortable sharing.
Scenario + character impacts (15 mins) Now let’s look at this scenario in relation to our characters. FACILITATOR MOVE ALONG ON MIRO BOARD TO CHARACTER SUMMARY CARDS AND READ THROUGH THESE, THEN MOVE ALONG TO SCENARIO AND CHARACTERS SHOWN TOGETHER WITH ICONS. FACILITATOR REFER TO EACH BOX IN SCENARIO AND ASK:
PLACE GREEN CHARACTER ICONS ON PARTS OF SCENARIO WHERE PARTICIPANTS THINK THEY WILL BENEFIT. PLACE RED CHARACTER ICONS ON PARTS OF SCENARIO WHERE PARTICIPANTS THINK THEY WILL LOSE OUT.
LET PARTICIPANTS KNOW THAT THEY MIGHT NOT THINK ANY OF THE CHARACTERS SHOULD PAY, AND THEY CAN ADD GROUPS THAT THEY THINK SHOULD PAY USING POST-ITS (E.G. GOVERNMENT, BUSINESS, OTHER GROUPS OF PEOPLE).
|
|
Stay in breakouts (12.05) | |||
|
BREAK 10 mins |
12.05 – 12.15 |
BREAK |
Facilitator sends group on break. Halfway through break, tech support to close breakouts and bring everyone back to plenary. |
|
Move to plenary (12.15) | |||
|
Feedback |
12.15 – 12.25 |
Participants hear from others |
Chair invites facilitator to feedback on group discussions, briefly summarising scenarios explored and what the group’s conclusions were around how fair/unfair they are and what would need to be in place to ensure fairness. |
|
Move to breakouts (12.25) | |||
|
Emerging conclusions |
12.25 – 12.55 |
Emerging conclusions captured (preparing for final session) |
Reflections on feedback (5 mins) Before we get into our final task, I just want to get your thoughts on what the other groups have been discussing:
Forming conclusions (20-25 mins) We’re now going to revisit the discussion we had earlier about what fairness means, to help us start forming conclusions around how we ensure the costs and benefits of the transition to net zero – in each of the sectors we’ve been looking at – are fair. FACILITATOR SHARE DIGITAL WHITEBOARD AND READ OUT POST-ITS THAT WERE WRITTEN AT THE START. THEN BRING IN POST-ITS THAT HAVE BEEN WRITTEN OVER THE COURSE OF THE SESSION. Our final task is to start to tidy these up into conclusions, i.e. what we think the Scottish Government should consider as they draft the Just Transition Plans for each sector.
Revisit S1 Jamboard (5 mins) IF TIME, FACILITATOR SHOW JAMBOARD FROM SESSION 1 SHOWING INITIAL THOUGHTS ON WHAT A FAIR TRANSITION TO NET ZERO MEANS.
|
|
Move to plenary | |||
|
Close 5 mins |
12.55-13.00 |
Close |
Chair to close the day:
Thank participants and close |
Phase one, session six
5 October 2023, 6-9pm. Group of 30 participants, with 5 pre-assigned breakout groups (of 6 participants each).
Overarching objective: Participants review, ratify and finalise their conclusions.
|
Discussion structure |
Time allocated |
Objective |
Questions and materials |
|---|---|---|---|
|
Set-up: Facilitators check-in 25 mins |
17.30-17.50 |
Set up and test tech, and team preparation |
Facilitator and tech team only
|
|
Participant check-in 10 mins |
17.50-18.00 |
Ensure participants are supported with set up |
Participants log into the online session
|
|
Introductions and context setting 15 mins |
18.00 – 18.15 |
Re-familiarising participants with the process, settling back in. |
Ipsos Chair to welcome the room back (15 mins): Participants allocated to (new) break-out groups, but not put in them.
|
|
Move to breakout (18.15) | |||
|
Table introductions and ratifying conclusions on Q1 20 mins |
18.15 – 18.35 |
Introducing participants to new group and ratifying conclusions on Q1 |
Break-out group introductions and warm-up FACILITATOR INTRODUCES THEMSELVES AND THE GROUP’S NOTE TAKER, THANKS FOR CONTINUED PARTICIPATION. COLLECTS PERMISSION/CONSENT FOR RECORDING.
As the chair said, we’re going to spend most of this workshop finalising our conclusions on each of the overarching questions. As we do this, we’ll think about each of the sectors too. FACILITATOR SHARE SCREEN WITH DRAFT RESPONSES TO FIRST QUESTION: As we transition to net zero, who should pay for the changes that will be needed? This is a summary of responses that we have pulled together based on what you’ve said in previous sessions. These conclusions should be in your words, so I’m going to ask what (if anything) you’d like to change, add or take away to make sure it reflects what you think, based on what you’ve heard throughout this process. If we don’t agree on anything, that’s absolutely okay, we will discuss it as a group if that’s the case FACILITATOR TO CONTINUALLY CHECK WHETHER THERE IS AGREEMENT ON ANY CHANGES OR IF THERE ARE DIFFERENT VIEWS. IF THERE IS DISAGREEMENT, CAPTURE DIFFERENT VERSIONS TO REFLECT DIFFERENT PERSPECTIVES.
|
|
Move to plenary (18.35) | |||
|
Feedback on Q1 10 mins |
18.35 – 18.45 |
Feedback on Q1 |
Chair invites each facilitator to share screen and summarise the group’s changes / reasoning. |
|
Move to breakout (18.45) | |||
|
Reflections on Q1 edits and ratifying conclusions on Q2 10 mins |
18.45 – 18.55 |
Reflections on Q1 edits and ratifying conclusions on Q2 |
Reflecting on other edits (10 mins)
IF NEEDED, FACILITATOR TO REITERATE CHAIR’S REMARKS ABOUT HOW THE FINAL CONCLUSIONS WILL BE PRESENTED IN THE REPORT (I.E. THEY WILL REFLECT THE GROUP’S EDITS BUT ALSO THE RANGE OF VIEWS AROUND THEM, SO IT’S IMPORTANT TO HEAR FROM ANYONE WHO DISAGREES WITH PARTICULAR WORDING SO THAT WE CAN EXPLAIN THIS IN THE REPORT).
|
|
Ratifying conclusions on Q2 20 mins |
18.55- 19.15 |
Ratifying conclusions on Q2 |
FACILITATOR SHARE SCREEN WITH DRAFT RESPONSES TO SECOND QUESTION: How can we make that system of payment is fair? Moving onto question 2, this is a summary of responses that we have pulled together based on what you’ve said in previous sessions. FACILITATOR TO CONTINUALLY CHECK WHETHER THERE IS AGREEMENT ON ANY CHANGES OR IF THERE ARE DIFFERENT VIEWS. IF THERE IS DISAGREEMENT, CAPTURE DIFFERENT VERSIONS TO REFLECT DIFFERENT PERSPECTIVES.
|
|
Stay in breakouts (19.15) | |||
|
BREAK 10 mins |
19.15 – 19.30 |
BREAK |
Facilitator to advise on time to return from break |
|
Move to plenary (19.30) | |||
|
Feedback on Q2 10 mins |
19.30 – 19.40 |
Feedback on Q2 |
Chair invites each facilitator to share screen and summarise the group’s changes / reasoning. Chair introduces poll and asks participants to answer this question again: “Who do you think should take the lead in tackling climate change in Scotland?
Chair closes poll but results not shown. Chair explains that they will be presented again later. |
|
Move to breakouts (19.40) | |||
|
Reflections on Q2 edits 10 mins |
19.40 – 19.50 |
Reflections on Q2 edits |
IF NEEDED, FACILITATOR TO REITERATE CHAIR’S REMARKS ABOUT HOW THE FINAL CONCLUSIONS WILL BE PRESENTED IN THE REPORT (I.E. THEY WILL REFLECT THE GROUP’S EDITS BUT ALSO THE RANGE OF VIEWS AROUND THEM, SO IT’S IMPORTANT TO HEAR FROM ANYONE WHO DISAGREES WITH PARTICULAR WORDING SO THAT WE CAN EXPLAIN THIS IN THE REPORT).
|
|
Stay in breakouts (19.55) | |||
|
Ratifying conclusions on Q3 20 mins |
19-50-20.10 |
Ratifying conclusions on Q3 |
FACILITATOR SHARE SCREEN WITH DRAFT RESPONSES TO THIRD QUESTION: How can we make sure that everyone benefits? Moving onto our final question, this is a summary of responses that we have pulled together based on what you’ve said in previous sessions. FACILITATOR TO CONTINUALLY CHECK WHETHER THERE IS AGREEMENT ON ANY CHANGES OR IF THERE ARE DIFFERENT VIEWS. IF THERE IS DISAGREEMENT, CAPTURE DIFFERENT VERSIONS TO REFLECT DIFFERENT PERSPECTIVES.
|
|
Move to plenary (20.10) | |||
|
Feedback on Q3 edits and poll 10 mins |
20.10 – 20.20 |
Feedback on Q3 edits and poll |
Chair invites each facilitator to share screen and summarise the group’s changes / reasoning. Chair presents slide showing S1/S6 poll and comments on results/any shifts. Introduces final breakout. |
|
Move to breakouts (20.20) | |||
|
Reflections on Q3 edits, poll results and projective exercise 10-15 mins (Facilitators to judge length based on how much they say in the reflections section) |
20.20 – 20.30-35 |
Participants hear from others |
Reflections on Q3 edits (5-10 mins)
Poll results and reflections on process (5-10 mins)
IF ANY TIME REMAINING: Before we finish, I’d be interested in hearing your reflections on this process overall.
|
|
Move to plenary (20.30/35) | |||
|
Close |
20.30/35 – 20.40/45 |
Thank participants |
Chair to thank participants for their efforts over the 6 sessions, explain next steps including final online community activity (see below*), and reporting. Ipsos to thank participants and close the session. Final activity for the online community On the online community, we will ask you to write a postcard to yourself as if you were in the year 2040. Imagine you are writing back to yourself in the current moment – in 2023 – about the changes that have been made in Scotland: what has it meant for how you travel around in 2040? The house you live in? The food you eat? And how you feel about these changes? |
Phase two, session one
Wednesday 6 March 2024, 6.30pm-8.30pm
Overarching objective: introduce participants to key concepts and familiarise them with the online discussion format and their role throughout the dialogue. Opportunity for Q&A to develop understanding before moving into focused discussion on each sector in subsequent sessions.
|
Discussion structure |
Time |
Objective |
Questions and materials |
|---|---|---|---|
|
Set-up: Facilitators check-in 20 mins |
18.00-18.20 |
Set up and test tech, and team preparation |
Facilitator and tech team only
|
|
Participant check-in 10 mins |
18.20-18.30 |
Ensure participants are supported with set up |
Participants log into the online session
|
|
Introductions and context setting 10 mins |
18.30 – 18.40 |
Welcome and introduction of process |
Ipsos Chair to welcome everyone to the dialogue (10 mins): Participants allocated to break-out groups, but not put in them.
To explore the public’s views on how the changes in the transport and the built environment sectors are done fairly to ensure a just transition to net zero.
|
|
Move to breakout (18.40) | |||
|
Table introductions |
18.40 – 18.50 |
Introducing participants to group, gathering initial thoughts and feelings. |
Break-out group introductions (10 mins)
|
|
Move to plenary (18.50) | |||
|
Presentation on climate change and the move to net zero 10 mins |
18.50 – 19.00 |
Introduction to key issues around climate change and the transition to net zero |
Plenary presentation 1 (10 mins): Climate change and the move to net zero. CXC BEFORE PRESENTATION STARTS – CHAIR TO ASK PARTICIPANTS TO WRITE DOWN ON (ON A PIECE OF PAPER, OR ON THEIR PHONE) ANY THOUGHTS OR QUESTIONS WHICH THEY WILL HAVE THE OPPORTUNITY TO SHARE LATER ON. Presentation to help participants understand the key concepts relating to climate change, net zero and to outline the SG’s plans generally:
|
|
Stay in plenary (19.00) | |||
|
Presentation on just transition 10 mins |
19.00 – 19.15 5 minute buffer built in here to allow for intros/ crossover |
Introduction to just transition |
Plenary presentation 2 (10 mins): Just Transition and JTPs. Scottish Government BEFORE PRESENTATION STARTS – CHAIR TO ASK PARTICIPANTS TO WRITE DOWN ON (ON A PIECE OF PAPER, OR ON THEIR PHONE) ANY THOUGHTS OR QUESTIONS WHICH THEY WILL HAVE THE OPPORTUNITY TO SHARE LATER ON. Presentation to help participants understand the concept of just transition:
|
|
BREAK (19.15) | |||
|
Chair displays break time on screen and encourages participants to take a screen break 19.15-19.25 (10 mins) | |||
|
Return to plenary (19.25) | |||
|
Presentation on public engagement so far |
19.25 – 19.35 |
Overview of the range of public engagement already carried out |
Plenary presentation 3 (10 mins): Findings from public engagement so far. Chair, Ipsos Scotland BEFORE PRESENTATION STARTS – CHAIR TO ASK PARTICIPANTS TO WRITE DOWN ON (ON A PIECE OF PAPER, OR ON THEIR PHONE) ANY THOUGHTS OR QUESTIONS WHICH THEY WILL HAVE THE OPPORTUNITY TO SHARE LATER ON. Provide an overview of what public engagement has happened so far, and what it’s told us:
|
|
Move to breakouts (19.35) | |||
|
Reflections and question forming 25 mins |
19.35 – 20.00 |
Reflect on presentations and gather questions |
Reflections on presentations (15 mins): FACILITATOR REMIND PARTICIPANTS THAT THE PRESENTATIONS HAVE BEEN RECORDED AND WILL BE MADE AVAILABLE TO WATCH BACK AT ANY TIME. AIM FOR ABOUT 5 MINS OF DISCUSSION PER PRESENTATION. ORDER FOR GROUPS 1-2: CXC, SG, IPSOS ORDER FOR GROUP 3: IPSOS, SG, CXC
Question gathering (5 mins):
GATHER QUESTIONS FROM ANY PART OF THE SESSION AND ASK GROUP TO PRIORITISE 2-3 FOR Q&A (REASSURE THAT OTHER QUESTIONS WILL BE PUT TO SPEAKERS AFTER SESSION AND WRITTEN RESPONSES PROVIDED OVER EMAIL OR RECAPPED IN NEXT SESSION). |
|
Move to plenary (20.00) | |||
|
Q&A 20 mins |
20.00 – 20.20 |
Q&A with experts |
CHAIR TO CALL ON FACILITATORS IN TURN TO ASK QUESTIONS AND DIRECT TO RELEVANT EXPERTS |
|
Stay in plenary (20.20) | |||
|
Final reflections and wrap up 10 mins |
20.20 – 20.30 |
Final reflections and exercise |
Chair to thank experts and participants for taking part in the discussion and introduce final plenary exercise ( 5 mins) On screen, you’ll see a sentence and all we want you to do is complete this sentence in your own words based on what you’ve heard tonight. There is a character limit so try and keep it short and snappy! To me, a just transition to net zero means… Chair to comment on results before closing the session (5 mins):
|
Phase two, session two
Thursday 15 March 2024, 6.30pm-9pm
Overarching objective: To introduce potential changes to our transport system including road user charges, and to test views on different approaches to this in terms of their fairness.
|
Discussion |
Time |
Objective |
Questions and materials |
|---|---|---|---|
|
Set-up: Facilitators check-in 20 mins |
18.00-18.20 |
Set up and test tech, and team preparation |
Facilitator and tech team only
|
|
Participant check-in 10 mins |
18.20-18.30 |
Ensure participants are supported with set up |
Participants log into the online session
|
|
Introductions and context setting 10 mins |
18.30 – 18.40 |
Welcome and introduction to this session |
Ipsos Chair to welcome everyone Participants allocated to break-out groups, but not put in them.
|
|
Move to breakout (18.40) | |||
|
Role of transport in your life 15 mins |
18.40 – 18.55 |
Introducing participants to group, understanding their current transport behaviour |
Break-out group introductions and warm-up FACILITATOR INTRODUCES THEMSELVES AND THE GROUP’S NOTE TAKER, THANKS FOR CONTINUED PARTICIPATION. COLLECTS PERMISSION/CONSENT FOR RECORDING.
|
|
Move to plenary (18.55) | |||
|
Presentation on road user charging 10 mins |
18.55 – 19.05 |
Help participants understand why charging is necessary |
Plenary presentation: How can we reduce our reliance on cars? Presentation to help participants understand why we are focussing on actions related to road users and to introduce road user charging. Coverage of presentation:
|
|
Move to breakout (19.05) | |||
|
Discussion on road user charging 15 mins |
19.05 – 19.20 |
To understand overall views on charging and to set up key considerations for the discussion on specific policies. |
We have the opportunity now to reflect on and discuss your views on what you heard. We are going to look at some specific examples of road user charging later, so that we can discuss how it might work. But first…
NOTE – IF PARTICIPANTS RAISE CONCERNS ABOUT 20 MIN NEIGHBOURHOODS, OR HAVE THE IMPRESSION THAT THEY MEAN RESTRICTING WHERE WE CAN DRIVE, YOU CAN SAY: “The idea behind 20 minute neighbourhoods is to create thriving, positive places and tackle inequalities by improving access to local facilities. It is not about restricting movement or ability to travel, but is based on better provision of local services and amenities that reduce the need to travel. The idea is flexible and should be adapted to support local needs and context, and effective community engagement is a key part of it.” |
|
BREAK 19.20-19.30 (10 mins) | |||
|
Return to breakouts (19.30) | |||
|
Reviewing different charging approaches 45 mins |
19.30 – 20.15 |
To test the acceptability and fairness of policy options |
We are now going to look at how road user charging might be applied in Scotland. The Scottish Government is currently exploring options for how car demand management could be applied in future. It has carried out research exploring how different options could work, and is reviewing the existing powers that local authorities have to ensure these are fit for purpose in the future. As part of these considerations we are now interested in your views on road user charging options, including what they might mean for you and your household, and for other people across Scotland. There are two potential approaches that we are going to look at. These are based on approaches that have happened elsewhere. I am going to show you each option on screen, and after each one we will have a discussion about it. As you will see, these are fairly brief descriptions and are not shown as fully formed ideas. That is because we want to open up discussion about how approaches like these might work, how fair they feel, and what else you think should be considered. These workshops are part of the process of developing these policies, so we do invite questions and even challenge about these. ORDER OF THE OPTIONS TO BE ROTATED BETWEEN GROUPS FACILITATOR TO HAVE SLIDES THAT HAVE MOCKED-UP DESCRIPTIONS OF THE TWO OPTIONS, INCLUDING THE FOLLOWING INFORMATION: Option 1: UK National road pricing.
NOTE: If asked about how this apples to SG, explain that “The Scottish Government would be involved in discussions about future systems, and would use any evidence (such as what this group tells us) to continue to press the UK Government for a fair and progressive future transport finance system.” Option 2: Urban local road user charging.
AFTER EACH OPTION, ASK THE FOLLOWING:
CHARACTERS AFTER GOING THROUGH EACH OPTION, FACILITATOR INTRODUCES THE CHARACTERS
SHOW CHARECTORS ON SCREEN, ONE BY ONE, EACH GROUP COVERING 1-2 CHARACTERS. ORDER:
|
|
Move to breakouts (20.25) | |||
|
Conclusion-forming 25 mins |
20.25-20.50 |
To bring everything together and form conclusions |
We are going to use this final discussion to bring together everything we have been discussing so far. Working together, I’d like you answer this question: “If road user charging is introduced, what needs to be in place to make it fair?” REMIND PARTICIPANTS THAT IN THIS FINAL SECTION WE ARE TALKING ABOUT ROAD USERS CHARGING IN GENERAL, NOT ONE OF THE SPECIFIC OPTIONS ABOVE (BUT THEY CAN REFER TO THOSE IF THEY LIKE). ASK PARTICIPANTS TO COME UP WITH THREE STATEMENTS IN RESPONSE TO THIS OVERARCHING QUESTIONS. PARTICIPANTS START BY CALLING OUT THEIR RESPONSES, WHICH ARE NOTED DOWN ON VIRTUAL POST ITS. THEY THEN DISCUSS / RANK THE 3 THAT THEY FEEL ARE MOST IMPORTANT. FACILITATOR HAS THESE 3 STATEMENTS WRITTEN UP (ON THE MIRO BOARD, OR ON 3 BULLET POINTS ON A SLIDE), READY TO FEEDBACK IN PLENARY. |
|
Move to plenary (20.50) | |||
|
Feedback and wrap up 10 mins |
20.50 – 21.00 |
Final reflections and exercise |
CHAIR THANKS EVERYONE INVITES FEEDBACK FROM EACH OF THE THREE GROUPS, CONCENTRATING ON THEIR 3 CONCLUDING STATEMENTS THEY CREATED. BRIEF RECAP ON NEXT STEPS, THANK AND CLOSE. |
Phase two, session three
Wednesday 20 March 2024, 6pm-9pm
Overarching objective: To introduce changes required to transition to clean heating in homes, and to test views on different financing approaches to this in terms of their fairness.
|
Discussion |
Time |
Objective |
Questions and materials |
|---|---|---|---|
|
Set-up: Facilitators check-in 20 mins |
17.30-17.50 |
Set up and test tech, and team preparation |
Facilitator and tech team only
|
|
Participant check-in 10 mins |
17.50-18.00 |
Ensure participants are supported with set up |
Participants log into the online session
|
|
Introductions and context setting 10 mins |
18.00 – 18.10 |
Welcome and introduction to this session |
Ipsos Chair to welcome everyone Participants allocated to break-out groups, but not put in them.
Thinking about the energy efficiency of your home, which of these statements – if any – comes closest to your own view or experience?
If you were considering making changes to the energy efficiency of your home over the next decade, which of these – if any – would be the biggest factor in your decision to go ahead or not?
|
|
Move to breakout (18.10) | |||
|
Role of transport in your life 15 mins |
18.10 – 18.25 |
Introducing participants to group, understanding their current transport behaviour |
Break-out group introductions and warm-up FACILITATOR INTRODUCES THEMSELVES AND THE GROUP’S NOTE TAKER, THANKS FOR CONTINUED PARTICIPATION. COLLECTS PERMISSION/CONSENT FOR RECORDING.
|
|
Move to plenary (18.25) | |||
|
Presentation on energy transition in homes 10 mins |
18.25 – 18.35 |
Help participants understand why heat transition is necessary and options for financing it |
Plenary presentation: How can we fairly transition our homes to clean energy? Presentation to help participants understand why we are focussing on heat transition in homes and different approaches to paying for this. Coverage of presentation:
|
|
Move to breakout (18.35) | |||
|
Discussion on clean heating 20 mins |
18.35 – 18.55 |
To understand overall views on charging and to set up key considerations for the discussion on specific policies. |
We have the opportunity now to reflect on and discuss your views on what you heard. We are going to look at some specific approaches for making these changes later, so that we can discuss how it might work. But first…
|
|
BREAK 18.55-19.05 (10 mins) | |||
|
Return to breakouts (19.05) | |||
|
Reviewing different financing approaches to heat transition 55 mins |
19.05 – 20.00 |
To test the acceptability and fairness of policy options |
We are now going to look at how the transition to more energy efficient homes could be achieved in Scotland. The Scottish Government is currently exploring options for how the transition to clean heating and more energy efficient homes can be financed, recognising that it will be unaffordable to finance this through public funding alone. The Scottish Government is considering how best to make use of the public and private funding options available. As part of these considerations we are now interested in your views on approaches to paying for these changes to homes, including what different payment options might mean for you and your household, and for other people across Scotland, as well as the timescales for making changes. There are two potential approaches that we are going to look at. I am going to show you each option on screen, and after each one we will have a discussion about it. ORDER OF THE OPTIONS TO BE ROTATED BETWEEN GROUPS FACILITATOR TO HAVE SLIDES THAT HAVE MOCKED-UP DESCRIPTIONS OF THE TWO OPTIONS, INCLUDING THE FOLLOWING INFORMATION: Option 1: More widely available public financing, stricter penalties (approx. 20 mins)
*If asked about the EPC rating, facilitators to read out: An Energy Performance Certificate (EPC) gives a property an energy efficiency rating from A (most efficient) to G (least efficient) and is valid for 10 years. *If asked about penalties, facilitators to read out: For landlords, civil penalties might include a fine for not responding to a compliance notice, and the landlord may not be able to let the property after 2028 if the required energy efficiency rating isn’t met by then, For homeowners, civil penalties could include a fine if the property does not meet required energy efficiency rating by 2033. Option 1 discussion:
Option 2: More targeted public financing, softer penalties (approx. 20 mins)
*If asked about the EPC rating, facilitators to read this out: An Energy Performance Certificate (EPC) gives a property an energy efficiency rating from A (most efficient) to G (least efficient) and is valid for 10 years. *If asked about penalties, facilitators to read out: For landlords, civil penalties might include a fine for not responding to a compliance notice, and the landlord may not be able to let the property after 2028 if the required energy efficiency rating isn’t met by then. Option 2 discussion:
CHARACTERS (approx. 15 mins) AFTER GOING THROUGH EACH OPTION, FACILITATOR INTRODUCES THE CHARACTERS
SHOW CHARECTORS ON SCREEN, ONE BY ONE, EACH GROUP COVERING 1-2 CHARACTERS. ORDER:
|
|
BREAK 20.00-20.10 (10 mins) | |||
|
Move to breakouts (20.10) | |||
|
Conclusion-forming 30 mins |
20.10-20.40 |
To bring everything together and form conclusions |
We are going to use this final discussion to bring together everything we have been discussing so far. Working together, I’d like you answer this question: “If all households are going to be required to improve their home’s energy efficiency and switch to clean heating, what needs to be in place to make how we pay for it fair?” REMIND PARTICIPANTS THAT IN THIS FINAL SECTION WE ARE TALKING ABOUT CHANGES TO HEATING SYSTEMS IN GENERAL, NOT ONE OF THE SPECIFIC OPTIONS ABOVE (BUT THEY CAN REFER TO THOSE IF THEY LIKE). ASK PARTICIPANTS TO COME UP WITH THREE STATEMENTS IN RESPONSE TO THIS OVERARCHING QUESTIONS. PARTICIPANTS START BY CALLING OUT THEIR RESPONSES, WHICH ARE NOTED DOWN ON VIRTUAL POST ITS. THEY THEN DISCUSS / RANK THE 3 THAT THEY FEEL ARE MOST IMPORTANT. FACILITATOR HAS THESE 3 STATEMENTS WRITTEN UP (ON 3 BULLET POINTS ON A SLIDE), READY TO FEEDBACK IN PLENARY. (IF TIME) Reflections on the process With the few minutes remaining, I’d be interested to hear your thoughts on this process and your participation…
|
|
Move to plenary (20.40) | |||
|
Feedback and wrap up 10 mins |
20.40 – 20.50 |
Final reflections and exercise |
CHAIR THANKS EVERYONE INVITES FEEDBACK FROM EACH OF THE THREE GROUPS, CONCENTRATING ON THEIR 3 CONCLUDING STATEMENTS THEY CREATED. CHAIR CONDUCTS END OF SESSION POLL. Thinking about the changes that will be required to how people heat their homes, and your own personal view on the issues we’ve discussed this evening, which of these statements would you agree with more?
I agree with A more than B I agree with B more than A I don’t agree with either I’m not sure THANKS PARTICIPANTS FOR THEIR CONTRIBUTIONS, EXPLAIN NEXT STEPS FOR REPORTING AND THAT WE WILL SEND AN EMAIL TO CHECK PREFERENCES FOR KEEPING IN TOUCH ABOUT THAT, AND POTENTIAL FUTURE OPPORTUNITIES TO TAKE PART IN PUBLIC ENGAGEMENT ON THIS. INVITE REP FROM CXC/SG TO SAY CLOSING REMARKS. THANK AND CLOSE. |
Appendix D – Characters
The following character descriptions were provided to participants in the sector specific workshops to aide their deliberations. The characters were created by Ipsos, with input from Scottish Government and ClimateXChange, and were used as stimulus to help participants consider a range of different experiences from across Scotland. The design of the dialogue and development of characters was informed by interviews with stakeholders in each of the sectors who identified several groups who would be more likely to be impacted by the changes.
Phase 1


Phase 2


© The University of Edinburgh, 2024
Prepared by Ipsos on behalf of ClimateXChange, The University of Edinburgh. All rights reserved.
While every effort is made to ensure the information in this report is accurate, no legal responsibility is accepted for any errors, omissions or misleading statements. The views expressed represent those of the author(s), and do not necessarily represent those of the host institutions or funders.
https://www.gov.scot/publications/securing-green-recovery-path-net-zero-update-climate-change-plan-20182032/documents/ ↑
https://www.legislation.gov.uk/asp/2019/15/enacted ↑
https://www.gov.scot/publications/transition-commission-national-mission-fairer-greener-scotland/documents/ ↑
National Just Transition Planning Framework – Just Transition – A Fairer, Greener Scotland: Scottish Government response – gov.scot (www.gov.scot) ↑
https://www.gov.scot/publications/draft-energy-strategy-transition-plan/ ↑
https://www.gov.scot/publications/net-zero-nation-public-engagement-strategy-climate-change/ ↑
https://www.climatexchange.org.uk/media/4231/understanding-and-engaging-the-public-on-climate-change.pdf; https://www.theccc.org.uk/publication/the-role-of-deliberative-public-engagement-in-climate-policy-development-university-of-lancaster/ ↑
https://sciencewise.org.uk/about-sciencewise/our-guiding-principles/ ↑
https://www.gov.scot/publications/transition-transport-sector-discussion-paper/; https://www.gov.scot/publications/transition-built-environment-construction-sector-discussion-paper/; https://www.gov.scot/publications/transition-land-use-agriculture-discussion-paper/ ↑
Participants felt a fair tax system would be required, whereby those who can afford to pay a higher share. ↑
Discussions on a fair system of payment also led some participants to call for wider overhauls of the existing tax system, which they felt should be fairer and more equitable. However, this broader point fell beyond the remit of this dialogue. ↑
When discussing protecting those on low incomes, some felt that this should be widened to say “support those on differing incomes”. The point was that people not defined as “low income” may also need support. These two positions did not necessarily conflict, as both were based on the principle of protecting those who could not afford to make changes. However, the group that suggested “differing incomes” wanted to stress the point (made earlier in the report) that income was not the only determinant of ability of pay. ↑
In discussion about informing the public on the changes needed, it was specified that this should highlight how the changes will positively impact the future of transport, home energy and food production/consumption. ↑
In discussion about their aspirations related to leadership and accountability, one group suggested that there should be measures in place to prevent future leaders from totally reversing changes that have been agreed on. However, they also said leaders should have some flexibility to change the approach. They also hoped for cross-party consensus if possible. ↑
This conclusion built on discussions from previous sessions, and those who suggested it saw the role of a non-political body as providing independent monitoring of the transition and associated costs, ensuring that people are treated fairly. It was described as something akin to Ofgem (the independent energy regulator) but specifically for the transition to net zero. ↑
While participants did not specify what exact sources they would consider “credible”, they noted specific media outlets which they personally would not trust (which are not named in this report). They also suggested that specialist advisers should be placed in Citizen’s Advice Bureaux, in Job Centres, or at community meetings. This highlights some of the sources that they felt would be useful means of disseminating information. ↑
Some felt that empowerment would only be achieved through the use of incentives and not through the use of charges or penalties. They therefore suggested changing the language from “Empower people” to “Encourage people”. As this was only suggested by one group, the original language was kept but their views are noted here. ↑
It was emphasised that carrots should be identified based on investment in research. It was felt that sticks need to be carefully thought about in terms of where they should fall – e.g. taking into account individual circumstances. One group felt that certain industries should be exempt (from the sticks) where it is technically not possible to reduce emissions. They used the example of steel manufacturers, which falls outside of the remit of this research. ↑
https://www.futureeconomy.scot/publications/59-measuring-carbon-inequality-in-scotland ↑
https://www.gov.scot/publications/transition-fairer-greener-scotland/pages/5/ ↑
https://www.justtransition.scot/publication/time-to-deliver-annual-report-2023/ ↑
https://es.catapult.org.uk/project/electrification-of-heat-demonstration/ ↑
Public Health Scotland define transport poverty as the lack of transport options that are available, reliable, affordable, accessible or safe that allow people to meet their daily needs and achieve a reasonable quality of life, see: https://publichealthscotland.scot/publications/transport-poverty-a-public-health-issue/transport-poverty-a-public-health-issue/ ↑
Please note that participants did not generally distinguish between private landlords and the social rented sector when discussing issues relating to those in rental properties. The type of landlord is specified where participants did make this distinction. ↑
The achieved number of African, Caribbean, Black or Black Scottish/British participants was zero in phase one due to a last minute dropout. Additional targets were set in phase two to ensure representation from this ethnic minority group. ↑
Anyone agreeing with the statement “I’m still not convinced that climate change is happening” was screened out at the recruitment stage to help ensure that those convened for the dialogue could focus on how the costs/benefits of the changes could be distributed fairly to reach net zero (not whether changes should happen at all, though views on this – where expressed – were noted). ↑
A particular focus and boost was placed on the African, Caribbean, Black or Black Scottish/British minority ethnic group due to lack of representation of this group in phase one. ↑
Anyone agreeing with the statement “I’m still not convinced that climate change is happening” was screened out at the recruitment stage to help ensure that those convened to engage in the dialogue could focus on how the costs/benefits of the changes could be distributed fairly to reach net zero (not whether changes should happen at all, though views on this – where expressed – were noted). ↑
Research completed in September 2024
DOI: http://dx.doi.org/10.7488/era/4915
This work was carried out in accordance with the requirements of the international quality standard for Market Research, ISO 20252.
Executive summary
This report sets out key findings from an exercise that mapped public engagement activities on the heat transition in Scotland.
The aim of the research was to help inform the delivery of the Heat in Buildings Public Engagement Strategy by addressing questions related to who delivers engagement activities and to whom, the type of activities and messages, and gaps in engagement.
We conducted a web search, interviews with experts from organisations involved in the heat transition and an online survey of organisations delivering public engagement activity.
Findings
Overview of ongoing activities:
- A wide range of organisations across the public, private and charitable sectors have been delivering public engagement activities on the heat transition in Scotland.
- The types of public engagement have also been varied, with the most common being advice services, workshops and information sharing online.
Target audience, messaging and accessibility as discussed by experts and organisations:
- Engagement activities were mostly open to the general public. There were also some specific target groups identified, including residents within a specific geographic area, homeowners, people in fuel poverty, low-income households and energy sector professionals.
- Despite attempts to engage a broad range of audiences, those actually engaged in the activities were typically more climate aware than the general public overall.
- Messaging that was focused on home energy efficiency and reducing energy bills, rather than the adoption of clean heating systems, resonated better with wider audiences in the context of the cost of living.
- Engagement on “simple fixes” (e.g. turning boiler temperature down) was therefore more widespread than messaging around bigger steps (e.g. installing a heat pump).
- Activities delivered through trusted messengers and existing local channels were accessible forms of engagement.
- Tailoring messages to the specific target audience was an effective approach to accessible engagement as it helped to improve understanding.
Gaps in public engagement identified by experts and organisations:
- Audiences under-engaged on the heat transition included private landlords, renters, professionals in the energy sector, young people and the digitally excluded.
- Lack of regulatory clarity on clean heat and energy efficiency was a key reason for the engagement gap among landlords and the energy sector.
- The upfront costs of transitioning were a barrier to widening reach among the general public, especially in the context of the cost of living crisis.
- Key messaging gaps in public engagement included:
- A lack of public understanding of heating systems.
- Insufficient practical and transparent advice on installing and operating clean heating systems.
- Interviewees thought that certain aspects of the transition, such as what clean heating systems are and how to install them, were not successfully communicated to the wider public due to their perceived complexity.
- They felt that communication about the efficacy of clean heating systems, based on real use cases, was lacking.
- There was a shortage of trusted messengers providing reliable, impartial advice, as well as a lack of tradespeople able to provide technical support on the practical aspects of the transition.
Conclusions
To ensure that public engagement on the heat transition builds on what has been done before and is effective in prompting action, consider:
- Prioritising the private rented sector, professionals in the energy sector and those who are digitally excluded:
- Firstly, engage with the energy and private rented sectors to drive engagement and action forward, for example by sharing information and practical advice among the wider public.
- Secondly, engage with the general public, emphasising the experiences of early adopters to build trust in the efficacy of clean heating systems.
- Tailoring messages to the audience:
- For industry professionals, provide clarity on the changes required and reassurance on the support available.
- For the general public, make it easier for those who are more highly motivated by the climate crisis to take action, so that there are more operational examples to encourage those who may be more hesitant to take action.
- Highlight the financial benefits and availability of grants and loans.
- Building trust:
- Improve the baseline public understanding of clean heating systems.
- Communicate transparently around the needs, benefits and risks of transitioning to a clean heating system.
- Use trusted messengers who are already embedded in local communities.
- Providing regulatory clarity, as organisations feel they cannot deliver effective public engagement activities without knowing if and when clean heat and energy efficiency regulations will come into force, and what specific changes will be required.
Introduction
This report presents the findings from research conducted by Ipsos on behalf of ClimateXChange and the Scottish Government, mapping public engagement on the heat transition in Scotland.
Background
Scotland’s climate change legislation sets a target date for net zero emissions of all greenhouse gases by 2045. The Scottish Government reports that domestic buildings account for around 12% of Scotland’s greenhouse gas emissions, and non-domestic buildings contribute another 7%. Urgently reducing emissions from Scotland’s buildings is therefore a crucial part of achieving net zero, and will require the majority of households in Scotland to change their heating systems. Plans for this are set out in the Scottish Government’s Heat in Buildings Strategy (HiBS). The process of transitioning heating from using fossil fuels to using clean heating systems, is often referred to as the ‘heat transition’.
To ensure success in decarbonising Scotland’s home heating, public engagement is key. Existing research by Consumer Scotland highlights a general lack of awareness among the Scottish public about the heat transition, clean heating systems, and low-carbon technology. Building on this, research conducted for ClimateXChange included recommendations about the ways in which messages around the heat transition should be communicated to the public, including making a positive case for change in a highly visible way, harnessing the influence of existing trusted messengers to deliver information consistently, and giving plenty notice in advance of any legislation being announce. The Existing Homes Alliance Scotland published a report in July 2023 which highlighted the need for clear and tailored messaging, backed up with accessible resources, to encourage action at the scale and pace required to reach net zero.
In this context, the Scottish Government published its Heat Transition Public Engagement Strategic Framework in December 2023 to guide its engagement work around clean heat and energy efficiency. The Framework aims to ensure the Scottish public are aware of and understand the changes required in the heat transition, know how to access support, can actively participate in shaping policy, legislation and delivery schemes, and importantly can take action in decarbonising their homes.
Research aims
ClimateXChange and the Scottish Government commissioned Ipsos Scotland to map existing public engagement on the heat transition in Scotland to help inform the delivery of the Heat in Buildings Public Engagement Strategy.
This public engagement mapping aimed to address the following research questions:
Who is delivering engagement activities?
What types of activities are being delivered?
Which audiences are being targeted?
What types of messages are being communicated?
How accessible are messages and activities?
Where are the gaps in engagement?
Method
The research involved three strands:
A web search to identify public engagement activities.
Interviews with 10 experts representing a range of organisations involved in the heat transition.
An online survey of organisations delivering public engagement activity.
A brief overview of each strand is provided below, and a more detailed methodology can be found in Appendix A.
Web search
First, a web search was conducted using defined search parameters and search strings (see Appendix B) in May 2024. The web search included a traditional search using Google and Google Scholar, and Ipsos’s proprietary social media listening tool, Synthesio.[1]
Over 2,500 references to public engagement across social media channels were reviewed and, from those initial results, 62 instances of engagement matched the inclusion criteria and were included in the analysis. The results from the web search also informed the sample development for the expert interviews and online survey, and the design of the interview topic guide and questionnaire.
Expert interviews
Interviews were conducted with 10 organisations involved in the Scottish heat transition from 30 May to 7 Aug 2024 (identified via web search and recommendations from the Scottish Government and ClimateXChange). The profile of expert organisations included a mix of charities/advice services, climate hubs, private companies, non-government organisations and industry bodies.
This strand of the research explored the different types of public engagement activities currently being delivered in Scotland in more detail. A topic guide was developed by the Ipsos research team and reviewed by ClimateXChange and the Scottish Government (see Appendix C). Interviews also helped to identify potential organisations for inclusion in the online survey sample.
Online survey
The third strand of the research involved a five-minute online survey with organisations delivering public engagement activities in Scotland to explore the purpose and nature of these activities. The questions were designed by Ipsos and reviewed by ClimateXChange and the Scottish Government (see Appendix D).
An initial sample of 78 contacts was generated by Ipsos through the web search and interviews, and the survey link was also shared by ClimateXChange and the Scottish Government, through various email networks and communications channels, to broaden participation.
The survey was live for five weeks, from 19 June to 24 July 2024, and 34 completed responses were received. Of these, 25 organisations reported that they had delivered some form of public engagement in the last three years.
Analysis
The data generated from the web search, interviews and online survey was used to map the range of activities (including details such as the type of activity, who delivered it, when it happened, who it was aimed at, and the topics covered). More reflective themes relating to impact, challenges and possible gaps in engagement were drawn from online survey results and the interviews.
Scope and limitations
The web search identified a wide range of public engagement activities across Scotland over a number of years. However, this search was not exhaustive, as it was limited to what was available online, and provided varying levels of detail depending on what was published. Data collected from interviews with experts provided more in-depth and reflective insights from a range of perspectives, but on a much smaller range of activities than that of the web search. Meanwhile the online survey provided insights on activities across a wider range of activities, but not in as great a depth, as those gathered from the interviews.
Using multiple data sources has enabled a more comprehensive understanding of public engagement activity in Scotland than any one source would be able to provide. However, it is important to acknowledge that the research parameters may have overlooked some forms of public engagement (particularly those at a small community level or those not promoted online). Furthermore, not all perspectives on the heat transition (such as those of the intended target audiences) have been captured.
The online survey was an open link and responses were gathered anonymously. This means that the data may contain multiple responses from the same organisation and duplication of responses between the survey and web searches. Interviews were also conducted confidentially, and so their views have been reported anonymously. Any examples or organisations mentioned in the report are taken from publicly available information and it should not be assumed that they correlate with organisations taking part in either the depth interviews or online survey. Where more detailed case studies are provided (e.g. in relation to Impacts), these have been shared with the permission of the main delivery organisation responsible.
Lastly, online survey results are based on a small sample and so should be read and interpreted with this in mind. Where percentage figures don’t sum to 100, this is due to computer rounding. Where counts do not sum to the base, this is due to questions allowing multiple responses.
Public engagement on the heat transition
This chapter provides an overview of the types of public engagement that have taken place in Scotland between October 2021 and May 2024 and the organisations delivering them. It addresses the following research questions:
- Who is delivering current heat transition-related engagement activities and messaging in Scotland?
- What types of activities are being delivered?
This chapter also explores awareness of the Scottish Government’s Heat in Buildings Strategy among the organisations delivering public engagement.
- A wide range of organisations from across the public, private and charitable sectors, have been delivering public engagement activities on the heat transition in Scotland.
- The types of public engagement have also been varied, with the most common being advice services, workshops and information sharing online.
- Awareness of the HiBS is high among those delivering public engagement.
Who is delivering current heat transition-related engagement activities and messaging in Scotland?
The web search, survey and expert interviews identified a range of organisations delivering public engagement activities in relation to the heat transition since October 2021, including:
- Charities, such as One Parent Families Scotland, Age Scotland, Under One Roof, and Community Energy Scotland.
- Non-profit organisations and social enterprises, such as Nesta, Scarf and Energy Action Scotland.
- Community groups, such as climate hubs and local interest groups.
- Private sector organisations, such as UK energy companies.
- Advice and support bodies, such as Energy Savings Trust (who administer the Scottish Government’s Home Energy Scotland service).
- Collectives, consortiums, networks or member groups that include organisations representing a range of sectors (e.g. Built Environment-Smarter Transformation and the Poverty Alliance).
- Local authorities.
- Education and research institutes, such as the University of Strathclyde and the Energy Training Academy.
The Synthesio (social media listening) search provided an indication of the extent of activity and messaging from particular organisations, based on volume of online mentions (see Figure 1). This does not necessarily mean that these organisations have delivered more engagement, but rather reflects higher levels of posts on the heat transition by organisations directly or by other actors citing them.
Figure 1. Organisations delivering public engagement by volume of online mentions

What types of activities are being delivered?
The types of activities being delivered were broad, and included advice services, workshops and various types of information and knowledge sharing. The online survey data and Synthesio search provided a snapshot of this range (see Figure 2), which was also reflected in the interviews.
Figure 2. Types of public engagement activities

Among the most common types of public engagement activity were advice and support services, which have been delivered by a range of organisations (including non-profits, non-government bodies, charities and community groups). This was a broad category encompassing free impartial advice on energy saving measures and keeping homes warm, through to practical advice on installing renewable technologies and verifying providers of retrofitting work. A range of advice and support services were accessible online, in-person and via telephone.
Advice and support services example
Energy Saving Trust is an independent organisation supporting households and businesses towards decarbonisation, and is one of the Scottish Government’s main partners in addressing the climate emergency.
Their Green Homes Network connects those interested in low carbon heating with householders who have installed clean heating systems through a database. Households give permission to post case studies so others can find out about their journeys and contact them for further advice. Households may also be invited to speak at webinars or to the press about their conversion to a new heating system.
Workshops were delivered by a range of actors (including local authorities, charities, non-government organisations, social enterprises and community groups). Some were one-off events while others were run as a series of workshops. The aims of the workshops included: to generally increase knowledge and understanding around the Scottish Government’s heat policy, to help community groups and individuals reduce costs, and to inform individuals on the availability of grant funding for heat transition projects and energy efficiency improvements.
Workshop example
Transition Black Isle is a community group that aims to help Black Isle communities respond to the climate emergency and to encourage non-car travel, local food production and energy saving measures. The group organised a series of workshops in March 2022 on low carbon home heating which involved expert speakers and group discussions:
- Session 1 explored ways to make houses warmer and cheaper to heat without compromising air quality or risking damage to building fabric.
- Session 2 identified various low carbon methods of home heating and circumstances which suit each approach.
- Session 3 covered managing these changes, including financial support, choosing contractors and incorporated advice from those who had already been through the process.
Lectures and talks were delivered by organisations of all types. Some events were open to the public, either as stand-alone events or pop-ups as part of other events or festivals, and provided opportunities to learn about opportunities and risks in making properties more energy efficient. Others engaged industry professionals specifically and provided information on the Scottish Government’s energy policy, availability of funding, best practice for retrofitting schemes and challenges in heat pump deployment. There was also evidence of employee engagement, with organisations being invited to give talks to advise employees on ways to save energy at home.
Training and knowledge sharing were typically targeted at industry and policy makers. These took the form of panel discussions and events, as well as online networks/hubs to facilitate knowledge exchange and practical training modules on aspects of the heat transition.
Training and knowledge sharing example
HeatSource is a programme funded by Scottish Enterprise that aims to better equip companies involved in manufacturing, installation, training and the wider supply chain to deliver clean heating systems.
The programme seeks to support the decarbonisation of Scotland’s built environment through the creation of an online information hub to help industry maximise the opportunities around new zero carbon heating.
Various organisations have provided information online and delivered public information campaigns aimed at the general public, including:
-
- Get a Heat Pump – a website that provides information on what a heat pump is, how to get one installed and the associated costs (Nesta).
- Heat pump heroes – an annual awareness-raising campaign to promote conversion to heat pumps (Home Energy Scotland).
- Money-saving boiler challenge – a public-facing campaign which aimed to raise awareness about how to use energy more efficiently and save on bills (set in the context of the cost of living crisis) (Nesta).
Other public engagement activities included:
- Showcases, including live demonstrations and trial installations of heat pumps in different types of homes to gather user feedback.
- Consultations, typically delivered by community groups to gather responses to the Heat in Buildings (HiBs) proposal and the Scottish Local Heat and Energy Efficiency Strategies (LHEES).
- Advocacy work, such as speaking up for consumers who have had issues with clean heating systems (e.g. increased energy costs) and opinion pieces published in media outlets to raise awareness and tackle myths around the heat transition.
Awareness of Heat in Buildings Strategy
Among organisations that have delivered public engagement activity and responded to the online survey, the majority (88%) reported knowledge of the HiBS, of which just under two-thirds (64%) said they knew a fair amount or great deal about it. Just over one in ten (12%) had either heard of the strategy but knew nothing about it, or had never heard of it (see Figure 3).
Figure 3. Awareness of the HiB strategy among survey participants

Experts interviewed for the research also reported that their organisations had high levels of awareness and understanding of the HiBS. This was based on their existing relationships with the relevant policy teams in Scottish Government, involvement in the initial consultation process, and/or providing responses to it. Other ways in which experts mentioned becoming familiar with the strategy included through the introduction of new build heat standards and working with local authorities.
Target audiences and messaging
This chapter provides an overview of the types of public engagement that have taken place between October 2021 and May 2024 and the organisations delivering them. It addresses the following research questions:
- Who is the target audience of these activities?
- What types of messages are being communicated?
- How accessible are the activities being delivered?
- Activities were mostly open to the general public, however, there were some target groups identified (e.g. residents within a specific geographic area, homeowners, people in fuel poverty, low-income households and energy sector professionals).
- Messaging focused on home energy efficiency and reducing energy bills, rather than the adoption of clean heating systems, was felt to resonate more with wider audiences.
- Engagement on “simple fixes” (e.g. turning boiler temperature down) was therefore more widespread than practical messaging around bigger steps (e.g. installing a heat pump).
- Activities delivered through trusted messengers and existing local channels were felt to be more accessible forms of engagement. Tailoring messages to the specific target audience was also a key consideration.
- However, there was a clear distinction between intended target audiences and those actually being engaged, who typically were those who were already more climate aware in any case.
Who is the target audience of these activities and messaging?
Public engagement activities were mostly targeted at a broad, general public audience. Evidence gathered from the Synthesio search, interviews and survey showed that activities were often advertised as open to all, rather than targeting a specific demographic. This was driven by the understanding that there are high levels of concern about climate change among the general public (an assertion supported by public opinion research), and that the environmental impact of energy use affects everyone, which requires a wide reaching approach to engagement.
However, the research highlighted a clear distinction between audiences being targeted and audiences actually being engaged.
Intended target audiences
While most engagement activities were targeted at the general public, the research also found evidence of some activities targeted at specific groups, including local residents of a specific geographic area, people in fuel poverty and low-income households, homeowners, and energy sector professionals (see Figure 4).
However, it should be noted that delivery organisations responding to the online survey often mentioned targeting multiple different groups rather than one group in particular.
Figure 4. Target audiences (number of mentions by organisations delivering public engagement activities)

Public engagement at regional or local levels was found to be happening across Scotland, with most events concentrated in Edinburgh and Glasgow and a smaller number of activities being delivered in East Lothian, Falkirk, Perth and Kinross, Dundee, West of Scotland, Fife, Aberdeen and Aberdeenshire, and Highlands. There was some evidence of public engagement activities happening on the islands, highlighted by experts, however this was more limited (which could reflect the fact that engagement was more localised and less promoted online).
People in fuel poverty and low-income households were frequently identified as a key target group for engagement activities. However, evidence from the Synthesio search and from the interviews indicated that the primary focus of those activities was encouraging simple energy efficiency changes that would lead to lower energy bills rather than promoting a transition to clean heating systems.
There was also some evidence of engagement targeting energy sector professionals (e.g. through conferences, knowledge-sharing and training). However, there was a broad view among experts that this group had not been sufficiently engaged (see Gaps).
Audiences actually being engaged
While activities were advertised as open to all (with some targeting), experts observed that they tended to draw interest from those who were typically more climate aware, highly engaged on the topic of sustainable home energy solutions, and more involved in their community anyway. This is consistent with earlier research conducted for ClimateXChange which found that early adopters tend to have higher than average knowledge of, and interest in, climate change as well as time and willingness to research energy alternatives.
In line with this research, the demographic profile of those who experts perceived to be more engaged was described as homeowners over the age of 40 with disposable income. It was also suggested that men were more likely to be interested in installing low-carbon heating technology than women. Experts cited lower attendance rates among other groups as a particular challenge to widening reach (see challenges).
What types of messages are being communicated?
Messaging around the heat transition mainly focused on energy efficiency rather than the adoption of clean heating systems, according to both the survey (see Figure 5) and Synthesio findings.
The focus on energy efficiency measures was seen to be driven by the cost of living crisis and rising energy prices. Experts highlighted energy efficiencies and reducing energy bills as messaging that had resonated most with the public and led to greater engagement. Some examples of this type of messaging included:
- “Warmer Homes, Cheaper Bills, Greener Lives” (an event organised by Sustaining Musselburgh and advertised on Eventbrite).
- “How to save cash with a single change to your boiler settings” (from Nesta’s Money-saving boiler challenge).
- “To help you lower your energy bills and have more energy efficient homes, whilst also reducing your carbon footprint” (from Thurso Community Development Trust’s home energy advice webpage).
Organisations that had delivered engagement activities with more of a focus on retrofit and the installation of heat pumps reported using the benefit of cheaper bills as a “pitch” to increase engagement among the wider public. This type of messaging was considered to resonate more with the public than messaging around heating systems.
There was also a perception among experts that the public have a limited understanding of their current heating systems. Experts felt that this, coupled with existing financial pressures, was contributing to a lack of curiosity about installing greener alternative systems. As highlighted in the examples above, some delivery organisations have focused on smaller, easier steps to address this and encourage engagement.
Organisations reported that they had found messaging focused on easy steps and “simple fixes”, such as turning down the flow temperature of a boiler, to be more effective than discussions around new heating systems. This reflects other recent research findings on heat transition communication, which suggested that messaging should be breaking down behaviour into small steps. Experts also felt that ensuring a basic understanding of how existing heating solutions affect bills would be an essential first step to engaging households about further decarbonisation measures beyond energy efficiency.
The web search and online survey found more limited evidence of practical messaging around bigger steps such as how to install and operate clean heating systems like a heat pump. Experts felt that this type of messaging was primarily engaging people who were already motivated to change their heating system.
How accessible are messages and activities being delivered?
Delivering engagement through trusted messengers was highlighted by experts as one of the more effective approaches in terms of accessibility. For example, engaging the public through existing community networks was a way in which some organisations had engaged hard-to-reach demographics, such as older people, people in poverty and vulnerable groups.
“That type of engagement [with vulnerable demographics] has to come from local trusted messengers – it’s about building that relationship. It’s not going to come from anywhere else for the most vulnerable. I think that is where there’s a role for community organisations to play.”
Climate Hub (interview)
Experts also highlighted local community events that are already well-attended by local residents as an effective way of promoting transition messaging to the broader public and extending the reach of engagement beyond the climate aware audiences. For example, one organisation had delivered entertainment for children at family-friendly local events to engage parents.
Synthesio search findings suggest that most activities had been held either online or in hybrid form and experts felt that this had promoted greater accessibility across Scotland. Social media was also used as a method of advertising and delivering engagement, particularly to reach younger demographics more effectively. Nevertheless, while the value of online activity for promoting wider reach was acknowledged, face-to-face engagement was still widely considered by experts to be the most effective.
Among the activities delivered, there was also evidence of public awareness campaigns utilising TV and printed media to reach a broad audience, including Nesta’s “Money Saving Boiler Challenge”, Citizens Advice Scotland’s “Big Energy Saving Winter” and Smart Energy GB’s “Smart Energy Heroes”. According to experts, wider public campaigns (in combination with simple and accessible messaging) have been most accessible for members of the public not already aware of, or engaged on, energy and climate issues.
Delivery organisations also reported the use of simple and clear messages to improve the accessibility of their public engagement activities. Experts felt that emphasising the energy efficient changes that individuals could easily adopt in their homes and outlining the financial benefits of making them was most effective in improving understanding of the impact of heating systems on the climate. In particular, the importance of clearly presenting the financial case for change was highlighted, recognising the challenges people face currently with their energy bills.
“The challenge is making sure the information is really simple and easy to access and reflects the fact that people are in crisis at the time – just transition terminology, for example, doesn’t work.”
Charity (interview)
Using informal (“chatty”) language in communication with the wider public on energy advice was felt to have promoted both accessibility and trust. The importance of positive, hopeful and uplifting rhetoric was highlighted, such as an emphasis on the short-term benefits (e.g. immediate decrease in energy bills). This was seen as particularly effective for effectively reaching low-income households and those in fuel poverty.
“The scale of the transition is immense and the potential opposition to some of what’s needed is also significant, so there’s a need to make sure that there are as many positive and supportive voices as possible to counter the noisy negativity.” Charitable organisation (interview)
Experts also emphasised the importance of tailoring messages to the specific target audience as a way to improve accessibility and understanding of information. For example, one expert described how their organisation changed the focus and language of any transition-focused activity depending on who they were aiming to reach. When speaking to tenants, they would highlight the links between climate change and heating and assert the case for the need for transition, while when addressing flat owners, they would discuss the specific challenges this group faces and focus on heat networks rather than heat pumps as a solution.
Some experts reported offering advice and information services in different languages and providing materials accessible to people with different reading abilities. However, among those delivering engagement, evidence of organisations making these accessibility considerations was limited.
Despite these considerations for delivering accessible engagement, our interviews identified accessibility as a challenge. This related primarily to the complexity of the topic and the highly technical language of certain aspects of the heat transition which was widely considered to be inaccessible and, therefore, limiting the reach of engagement beyond those who are already engaged on climate issues. Some examples that were recognised as particularly difficult for the wider public to understand included EPC ratings and the practicalities of choosing and installing clean heating systems. This is discussed in more detail in the following chapter.
Reflections on the effectiveness of public engagement
This chapter reflects on the perceived impact of public engagement activity and the challenges that delivery organisations have experienced, before summarising any future public engagement being considered or planned by delivery organisations who participated in this research.
Key findings
Impacts
- Simple messaging that focuses on easy energy efficiency actions and outlines financial benefits were felt to be the most effective forms of public engagement, building trust through the use of trusted messengers.
- Building trust with the audience was identified as one of the most important aspects of delivering successful engagement. Community-level engagement was seen as an effective way to foster that trust and reach hard-to-reach groups.
Challenges
- Lack of regulatory clarity on clean heat and energy efficiency was identified as the main barrier to delivering effective engagement.
- Misconceptions and lack of public awareness around sustainable heating solutions was also seen as a challenge.
- The cost of living crisis was recognised as a barrier to widening the reach of engagement. In this context, the general public was seen as unwilling to accept the upfront cost of transitioning.
- Certain aspects of the transition, such as installation of clean heating systems, were not seen to have been successfully communicated to the wider public due to topic complexity and specialised language that is not widely understood.
Impacts
Those delivering public engagement largely felt that their activities had had a positive impact on people’s understanding of issues relating to the heat transition in Scotland (see Figure 5). Among those taking part in the online survey, 89% reported that their audience’s understanding of the topic had improved as a result of engagement. There was less certainty over the extent to which public engagement had led to action, with fewer than half of organisations (44%) reporting that those activities had led to action and 26% reporting that individuals had decided to switch to a clean heating system as a result of the engagement.
Figure 5. Perceptions of impact 
Both the interviews and the Synthesio search also identified a number of impactful initiatives centred around simple energy efficiency actions that organisations felt had been effective at reaching the broader public and prompting people to action small changes, often framed around saving money as well as reducing carbon emissions (see Figure 6).
“The stuff that lands better with people, unsurprisingly, is – there’s a pretty quick fix that you can organise yourself and it saves you money.” Charity (interview)
Community-driven engagement was also highlighted by sector experts as a success factor in terms of reaching certain demographic groups, such as older people, families in in-work and fuel poverty and vulnerable groups (see figure 6). This was felt to be important because of the perception that community organisations enjoy high levels of trust from members of the community. Building trust was identified as one of the most important aspects of delivering effective engagement.
Figure 6. Evidence of impact
Money Saving Boiler Challenge Campaign
The campaign was delivered by Nesta, in partnership with energy providers and other organisations in the energy industry, which focused on providing basic and simple energy efficiency advice. The activity aimed to reach the general public and convince people to turn down flow temperature on their boiler, thus reducing carbon emissions and energy costs.
The campaign also aimed to promote better understanding of existing heating systems and their environmental impact among the general public. This activity was part of a wider campaign on decarbonisation.
Following the campaign, close to 240,000 households turned their boiler flow temperature down, resulting in savings of £112 per year for an average household and a reduction of carbon emissions by 37,000 tonnes.[2]
Success factors:
- Simple and straightforward messaging that resonated with people in the context of the cost of living crisis.
- Promoted small and easy changes.
- Partnership with trusted voices – public-facing organisations offering energy advice and energy providers.
- Clearly communicated individual financial benefits of making the changes.
- A wide public campaign that was advertised on TV and mainstream media.
Home Energy Advice Portal
The web portal was developed by Thurso Community Development Trust together with the Highlands and Islands Climate Hub.[3] The website aims to improve pathways to support and uptake of grants by providing energy advice and a comprehensive overview of the energy support services available to residents in Scotland. The portal is accessible to all but is aimed primarily at local community organisations. It provides training to staff and volunteers in offering energy advice, recognise struggling households most in need of energy support, how to approach them and signpost residents to local energy service providers and financial support.
As of May 2024, 435 community groups in the region had been trained on the portal, which has led to improved knowledge and confidence among staff on the topic of energy. The portal has been actively used, with an average of 3,000 hits per month and approximately 5,000 people supported through it to date. It has also reached some hard-to-reach and vulnerable groups, including older people and low-income families.
Success factors:
- Clear and accessible messaging.
- Community-based engagement.
- Use of trusted voices in the community.
Challenges
The research identified a range of challenges in delivering engagement that were perceived to have negatively impacted attendance rates and limited overall effectiveness.
A perceived lack of clarity around clean heat and energy efficiency regulations was one of the key challenges identified in the interviews. There was a shared sense that public engagement activities would be limited in their effectiveness until the legislative requirements are known. Experts felt there had been frequent changes in proposed legislation in the past and that there is currently a lack of clarity around the requirements for properties, which has created confusion among some groups and limited the reach and effectiveness of some engagement activities. Landlords in particular were identified as a group at risk of disengaging on the topic until there is clarity on what they will be required to do. The perceived frequency of changes in proposals was felt to have made it difficult for organisations to deliver effective public engagement because they feel they are unable to provide straightforward advice.
“Until there’s clarity on what the requirements are going to be, it’s difficult to go out there with firm messaging. You always have to caveat your messaging with “it’s just a proposal and it might change.”
Private company (interview)
It was also suggested in the interviews that the concern over further changes in requirements has caused hesitation among organisations to engage with the public until the legislation is finalised.
“[When] things can still change, that’s a disincentive to people actually doing works in their properties. Because they don’t know if the money they’re going to spend and the improvements they’re going to make are going to be beneficial when it comes to complying with possible future standards because we still don’t know what those possible future standards are going to be.” Private company (interview)
Representatives of the homebuilding sector highlighted that while homebuilders “are ready, understand and are committed to what needs done in supporting the transition”, there are concerns within the sector regarding limited communication from the Scottish Government about availability of the technology required to support the transition.
At the same time, interviewees stressed that there are still misconceptions, misinformation and lack of public awareness around sustainable heating solutions. It was suggested that the general public is still widely uninformed about the costs associated with the transition and whether low-carbon technology would be an effective heating solution for their home. Moreover, some stakeholders suggested that there is confusion around the different regulations in England and Scotland.
“…There’re still too many barriers to retrofitting – heat pumps are still considered pretty unusual and there’s a lot of myths, misinformation and misconceptions around how effective low-carbon tech is, which highlights the need for the public engagement strategy.” Membership organisation (interview)
The wider socio-economic context of the cost of living crisis was highlighted by experts as the key structural barrier to engaging the general public in the conversation about the heat transition and decarbonisation, particularly given the upfront costs of retrofitting and installing clean heating systems. They felt that, for most people, the kinds of interventions that will be required for the transition would be unaffordable.
“There is certainly a general gap in terms of people wanting to decarbonise their homes because of cost.” Private company (interview)
It was suggested that the public would be largely unprepared and unwilling to accept the cost of transitioning upfront based on a promise of future energy savings.
“We’re considering how we can get that messaging out to the public to make the public aware of the changes that will be required of them – yes, it might cost them more upfront but it should create longer- term benefits – but I don’t think the public is ready to make that connection yet and I don’t think any government messaging that I’ve seen to date has been explicit about that.” Private company (interview)
The complexity of the changes required and language accessibility around those changes was also identified by experts as a significant challenge. It was suggested that the language around the heat transition (e.g. clean heating systems) is specialised and requires a certain level of knowledge on the subject. It was therefore felt to be less accessible to people who don’t already have awareness on the topic.
“The challenge is making sure the information is really simple and easy to access and reflects the fact people are in crisis at the time – just transition terminology, for example, doesn’t work.” Statutory body (interview)
Despite attempts by organisations delivering engagement to address this challenge, such as by delivering energy advice through simple messaging, it was felt that other aspects of the transition such as installation of new heating systems have not been successfully communicated in a way that can be more widely understood. One expert, reflecting on their own experience installing a clean heating system, commented that even they found it difficult to navigate existing advice despite being highly engaged and knowledgeable on the topic.
“The challenge is that we were asking people to do the absolute low-hanging fruit thing in terms of decarbonisation of heating. So, it’s not as simple to take that framing – do this simple thing and save money – to almost any other part of the heat transition. The rest of the message is much harder.” Charity (interview)
Notwithstanding these challenges, over half of organisations who completed the survey (59%) and several of the interviewees said their organisations planned to deliver public engagement activities on the heat transition in Scotland in the future. These were mainly charities, but also included a range of other organisation types mentioned in Chapter 3. The types of activities planned included a continuation of existing advice and support services and information sharing campaigns, as well as further workshops or knowledge sharing events and new pilot schemes (such as for retrofitting).
Delivery organisations mentioned that these future activities would be open to all, but some specific target groups included homeowners, the social rented sector (landlords and tenants), those in fuel poverty, those living in flats, people with protected characteristics, and small businesses. It was felt that schemes like the Green Homes Network and Heat Pump Heroes should be promoted more widely to encourage further uptake of clean heating systems.
However, there was also reluctance among delivery organisations to carry out further public engagement until more is known about Scottish Government policy on the heat transition and the specific requirements needed for the different target groups.
“It is not worth individuals investing in bespoke renewables or low carbon heating systems. We need to know more about when the heat networks will be coming.” Charity (online survey)
Overall, while public engagement efforts have made good progress in raising awareness of the heat transition, substantial challenges remain in translating understanding into widespread action.
Gaps in public engagement
This chapter addresses the final research question: where are the gaps in engagement?
While the research has identified a range of different engagement activities that are reaching the broader public as well as targeted demographic groups, it has also identified some clear gaps in engagement. The identified gaps broadly relate to target audiences and messaging, but also relate to potential messengers (i.e. those who could have a role in supporting public engagement on the heat transition).
Key findings
- Audiences identified as having been under-engaged on the heat transition included private landlords, renters, professionals in the energy sector, young people and the digitally excluded.
- The key messaging gaps in public engagement include addressing the general lack of understanding among the public about current heating systems, as well as insufficient practical and transparent advice on installing and operating clean heating systems.
- Using existing case studies was also felt to be lacking, but could provide an opportunity to show how the technologies have been implemented in Scotland and elsewhere.
- A general lack of trusted messengers providing reliable and impartial advice was also identified, as well as those able to provide technical support on the practical aspects of the transition.
Target audience
Delivery organisations responding to the online survey felt that most groups of people would benefit from support or information on the heat transition in Scotland, with young people being a notable exception (Figure 7). Experts interviewed suggested that, although public engagement activities have largely been open to all because the transition is seen as an issue that will affect everyone, there were some groups who should be prioritised. The top four groups who would benefit from more information on the topic, as identified in the survey, were people in fuel poverty, homeowners, low-income households and landlords (see Figure 7).
Figure 7. Groups who would benefit from support

As highlighted in the previous chapter, experts suggested that there had been limited engagement with private landlords. This was reflected in the survey results too, with 77% of participants highlighting landlords as one of the groups who would benefit from support or information on the heat transition. This was seen as an important gap to address, since private landlords are expected to play an essential role in driving the heat transition forward and to be directly affected by the upcoming regulations around clean heat and energy efficiency under the current HiBS.
Experts perceived that the benefits of making the transition were not clear to landlords who would be bearing the costs of retrofit, leading to a reluctance to engage on the subject. Stakeholders who had conducted activities aimed at this group said that engaging with them had proven particularly difficult because of the sector’s resistance to being regulated, with both individual landlords (and some organisations representing them) pushing back and advocating against the legislation.
However, it was also acknowledged that responses to the HiBS have varied across this group. Some landlords, particularly the more climate conscious, were described as “very keen” to make sustainable improvements, but it was felt that a lack of clear and consistent information on the extent of upcoming regulations has held them back from taking action.
“It’s such a shame because people will phone us up – they have the money and the inclination to do the work and I have to tell them – actually, you’re better off not doing the work and spending the money just now because we don’t know what the requirements are going to be.”
Membership organisation (interview)
Lack of information and means to take action were felt to be even more of an issue in relation to renters. Out of all 62 public engagement activities identified through the Synthesio search, only two were targeted directly at tenants. Moreover, 66% of survey participants believed that private renters would benefit from more advice on the heat transition and 63% said the same in relation to social housing renters. Experts interviewed for this research felt that renters have been widely disengaged from the topic because they feel very limited in their power to make any changes in a rented home and the resources advising them are sparse. Moreover, it was suggested that renters were largely apprehensive about discussing the transition with their landlords due to concerns about losing housing in a competitive rental market.
“Those in rented accommodation often don’t know who to turn to – you may know that certain property standards exist but are not necessarily able to enforce them. In a rental market where renters are under pressure and aware that there is competition to rent, it doesn’t encourage you to speak to your landlord about these additional measures, for fear of losing housing.” Charity (interview)
Experts therefore perceived that those renting from private landlords would benefit from more sources offering practical advice on what changes they can make and how to discuss these with their landlords. In relation to social housing tenants, experts suggested that messaging should focus on building a stronger case for the need for transition. They felt that it was important to ensure that social housing tenants understood why retrofitting works were being carried out in their homes and what the benefits would be, and that they did not feel like the changes were being imposed on them. This echoes findings from the 2024 research on social housing decarbonisation conducted for ClimateXChange which highlighted the importance of tenant engagement and agreement prior to conducting decarbonisation works.
Limited engagement with professionals working in the energy sector was highlighted as a substantial gap in engagement on the heat transition. The Synthesio search and expert interviews identified some activities targeted at industry professionals being delivered, including professional conferences, training and workshops. However, it was widely felt by experts that this group has not been sufficiently engaged.
Industry-level engagement was described as a missed opportunity by experts who considered industry professionals and energy service providers as trusted messengers. It was felt they could provide technical and tailored advice to the public to mitigate the challenge highlighted earlier of poor understanding of clean heat technologies (see Challenges).
Beyond being a potential engagement opportunity, this gap was also seen by some experts as a risk; for example, if heat engineers do not understand clean heating systems themselves, they may provide incorrect advice to consumers. A comprehensive nationwide effort was deemed necessary to address the gap, and a particular focus on addressing any training or skills gap in rural areas.
Across the interviews, there is a widely shared sentiment that young people were one of the groups who have been least engaged on the heat transition. Experts suggested this related to the cost of living and the availability of affordable housing being more prevalent and pressing challenges for this group. It was also partly explained by young people in the rented market having limited agency to make any energy saving changes to their homes (with that responsibility resting upon the landlord) and therefore considering the heat transition as having limited personal relevance.
“Young people are not thinking about how they heat a home because they’re just trying to find a home in the first place. […] There’re so many issues in terms of housing for young people – particularly, if they are in the rented sector, they usually have no control over how that home may be heated.” Climate Hub (interview)
Despite these reflections expressed during the interviews, survey findings suggest that organisations involved in delivering engagement did not consider young people as a group that would benefit from more advice on the heat transition, with no participants identifying this as a priority group.
While it was felt that activities being delivered online have enabled broader participation (see Accessibility), it was also acknowledged by experts that those who are digitally excluded are potentially being left out of the conversation. Although organisations such as Scarf and HES do provide multimodal advice (via telephone, in-person, or online), these are often promoted online which experts felt could be limiting reach.
Messaging
One of the main perceived messaging gaps was addressing the lack of understanding among the general public about their existing heating systems. It was felt that this lack of awareness could act as an obstacle to the success of the longer-term strategy for decarbonisation, as people are unlikely to take action on changing their boiler to a different heating system if they do not fully understand the current one. Experts highlighted that energy efficiency advice promoting better understanding of how heating systems work and their impact on the climate should be a pre-requisite for any required action on the transition.
Interviewees also widely felt across interview that insufficient practical advice had been offered to the wider public around how to install and operate clean heating systems. This gap was closely linked to the limited engagement with the energy sector professionals who are seen as the key actors who would be able to offer such advice. Experts contrasted the availability of sources offering grant and funding support – which was felt to be plentiful – with the lack of reliable sources offering tailored practical advice.
“If you’ve got a property and you have absolutely no idea whether it has a wall that can be insulated, there are few sources that you can go to for advice – some of them are great and some of them aren’t so great. So, it’s very difficult when it comes to actually making changes.” Membership organisation (interview)
It was also stressed by some experts that there needs to be transparency in the practical advice about the things that can go wrong and any potential risks around the transition to ensure that consumers are making an informed choice and are equipped with the practical knowledge of what to do if issues arise. For example, some experts reported engaging with members of the public who had transitioned to clean heating systems and had experienced issues such as an increase in energy bills but did not know how to deal with those issues and could not find information about them. It was suggested that the lack of transparency around potential risks, coupled with negative experiences such as these, could limit progress on the heat transition.
“Once something has been installed, people need to be clearly shown how to use this system and that they’re not left with something that they don’t know how to work. […] we risk putting people into more expensive systems when they’ve been told they’ll be able to save money […] We’re sitting on quite a lot of evidence around where things aren’t working particularly well or where they can act against the just transition, e.g. increasing costs.” Statutory body (interview)
However, experts also emphasised the importance of demonstrating the efficacy of these heating systems, by showing how they have been implemented in homes across Scotland and in other countries. It was also felt that the experiences of those adopting low-carbon heating technologies could be amplified. By drawing on and learning from real-life experiences, whether positive or negative, it was felt that this could help to build trust in the systems and encourage more widespread uptake over time.
One expert also suggested that public engagement on the heat transition should focus more on heat networks. This was felt to be lacking in current discussions but a likely solution for lots of people, particularly those living in flats.
Messengers
When it comes to those delivering engagement and communicating these messages, despite sharing some examples of engagement activities delivered through trusted messengers, experts shared a view that there is a general lack of impartial and reliable sources offering tailored practical advice on managing clean heating systems. This was seen as significant given the importance of building trust in, and understanding of, clean heating systems for effective engagement (see Section 5.2).
Experts defined trusted messengers in different ways. Some considered private energy providers and installers of clean heating systems to be trusted voices given their technical expertise on the matter and consumer-facing branding. Others felt that local community organisations trained in providing energy advice should play that role as they are embedded in communities already and seen as trusted sources.
Another suggestion was that there should be a separate group of messengers who are impartial (i.e. not private contractors) and able to provide technical and tailored advice to people depending on their property, location, and circumstances. This group was seen as a missing link in the process which could help connect people with verified installers.
“If someone approached us asking if we could recommend someone they could speak to about insulating their property, I honestly don’t know where the best place for them to go to would be. It would be nice if somebody could tell us where we can signpost them to. You don’t necessarily want a contractor, you want someone who could give you independent advice on what you best options are, what the likely cost would be and ideally signpost you to some reliable contractors. It feels like there is a missing stage in the process.” Membership organisation (interview)
Reflecting on the gaps in audiences, messages, and messengers, there was a dominant perspective that more needed to be done to drive effective public communication and engagement activity on the heat transition in Scotland. One expert suggested that they would benefit from more guidance and insight into the effectiveness of the Scottish Government’s own engagement on the topic, as this would help organisations when developing their own engagement strategies.
Conclusions
This research has identified several considerations for ensuring future public engagement on the heat transition builds on what has be done before and is effective in prompting action.
Prioritising groups
Delivery organisations felt that public engagement activities should be open to all on the basis that the heat transition will affect everyone some way. However, certain priority groups were identified, including:
- The private rented sector, as landlords will be expected to play an essential role in driving the heat transition forward under the current HiBs proposals, which would require landlords to make energy efficiency improvements by 2028, and tenants will be affected by the changes.
- Professionals in the energy sector, including energy providers and engineers who can be trained in clean heating systems, amplifying messaging around the transition, and providing tailored technical advice to households.
- Those who are digitally excluded, who may not be accessing the full range of engagement activities given so much of it is being promoted online.
It was suggested that there should first be a focus on engaging professionals in the energy sector (e.g. providers and engineers) and housing sector (e.g. landlords and housing associations). This was based on the view that they represent groups who have been under-engaged but who will be key to driving the transition forward. It was also felt that engagement with industry professionals first would present an opportunity to harness their influence among wider groups, to encourage action by sharing information and practical advice, and helping to tackle the spread of misinformation.
With the support of these sectors, focus should then be given to engaging the general public. There was a view among experts that focusing on early adopters first could help to encourage action among other more hesitant groups by building up a larger body of evidence of successful examples across different types of properties. This was seen as key to building trust in the efficacy of clean heating systems.
Tailoring messages
For engaging with industry professionals, it was felt that messages should provide clarity on the changes required and reassurance on the support available, as well as addressing any issues or hesitations that might be prevalent among these groups. An in-person approach to engagement with this group was considered necessary for this, to ensure any barriers are addressed directly.
For engaging the general public it was recognised that framing activities around the climate benefits would engage those who are already highly motivated by the climate crisis and more likely to be early adopters. It was felt that making it easier for them to take action (with clear and consistent messaging and practical advice) would in turn make it even easier for those less motivated by the climate crisis to take action as they could benefit from the experiences and knowledge of those who have already done it.
Highlighting the financial benefits and availability of grants and loans was identified as a key message that could be amplified more. This was seen to be particularly important for engaging members of the public for whom the upfront costs would be off-putting or those who are struggling with their energy bills already.
It was also felt that messages should be tailored, based on an understanding that different solutions will be needed for different groups and that the benefits/challenges associated will also be different depending on people’s circumstances (e.g. for those in houses compared to those in flats, and for those living in urban areas compared to those living in rural areas).
Overall, experts were in favour of more national-level campaigning – coordinated between the Scottish Government and key stakeholders – to raise awareness around the HiBs proposal and emphasise positive messaging around the heat transition. It was also felt that this would need to be supported by local-level public engagement that is tailored to, and addresses, the needs of different groups.
Building trust
There was a broad sense that any public engagement activity on the heat transition needs to first build a baseline understanding of heating systems, before engaging on transitioning between current and future systems. It was felt that priority should be given to improving basic understanding among general public about how boilers operate and start with simple changes they can make their homes more energy efficient.
Building on this, it was felt that public engagement should emphasise the needs and benefits of the transition to clean heating systems. At the same time, the importance of transparency in communicating the potential risks was also highlighted. Ensuring the availability of practical advice on how to navigate these risks and deal with challenges (particularly around installation and unforeseen costs), was felt to be missing from engagement currently.
Using trusted messengers – whether organisations already embedded in communities, those with technical knowledge (e.g. industry professionals), or a new group of independent advisers from a range of backgrounds – was seen as an effective vehicle for communicating these aspects of the transition. Experts interpreted trusted messengers in a range of ways, and further research would be beneficial to determine who the public would trust to deliver messages.
Regulatory clarity
Organisations delivering public engagement reported feeling limited in what they can deliver until it is clearer when the regulations will come into force, and what the regulations will include (i.e. the changes that people will be required to make in relation to clean heat and energy efficiency). There was a general understanding of the direction of travel, but it was felt that a lack of detailed information was limiting the effectiveness of communication and engagement on the heat transition in Scotland.
Regulatory clarity was therefore widely called for, although it was recognised that this would be difficult to provide until the legislation is finalised. Nevertheless, it was strongly suggested that regulatory and financial decisions need to be made first. Organisations delivering public engagement activities felt they needed clarity on what the regulations will be, when they will come into force, and what financial support will be available, so that they can be equipped to support their members, service users and the general public through the transition.
Appendices
Appendix A – detailed methodology
The research involved three strands:
- A web search to identify public engagement activities.
- Interviews with 10 experts representing a range of organisations involved in the heat transition.
- An online survey of organisations delivering public engagement activity.
Web search
The web search was initially conducted using a traditional online search method, whereby “Boolean search strings” were used in Google and Google Scholar. Search strings were created beforehand and then refined throughout the search process where necessary, to improve the relevance of results (see Appendix B for the full list of search strings used).
Ultimately, the traditional online search results were limited, and the majority of public engagement examples analysed were identified through using Ipsos’ proprietary social listening software, Synthesio. The software works by identifying mentions of specified terms (in a similar way as search strings) across the web, including platforms such as X (formerly Twitter), Facebook, YouTube, Instagram and Facebook.
The initial Synthesio search (using the search string listed in Appendix B) produced around 2,500 references to public engagement across these social media channels, which were reviewed by the research team. Through search refinement using key word filtering and further manual review, most mentions were ultimately excluded due to duplication or being out of scope.
An analysis of 62 instances of engagement that matched the inclusion criteria (as specified below). Details of these engagement examples were recorded in a mapping spreadsheet in Excel, by the research team. Examples from a previous, brief web search by the Scottish Government that did not appear in Ipsos’ web search were also included in the spreadsheet, along with a very small number of activities that Ipsos were already aware of.
Expert interviews
A longlist of potential organisations was generated by Ipsos following an initial web search and initial recommendations from the Scottish Government and ClimateXChange, and was reviewed by ClimateXChange and the Scottish Government. Organisations were selected on the basis that they could comment on public engagement on the heat transition (either from direct delivery experience or from involvement on the heat transition in other ways) and that they represented a range of perspectives. Experts were invited to take part via email and the profile of expert organisations included a mix of charities/advice services, climate hubs,[4] private companies, non-government organisations and industry bodies.
This strand of the research explored the different types of public engagement activities in more detail. A topic guide was developed by the Ipsos research team and reviewed by ClimateXChange and the Scottish Government (see Appendix C). Interviews lasted around 45 minutes each, and covered public engagement activities/communications recently delivered or known about, target audiences, perceived impact of engagement, any future activities planned, and views on current gaps in engagement.
Interviews also helped to identify potential organisations for inclusion in the online survey sample. Interviews were originally planned to be completed before the online survey fieldwork began. However, the decision was made to hold four interviews back until the online survey was underway. This decision was partly practical to be flexible around participants’ availability, but also to allow for survey responses to inform discussions and identify potential organisations to interview for a broader range of perspectives.
Online survey
The third strand of the research involved a five-minute online survey with organisations delivering public engagement activities in Scotland to explore the purpose and nature of these activities (e.g. key topics, target audience and impact). The questions were designed by Ipsos and reviewed by ClimateXChange and the Scottish Government (see Appendix D).
An initial sample of 78 contacts was generated by Ipsos through the web search and interviews, and the survey link was also shared by ClimateXChange and the Scottish Government through various email networks and communications channels, such as X (formerly Twitter) and the CXC newsletter, to broaden participation.
Two reminder emails were sent to the sample during the fieldwork period to boost response rates. The survey was live for five weeks, from 19 June to 24 July, and 34 completed responses were received. Of these, 25 organisations reported that they had delivered some form of public engagement in the last three years.
Appendix B – overview of web search
Web search strings
The following strings were placed into Google or Google Scholar:
- ‘Public engagement’ AND ‘Scotland’ AND [heat transition/ heat decarbonisation/ clean heating/ energy efficiency/ net zero heating/ green heating/ zero emission heating/ zero direct emission heating/ fabric first] OR
- ‘Public participation’ AND ‘Scotland’ AND [heat transition/ heat decarbonisation/ clean heating/ energy efficiency/ net zero heating/ green heating/ zero emission heating/ zero direct emission heating/ fabric first] OR
- ‘Deliberative/deliberation’ AND ‘Scotland’ AND [heat transition/ heat decarbonisation/ clean heating/ energy efficiency/ net zero heating/ green heating/ zero emission heating/ zero direct emission heating/ fabric first] OR
- ‘Public consultation’ AND ‘Scotland’ AND [heat transition/ heat decarbonisation/ clean heating/ energy efficiency/ net zero heating/ green heating/ zero emission heating/ zero direct emission heating/ fabric first] OR
- ‘Public dialogue’ AND ‘Scotland’ AND [heat transition/ heat decarbonisation/ clean heating/ energy efficiency/ net zero heating/ green heating/ zero emission heating/ zero direct emission heating/ fabric first] OR
- ‘Citizen engagement’ AND ‘Scotland’ AND [heat transition/ heat decarbonisation/ clean heating/ energy efficiency/ net zero heating/ green heating/ zero emission heating/ zero direct emission heating/ fabric first] OR
The following string was placed into Synthesio
(Scotland OR Edinburgh OR Glasgow OR Aberdeen OR Aberdeenshire OR Dundee OR Inverness OR Isles OR Isle OR Ayrshire OR Arran OR Islands OR Lothian OR Fife OR Highlands OR Perth OR “Outer Hebrides” OR Shetland OR Orkney OR Stirling OR Angus OR Dumfries OR Galloway OR Argyll) NEAR/5 (advice* OR consultation* OR discussion* OR event* OR conference* OR talk* OR “public service” OR report* OR session* OR lecture* OR conversation* OR public OR forum* OR seminar* OR workshop* OR outreach OR community OR engagement OR dialogue OR meeting* OR briefing* OR presentation* OR program* OR survey* OR roadshow* OR “public outreach”)) AND (“heat transition” OR “heat decarbonisation” OR “clean heating” OR “energy efficiency” OR “net zero heating” OR “green heating” OR “zero emission heating” OR “zero direct emission heating” OR “fabric first” OR “#EnergyEfficiency”)
Parameters
Across both searches, the following inclusion criteria were used:
- Topic: Public engagement related to heat transition/ energy efficiency. The research team included public engagement that is wider than just the Heat in Buildings agenda, but focused on engagement that is exclusively focused on the heat transition. (The relative focus on the heat transition in general climate change engagement was also mapped where relevant).
- Date: From October 2021 onwards (introduction of the Heat in Buildings Strategy in Scotland). This was reviewed during initial stages of searching and was deemed to be appropriate based on the volume of material available. The final eligible date for inclusion was 20th May 2024, corresponding with when the web review strand of the research ended.
- Methodology: “For the purposes of this research, “Public engagement” was understood as including various forms (e.g. public participation, public consultation, public dialogue) and methods.
- Geographical coverage: Scotland.
- Level: National- and potentially regional-level public engagement was initially prioritised for this project, rather than community-level. However, much of the engagement examples identified were at the more local, community-level and so relevant examples of these were also reviewed and included in the mapping.
- Language: English language (it was agreed that the research team would also record any search results in Gaelic, but this was not called for).
Appendix C – Topic guide for expert interviews
Introduction (3 mins)
Ipsos has been commissioned by ClimateXChange and the Scottish Government to conduct research into public engagement on the heat transition in Scotland.
As part of the research, we are conducting interviews with organisations across Scotland who have carried out, been involved in, or have a good awareness of, engagement activities with the public on the heat transition. This includes engagement on topics like clean heating and energy efficiency, low carbon technology and zero direct emissions heating systems. These interviews will help us obtain a fuller understanding about the types of activities that have been carried out so far.
The research will inform the delivery of the Scottish Government’s Heat in Buildings Public Engagement Strategy.
The interview should last about 45 minutes and everything you say will be treated in the strictest confidence. No identifying information about individuals will be included in the report, for example, if we would like to quote you, we will do it anonymously. ClimateXChange and the Scottish Government will not receive notes from individual interviews or attributable comments.
Participation is voluntary and you can change your mind at any time, up until the report is published.
- We would like to record the discussion for analysis purposes. It will not be provided to anyone outside of the Ipsos research team. The recordings will be securely stored and will be destroyed three months after we have completed the evaluation.
Do I have your permission to record?
Turn on the recorder and record consent to take part and for the discussion to be recorded.
Do you have any questions before we begin? Are you happy to proceed?
Background (3-5 mins)
To start with, can you tell me a bit about yourself and your role at [organisation].
What, if anything, do you know about the Scottish Government’s Heat in Buildings Strategy?
IF NECESSARY: The strategy was published in October 2021, and sets out how the Scottish Government will achieve warmer, greener and more energy efficient heating in domestic and non-domestic buildings in Scotland. It established a target of decarbonising all properties in Scotland by 2045, including the approximately 2 million homes that currently use mains gas as their primary heating fuel.
And what, if anything, do you know about the Scottish Government’s Heat in Buildings Public Engagement Strategy?
IF NECESSARY: The Heat in Buildings Public Engagement Strategy provides an overview of how Scottish Government will work with other stakeholders to deliver a programme of public awareness raising, education and participation around clean heat and energy efficiency, in order to meet targets set out in the Heat in Buildings Strategy.
PROBE:
- General views on strategy – any positives, negatives
- Does organisation have a specific strategy / business plans in relation to this?
Overview of activities (10-15 mins)
We are interested in finding out about the different types of activities organisations may have carried out over the last three years to engage members of the public in relation to the heat transition to net zero emissions in Scotland. Can you tell me about any activities that your organisation has…
- Carried out over the last three years to engage the public on this topic?
- Contributed to or supported in some way?
- Been aware of (but not been involved in)?
Interviewer: note down examples initially raised by stakeholder, then gather information about each one in relevant section (apportioning time on each section depending on the number of examples relavant to each).
At this stage probe for brief details about each activity (explain you will ask for more detail after you’ve heard about all the different types of activities carried out):
- what was it about?
- what did it involve / how was it carried out?
- who was it carried out with? target audience?
- was anything published / any information available online?
- (if yes – interviewer does not need to spend time collecting factual information that will likely be in the report – focus on key questions instead).
Note to interviewer: if there are lots of activities to discuss and the stakeholder is not able to stay on the call, ask if they would be willing to share details of the remaining examples by email.
A – Information about activities the organisation delivered themselves (10-15 mins)
I’d now like to ask you a bit more about the [activity/activities] you mentioned.
It would be useful to know more about what took place, and your thoughts on how well you think this method of engagement worked and any impact it may have had.
You might not have all the answers, which is absolutely fine.
Interviewer: ask about each (relevant) activity mentioned in turn with remaining time. ask or adapt questions depending on the type and format of engagement activity being described. if short on time or if there are lots of examples, prioritise those that are newly uncovered, unpublished or that we have not collected details about already.
ensure that you leave five minutes at end to ask the future engagement section.
- What was the purpose or overall aim of the activity?
- Who was the activity aimed at? General public or specific groups?
Probe on groups such as:
- Particular geographical areas;
- Socio-economic groups;
- People living in particular types of properties
- Homeowners/landlords/renters
- Based on protected characteristics – disability, ethnicity
- other groups
- Why were you interested in engaging with [this group / these groups] in particular? Why was this important?
PROBE IF NECESSARY:
- How did you identify there was a need to engage with this group?
I’d now like to ask about the topics that were covered and the way those topics were communicated to the public…
- What areas / topics did the activity cover?
PROBE:
- What were the main / key messages being communicated / delivered by the activity?
- Why were these particular messages chosen?
- And were any steps taken to make it easier for people to take part or engage with the activity?
PROBE:
- Design of materials
- Language (e.g. use of plain English; terminology used; Gaelic)
- Location of activity (any considerations for urban/rural audiences)
- How engaged / method of engagement
- Why did you do this? Were there any groups of people you thought may have struggled to understand/engage with the activity otherwise?
- What is your understanding of the impact this activity has had? Did it achieve its goals/aims?
- If yes – In what ways would you say the activity was successful?
- If too early to tell / not sure:
- Why is that? (clarify whether activity was too recent, or if the impact is expected to be over longer term e.g. it will take a while for people to install heat pumps)
- What do you hope that the impact of the activity will be?
- PROBE: Was the impact or success of the activity measured in any way?
- Why do you think it was successful / unsuccessful?
- If not previously mentioned: And do you think it was it successful at reaching the target audience?
- Were there any groups of people missing?
- IF YES: What were the reasons for that?
- Does your organisation have any future plans to further engage the public on the heat transition to net zero emissions?
- IF YES:
- What? When?
- Who is the target audience (and why)?
- Are these plans based on learnings from any previous engagement?
B – Information about activities the organisation contributed to in some way (5-10 mins)
Thinking now about the other [activity], which you mentioned being involved in.
- If not covered already – What was involved in the activity?
- What was the purpose or overall goal of the activity?
- If not covered already – What was your organisation’s involvement?
- What were the main / key messages being communicated / delivered by the activity?
- Who was the activity aimed at? General public or specific groups? Probe on reasons for this (if known)
- Do you know if the target audience was reached successfully?
- Any groups not reached successfully?
- Do you think it was it easy or difficult for people to take part and engage with the information provided [or to attend the activity]?
- What is your understanding of the impact the activity had? Probe on what went well, any challenges, what could be improved
C – Information about activities that the organisation is aware of (5-10 mins)
Moving onto [activity], which you said you were aware of.
- If not covered already – What was involved in the activity?
- If not covered already – Who delivered the activity?
- What were the main / key messages being communicated / delivered by the activity?
- Who was the activity aimed at? General public or specific groups? Probe on reasons for this (if known)
- Do you know if the target audience was reached successfully?
- Any groups not reached successfully?
- Do you think it was it easy or difficult for people to take part and engage with the information provided [or to attend the activity]?
- What is your understanding of the impact the activity had? Probe on what thought went well, any challenges, what could be improved
Engagement gaps (5 minute)
Interviewer: ask all
Finally, I’d like to ask if you think there are any gaps in the engagement activities that have been carried out so far on the heat transition. For example, in terms of the groups of people being targeted or the types of activities being carried out.
- First of all, as far as you are aware, are there any groups of people you think are missing from the activities that have been carried out the heat transition in Scotland so far?
Probe:
- Why do you think this is?
- Are there any groups of people that your organisation would have liked to have engaged but have been unable to so far?
- And are there any particular types of public engagement activities not currently happening that you think should be?
- If yes: What? When? Who should the target audience be (and why)?
- Do you think you would benefit from any advice or support on public engagement in relation to the heat transition in Scotland?
- If yes: What would you find useful?
Close (3 mins)
That’s all the questions I wanted to ask you today, unless you think there is anything else we might have missed which would be useful for us to know?
Thanks. In the next few weeks, we will be conducting follow up research among organisations across Scotland responsible for delivering public engagement activities on the heat transition. This will comprise a short, 5-minute online survey asking about activities or communications being delivered. Would you, or someone else from your organisation, be willing to take part in the survey?
If yes: take contact details (name, email)
We are keen to invite as many organisations as possible to take part in the survey. Can I check, are there any other organisations or people you are aware of who are delivering public engagement activities on the heat transition that you think we should invite to take part in the survey?
Finally, the ClimateXChange and Scottish Government research teams may wish to conduct follow up research about this topic within the next 2 years. Are you willing to have your name and contact details passed on to the ClimateXChange and Scottish Government teams for this purpose?
Thank you so much for taking the time to speak to me today, it’s been really helpful.
Appendix D – online survey questionnaire
ASK ALL.
QWORK: First of all, which of the following best describes who you work for?
- Charitable organisation
- Community group
- Education or research institute
- Local authority
- Non-Governmental organisation
- Non-profit organisation
- Private sector organisation
- Scottish Government department
- Social enterprise
- Other – please specify:
- Don’t know
ASK ALL.
How much, if anything, would you say you currently know about the Scottish Government’s Heat in Buildings Strategy?
- A great deal
- A fair amount
- Just a little
- Heard of it but know nothing about it
- Never heard of it
ASK ALL.
Q1. As you may know, the Scottish Government’s Heat in Buildings Strategy aims to transform Scotland’s buildings and the systems that supply their heat, as part of the transition to net zero emissions by 2045. This includes working to support the rapid adoption of zero emissions systems for home heating, such as heat pumps and district heat networks.
Have you, or your organisation, carried out any activities over the last three years to engage members of the public about changing their home heating systems?
- Yes
- No
- Don’t know
IF YES AT Q1.
Q2. Which of the following categories would those activities most closely fall under? MULTICODE
- Workshops
- Public information campaigns
- Open days or showcases
- Lectures / talks
- Training or knowledge-sharing sessions
- Providing information online
- Consultations
- Citizens Panel
- Advice service (in person)
- Advice service (online)
- Advice service (telephone)
- Other – please specify:
ASK IF YES AT Q1
Thinking about the most recent activity that you / your organisation carried out…
Q3. Which of the following topics, if any, were covered by the activity? MULTICODE
- General provision of energy efficiency advice/information
- Information about Scottish Government’s Climate Change Plan / net zero targets
- Improving the energy efficiency of households (such as through improving home insulation)
- Installing air source or ground source heat pumps
- District heating networks
- Other types of clean heating systems*
- Provision of information about grants / loans
- Other – please specify:
- Don’t know
ASK IF YES AT Q1
Q4. Which groups, if any, was the activity targeted at? MULTICODE
- General public (no specific target groups) at national level
- General public (no specific target groups) at regional or local level
- Businesses or people working in the energy sector
- Homeowners
- Private renters
- Those renting their home from a local authority or housing association
- Landlords
- Low-income households
- Households in urban areas
- Households in rural areas
- Households using gas/oil heating
- People with protected characteristics (e.g. disabled people, minority ethnic groups)
- People in fuel poverty
- Older people
- Younger people
- Other – please specify:
- Don’t know
Q5. What was the main reason or reasons for focusing the activity on those groups in particular?
- OPEN TEXT
- Don’t know / not sure
ASK IF CODE 1 AT Q1.
Q6. To what extent do you agree or disagree with the following statements about the activity?
- The activity was effective at reaching its target audience.
- The activity was effective at improving the target audience’s awareness / understanding of the issue.
- Members of the public took action as a result of engaging with the activity.
- Members of the public decided to change their home heating system to a zero direct emissions heating system as a result of engaging with the activity.
- It was easy for members of the public to take part and engage with the activity / the information provided.
ANSWER OPTIONS
- Strongly agree
- Tend to agree
- Neither agree nor disagree
- Tend to disagree
- Strongly disagree
- Too early to tell
- Not relevant
- Don’t know
ASK IF YES AT Q1.
Q7a Has your organisation carried out an evaluation of any of its public engagement activities?
- Yes
- No
- Don’t know
ASK IF YES AT Q7a.
Q7b. Would you be willing to share this information with the ClimateXChange and Scottish Government research team, to allow them to understand more about the impact of public engagement activities on this topic? SINGLE CODE
- Yes
- No
- Don’t know
SHOW IF CODE 1 AT Q7b
Thank you, please send this information to UK-PA-HeatTransition@ipsos.com and let us know if there is anything you would not like to be shared with the ClimateXChange and Scottish Government research team.
Select ‘Next’ to move on to the next question.
ASK ALL.
Q8. Do you or your organisation have any plans to deliver public engagement activities on the heat transition in Scotland in the future?
- Yes
- No
- Don’t know
ASK IF CODE 1 AT Q8
Q9. Could you tell us more about your future plans, including what the activities will involve and who they will be targeted at?
- OPEN TEXT
- Don’t know / not sure
ASK ALL.
Q10: Are you aware of any activities that have been carried out over the last three years by other organisations to engage members of the public in relation to the heat transition to net zero emissions in Scotland?
- Yes
- No
- Don’t know / Can’t remember
IF YES AT Q10.
Q11. What types of public engagement activities are you aware of that have been carried out over the last three years? MULTICODE.
- Workshops
- Public information campaigns
- Open days or showcases
- Lectures / talks
- Training or knowledge-sharing sessions
- Providing information online
- Consultations
- Citizens Panel
- Advice service (in person)
- Advice service (online)
- Advice service (telephone)
- Other – please specify:
ASK IF CODE 1 AT Q10.
Q12. What topics did that activity / did those activities relate to? MULTICODE
- General provision of energy efficiency advice/information
- Information about Scottish Government’s Climate Change Plan / net zero targets
- Improving the energy efficiency of households (such as through improving home insulation)
- Installing air source or ground source heat pumps
- District heating networks
- Other types of clean heating systems*
- Provision of information about grants / loans
- Other – please specify:
- Don’t know
ASK IF CODE 1 AT Q10.
Q13. And, as far as you are aware, which of the following groups of people / households did this activity/ those activities focus on? MULTICODE
- General public (no specific target groups) at national level
- General public (no specific target groups) at regional or local level
- Businesses or people working in the energy sector
- Homeowners
- Private renters
- Those renting their home from a local authority or housing association
- Landlords
- Low-income households
- Households in urban areas
- Households in rural areas
- Households using gas/oil heating
- People with protected characteristics (e.g. disabled people, minority ethnic groups)
- People in fuel poverty
- Older people
- Younger people
- Other – please specify:
- Don’t know
ASK ALL
Q14. Which of the following groups of people, if any, do you think would benefit from more support or information on the heat transition in Scotland? MULTICODE
- General public (no specific target groups) at national level
- General public (no specific target groups) at regional or local level
- Businesses or people working in the energy sector
- Homeowners
- Private renters
- Those renting their home from a local authority or housing association
- Landlords
- Low-income households
- Households in urban areas
- Households in rural areas
- Households using gas/oil heating
- People with protected characteristics (e.g. disabled people, minority ethnic groups)
- People in fuel poverty
- Older people
- Younger people
- Other – please specify:
- Don’t know
© The University of Edinburgh
Prepared by Ipsos Scotland on behalf of ClimateXChange, The University of Edinburgh. All rights reserved.
While every effort is made to ensure the information in this report is accurate, no legal responsibility is accepted for any errors, omissions or misleading statements. The views expressed represent those of the author(s), and do not necessarily represent those of the host institutions or funders.
Synthesio is an Ipsos proprietary tool that trawls the social web and mainstream media to monitor online presence and identify posts, re-posts and tags on a given topic (in this case, public engagement on the heat transition in Scotland). ↑
https://moneysavingboilerchallenge.com/ ↑
https://www.thursocdt.co.uk/helpandsupport ↑
Climate hubs are volunteer-led networks that supports community-led action across Scotland’s regions: https://www.gov.scot/policies/climate-change/community-led-climate-action/ ↑
This report sets out key findings from an exercise that mapped public engagement activities on the heat transition in Scotland.
The aim of the research was to help inform the delivery of the Heat in Buildings Public Engagement Strategy by addressing questions related to who delivers engagement activities and to whom, the type of activities and messages, and gaps in engagement.
We conducted a web search, interviews with experts from organisations involved in the heat transition and an online survey of organisations delivering public engagement activity.
Findings
Overview of ongoing activities:
- A wide range of organisations across the public, private and charitable sectors have been delivering public engagement activities on the heat transition in Scotland.
- The types of public engagement have also been varied, with the most common being advice services, workshops and information sharing online.
Target audience, messaging and accessibility as discussed by experts and organisations:
- Engagement activities were mostly open to the general public. There were also some specific target groups identified, including residents within a specific geographic area, homeowners, people in fuel poverty, low-income households and energy sector professionals.
- Despite attempts to engage a broad range of audiences, those actually engaged in the activities were typically more climate aware than the general public overall.
- Messaging that was focused on home energy efficiency and reducing energy bills, rather than the adoption of clean heating systems, resonated better with wider audiences in the context of the cost of living.
- Engagement on “simple fixes” (e.g. turning boiler temperature down) was therefore more widespread than messaging around bigger steps (e.g. installing a heat pump).
- Activities delivered through trusted messengers and existing local channels were accessible forms of engagement.
- Tailoring messages to the specific target audience was an effective approach to accessible engagement as it helped to improve understanding.
Gaps in public engagement identified by experts and organisations:
- Audiences under-engaged on the heat transition included private landlords, renters, professionals in the energy sector, young people and the digitally excluded.
- Lack of regulatory clarity on clean heat and energy efficiency was a key reason for the engagement gap among landlords and the energy sector.
- The upfront costs of transitioning were a barrier to widening reach among the general public, especially in the context of the cost of living crisis.
- Key messaging gaps in public engagement included:
- A lack of public understanding of heating systems.
- Insufficient practical and transparent advice on installing and operating clean heating systems.
- Interviewees thought that certain aspects of the transition, such as what clean heating systems are and how to install them, were not successfully communicated to the wider public due to their perceived complexity.
- They felt that communication about the efficacy of clean heating systems, based on real use cases, was lacking.
- There was a shortage of trusted messengers providing reliable, impartial advice, as well as a lack of tradespeople able to provide technical support on the practical aspects of the transition.
If you require the report in an alternative format, such as a Word document, please contact info@climatexchange.org.uk or 0131 651 4783.
Scotland is already experiencing climate change impacts, including increasing water scarcity, flooding and extreme weather events. The Scottish Government is preparing for these challenges with the third Scottish National Adaptation Plan (SNAP3).
This report presents indicators for monitoring the four domestic outcomes of SNAP3. It establishes a baseline prior to the implementation of the Plan for monitoring and determining progress at the end of its five-year period.
The research was undertaken through desk-based review and stakeholder engagement.
Findings
The proposed indicators for monitoring each of the four domestic outcomes of SNAP3 are presented below.
Nature Connects
- Habitat Connectivity Index
- Proportion of surface water bodies classified in high and good condition
- Proportion of Scotland’s protected sites in favourable condition
- Proportion of soft shorelines affected by coastal erosion
- Extent of green-blue land cover in urban areas
- Proportion of adults who live within a five-minute walk of their nearest green or blue space
Communities
- Level of community awareness around climate change
- Level of community climate action
- Progress of actions in local flood risk management plans
- Level of community wellbeing
Public Services and Infrastructure
- Level of collaboration across public services
- Level of adaptation actions across public services
Economy, Business and Industry
- Proportion of businesses monitoring climate-related risks
- Proportion of businesses taking action to adapt to the effects of climate change
- Number of green jobs
- Uptake of grants for agriculture storage reservoirs and off-season storage lagoons
Recommendations
Key recommendations for the outcome indicators include:
- Consistent application of indicators.
- Maintain continuity, quality and availability of data required by each indicator.
- Maintain flexibility regarding potential for additional indicators.
- Establish a working group to sustain the functioning of the indicators.
For further details please read the report.
If you require the report in an alternative format, such as a Word document, please contact info@climatexchange.org.uk or 0131 651 4783.
Related Scottish Government publications
Scottish National Adaptation Plan 2024-2029 (www.gov.scot)
Scottish National Adaptation Plan 2024-2029: Monitoring and Evaluation Framework (www.gov.scot)
Research completed August 2024
DOI: http://dx.doi.org/10.7488/era/4836
Executive summary
Aims
This report presents indicators for monitoring the four domestic outcomes of the third Scottish National Adaptation Plan (SNAP3). These outcomes are summarised as:
- Nature Connects
- Communities
- Public Services and Infrastructure
- Economy, Business and Industry
It establishes a baseline prior to the implementation of SNAP3 for monitoring and determining progress at the end of the Plan’s five-year period.
The report addresses the challenges of developing indicators for a national adaptation plan by adopting an approach that balances robustness and practicality, considering available resources and data. We have developed a set of indicators for each outcome, assessing their relevance and feasibility for monitoring, through desk-based review and stakeholder engagement. The assessment has been grounded in the practical reality of what data is available rather than theoretically ideal indicators.
Findings
The indicators proposed for each of SNAP3’s outcomes are listed below. For each indicator, there was sufficient data available to allow for a pre-SNAP3 baseline to be established and then reported against after a five-year period.
- Nature Connects – outcome indicators
- Habitat Connectivity Index
- Proportion of surface water bodies classified in high and good condition
- Proportion of Scotland’s protected sites in favourable condition
- Proportion of soft shorelines affected by coastal erosion
- Extent of green-blue land cover in urban areas
- Proportion of adults who live within a five-minute walk of their nearest green or blue space
These six indicators cover elements of ecological connectivity, ecosystem health, and nature-based solutions (NbS) for climate adaptation. A marine ecosystem indicator could not be included due to insufficient data availability.
- Communities – outcome indicators
- Level of community awareness around climate change
- Level of community climate action
- Progress of actions in local flood risk management plans
- Level of community wellbeing
The four indicators cover elements of community resilience, wellbeing, and climate action. It was particularly challenging to capture the complexity of health and equity in relation to climate adaptation with only a few high-level indicators. The onus was placed on monitoring levels of community action in creating resilient, healthy, and equitable places.
- Public Services and Infrastructure – outcome indicators
- Level of collaboration across public services
- Level of adaptation actions across public services
The two indicators monitor collaboration and adaptation action among public bodies. While these indicators provide high-level insights into public sector collaboration and adaptation efforts, they do not measure the effectiveness or inclusiveness of these actions, which would require numerous sector-specific indicators that would be onerous to monitor.
- Economy, Business and Industry – outcome indicators
- Proportion of businesses monitoring climate-related risks
- Proportion of businesses taking action to adapt to the effects of climate change
- Number of green jobs
- Uptake of grants for agriculture storage reservoirs and off-season storage lagoons
The five indicators cover elements of business preparedness, adaptation actions, and economic opportunities related to climate change. These indicators provide an overview of Scotland’s economic adaptation to climate change. However, they do not cover investment in climate adaptation initiatives or economic resilience to climate-related hazards, as there were insufficient available data.
Recommendations
Key recommendations for the outcome indicators following this project include:
- Consistent application of indicators. The indicator set for SNAP3 should be finalised as soon as possible and consistently applied to enable meaningful and coherent monitoring over the Plan’s five-year period. Any changes made to individual indicators or the data that underpin them may compromise the ability to track progress consistently relative to the baseline.
- Maintain continuity, quality and availability of data required by each indicator. It is vital to maintain the allocation of resources to the collection, maintenance and accessibility of datasets used by the indicators across all relevant Scottish Government departments.
- Maintain flexibility regarding potential for additional indicators. New indicators may be added in the immediate term if relevant data becomes available, as may be anticipated regarding, for example an ecosystem functions indicator for Nature Connects or a green finance indicator for Economy, Business, and Industry. While the suite of indicators addresses the needs for monitoring the outcomes of SNAP3, it may be viewed as a foundation to build upon regarding monitoring of SNAP4.
- Establish a working group to sustain the functioning of the indicators. The working group could comprise key stakeholders and data providers who could meet annually to review the functioning of the indicators and address any issues regarding their deployment, e.g., continuity and availability of data and its quality.
The findings of this report may also be of interest to anyone interested in monitoring and evaluation of climate adaptation planning more generally.
Glossary / Abbreviations table
BICS | Business Insights and Conditions Survey |
CCAH | Community Climate Action Hubs |
LPP | Local Place Plans |
|
MEL | Monitoring, Evaluation and Learning |
|
NAP | National Adaptation Plan |
|
NbS | Nature-based solutions |
|
ONS | Office of National Statistics |
|
SEPA | Scottish Environment Protection Agency |
|
SHeS | Scottish Health Survey |
|
SHS | Scottish Household Survey |
|
SNAP3 | 3rd Scottish National Adaptation Plan |
|
SSN | Sustainable Scotland Network |
|
WEMWBS | Warwick-Edinburgh Mental Wellbeing Scale |
Introduction
Aims of this report
The third Scottish National Adaptation Plan (SNAP3)[1] will be published in Autumn 2024 and Scottish Ministers have agreed that there is a need to improve monitoring of its outputs and outcomes, as compared with the way previous adaptation plans in Scotland have been monitored. The central aim for monitoring, evaluation and learning (MEL) of SNAP3 is to ensure that the indicators are as robust and relevant as possible for monitoring its specific outcomes, while remaining practical and accessible to implement in terms of resources and data available. We have sought to strike this balance between robustness and feasibility in the outcome indicators presented in this report.
The structure of SNAP3 is based around five long term outcomes and 23 objectives that set out adaptation priorities for the Scottish Government between 2024-2029. These five outcomes are (with abbreviations used hereinafter in brackets):
- “Nature connects across our lands, settlements, coasts, and seas” (Nature Connects)
- “Communities are creating climate-resilient, healthy, and equitable places” (Communities)
- “Public services are collaborating in effective and inclusive adaptation action” (Public Services and Infrastructure)
- “Economies and industries are adapting and realising opportunities in Scotland’s Just Transition” (Economy, Business and Industry)
- “Scotland’s international role supports climate justice and enhanced global action on climate adaptation” (International Action)
The indicators developed here address the first four outcomes, which are focused on Scotland’s resilience at the national level. Through a process of desk-based research and engagement with the Scottish Government’s departments and relevant organisations, we have developed a suite of indicators to monitor progress of these outcomes. Each indicator was assessed using criteria to determine its inclusion. The criteria addressed the indicator’s conceptual relevance and practical implications, including availability of baseline data. Our development of indicators for the four outcomes of SNAP3 took place concurrently with work undertaken by the Scottish Government to develop a suite of indicators for the 23 objectives that sit beneath the outcomes.
This report takes the following structure: first, Section 1.2 provides a brief overview of MEL in national adaptation contexts. Section 2 outlines the process undertaken to develop the outcome indicators. Section 3 provides information for each indicator and is structured by each outcome. Baseline data is presented in the Section 4. Section 5 concludes with a discussion and recommendations for next steps. Annexes provide further details on methodology and technical information.
Context
A key takeaway from the COP28 in December 2023 was the importance of monitoring, evaluation, and learning (MEL) to understand and report on the effectiveness of the design and implementation of national adaptation planning processes (Beauchamp & Józefiak, 2023). Due to the iterative nature of climate adaptation, MEL is essential to periodically understand the effectiveness of adaptation plans effectiveness and improve their design accordingly (GEF, 2016). Furthermore, national MEL systems are of importance for fulfilling national reporting commitments, such as the Enhanced Transparency Framework under the Paris Agreement (UNDP, 2022).
Developing indicators of climate adaptation is challenging, conceptually and practically, due to the complex, multi-sectoral and context-specific nature of climate impacts that need to be addressed (UNFCC, 2022). Challenges include: the length of time it can take to implement adaptation actions due to their scope and scale; the length of time for adaptation actions to mature and deliver measurable outcomes; and the need for monitoring to be sustained, which poses practical issues regarding maintenance of a consistent methodology using comparable data and associated long-term funding and policy cycles.
No standard metrics exist to capture adaptation nor an off-the-shelf indicator framework to apply to a country’s context (New et al., 2022). Nevertheless, there are numerous efforts to structure MEL of climate adaptation in the form of checklists and toolkits. Examples include: the BASE Evaluation Criteria for Climate Adaptation, which offers a checklist for evaluation focused on outcomes and processes; and the ‘Toolkit for MEL for National Adaptation Plan (NAP) Processes’ for developing countries (Beauchamp et al., 2024).
The Global Goal on Adaptation (GGA) framework adopted at COP28 (known as the UAE Framework for Global Climate Resilience) represents a concerted effort at a global level to establish universal targets to guide countries’ adaptation pathways. However, identifying a set of indicators to monitor progress remains a fundamental challenge (Gabbatiss & Lempriere, M, 2024). This is exemplified by the wide-ranging list of potential indicators found in the recent UAE – Belém work programme that synthesises countries’ submissions to the United Nations Framework Convention on Climate Change (UNFCCC) (UNFCCC, 2024).
In Scotland, the approach to climate adaptation M&E monitoring and evaluation has been robustly developed through the previous Scottish Climate Change Adaptation Programmes (SCCAPs). The Climate Change Committee (CCC) has provided significant recommendations on enhancing the M&E framework within Scotland. A key recommendation from the CCC has been to establish clear, measurable outcomes and associated indicators that can effectively capture the progress and impact of adaptation initiatives (CCC, 2022). Recognising the benefits of this approach, the Scottish Government has adopted an outcomes-focused approach for its Adaptation Plan. The importance of aligning national adaptation indicators with local contexts, ensuring that the indicators are relevant and actionable for Scotland’s unique environmental, social, and economic conditions has been highlighted in previous ClimateXChange research (Moss, A., 2019). he work presented in this project builds upon this background of previous MEL work.
Developing the suite of indicators
To develop the suite of indicators for monitoring the four outcomes of SNAP3, we followed a five-step approach, as illustrated in Figure 1 and described below.
The first step was a desk-based, data-mapping process. This involved reviewing draft SNAP3, the previous adaptation national plans, the published relevant Scottish policies and some international guidelines on MEL to identify possible indicators. The second step involved developing criteria to rank the indicators and facilitate their selection. At the third and fourth steps, this first longlist of indicators was presented and discussed with several stakeholders, during both one-to-one interviews and four workshops organised on each of the four SNAP3 outcome areas. This dynamic process enabled us to refine and amend the longlist of indicators, clearly identify gaps and limitations, and provide some recommendations. The final step of the process was the presentation of the indicator framework containing 12 outcome indicators.
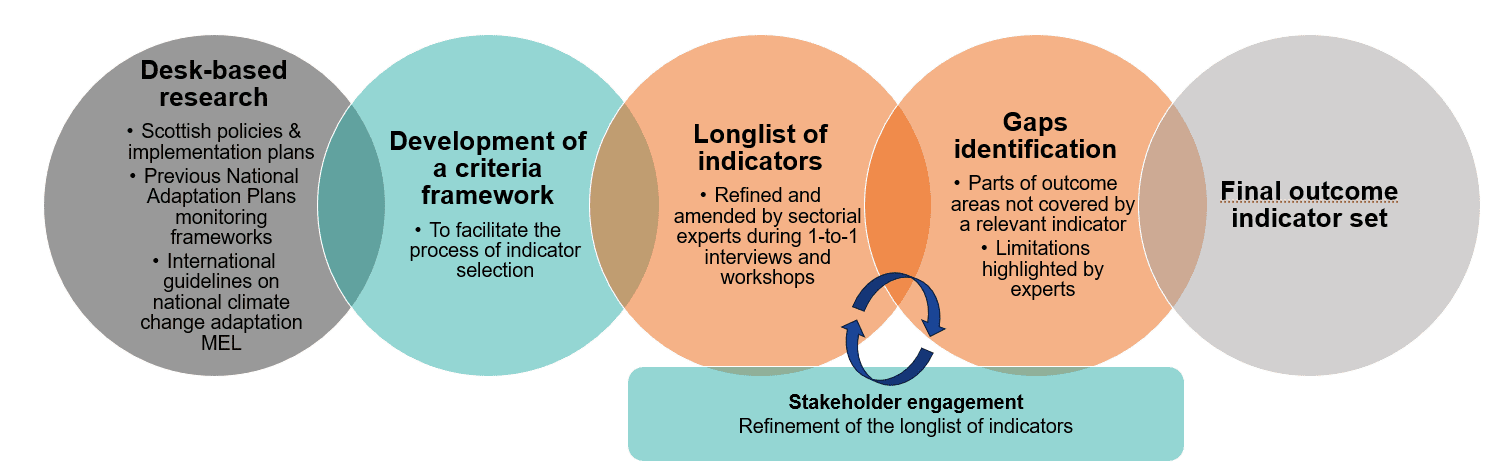
Figure 1: The five-step approach to develop the suite of indicators
Figure 2:: visualisation of the indicator development process
Desk-based research
The first stage of developing indicators involved data mapping through review of:
- Sectoral policies listed in the draft SNAP3 and their implementation plans, where published, to search for relevant existing indicators and associated datasets (See Annex 1).
- Relevant existing indicators and associated datasets used by previous Scottish adaptation plans (CCC, 2023; Moss, A., 2019,) and unpublished meeting notes from a stakeholder workshop led by CXC in May 2023 entitled ‘Monitoring and evaluation of Scotland’s Climate Change Adaptation Programme 2024-2029’.
- A selection of international guidelines and frameworks on national climate change adaptation monitoring and evaluation (EPA, 2017; FAO, 2017; Mäkinen et al., 2018; OECD, 2015; UNFCCC, 2023; UNFCCC, 2024) to learn from others’ approaches to the identification of outcome indicators and to identify if they used any adaptation outcome indicators that might be modified for use regarding SNAP3.
The four outcomes cover a wide range of different elements. Therefore, we used an approach based around theory of change (ToC) to identify those core elements that the indicators for each outcome should cover. This approach complemented the ToC work undertaken by Scottish Government as part of the draft SNAP3. We identified core elements through interpretation and analysis of each outcome section in the draft SNAP3. The core elements identified were:
- Nature Connects: Ecological connectivity (terrestrial, marine, and coastal); ecosystem health (terrestrial, marine, and coastal); and connection to nature.
- Communities: Community action; community resilience; health and equity.
- Public Services: Public sector collaboration; public sector adaptation action; effectiveness of public sector action; and inclusiveness of public sector action.
- Economy, Business, and Industry: Business preparedness and action; and economic adaptation.
This approach provided a broad structure and scope for the development of a longlist of potential indicators. The latter emerged from this desk-based research (See Annex 2). The longlist was refined by applying the indicator criteria (see Section 2.2 below) and amended based on the inputs gathered during the stakeholder engagement.
Indicator criteria
The indicator criteria (see Table 1) built upon established indicator criteria, such as SMART (Specific, Measurable, Achievable, Relevant and Time-Bound) (Biden, 2022) and RACER (Relevant, Accepted, Credible, Easy and Robust) (Peter & Peter, 2009), while refining elements to the specific context (e.g. adaptation relevance). Indicator ranking “low” for any criterion were excluded.
Table 1: Criteria for selecting outcome indicator for SNAP3
| Criterion | Description | Low | Moderate | High |
|---|---|---|---|---|
|
Adaptation relevance |
The indicator should relate to key elements of climate adaptation, including vulnerability, risk, exposure, and adaptive capacity. |
Minimal to no relevance to key climate adaptation elements. |
Some relevance to key climate adaptation elements. |
Clear relevance to key climate adaptation elements. |
|
Representativeness |
The indicator represents a core element of the outcome area within the adaptation plan that it fits under. |
Indicator only represents a small element of the outcome area. |
Indicator somewhat represents the key characteristics of the outcome area. |
Indicator represents well the key characteristics of the outcome area. |
|
Understanding |
The indicator should be easily understandable by a wide range of stakeholders, including non-experts, to ensure effective communication. |
Technical expertise required to fully understand indicator. |
Some technical expertise required but broadly understandable to non-expert audiences. |
Indicator is clearly understandable to a wide audience. |
|
Data availability |
Data for the indicator is readily available and accessible for use by wide range of stakeholders |
No data available or heavily restricted access to necessary data. |
Data exists but requires resources and expertise to fully access. |
Data fully and freely available. |
|
Sensitivity |
The indicator is sensitive enough to detect changes over five-year period. |
Changes in indicator not detectable over the required time-period. |
Indicator data is somewhat sensitive enough to detect changes over the required time-period. |
Indicator data is sensitive enough to detect changes over the required time-period. |
|
Baseline |
It should be possible to set clear, quantifiable baseline for the indicator to track progress. |
Data not available to establish a baseline. |
Baseline data is possible but requires resources to obtain. |
Baseline data is easily accessible. |
|
Practicality |
Indicator should be cost-effective to use and have low resource requirements for data collection and analysis. |
Prohibitively expensive and/or impractical to use indicator data. |
Some expenses and resources required to use indicator data. |
Cost-effective and low-resource to use indicator data. |
Stakeholder engagement
With support from the Scottish Government’s steering group, and drawing upon our desk-based research, we identified relevant stakeholders that could help validate and refine indicators within each outcome area. Stakeholders were considered from various backgrounds relevant to outcome areas, who could offer insights into data availability and gaps, as well as practicality of indicators.
We conducted one-to-one interviews with experts who could offer insights into data availability and gaps to discuss specific areas of the SNAP3 and four stakeholder workshops were organised; one for each outcome area[2]. We also gathered 66 participants over four workshops, from more than 25 different organisations, detailed in Annex 3. They were invited based on their expertise in fields relevant to each outcome area discussed and their knowledge of climate adaptation. The participants received the longlist of indicators before the workshop and were asked: (a) whether the indicators proposed covered well the targeted outcome area and (b) if there were any aspects missing.
The overall aim of stakeholder engagement was to engage with relevant teams across the Scottish Government on existing monitoring work to date, review existing available datasets, and amend the longlist of quantitative indicators developed by Ricardo. Experts confirmed, advised against, or suggested indicators that would best reflect the outcome areas. The workshops helped identify limitations of the selected indicators, as well as highlighting suggested outcomes that should not be included (for example, due to lack of data availability).
Outcome indicators
This section presents the proposed outcome indicators for SNAP3. Figure 2 visually presents the proposed outcome indicators, with each indicator categorised under the relevant outcome area. An overview is provided for each outcome before detailing each indicator. This information includes the indicator title, description, data holder, unit and rationale for inclusion. Detailed information for how the indicator criteria was applied to each indicator is provided in Annex 4.
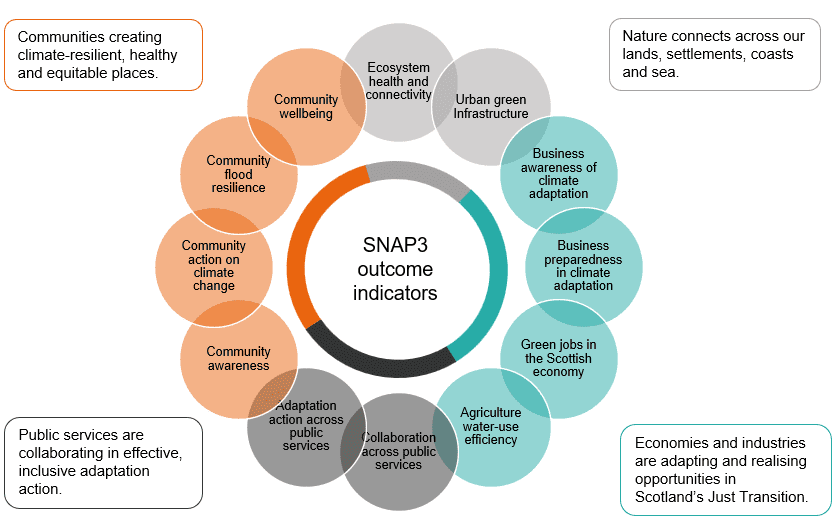
Figure 2: Proposed outcome indicators for SNAP3
Nature connects across our lands, settlements, coasts, and seas
Overview
The outcome Nature Connects places emphasis on nature’s role in climate adaptation. It emphasises connectivity across landscapes, settlements, coasts, and seas to bolster ecosystem resilience. Key actions include developing nature networks in every local authority area, managing invasive species, and enhancing natural carbon stores like peatlands and forests. Taking a holistic approach aims to improve Scotland’s climate resilience while delivering co-benefits for biodiversity, flood mitigation and human wellbeing. Figure 3 illustrates the SNAP3’s pathway from objectives to outcome and impact for the Nature Connects outcome.[3]
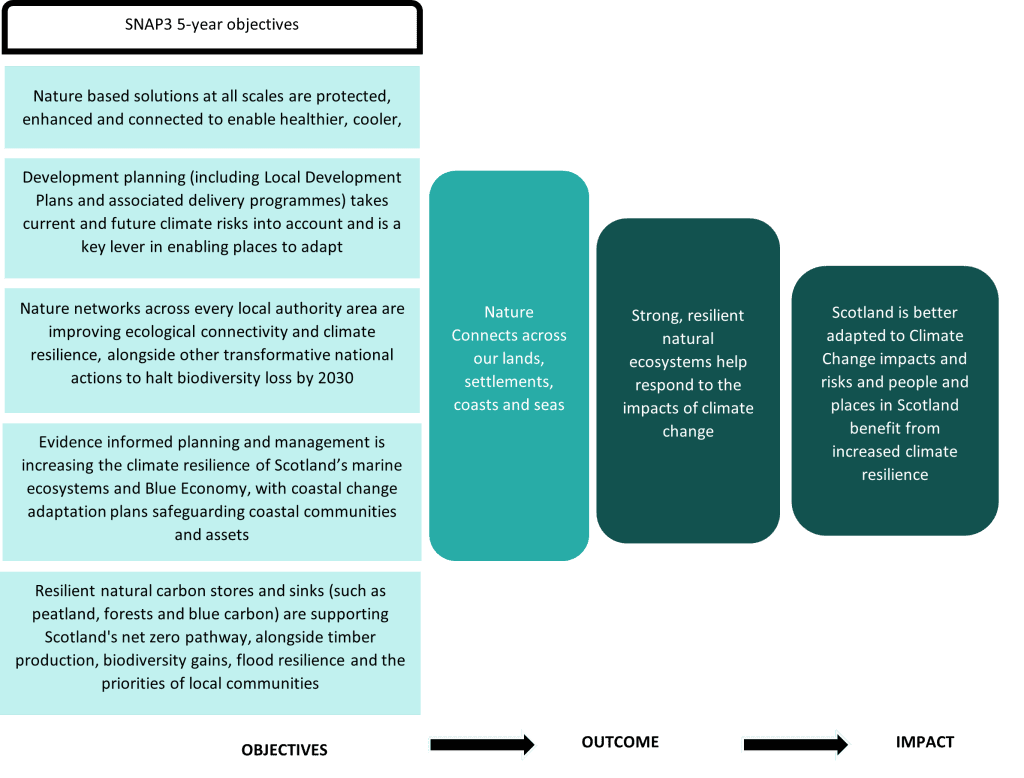
Considerations for indicator selection
Following the desk-based review and stakeholder engagement, several considerations emerged regarding indicator selection for the Nature Connects outcome:
- The importance of acknowledging that connectivity indicators do not necessarily reflect habitat quality or overall ecosystem resilience. Hence, ideally, there would be a focus on ecosystem functions and processes. However, while indicators focused on ecosystem functions are currently under development by Nature Scot, they will not be operational in time for use in monitoring SNAP3.
- Despite the high-level nature of indicators, there is a need to reflect Scotland’s diverse environment. Freshwater environments were highlighted as both a useful proxy for the extent of ecological connectivity and with a comprehensive and accessible dataset.
- Urban green infrastructure is an important aspect of this outcome and the indicators should capture the extent of accessibility to nature and green spaces.
- Species indicators are not sufficiently sensitive to show a significant trend over SNAP3’s five years. Changes in species abundance and distribution due to climate change are often gradual. Species’ adaptation, whether through genetic changes, changes in behaviour, or moves to new areas, often require longer than five years to be observable. Over a shorter period, it can be difficult to distinguish between short-term fluctuations and longer-term changes driven by climate change. While five-year studies can provide valuable snapshots and early indicators, longer timeframes are typically needed to confidently assess significant trends in species abundance and distribution related to climate adaptation. Therefore, indicators like “terrestrial species’ abundance” developed by Nature Scot were deemed inappropriate for inclusion.
- As outlined in SNAP3, marine ecosystems will make a vital contribution to Scotland’s adaptation to climate change. However, there is very limited data available to measure marine habitat connectivity. Furthermore, there is difficulty capturing adaptation of the marine environment in a single, general indicator. For example, NatureScot’s marine species’ abundance indicator focuses upon the average abundance of 14 species of breeding seabird. Such an indicator was not considered to be suitably representative of marine ecosystems and, therefore, not selected.
- Not all the natural habitat types are captured in this framework. Specific indicators were considered but not selected. For example, the baseline for the Woodland Ecological Condition indicator was too old and the indicator would not cover the 2024-2029 period.
Nature Connects – proposed indicators
When setting out to develop a list of indicators for the Nature Connects outcome, it was important to cover ecological connectivity between habitats across land and sea, ecosystem health, and the implementation of NbS for climate adaptation. To a large extent, the six indicators chosen for this outcome efficiently achieve this coverage by using established indicators and available data held for various Scottish Government agencies.
The proposed indicators are:
- Habitat Connectivity Index
- Proportion of surface water bodies classified in high and good condition
- Proportion of Scotland’s protected sites in favourable condition
- Proportion of soft shorelines affected by coastal erosion
- Extent of green-blue land cover in urban areas
- Proportion of adults who live within a five-minute walk of their nearest green or blue space.
Immediately below we present the baseline information foreach of the six indicators proposed to monitor the Nature Connects outcome. For each indicator, we provide the baseline value, a description of the baseline, the recent trend and desired trend for each indicator to provide context. More information on baseline data is available in Annex 5. This is followed by a further detailed summary of each indicator and the rationale for their inclusion.
Nature Connects – baseline
Habitat Connectivity Index
- Description: In 2020, the total Equivalent Connected Area (Probability of Connectivity) (ECA (PC) value for Scotland was 35,570 ha for semi-grassland (2.9%), 5,655 ha for woodland (1.4%) and 214,277 ha for heathland (8.3%).
- Recent trends: None.
- Desired trend: Increase
- Baseline
- Semi-grassland: 2.9%
- Woodland: 1.4%
- Healthland: 8.3%
Proportion of surface water bodies classified in good and better condition
- Description: In 2022, 445 (13.7%) surface water bodies were in better condition and 1664 (51.2%) surface water bodies were in good condition.
- Recent trends: This percentage has remained broadly stable in recent years, rising slightly from 61.8% in 2014.
- Baseline: 64.9%
- Desired trend: Increase
Proportion of Scotland’s protected sites in favourable condition
- Description: In March 2024, the proportion of natural features in favourable condition on protected sites was 75.6%.
- Recent trends: The trend between 2023 and 2024 is relatively stable, slightly decreasing by 0.9%. However, the proportion of features in favourable condition has decreased by 4.8 percentage points since 2016 when it peaked at 80.4%.
- Baseline: 75.6%
- Desired trend: Increase
Proportion of soft shorelines affected by coastal erosion
- Description: In 2021, 46% of the soft coast is affected by coastal erosion. The average rate of erosion is 0.43 m/year.
- Recent trends: In 2017, 38% of the soft coast was affected by coastal erosion, representing an 8% increase in eight years. Note, the proportion of shorelines experiencing coastal erosion, and the rate of erosion, increases under all climate change emissions scenarios.
- Baseline: 46%
- Desired trend: Decrease
Extent of green-blue land cover in urban areas
- Description: The total area of urban greenspace in Scotland as defined by Ordnance Survey is 3,167 km².
- Recent trends: April 2024 represents the only OS MasterMap Greenspace data currently available from the Ordnance Survey.
- Baseline: 3,166km2
- Desired trend: Increase
Proportion of adults who live within a 5-minute walk of their nearest green or blue space
- Description: In 2022, 70% of adults reported living within a 5-minute walk of their nearest green or blue space.
- Recent trends: This percentage has remained broadly stable since 2013, where it was 68%. There has been a slight, steady increase from 2017 from 65% to 70%.
- Baseline: 70%
- Desired trend: Increase
Nature Connects – indicator summaries
ECOSYSTEM HEALTH AND CONNECTIVITY
Habitat Connectivity Index
|
Indicator |
Habitat Connectivity Index |
|
Description |
This habitat connectivity indicator measures ‘functional connectivity’. This refers to how well species can move from one habitat patch to another. This indicator shows the functional connectivity of three habitats (Woodland; Heathland; Grassland;). |
|
Data holder |
Nature Scot |
|
Unit |
% of total habitat area per catchment |
The Habitat Connectivity Index was selected to represent the functional health of natural ecosystems in Scotland. Habitat networks enable species to follow their shifting climate envelope and move to new habitats, ensuring their survival and the continuity of ecosystem services. Connectivity is crucial for promoting the survival, migration, and adaptation potential of species populations in response to climate change. By assessing functional connectivity, this indicator provides valuable insights into ecosystem resilience, highlighting areas where habitat fragmentation might increase the risk and exposure of species to climate-related impacts. Enhancing habitat connectivity directly supports the adaptive capacity of species by facilitating movement and gene flow, thereby reducing vulnerability, and supporting biodiversity conservation (Haddad et al., 2015). It reflects the interconnectedness of ecosystems and underscores the importance of maintaining and improving habitat connectivity to mitigate climate risks and enhance the adaptive capacity of natural systems (Krosby et. al., 2010).
Proportion of surface water bodies classified in good or better condition
|
Indicator |
Proportion of surface water bodies classified in high or good condition |
|
Description |
This indicator shows the proportion of surface water body with an overall status classified either “good” or “high”. SEPA monitors the environment to assess the condition of water quality, water resources, physical condition, fish migration and the impact of invasive non-native species. If any single aspect of a water body is classified as below good, that water body’s overall condition is reported as below good. |
|
Data holder |
Scottish Environment Protection Agency (SEPA) |
|
Unit |
% |
We chose ‘proportion of surface water bodies classified in high or good condition’ as a proxy for climate change adaptation because it reflects the health and quality of water ecosystems. Healthy water bodies are more resilient to climate change impacts such as altered precipitation patterns, increased temperatures, and pollution. By maintaining high and good conditions, these water bodies can better support biodiversity and delivery of ecosystem services that fulfil human needs, particularly regarding climate adaptation (Palmer et al., 2009).
Proportion of Scotland’s protected sites in favourable condition
|
Indicator |
Proportion of Scotland’s protected sites in favourable condition |
|
Description |
This indicator shows the efforts to improve the condition of natural features in protected sites as they will ensure terrestrial habitats are in good ecological health in Scotland. This indicator relates to the quality of natural habitats. |
|
Data holder |
Nature Scot |
|
Unit |
% |
We chose ‘proportion of Scotland’s protected sites in favourable condition’ as a proxy to reflect the health and resilience of Scottish ecosystems. Healthy and well-managed protected sites are better able to withstand and adapt to the impacts of climate change, such as shifting species distributions and extreme weather events (Watson et al., 2014). This indicator shows how effectively Scotland is preserving biodiversity and ecosystem services, which are crucial for climate resilience. It is important to look at the proportion of sites in favourable condition by habitat type. Indeed, habitats such as native woodland, which are vulnerable to overgrazing and invasive non-native species, have a lower percentage (56.8%) of sites in favourable condition than the other types of habitats (average of 73.4%).
Proportion of soft shorelines affected by coastal erosion
|
Indicator |
Proportion of soft shorelines affected by coastal erosion |
|
Description |
This indicator shows the proportion of shorelines experiencing coastal erosion in Scotland. |
|
Data holder |
Ordnance Survey |
|
Unit |
% |
Scotland’s coastline is estimated to be 18,743 km in length along the high-water line. This indicator was chosen as coastal erosion affects society’s assets such as infrastructure and cultural heritage, and contributes to more frequent coastal flooding. Coastal erosion is exacerbated by climate change. Implementing adaptation strategies to protect Scotland’s coasts is crucial to protect the biodiversity of coastal ecosystems. It also ensures the safety and resilience of coastal communities against climate impacts, as well as the resilience of regional and national infrastructure (McGranahan et al., 2007).
URBAN GREEN INFRASTRUCTURE
Extent of green-blue land cover in urban areas
|
Indicator |
Extent of green-blue land cover in urban areas |
|
Description |
This indicator shows the accessible and non-accessible greenspaces (woodland open semi-natural areas, inland water, beach or foreshore, manmade surface, multi-surface) in urban areas in Scotland. |
|
Data holder |
Ordnance Survey |
|
Unit |
% |
This indicator is chosen as a proxy for integration of nature into urban settlements. Green infrastructures within towns and cities are NbS designed to reduce the urban heat island effect, improve resilience to flooding and provide an opportunity for people to enjoy and benefit from nature. Compared to technology-based solutions to climate challenges, NbS like green-blue land cover in urban areas are often more cost-effective and longer lasting. They also have multiple co-benefits, such as reducing net emissions, providing habitats for biodiversity, enhancing human health and well-being (Demuzere et al., 2014; Gill et al., 2007).
Proportion of adults who live within a five-minute walk of their nearest green or blue space
|
Indicator |
Proportion of adults who live within a five-minute walk of their nearest green or blue space. |
|
Description |
This indicator measures the proportion of adults who live within a five-minute walk of their nearest green or blue space. |
|
Data holder |
Scottish Household Survey |
|
Unit |
% |
This indicator is chosen as a proxy to reflect the extent communities have access to natural spaces. Easy access to green and blue spaces enhances community resilience in the face of climate stressors by promoting well-being (e.g. air quality improvement, mental and physical health, etc.) (Maas et al., 2006). Access to green and blue spaces helps mitigate the urban heat island effect, providing cooler areas that can reduce heat-related health risks during extreme weather events. Lastly, green and blue spaces contribute to biodiversity and water management, supporting ecosystems that buffer against climate impacts such as flooding (Demuzere et al., 2014).
Communities are creating climate-resilient, healthy and equitable places
Overview
This outcome focuses on empowering communities to create climate-resilient, healthy and equitable places. It adopts a place-based approach, acknowledging that climate impacts vary by local context. Key initiatives include establishing Climate Action Hubs, developing collaborative planning partnerships and providing capacity-building support. This community-centred approach seeks to ensure adaptation efforts are inclusive, address local needs and build societal resilience to climate impacts. Figure 4 presents the SNAP3’s pathway from objectives to outcome and impact for the Communities outcome.[4]
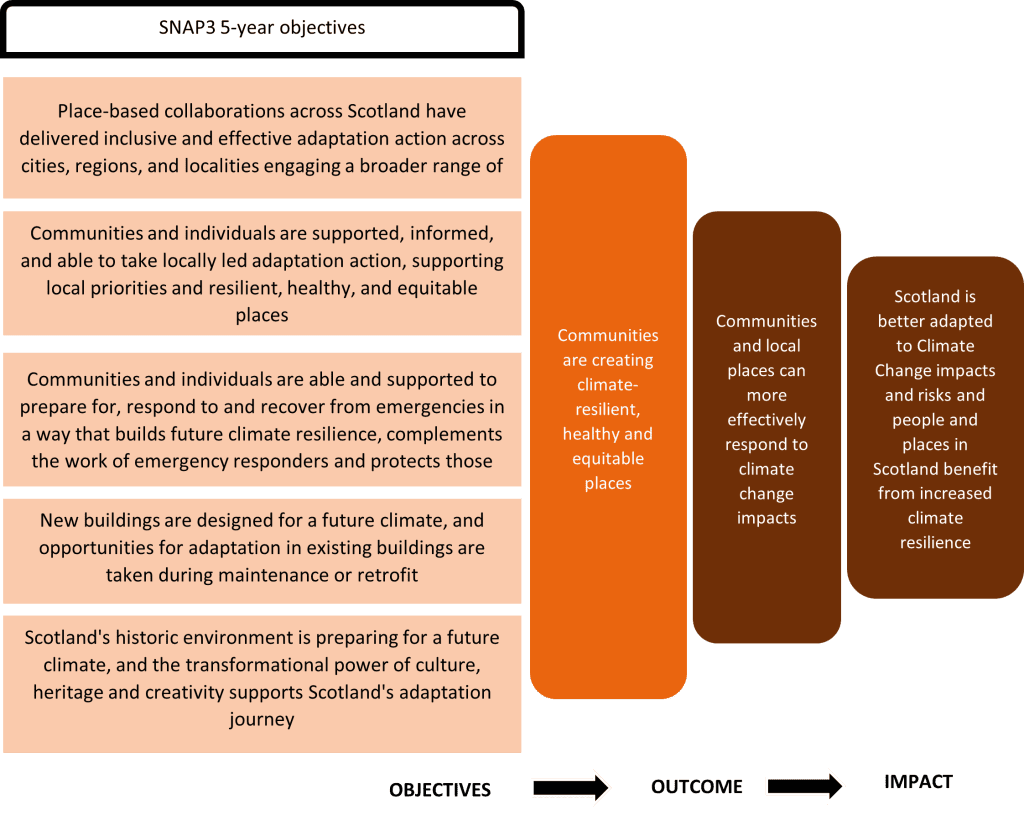
Considerations for indicator selection
Following the desk-based review and stakeholder engagement, several considerations emerged regarding indicator selection for the Communities outcome:
- Data on exposure to climate-related hazards provides information on the places where efforts need to be intensified to limit inequalities, for example, if hazard data is coupled with data on deprivation or social vulnerability (Sayers, PB., et al., 2021). We explored one indicator related to the exposure of vulnerable populations to climate-related hazards. This indicator sought to understand inequality in how communities are impacted by climate hazards. There are limitations to such an indicator focusing on exposure to flood, heat, drought, or wildfire, as it does not consider the resilience of the population exposed. While exposure is unlikely to change in the short to medium term, measures to reduce the vulnerability of those most exposed to risks will be key to increasing their resilience. It is, therefore, important data but less suitable as an indicator measuring increased community resilience for the purposes of this work. The overall conclusion was that the indicators for the Communities outcome should focus more on actions being taken by communities that are indicative of resilience.
- Flooding and the action taken to adapt to this hazard was a focus for consideration due to its significance as a climate-related hazard for Scotland. Example indicators include the ‘proportion of flood resilience action undertaken’ or ‘uptake of property flood protection measures in deprived areas’, or ‘responses to surveys on adaptation action’. Indicators around property flood protection measures and insurance were considered. However, although schemes such as “Build back better” exist, there were insufficient national data available to include this indicator.
- A combination of two indicators, ‘progress of actions in local flood risk management plans’ and ‘percentage of the population declaring that they understand what actions they should take to help tackle climate change’ were selected as proxies to capture community action in climate adaptation.
- Collaboration at community level was often mentioned as essential when it comes to adaptation to ensure the salience, credibility and legitimacy of actions and common understanding, ownership, and a desire to implement. The level of community climate collaboration is captured through monitoring the Community Climate Action Hubs (CCAH) and Local Place Plans.
- Health is embedded in all the areas of SNAP3. This makes it difficult to have a general indicator linking health to climate-related hazards and issues, such as heatwaves, cold, flooding, vector-borne diseases, and food systems. This could only be captured by a fuller set of indicators focusing on health and well-being. A dataset measuring climate morbidity in Scotland could be relevant as a future outcome indicator for SNAP4 should suitable data become available. For this indicator set, a focus on wellbeing is taken using national data on the Warwick-Edinburgh Mental Wellbeing Scale (WEMWBS).
Communities – proposed indicators
When setting out to develop a list of indicators for the Communities outcome, we aimed to cover aspects of community resilience, health, and equity. Of the four indicators selected for this outcome, three indicators reflected the community resilience aspect (level of community awareness; level of community climate action; and progress of actions in local flood risk management plans). There was a particular challenge in capturing the complexity of health and equity in relation to climate adaptation with only a few high-level indicators in this framework. Instead of health, a focus on community wellbeing was taken with the use of national data on the Warwick-Edinburgh Mental Wellbeing Scale (WEMWBS). With elements of health and equity not explicitly covered, we have instead put onus on using established indicators and available data to monitor levels of community action in creating resilient, healthy, and equitable places. Monitoring this level of community action, be it in increased community awareness, the growth of Community Climate Action Hubs (CCAH) and Local Place Plans (LPP) or in specific community actions around flood management, provides important insight on how communities are adapting to climate change.
The proposed indicators are:
- Level of community awareness around climate change
- Level of community climate action
- Progress of actions in local flood risk management plans
- Level of community wellbeing.
Below we present the baseline information for each of the four indicators proposed to monitor the Communities outcome. For each indicator, we provide the baseline value, a description of the baseline, the recent trend and desired trend for each indicator to provide context. More information on baseline data is available in Annex 5. This is followed by a further detailed summary of each indicator and the rationale for their inclusion.
Communities – baseline
Proportion of adults viewing climate change as an immediate and urgent problem
- Description: In 2022, 74% of adults viewing climate change as an immediate and urgent problem.
- Recent trends: The Scottish population concerned about climate change representing an immediate and urgent problem has risen every year since 2013, where 46% held this view. In 2017, 61% held this view.
- Baseline: 74%
- Desired trend: Increase
Proportion of the population declaring that they understand what actions they should take to help tackle climate change
- Description: In 2022, 80% of adults agreed that they understood what actions they should take to help tackle climate change.
- Recent trends: In 2018, 74% of adults stated they understood what actions they should take to help tackle climate change.
- Baseline: 80%
- Desired trend: Increase
Number of Community Climate Action Hubs
- Description: In 2024, 20 hubs across Scotland support community-led climate action, covering 81% of the Scottish council areas.
- Recent trends: The first two hubs launched in September 2021 and the network has now expanded, consisting of the 20 hubs.
- Baseline: 81%
- Desired trend: Increase
Number of Local Place Plans
- Description: In 2024, no local place plans have been adopted.
- Recent trends: Many councils have recently invited communities to prepare Local Place Plans so that they can play a proactive role in defining the future of their places.
- Baseline: 0
- Desired trend: Increase
Progress of actions in local flood risk management plans
- Description: In 2019, 90% of the actions to avoid an increase in flood risk were complete. By 2021, 100% of the actions were expected to be complete. In 2019, 84% of the actions to reduce flood risk were complete. By 2021, 96% of the actions were expected to be complete.
- Recent trends: progress was assessed for cycle 1 (2015-2021).
- Baseline: 90% (completed actions to avoid an increase in flood risk), 84% (completed actions to reduce flood risk)
- Desired trend: Increase
Level of community wellbeing
- Description: In 2022, the mean WEMWBS score for all adults was 47.0
- Recent trends: The mean WEMWBS score for all adults remained stable between 2008 and 2019, between 49.4 and 50.0. Since 2019, it has decreased to 48.6 in 2021 and now 47.0 in 2022.
- Baseline: 47.0
- Desired trend: Increase
Communities – indicator summaries
Community awareness around climate change
|
Indicator |
Level of community awareness around climate change |
|
Description |
This indicator is measured by the following:
|
|
Data set holder |
Scottish Household Survey |
|
Unit |
% |
This indicator is chosen as it combines the knowledge of what is required to tackle climate change with the perception of urgency in addressing climate change. This combination is a critical aspect of community resilience. A well-informed community that recognises the urgency of climate action is more likely to engage in adaptive behaviours (Marshall et al., 2013; Shi et al., 2016). This indicator provides insights into the adaptive capacity of communities and their readiness to implement adaptation measures.
Community action on climate change
|
Indicator |
Level of community climate action |
|
Description |
This indicator covers the number of Community Climate Action Hubs (CCAH) and Local Place Plans in Scotland. Community Climate Action Hubs are centers that support local initiatives focused on climate resilience, providing resources, education, and networking opportunities to empower communities in addressing climate challenges. This indicator will look at the percentage across all Scotland’s regions that have at least one CCAH. Local Place Plans are community-led plans that detail the aspirations and priorities of residents for the development and improvement of their areas, ensuring that local voices are integrated into the broader planning process. |
|
Data set holder |
Scottish Government |
|
Unit |
CCAH – % / LPP – Number |
This indicator was selected as the number of Community Climate Action Hubs in Scotland indicates strong community resilience. This is done through fostering local engagement, resource distribution, capacity building, innovation, network-building, and policy advocacy for climate adaptation (Agrawal, 2008). Local Place Plans act as a good proxy for community-led collaboration and action. The data is available and how the hubs and plans relate to action is understandable to wider audiences.
Community flood resilience
|
Indicator |
Progress of actions in local flood risk management plans |
|
Description |
This indicator measures the progress of actions to reduce or avoid flooding set in the Flood Management Plans. |
|
Data set holder |
The 14 lead local authorities in charge of local Flood Risk Management Plans |
|
Unit |
% of actions completed |
This indicator focuses on actions of local authorities to build community flood resilience. It emphasises the importance of communities playing an active role in reducing the impact of climate change effects, in this case increased flooding (McEwen et al., 2014). This aspect is a key part of communities creating climate-resilient, healthy, and equitable places. These flood risk management plans are part of Scotland’s route map for reducing the effects of flooding on communities. This is key to Scotland’s health, wellbeing and economic success, with an estimated 284,000 homes, businesses and services identified as at risk of flooding.
Community wellbeing
|
Indicator |
Level of community wellbeing |
|
Description |
This indicator measures adults (aged 16+) average score on the Warwick-Edinburgh Mental Wellbeing Scale (WEMWBS). The WEMWBS scale comprises 14 positively worded statements designed to assess positive affect, satisfying interpersonal relationships and positive functioning. |
|
Data set holder |
Scottish Health Survey |
|
Unit |
Mean score on WEMWBS scale |
This indicator captures the extent of wellbeing within communities. Evidence shows that experience of the effects of climate change, for example a flooding event, and the capacity to adapt or react to it has a direct impact on mental health (Berry et al., 2018; Palinkas & Wong, 2020). Therefore, it is representative of communities and their health in relation to adaptation.
Public services are collaborating in effective and inclusive adaptation action
Overview
This outcome addresses the need for public services to collaborate effectively on adaptation. It aims to enhance governance, culture, skills and resources within public services to enable effective adaptation. Key actions include strengthening the Public Sector Climate Adaptation Network, modernising water industry adaptation and embedding adaptation across transport networks. This approach seeks to ensure continued delivery of essential services and infrastructure resilience amidst climate change. Figure 5 presents the SNAP3’s pathway from objectives to outcome and impact for Public Services.[5]
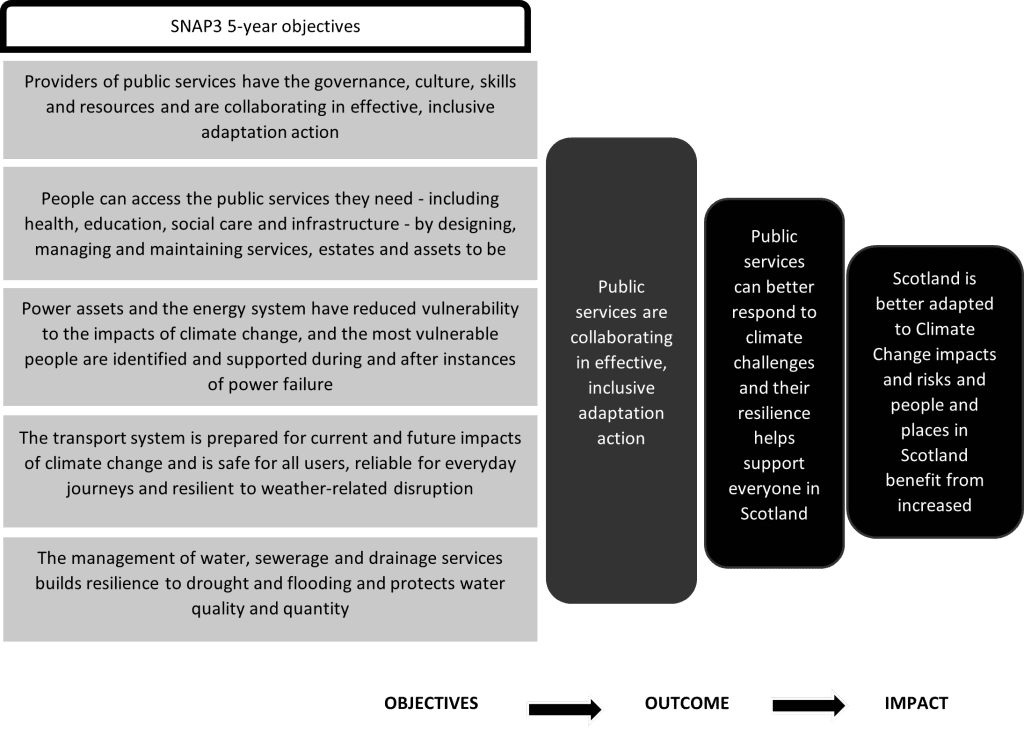
Considerations for indicator selection
Following the desk-based review and stakeholder engagement, several considerations emerged regarding indicator selection for the Public Services outcome:
- We determined that focusing on specific sectoral indicators related to the adaptation of critical infrastructure would result in numerous indicators. This would go against a core aim of our work to develop a concise and clear set of indicators. As discussed, the Scottish Government’s work developing indicators at an objective level has taken place alongside development of the outcome indicators presented in this report. Specific sectoral indicators have been determined at the objective level rather than being included in the high-level outcome indicators developed through this work.
- We explored the possibility of an indicator around participation levels at a recently established infrastructure adaptation forum. However, the objectives and the ambitions of this forum are still at an early stage and it was not possible to determine a baseline, so it was not included here.
- Collaboration is an important aspect of this outcome. The extent of collaboration of public service bodies is captured through the Sustainable Scotland Network annual report. The quality of collaboration is equally as important to capture. However, there is currently insufficient data available to incorporate this element within the outcome indicators.
Public services – proposed indicators
When setting out to develop a list of indicators for the Public Services outcome, we aimed to cover the extent of collaboration between public services, as well as the extent of effective and inclusive adaptation. These indicators use data available to capture high-level insights on the extent of public sector collaboration and adaptation actions that public bodies are taking. These indicators do not cover the extent to which these actions are effective or inclusive. Ultimately, this can only be captured at a sector-specific level, as no generalised metric for effectiveness or inclusiveness of public services and infrastructure exists. It was not possible to go to the level of sector-specific indicators for public services and infrastructure as this would result in numerous indicators.
The proposed indicators are:
- Level of collaboration across public services
- Level of adaptation actions across public services.
Below we present the baseline information for each of the two indicators proposed to monitor the Public Services outcome. For each indicator, we provide the baseline value, a description of the baseline, the recent trend and desired trend for each indicator to provide context. More information on baseline data is available in Annex 5. The is followed by a further detailed summary of each indicator and the rationale for their inclusion.
Public services – baseline
This section presents baseline information. For each indicator, we provide the baseline value, a description of the baseline, the desired trend for each indicator and recent trends for each baseline to provide context.
Number of public bodies members in the Public Sector Climate Adaptation Network
- Description: In 2024, the Public Sector Climate Adaptation Network counted 50 members.
- Recent trends: the Public Sector Climate Adaptation Network was launched in 2019 with 40 major organisations. 10 additional 10 organisations joined the Network in October 2023.
- Baseline: 50
- Desired trend: Increase
Number of public bodies citing the Work in partnership & collaborations as a priority for the year ahead in relation to climate change adaptation
- Description: In 2022-2023, 53.2% of the 188 listed public bodies (100 public bodies) submitting an annual compliance report cite “Work in Partnerships & Collaborations” in their top five priorities for the year ahead in relation to climate change adaptation.
- Recent trends: In 2021/22, 36.2% of public bodies declared that they prioritized “Work in Partnerships & Collaborations”.
- Baseline: 53.2%
- Desired trend: Increase
Level of risk assessment across the public sector
- Description: 70.2% of the public bodies submitting an annual compliance report have completed some form of risk assessment during or prior to the 2022/23 reporting period. 43.6% of bodies have carried out a limited risk assessment. 20.7% of bodies have carried out a comprehensive risk assessment. 5.8% have completed an advanced risk assessment, involving stakeholders and considering a range of climate or socioeconomic scenarios.
- Recent trends: In 2021/22 reporting, 66.0% of public bodies submitted some form of adaptation risk assessment.
- Baseline:
- Limited risk assessment: 43.6%
- Comprehensive risk assessment: 20.7%
- Advanced risk assessment: 5.8%
- Desired trend: Increase
Level of adaptation action taken across the public sector
- Description: 71.8% of all listed public bodies submitting an annual compliance report have taken adaptation action during or prior to the 2022/23 reporting period. 44% of bodies have taken some action, 21% of all bodies are taking good action. 6% of bodies are taking advanced action.
- Recent trends: In 2021/22 reporting, 67.0% of public bodies reported taking some form of action on adaptation.
- Baseline:
- Some actions taken: 44%
- Good action taken: 21%
- Advanced action taken: 6%
- Desired trend: Increase
Public Services – indicator summaries
Level of collaboration across public services
|
Indicator |
Level of collaboration across public services |
|
Description |
This indicator is a combination of:
and
|
|
Data set holder |
Adaptation Scotland and Sustainable Scotland Network on behalf of Scottish Government |
|
Unit |
This indicator is selected as a proxy to demonstrate the level of collaborative effort between different public bodies on shared outcomes and priorities. Collaboration is vital to tackling the complex challenges involved in strengthening climate resilience. Effective collaboration can enhance adaptive capacity, reduce vulnerability, and ensure a cohesive response to climate change (Runhaar et al., 2018).
Level of adaptation actions across public services
|
Indicator |
Level of adaptation actions across public services |
|
Description |
This indicator is measured by the following:
This indicator is a combination of two pieces of information reported by 188 public bodies according to Section 44 of the Climate Change (Scotland) Act 2009. The level of risk assessment (none, limited, comprehensive, advanced) and of adaptation action (none, some, good, advanced) taken across the public sector are assessed. The Sustainable Scotland Network manages the annual reporting process and analyses the returns on behalf of the Scottish Government. |
|
Data set holder |
Sustainable Scotland Network on behalf of the Scottish Government |
|
Unit |
% |
This indicator captures the level of climate adaptation actions undertaken by public bodies. The public sector must assess and address climate risks through adaptation planning and action to ensure the quality of its services to the population in a changing climate (Runhaar et al., 2018). By monitoring the level of risk assessment and adaptation actions, this indicator provides insights into the preparedness and resilience of public services.
Economies and industries are adapting and realising opportunities in Scotland’s Just Transition.
Overview
This outcome focuses on adapting the economy and industries to realise opportunities in Scotland’s Just Transition. It aims to support businesses in understanding and responding to climate risks, whilst fostering innovation in adaptation solutions. Key actions include increasing business awareness of climate risks, supporting adaptation in sectors like farming and forestry, and promoting Scotland as an innovation hub for adaptation solutions. This approach seeks to ensure Scotland’s economy remains competitive and resilient whilst capitalising on emerging opportunities. Figure 6 presents SNAP3’s pathway from objectives to outcome and impact for Economy, Business and Industry.[6]
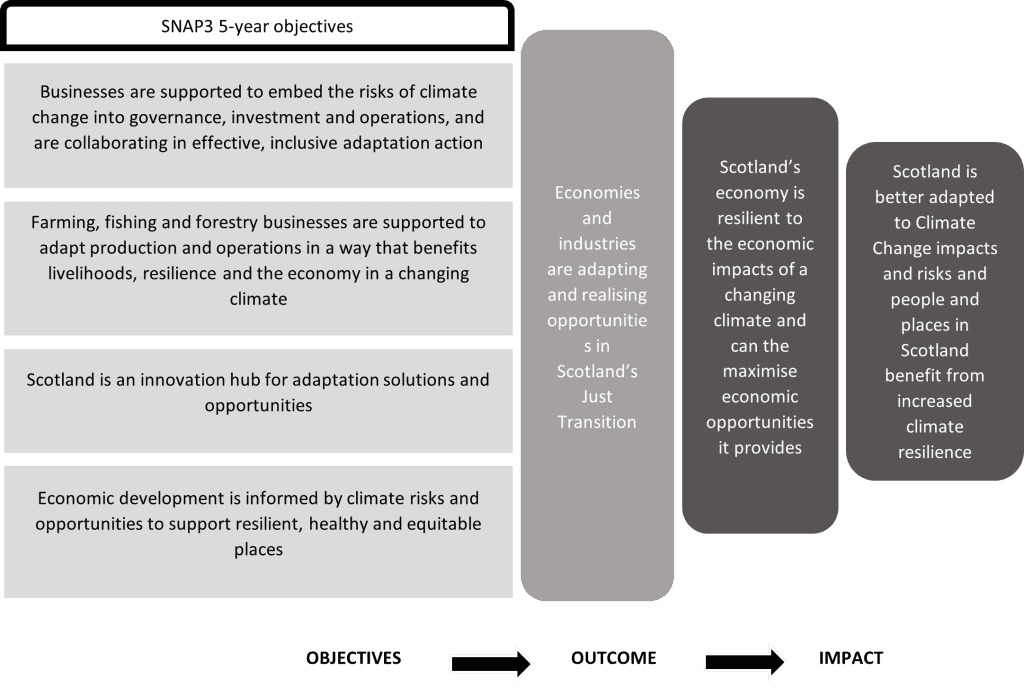
Considerations for indicator selection
Following the desk-based review and stakeholder engagement, several considerations emerged regarding indicator selection for the Economy, Business and Industry outcome:
- Investments in climate resilience, with a specific taxonomy for adaptation-related investment, was considered a potential indicator. Such a taxonomy would prove a useful indicator for how the economy is adapting to climate change. However, while initiatives are emerging, this has not been fully implemented at national level yet. It is something to consider for inclusion in the next SNAP.
- The direct economic loss associated with climate-related hazards, such as flooding was considered. Some stakeholders felt that many businesses could be reluctant to invest in resilient infrastructure because its benefits are not easily quantified. Capturing direct loss associated with climate-related hazards helps industries understand the value of investments in adaptation. Nevertheless, no viable dataset currently exists for such an indicator in the Scottish context.
- An indicator on green jobs is included in the indicator set. However, it does not capture the development of adaptation skills needed by existing Scottish businesses to address the challenges of climate change. Training employees to increase adaptation knowledge and skills specific to the needs of individuals or businesses is an important aspect that is not captured as no viable dataset currently exists.
- Sustainable practice in the agriculture sector is the focus of one indicator, given it accounts for 69% of Scotland’s total land use. Another area of the economy initially considered was the forestry sector. An indicator “percentage of certified woodland area in Scotland” was considered. However, considering that certification mostly applies to woodlands used for timber production and not woodlands more generally, the coverage of this indicator was considered too limited.
- The proportion of agricultural land categorised as High Nature Value (HNV) Farming has initially been chosen as a proxy of adaptation to climate change in agriculture in Scotland. High Nature Value (HNV) Farming is an indicator used to identify agricultural systems that support high levels of biodiversity through low-intensity, traditional farming practices. HNV farms are more likely to be resilient to climate variability and extreme weather events. However, this indicator was not selected because the latest baseline is from 2013 and has not been updated since then. Should new data become available this indicator could be reviewed in the future.
- Capturing innovation in Scotland’s economy was considered as an important aspect of this outcome. However, given the broad scope, complexity and subjectivity around what constitutes innovation, it is a difficult aspect to capture in a single quantitative indicator and is, therefore, not included.
Economy, Business and Industry – proposed indicators
It is important that the indicators cover the preparedness and adaptation of businesses and industries and the extent into which they take advantage of economic opportunities linked to climate change. The five indicators selected cover business preparedness and action using data periodically recorded by the Business Insights and Conditions Survey. The use of Office of National Statistics (ONS) data on green jobs provides an indicator for the transition towards a climate-smart economy and workforce skills development for the green economy. Another indicator focused specifically on adaptation action in the agricultural sector, which is a significant part of the Scottish economy. Taken together, this set of indicators uses available data to provide a broad indication of whether Scotland’s economy is adapting to climate change. Nevertheless, there are some key aspects that are not covered. These include levels of investment in climate adaptation initiatives and economic resilience (e.g., economic loss related to climate-related hazards) as well as the level of innovation from businesses in responding to climate risks.
The proposed indicators are:
- Proportion of businesses monitoring climate-related risks
- Proportion of businesses taking action to adapt to the effects of climate change
- Number of green jobs
- Uptake of grants for agriculture storage reservoirs and off-season storage lagoons.
Below we present the baseline information for each of the five indicators proposed to monitor the Economy, Business and Industry outcome. For each indicator, we provide the baseline value, a description of the baseline, the recent trend and desired trend for each indicator to provide context. More information on baseline data is available in Annex 5. This is followed by a further detailed summary of each indicator and the rationale for their inclusion.
Economy, Business and Industry – baseline
Proportion of businesses monitoring climate related risks
- Description: In 2023, 15.6% of Scotland businesses have assessed risks for supply chain disruption and distribution, 6.2% for increased flooding and 4.4% for temperature increase.
- Recent trends: August 2023 was the first time the question related to businesses monitoring climate related risks was asked.
- Baseline:
- Supply chain disruption: 15.6%
- Increased flooding: 6.2%
- Temperature increase 4.4%
- Desired trend: Increase
Proportion of businesses taking action to adapt to the effects of climate change
- Description: In 2023, 26.5% of Scotland businesses have taken action to adapt supply chain disruption and distribution, 11.5% to adapt to increased flooding and 4.4% to adapt to temperature increase.
- Recent trends: August 2023 was the first time the question related to businesses taking adaptation action was asked.
- Baseline:
- Supply chain disruption: 25.6%
- Increased flooding: 11.5%
- Temperature increase 5.7%
- Desired trend: Increase
Number of green jobs
- Description: In 2022, Scotland employment in green jobs in 2022 was estimated at 46,200 full-time equivalents (FTEs).
- Recent trends: This number has increased yearly since 2015 (32,800 FTE), except between 2021 and 2022.
- Baseline: 46,200
- Desired trend: Increase
Uptake of grants for agriculture irrigation lagoons
- Description: In 2024, 5 AECS applications for irrigation lagoons were successful. 14 applications were submitted.
- Recent trends: the number of applications submitted and successful are usually between 0 and 2 per year.
- Baseline: 5
- Desired trend: Increase
Economy, Business and Industry – indicator summaries
Business awareness of climate adaptation
|
Indicator |
Proportion of businesses monitoring climate related risks |
|
Description |
This indicator is a survey question from the Business Insights and Conditions Survey. |
|
Data holder |
Office for National Statistics |
|
Unit |
% |
This indicator captures the level of knowledge and awareness of climate-related risks by businesses. Ensuring businesses across Scotland are aware of the risks that climate change may pose to their operations, premises, staff, and supply chains is a crucial component of a climate resilient economy (Linnenluecke et al., 2013; Surminski, 2013).
Business preparedness in climate adaptation
|
Indicator |
Proportion of businesses taking action to adapt to the effects of climate change |
|
Description |
This indicator is a survey question from the Business Insights and Conditions Survey. |
|
Data holder |
Office for National Statistics |
|
Unit |
% |
This indicator captures businesses’ capacity to respond to the risks posed by climate change. Ensuring businesses across Scotland have a plan to face the risks climate change may pose to their operations, premises, staff and supply chains will be crucial to building a more climate resilient economy (Linnenluecke et al., 2013; Surminski, 2013).
Green jobs in the Scottish economy
|
Indicator |
Total Scotland employment in green jobs |
|
Description |
This indicator looks at green jobs, as defined as “employment in an activity that contributes to protecting or restoring the environment, including those that mitigate or adapt to climate change”; they can be estimated using industry, occupation, and firm approaches. This indicator follows an industry-based approach which includes all jobs in a green industry or sector and provides our headline estimate of employment in green jobs. |
|
Data holder |
Office for National Statistics |
|
Unit |
Number |
This indicator monitors the adaptation opportunity in Scotland’s Just Transition as it directly tracks employment in environmentally sustainable sectors. This indicator reflects the economic growth and industry shift towards sustainable practices, essential for climate adaptation and effective Just Transition (Martinez-Fernandez et al., 2010).
Agriculture water-use efficiency
|
Indicator |
Uptake of grants for agriculture irrigation lagoons |
|
Description |
This indicator follows the number of applied and approved agricultural projects (AECS) to improve water-use efficiency by collecting and storing water in an irrigation lagoon. |
|
Data set holder |
Scottish Government |
|
Unit |
Number of applications and approved grants |
This indicator represents proxy of adaptation by the agricultural sector. Improving water storage efficiency through irrigation lagoons is a strategic adaptation measure that addresses several challenges posed by climate change: it helps mitigate the variability of rainfall patterns and allow farmers to store water during periods of excess rainfall to ensure a steady water supply for crops. It will also contribute to reduce the stress on Scotland’s water resources and reduce flood risk at times by capturing and storing excess rainfall runoff (Schmitt et. al., 2022).
Discussion
Conclusions
Climate adaptation is complex and multifaceted, spanning across sectors and scales. Therefore, MEL of climate adaptation will always be challenging. Nevertheless, monitoring the extent to which an adaptation plan’s outcomes are achieved is essential to understand the effectiveness of its associated activities and policies. Ultimately, efforts to monitor adaptation plans, such as SNAP3, must navigate this complexity, seeking a balance of indicators that is relevant, robust, and practical to implement. We have sought to achieve this balance by taking a systematic approach to the selection of indicators through desk-based review and extensive engagement with stakeholder groups across Scottish governmental departments and associated organisations. The assessment has been grounded in the practical reality of what data is available rather than theoretically ideal indicators.
In relation to the relevance and robustness of indicators, we have developed outcome indicators that efficiently capture most of the core elements of four of SNAP3’s outcomes.
For the Nature Connects outcome, the indicators proposed cover ecological connectivity, ecological health, and urban-nature connection. Taken together, these indicators will provide useful insights on progress in securing the resilience of Scotland’s natural ecosystems to climate change. Lack of an indicator specifically for marine ecosystems, due to inadequate available data, is a key, is a key limitation.
For the Communities outcome, capturing health and equity in high-level, generalised indicators was challenging due to the complexity of these issues. Therefore, the proposed indicators focus on monitoring community action of relevance to climate adaptation.
For the Public Services outcome, the proposed indicators focus upon collaboration and adaptation actions at a high-level. It was impractical to address the effectiveness of actions, as the number of different sectors associated with this outcome would result in numerous indicators.
For the Economy, Business, and Industry outcome, the indicators proposed cover areas of business preparedness and action, the extent of the transition to green economy, and the extent to which an important sector of the economy (agriculture) is undertaking climate adaptation. While acknowledging that the level of investment in climate adaptation initiatives and economic losses resulting from climate-related hazards is not addressed, these indicators will still provide useful insights about the delivery of this outcome.
Regarding practical implementation, the proposed indicators redeploy established indicators that, crucially, are based on accessible data. Most are publicly reported, although some require correspondence with the relevant Scottish Government data holder. The proposed indicators allow for a baseline to be established at the start of SNAP3 and then reported against after a five-year period. There is variation on the extent of historic data available across the indicators; there; there is more extensive data on previous trends for some than others. Importantly, we believe the relevance of proposed indicators is clear and they are straightforward to apply. As such, they can be used at the end of the five-year period by those who have not been closely involved in their development.
The stakeholder engagement process was critical in the development of the outcome indicators. A wide range of relevant stakeholders across Scotland engaged in one-to-one calls, workshops or written feedback to provide insights both conceptually on what indicators might capture SNAP3 outcomes and practically on what data are available. This engagement provided sector- and topic-specific knowledge, as well as offering validation of the final proposed set of indicators. Several themes emerged from this process of engagement. First, there was an inherent tension between what is ideal and what is possible. Discussions sometimes veered more towards enthusiasm about theoretically ideal indicators that monitor outcomes rather than being grounded in the practical reality of what data is available. While this certainly did not negate the importance of discussing ideal indicators, it was important to ensure, insofar as possible, that an onus on what is practically possible influenced the discussion.
Second, often data limitations lay at the heart of challenges regarding identification of suitable indicators. The limitations took different forms: no data existed (e.g., economic loss from climate-related hazards); it was insufficiently captured (e.g., marine species’ abundance); or it was not easy to access or publicly available (e.g., data on Build Back Better grants). It is not uncommon for data limitations to be a significant obstacle to developing indicators for climate adaptation (Vallejo, 2017).
Third, the SNAP3 outcomes are structured in a clearly defined way, which was beneficial for developing the set of proposed indicators, these outcomes overlap in ways that should be acknowledged. One example relates to the Communities outcome and the Public Services outcome, as collaboration is of significance for both community resilience and for effective public services. Hence, community actors and public service actors cannot be clearly distinguished from each other. Another example is the emphasis of Nature Connects outcome on access to green space and associated health benefits that overlaps with the community health and wellbeing aspects of the Communities outcome. Such overlaps are not inherently problematic but did point to the need for the net to be cast as wide as possible when considering stakeholder engagement for when identifying indicators.
Recommendations
Several recommendations and next steps emerge from this work. It is important to finalise the outcome indicators for SNAP3 as soon as possible, as applying these indicators consistently will be crucial to enable meaningful comparisons against the baseline. Any changes made to individual indicators or the data that underpin them may compromise the ability to track progress consistently relative to the baseline. Furthermore, it is important to maintain continuity, quality and availability of data required by each indicator. It is vital to maintain the allocation of resources to the collection, maintenance and accessibility of datasets used by the indicators across all relevant Scottish Government departments.
Whilst the indicators represent a complete and operational indicator set, there should be a flexibility regarding potential for additional indicators. New indicators may be added in the immediate term if relevant data becomes available. For example, an ecosystem functions indicator for Nature Connects or a green finance investment indicator for Economy, Business, and Industry are anticipated in the near future. While the suite of indicators addresses the needs for monitoring the outcomes of SNAP3, it may be viewed as a foundation to build upon regarding monitoring of SNAP4.
Lastly, we recommend establishing a working group to sustain the functioning of the indicators. The working group could comprise key stakeholders and data providers who could meet annually to review the functioning of the indicators and address any issues regarding their deployment, e.g., continuity and availability of data and its quality. Furthermore, this working group would build on the strong interest evident across a wide range of stakeholders to engage in the topic of climate adaption MEL.
References
Agrawal, A. (2008). The role of local institutions in adaptation to climate change. In Social Dimensions of Climate Change: Equity and Vulnerability in a Warming World (pp. 173-198). World Bank.
Beauchamp, E. & Józefiak, I., 2023. Breaking the Glass Ceiling at COP 28: Four key elements to ensure a successful global goal on adaptation. International Institute for Sustainable Development. Available at: https://www.iisd.org/publications/report/global-goal-on-adaptation-monitoring-evaluation-learning-framework-cop-28 [Accessed 16 July 2024].
Beauchamp, E., Leiter, T., Pringle, P., Brooks, N., Masud, S., and Guerdat, P., 2024. Toolkit for Monitoring, Evaluation, and Learning for National Adaptation Plan Processes. NAP Global Network. Available at: https://www.adaptation-undp.org/sites/default/files/resources/internal_brief_transparency-mrv-me-april202249_adjusted_doc_revised.pdf [Accessed 16 July 2024].
Berry, H. L., Waite, T. D., Dear, K. B., Capon, A. G., & Murray, V. (2018). The case for systems thinking about climate change and mental health. Nature Climate Change, 8(4), 282-290.
Biden, A., 2022. 5 Smart Indicators in Monitoring and Evaluation. tools4dev. Available at: https://tools4dev.org/blog/smart-indicators-in-monitoring-and-evaluation/ [Accessed 16 July 2024].
Climate Change Committee (CCC), 2022, Is Scotland Ready? 2022 Report to Scottish Parliament. Available at: https://www.theccc.org.uk/publication/asc-writes-to-scottish-government-about-outcomes-based-approach-for-the-sccap/
Climate Change Committee, 32023. Adapting to climate change – Progress in Scotland. Climate Change Committee. Available at: https://www.theccc.org.uk/publication/adapting-to-climate-change-progress-in-scotland/ [Accessed 16 July 2024].
Demuzere, M., Orru, K., Heidrich, O., Olazabal, E., Geneletti, D., Orru, H., Bhave, A.G., Mittal, N., Feliu, E. & Faehnle, M. (2014) Mitigating and adapting to climate change: multi-functional and multi-scale assessment of green urban infrastructure, Journal of Environmental Management, 146, pp. 107–115.
Food and Agriculture Organization of the United Nations (FAO), 2017. Tracking adaptation in agricultural sectors. FAO. Available at: https://www.fao.org/policy-support/tools-and-publications/resources-details/en/c/1193260/ [Accessed 16 July 2024].
Global Environmental Facility (GEF), 2016. Monitoring and Evaluation of Climate Change Adaptation. Global Environment Facility. Available at: https://www.thegef.org/sites/default/files/council-meeting-documents/EN_GEF.STAP_.C.51.Inf_.03_M%26E_of_CCA.pdf [Accessed 16 July 2024].
Gabbatiss, J. & Lempriere, M., 2024. Bonn climate talks: Key outcomes from the June 2024 UN climate conference. Carbon Brief. Available at: https://www.carbonbrief.org/bonn-climate-talks-key-outcomes-from-the-june-2024-un-climate-conference/ [Accessed 16 July 2024].
Gill, S. E., Handley, J. F., Ennos, A. R., & Pauleit, S. (2007). Adapting cities for climate change: the role of the green infrastructure. Built Environment, 33(1), 115-133.
Haddad, N.M., Brudvig, L.A., Clobert, J., Davies, K.F., Gonzalez, A., Holt, R.D., Lovejoy, T.E., Sexton, J.O., Austin, M.P., Collins, C.D., Cook, W.M., Damschen, E.I., Ewers, R.M., Foster, B.L., Jenkins, C.N., King, A.J., Laurance, W.F., Levey, D.J., Margules, C.R., Melbourne, B.A., Nicholls, A.O., Orrock, J.L., Song, D.X. & Townshend, J.R. (2015) Habitat fragmentation and its lasting impact on Earth’s ecosystems, Science Advances, 1(2), e1500052
Krosby, M., Tewksbury, J., Haddad, N. M., & Hoekstra, J. (2010). Ecological connectivity for a changing climate. Conservation Biology, 24(6), 1686-1689.
Linnenluecke, M.K., Griffiths, A. & Winn, M.I. (2013) Firm and industry adaptation to climate change: a review of climate adaptation studies in the business and management field, Wiley Interdisciplinary Reviews: Climate Change, 4(5), pp. 397–416.
Maas, J., Verheij, R.A., Groenewegen, P.P., de Vries, S. & Spreeuwenberg, P. (2006) Green space, urbanity, and health: how strong is the relation?, Journal of Epidemiology & Community Health, vol. 60, no. 7, pp. 587–592.
Mäkinen, K., Prutsch, A., Karali, E., Leitner, M., Völler, S., Lyytimäki, J., Pringle, P., and Vanneuville, W., 2018. Indicators for adaptation to climate change at national level – Lessons from emerging practice in Europe. European Topic Centre on Climate Change impacts, Vulnerability and Adaptation (ETC/CCA) Technical paper 2018/3. DOI: 10.25424/CMCC/CLIMATE_CHANGE_ADAPTATION_INDICATORS_2018.
Marshall, N. A., Park, S. E., Howden, S. M., Dowd, A. B., & Jakku, E. S. (2013). Climate change awareness is associated with enhanced adaptive capacity. Agricultural Systems, 117, 30-34.
Martinez-Fernandez, C., Hinojosa, C. & Miranda, G. (2010) Green jobs and skills: The local labour market implications of addressing climate change, OECD Local Economic and Employment Development (LEED) Working Papers, 2010/02, OECD Publishing, Paris.
McEwen, L., Jones, O. & Robertson, I. (2014), ‘A glorious time?’ Some reflections on flooding in the Somerset Levels, The Geographical Journal, 180(4), pp. 326-337.
McGranahan, G., Balk, D., & Anderson, B. (2007). The rising tide: assessing the risks of climate change and human settlements in low elevation coastal zones. Environment and Urbanization, 19(1), 17-37.
Moss, A., 2019. A monitoring and evaluation framework for the second SCCAP. ClimateXChange. Available at: https://www.climatexchange.org.uk/publications/a-monitoring-and-evaluation-framework-for-the-second-sccap/ [Accessed 16 July 2024].
New, M., Reckien, D., Viner, D., Adler, C., Cheong, S.-M., Conde, C., Constable, A., Coughlan de Perez, E., Lammel, A., Mechler, R., Orlove, B., and Solecki, W., 2022. Decision-Making Options for Managing Risk. In: Pörtner, H.-O., Roberts, D.C., Tignor, M., Poloczanska, E.S., Mintenbeck, K., Alegría, A., Craig, M., Langsdorf, S., Löschke, S., Möller, V., Okem, A., and Rama, B. (eds.) Climate Change 2022: Impacts, Adaptation and Vulnerability. Contribution of Working Group II to the Sixth Assessment Report of the Intergovernmental Panel on Climate Change. Cambridge University Press, Cambridge, UK and New York, NY, USA, pp. 2539–2654, doi:10.1017/9781009325844.026.
Organisation for Economic Co-operation and Development (OECD), 2015. National Climate Change Adaptation: Emerging Practices in Monitoring and Evaluation. OECD Publishing, Paris. Available at: http://dx.doi.org/10.1787/9789264229679-en [Accessed 16 July 2024].
Peter, S., & Peter, F., 2009. Evaluation of Indicators for EU Policy Objectives. Ecologic Institute. Available at: https://www.ecologic.eu/sites/default/files/publication/2016/1901-research_note-d2-1-evaluation-of_indicators-for-eu-policy-objectives-2009.pdf [Accessed 16 July 2024].
Palinkas, L. A., & Wong, M. (2020). Global climate change and mental health. Current Opinion in Psychology, 32, 12-16
Palmer, M. A., Lettenmaier, D. P., Poff, N. L., Postel, S. L., Richter, B., & Warner, R. (2009). Climate change and river ecosystems: protection and adaptation options. Environmental Management, 44(6), 1053-1068.
Runhaar, H., Wilk, B., Persson, Å., Uittenbroek, C., & Wamsler, C. (2018). Mainstreaming climate adaptation: taking stock about ‘what works’ from empirical research worldwide. Regional Environmental Change, 18, 1201-1210.
Sayers, PB., Lindley. S, Carr, S and Figueroa-Alfaro, R. W, 2021. The impacts of climate change on population groups in Scotland. Research undertaken by Sayers and Partners in association with the University of Manchester for ClimateXChange.
Schmitt, R.J. P., Rosa, L., Daily, G. (2022), ‘Global expansion of sustainable irrigation limited by water storage’, Proceedings of the National Academy of Sciences, 119 (47), https://doi.org/10.1073/pnas.2214291119.
Shi, J., Visschers, V.H.M., Siegrist, M. & Arvai, J. (2016) Knowledge as a driver of public perceptions about climate change reassessed, Nature Climate Change, 6, pp. 759–762.
Surminski, S. (2013) Private-sector adaptation to climate risk, Nature Climate Change, 3(11), pp. 943–945.
United Nations Development Programme (UNDP), 2022. Transparency, MRV, and M&E. United Nations Development Programme. Available at: https://www.adaptation-undp.org/sites/default/files/resources/internal_brief_transparency-mrv-me-april202249_adjusted_doc_revised.pdf [Accessed 16 July 2024].
United Nations Framework Convention on Climate Change (UNFCCC), 2024. Synthesis of submissions on the UAE – Belém work programme on indicators, Advance Unedited Version. UNFCCC. Available at: https://unfccc.int/documents/638384 [Accessed 16 July 2024].
United Nations Framework Convention on Climate Change (UNFCCC), 2023. Draft technical paper on monitoring and evaluation of adaptation at the national and subnational level (AC22). UNFCCC. Available at: https://unfccc.int/sites/default/files/resource/ac22_7c_monitoring_evaluation.pdf [Accessed 16 July 2024].
United States Environmental Protection Agency (EPA), 2017, . Development of a Climate Resilience Screening Index (CRSI): An Assessment of Resilience to Acute Meteorological Events and Selected Natural Hazards. EPA. Available at: https://cfpub.epa.gov/si/si_public_record_report.cfm?dirEntryId=335758 [Accessed 16 July 2024].
Vallejo, L. (2015). Insights from national adaptation monitoring and evaluation systems. In Mullan, M., Kingsmill, N., Agrawala, S. & Kramer, A.M. (eds) National Adaptation Planning: Lessons from OECD Countries. Springer, Cham. Available at: https://www.oecd.org/en/publications/2017/06/insights-from-national-adaptation-monitoring-and-evaluation-systems_d2e677fe.html [Accessed 16 July 2024].
Watson, J. E. M., Dudley, N., Segan, D. B., & Hockings, M. (2014). The performance and potential of protected areas. Nature, 515, 67-73.
Annexes
Annex 1 – Policies reviewed
The following policies were reviewed for sectorial indicators that could be relevant for the SNAP3 outcome indicators.
Scottish policies listed in the draft SNAP3 for the outcome area “Nature connects across our lands, settlements, coasts and seas”:
|
|
Scottish policies listed in the draft SNAP3 for the outcome area “Communities creating climate-resilient, healthy and equitable places”:
Scottish policies listed in the draft SNAP3 for the outcome area “Public services are collaborating in effective, inclusive adaptation action”:
Scottish policies listed in the draft SNAP3 for the outcome area “Economies and industries are adapting and realising opportunities in Scotland’s Just Transition”:
Annex 2 – Initial longlist of indicators
The initial longlist of indicators is listed below. This longlist was shared with stakeholders and revised through engagement as described in section 2.
Initial longlist of indicators for the outcome area “Nature connects across our lands, settlements, coasts and seas”:
|
|
|
|
|
|
|
|
|
|
|
|
Initial longlist of indicators for the outcome area “Communities creating climate-resilient, healthy and equitable places”:
|
|
|
|
|
|
|
|
|
|
|
Initial longlist of indicators for the outcome area “Public services are collaborating in effective, inclusive adaptation action”:
|
|
|
|
|
|
|
|
|
|
|
|
|
|
Initial longlist of indicators for the outcome area “Economies and industries are adapting and realising opportunities in Scotland’s Just Transition”:
|
|
|
|
|
|
|
|
|
|
Annex 3 – Workshop participation
The following organisations participated in the workshops.
Organisations represented in the workshop “Nature connects across our lands, settlements, coasts and seas”:
- Centre of Expertise for Waters
- Edinburgh Council
- Forestry and Land
- Glasgow City Council
- Highlands and Islands Airports
- James Hutton Institute
- Marine Directorate of Scottish Government
- National Centre for Resilience
- Nature Scot
- Public Health Scotland
- SEPA
- Scottish Government
- Scottish Water
- Sniffer
Organisations represented in the workshop “Communities creating climate-resilient, healthy and equitable places”:
- FloodRe
- Glasgow City Council
- National Centre for Resilience
- National Resilience Scotland
- Nature Scot
- Public Health Scotland
- Scottish Dynamic Coast
- Scottish Flood Forum
- Scottish Government
- Scottish Land Commission
- Scottish Waters
- Sniffer
- Strathclyde University
Organisations represented in the workshop “Public services are collaborating in effective, inclusive adaptation action”:
- Climate Change Committee
- Glasgow City Council
- MET Office
- Nature Scot
- Network Rail
- Public Health Scotland
- SEPA
- Scottish Flood Forum
- Scottish Government
- Scottish Water
- Sniffer
- Transport Scotland
- University of Strathclyde
Organisations represented in the workshop “Economies and industries are adapting and realising opportunities in Scotland’s Just Transition”:
- Climate Change Committee
- Forestry and Land Scotland
- Glasgow City Council
- Marine Directorate of Scottish Government
- Scottish Government
- SEPA
- Scottish Water
- Sniffer
Annex 4 – Indicator criteria
OUTCOME: Nature connects across our lands, settlements, coasts, and seas
ECOSYSTEM HEALTH AND CONNECTIVITY
Habitat Connectivity Index
|
Criterion |
Rating |
Assessment |
|
Adaptation Relevance |
Green |
This indicator addresses habitat connectivity and quality, which are important aspect for assessing the vulnerability of ecosystems to climate change. By evaluating how well species can move and adapt to changing conditions, the indicator provides valuable insights into the adaptive capacity of habitats. |
|
Representativeness |
Amber |
The indicator covers four key types of habitats: Woodland, Heathland, Grassland, and Fen/Marsh/Swamp – habitats that are representative of the broader landscape and crucial for maintaining ecological functions and services. However, the indicator does not cover freshwater, marine and coastal environments, and therefore has some limitations in its representativeness of indicating ecological health and connectivity. |
|
Data Availability |
Amber |
Data is collected by NatureScot. Data for CSGN area is publicly available on NatureScot’s website. However, data for the whole Scotland is provided directly by NatureScot and is not published online. |
|
Sensitivity |
Amber |
Updating this indicator every five years is considered a sensible frequency to observe meaningful changes in habitat connectivity. There may be a lag in reporting years, with data being published on average 2 years after. The up-to-date data may therefore not be available immediately at the end of the Plan. |
|
Understanding |
Green |
This indicator on habitat connectivity can be widely understood by a broad range of stakeholders in relation to improved ecological health and associated resilience. |
|
Baseline |
Green |
The indicator was last updated in 2022 for semi-natural grassland, heathland, and semi-natural woodland. Baseline maps are available on the Nature Scot website, providing a reference point for measuring changes over time. These baselines are crucial for assessing the progress and effectiveness of adaptation measures. The metric uses to calculate the habitat connectivity it is the Equivalent Connected Area (Probability of Connectivity), the ECA (PC). |
|
Practicality |
Green |
The data is publicly available and detailed by catchment area, making it practical for use in planning and decision-making processes. This accessibility ensures that stakeholders can utilize the information to enhance habitat connectivity and support climate adaptation strategies. The practical application of this data supports localized adaptation efforts and helps to mitigate the impacts of climate change on biodiversity and ecosystem services. |
Proportion of surface water bodies classified in good or better condition
|
Criterion |
Rating |
Assessment |
|
Adaptation relevance |
Green |
This indicator is relevant for climate adaptation as it addresses the quality and health of water ecosystems, which are critical for reducing vulnerability and enhancing adaptive capacity. By tracking the proportion of water bodies in good or high condition, this indicator provides insights into the resilience of water ecosystems and their capacity to adapt to changing climatic conditions. |
|
Representativeness |
Amber |
The indicator is broadly effective for monitoring ecological health as it encompasses key aspects of ecosystem quality. Although it has limitations due to its primary focus on surface water bodies, it can be used as a useful proxy for the status of broader ecological and biodiversity conditions. |
|
Data availability |
Green |
Full GIS data for this indicator is available on the SEPA website, ensuring that data is current and reliable. The data is updated every year by SEPA. |
|
Sensitivity |
Green |
Changes in water quality and ecosystem health can be noted over a five-year timescale interventions. |
|
Understanding |
Green |
This indicator on water quality can be widely understood by a broad range of stakeholders in relation to improved ecological health and associated resilience. |
|
Baseline |
Green |
The indicator is publicly available on SEPA’s website has an established baseline from 2007 to 2022. |
|
Practicality |
Green |
Statistical and mapping data for this indicator is already being collected and publicly accessible, making it practical to monitor as an indicator. |
Proportion of Scotland’s protected sites in favourable condition
|
Criterion |
Rating |
Assessment |
|---|---|---|
|
Adaptation relevance |
Green |
Protected sites play a role in improving the adaptive capacity of vulnerable species by providing safe havens with the functional network that species can migrate from or too. This indicator is relevant for climate adaptation as it directly relates to the resilience of ecosystems and their ability to adapt to changing environmental conditions. |
|
Representativeness |
Amber |
While the indicator is a useful proxy for ecological health and connectivity, its limitation should be noted. The indicator does not include offshore marine sites and features in Scotland beyond 12 nautical miles, and primarily focuses on protected sites and not all natural sites, which may limit its representativeness of the broader ecological health and connectivity. |
|
Data availability |
Green | |
|
Sensitivity |
Amber |
The indicator has shown longer-term changes, though it may not reflect notable changes within shorter periods, such as from 2023 to 2024. While a five-year timescale may be too short to observe long-term trends, the indicator is suitable to detect significant changes over longer periods. |
|
Understanding |
Green |
This indicator on condition of protected sites can be widely understood by a broad range of stakeholders in relation to improved ecological health and associated resilience. |
|
Baseline |
Green |
The indicator has an established baseline from 2005 to 2024, with historical data available for comparison. |
|
Practicality |
Green |
Statistical and mapping data for this indicator is already being collected and publicly accessible, making it practical to monitor as an indicator. |
Proportion of soft shorelines affected by coastal erosion
|
Criterion |
Rating |
Assessment |
|
Adaptation relevance |
Green |
Monitoring the extent of coastal erosion is relevant to climate adaptation as it reflects the efficacy of implemented adaptation measures in enhancing coastal resilience. |
|
Representativeness |
Green |
This indicator represents the coastal component of the Nature Connects outcome of the SNAP3. |
|
Data availability |
Amber |
Data is publicly available, however, it is not specifically stated how long the programme hosting the data is running for. |
|
Sensitivity |
Green |
Changes in this indicator are sufficient sensitive to the time-period of SNAP3. |
|
Understanding |
Green |
The connection between the extent of coastal erosion as a proxy for coastal adaptation to climate change is generally recognised. |
|
Baseline |
Green |
Baseline data available from 2017 and 2021. |
|
Practicality |
Green |
The indicator is publicly available on the Center of Expertise for Waters (CREW) website. It has been developed under the Dynamic Coast project. |
URBAN GREEN INFRASTRUCTURE
Extent of green-blue land cover in urban areas
|
Criterion |
Rating |
Assessment |
|---|---|---|
|
Adaptation relevance |
Green |
Green-blue land cover in urban areas reflects the extent of natural spaces in cities that provide crucial ecosystem services. It is relevant for climate adaptation as it captures how well cities are prepared to adapt to the challenges posed by climate change, making urban environments more sustainable and liveable. |
|
Representativeness |
Amber |
This indicator offers a good coverage of Scotland, with urban areas defined as those with a population more than 500. It covers public and private greenspaces, including woodland, open semi-natural, inland water, beach or foreshore, and manmade surface. It also distinguishes the different functions of greenspaces, such as public park or garden, school grounds, private garden, allotments, playing fields, etc. However, it does not cover the tree canopy over hard surfacing or green roofs, which are also relevant in terms of adaptation. |
|
Data availability |
Amber |
This dataset “OS MasterMap Greenspace Layer” is updated every 6 months by Ordnance Survey, but requires a licence to access it. |
|
Sensitivity |
Green |
Land use modification in urban areas can be noted over a five-year timescale. |
|
Understanding |
Green |
This indicator on green-blue land cover in urban areas can be widely understood by a broad range of stakeholders in relation to the extent of natural spaces in cities associated with resilience. |
|
Baseline |
Green |
This dataset “OS MasterMap Greenspace Layer” can be purchased on the Ordnance Survey website |
|
Practicality |
Amber |
Data is available in ESRI Shapefile, GML 3.2.1, GeoPackage and Vector Tiles format. The GIS map has to be purchased and analysed to be transformed to actual percentage. |
Proportion of adults who live within a five-minute walk of their nearest green or blue space
|
Criterion |
Rating |
Assessment |
|---|---|---|
|
Adaptation relevance |
Amber |
The indicator captures the distance to the nearest public or open space, but does not reflect the level of accessibility, the perception of safety people have toward the green and blue spaces nor the frequency of access. |
|
Representativeness |
Green |
The figures for this indicator come from the Scottish Household Survey (SHS). It covers the whole Scottish territory and includes people resident in Scotland aged 16 and over. The SHS sample has been designed to allow annual publication of results at Scotland level and for local authorities. To meet these requirements, the target sample size for Scotland was 10,450 household interviews with a minimum local authority target of 250. |
|
Data availability |
Green |
The data is published annually in the Scottish Household Survey Annual Report. |
|
Sensitivity |
Amber |
Changes in the proportion of adults who live within a five-minute walk of their local green or blue space can be noted over a five-year timescale. There is a lag in reporting years up to a maximum of one year (e.g. 2024 fieldwork ending in January 2025 with publication of results later in 2025) The up-to-date data will therefore not be available immediately at the end of the Plan. |
|
Understanding |
Green |
This indicator can be widely understood by a broad range of stakeholders. |
|
Baseline |
Green |
The figures for this indicator come from the Scottish Household Survey (SHS) which is a National Statistics product produced by the Scottish Government. This indicator is also part of the National Performance Framework. |
|
Practicality |
Green |
Statistical data for this indicator is already being collected and publicly accessible, making it practical to monitor as an indicator. |
OUTCOME: Communities are creating climate-resilient, healthy and equitable places.
Community awareness around climate change
|
Criterion |
Rating |
Assessment |
|
Adaptation relevance |
Amber |
This indicator is relevant for climate adaptation as it improves community adaptive capacity through knowledge enhancement. By understanding what actions are necessary to tackle climate change and recognizing the urgency of these actions, communities can better prepare for and respond to climate impacts. This knowledge reduces vulnerability and increases resilience. However, the question asked does not specifically address the impacts of climate change, the criteria is therefore orange. |
|
Representativeness |
Green |
The survey provides useful snapshot on the awareness and knowledge of communities around climate change. The SHS sample has been designed to allow annual publication of results at Scotland level and for local authorities. To meet these requirements, the target sample size for Scotland was 10,450 household interviews with a minimum local authority target of 250. |
|
Data availability |
Green |
The Scottish Household Survey climate awareness and action questions are asked biennially on odd years. The results are publicly available. |
|
Sensitivity |
Amber |
This indicator is sensitive to changes for the purposes of SNAP3 monitoring, as observed the marked changes that occurred in public perception and knowledge between 2019-2022. There is a lag in reporting years up to a maximum of one year (e.g. 2024 fieldwork ending in January 2025 with publication of results later in 2025)The up-to-date data will therefore not be available immediately at the end of the Plan. |
|
Understanding |
Green |
There is a clear connection on how understanding climate actions and the urgency of these actions relate to progress in climate adaptation. |
|
Baseline |
Green |
The baseline data for this indicator is available since 2019, providing a reference point for measuring changes in community awareness and perception over time. |
|
Practicality |
Amber |
The Scottish Household Survey has been collecting data since 1999, making it a practical, cost-effective, and well-established method for gathering information. |
Community action on climate change
|
Criterion |
Rating |
Assessment |
|
Adaptation relevance |
Green |
Community climate action hubs will improve knowledge of communities and enhances the preparedness of communities. |
|
Representativeness |
Amber |
This indicator does not capture the quality of action and may therefore not be fully representative of the effectiveness of climate actions. While it shows the presence of CCAHs and LPPs, it does not measure the depth or impact of the actions taken through these hubs/plans. |
|
Data availability |
Green |
Data is held by the Scottish Government, and is publicly accessible on the Scottish Government website: Community climate action hubs: contact details – gov.scot (www.gov.scot) . |
|
Sensitivity |
Amber |
This indicator is sensitive to changes for the purposes of SNAP3 monitoring, as observed by marked changes that between 2019-2022. |
|
Understanding |
Green |
It is easy to see the connection between the existence and maintenance of CCAHs and LLPs as metrics for climate action, although it might not be clear what specific actions arise from these. |
|
Baseline |
Amber |
20 CCAHs as of June 2024 (81% of the council areas covered). |
|
Practicality |
Amber |
Information on LPPs is not located in one centralised place, so requires time and resource to obtain. |
Community flood resilience
|
Criterion |
Rating |
Assessment |
|
Adaptation relevance |
Green |
This indicator is relevant to climate adaptation progress as it indicates the implementation effectiveness of strategies to mitigate flood risks and enhance community resilience. |
|
Representativeness |
Green |
Flooding is considered a significant climate hazard, as outlined in the SNAP3, therefore an indicator that captures action for this is representative of climate-resilient communities. |
|
Data availability |
Green |
Updated data on progress will be publicly available in 2025 and 2028. Data will be published by the 14 lead local authorities in charge of local Flood Risk Management Plans, and information will be centralised by SEPA. |
|
Sensitivity |
Green |
Changes in this indicator are sufficiently sensitive to the time-period of SNAP3 monitoring. However, reports are not published annually so the up-to-date data will therefore not be available immediately at the end of the Plan. |
|
Understanding |
Green |
The extent that actions are taking place to manage the impacts of flooding are clear to understand for a wide audience. |
|
Baseline |
Amber |
Actions to reduce or avoid flood are collated by the 14 lead local authorities in charge of Local Flood management Plans in their Flood Management Plan assessment report. The latest report was published in 2021, and the next one is expected in December 2025. |
|
Practicality |
Green |
Data is easy to obtain and easy to use to understand progress. |
Community wellbeing
|
Criterion |
Rating |
Assessment |
|
Adaptation relevance |
Amber |
Not directly related to climate change adaptation, but the experience of the effects of climate change, for example a flooding event, and the capacity to adapt or react to it has a direct impact on mental health. This indicator highlights the intersection between mental wellbeing and climate resilience, showing how adaptive capacity influences community health. |
|
Representativeness |
Amber |
Wellbeing metrics are useful indicators of community health, however, health and its impacts from climate change are wide-ranging in scope. Therefore, there is ultimately limitations that must be acknowledged with this indicator when representing overall community health. |
|
Data availability |
Green |
Data is publicly available from Scottish Government. |
|
Sensitivity |
Amber |
Whilst minor changes have been observed since 2006, this does not necessarily point to a lack of sensitivity in relation to the information this indicator provides. There is a lag in reporting years, with data being published on average one year later. The up-to-date data will therefore not be available immediately at the end of the Plan. |
|
Understanding |
Amber |
Whilst the concept of mental wellbeing and its importance as a metric of community resilience is easy to understand, how this indicator relates to climate adaptation is not clear. |
|
Baseline |
Green |
The baseline data from 2022 shows a mean score of 47.0 on the WEMWBS scale. |
|
Practicality |
Green |
Data has been monitored since 2006, the established data collection processes ensure that this indicator can be consistently and reliably monitored. |
OUTCOME: Public services are collaborating in effective and inclusive adaptation action
Level of collaboration across public services
|
Criterion |
Rating |
Assessment |
|---|---|---|
|
Adaptation relevance |
Green |
Collaboration is vital component of climate adaptation planning. Effective collaboration can enhance adaptive capacity, reduce vulnerability, and ensure a cohesive, equitable response to climate change. |
|
Representativeness |
Amber |
While this indicator shows the level of participation and collaboration, it does not capture the quality or depth of progress in terms of collaboration. It measures quantity rather than the effectiveness of the collaborative actions being taken. |
|
Data availability |
Green |
Data on the participation of public bodies in the Public Climate Adaptation Network is publicly available from Adaptation Scotland and the Sustainable Scotland Network. |
|
Sensitivity |
Amber |
While the indicator data is sensitive enough for the purposes of SNAP3 monitoring, the number of public bodies participating to the Public Climate Adaptation Network is not expected to rise significantly because Adaptation Scotland’s strategy is to integrate few members at a time to insure their good and lasting integration into the network. For the Public bodies climate change duties reporting, there is a lag in reporting years, with data being published on average 1 year after. The up-to-date data will therefore not be available immediately at the end of the Plan. |
|
Understanding |
Green |
This indicator is widely understood with the importance of collaboration in climate adaptation is broadly recognised and easily communicated. |
|
Baseline |
Green |
The baseline data is from 2024 for the Public Climate Adaptation Network and from 2022/23 for the SSN report. |
|
Practicality |
Green |
Data is easy to obtain and utilise to monitor progress over the SNAP3 monitoring period. |
Level of adaptation actions across public services
|
Criterion |
Rating |
Assessment |
|
Adaptation relevance |
Green |
This indicator is highly relevant to adaptation, providing information on levels of risk assessments undertaken by public sector and the extent that adaptation action is taking place. |
|
Representativeness |
Green |
The indicator is representative insights on the extent public services are engaging in adaptation action. However, it only captures the level of risk assessment and action of public bodies subject to mandatory reporting. |
|
Data availability |
Green |
Data is collected annually, providing a regular update on the level of adaptation action across public services. Data is publicly available. |
|
Sensitivity |
Amber |
Changes in collaboration will likely be observed over a five-year time period. There is a lag in reporting years, with data being published on average 1 year after. The up-to-date data will therefore not be available immediately at the end of the Plan. |
|
Understanding |
Amber |
This indicator requires some understanding of SSN’s analytical framework (and subjective nature of assessment) but the concept of risk assessment is widely understood. |
|
Baseline |
Green |
The baseline for this indicator is established from data collected in 22022-3. |
|
Practicality |
Green |
Data is easy to obtain and utilise to monitor progress over the SNAP3 monitoring period. |
OUTCOME: Economies and industries are adapting and realising opportunities in Scotland’s Just Transition.
Business awareness of climate adaptation
|
Criterion |
Rating |
Assessment |
|
Adaptation relevance |
Green |
Business action in relation to adaptation can make them more resilient and prepared for climate hazards, thereby reducing vulnerability. |
|
Representativeness |
Amber |
This indicator represents well the business adaptation component of the Economy, Business and Industry outcome area. It should be noted that it represents businesses with 10 or more employees. |
|
Data availability |
Green |
Data is publicly available and reported on annually. |
|
Sensitivity |
Amber |
Notable changes in the number of business monitoring climate risks is observable in the five-year period. This question was asked in August 2023. There exists potential for it to be asked soon after the end of the plan and therefore no lag in reporting. |
|
Understanding |
Green |
There is a clear connection between the extent in which businesses are monitoring climate risks and how this relates to adapting economy, business and industry. |
|
Baseline |
Green |
Baseline data available from August 2023. |
|
Practicality |
Green |
Data is being captured by BICS already, and practical to use. |
Business preparedness in climate adaptation
|
Criterion |
Rating |
Assessment | |
|---|---|---|---|
|
Adaptation relevance |
Green |
Business action in relation to adaptation can make them more resilient and prepared for climate hazards, thereby reducing vulnerability. | |
|
Representativeness |
Amber |
This indicator represents well the business adaptation component of the Economy, Business and Industry outcome area. It should be noted that it represents businesses with 10 or more employees. | |
|
Data availability |
Green |
Data is publicly available and reported on annually. | |
|
Sensitivity |
Amber |
Notable changes in the number of business monitoring climate risks is observable in the five-year period. This question was asked in August 2023. There exists potential for it to be asked soon after the end of the plan and therefore no lag in reporting. | |
|
Understanding |
Green |
There is a clear connection between the extent in which businesses are monitoring climate risks and how this relates to adapting economy, business and industry. | |
|
Baseline |
Green |
Baseline data available from August 2023. | |
|
Practicality |
Green |
Data is being captured by BICS already, and practical to use. |
Green jobs in the Scottish economy
|
Criterion |
Rating |
Assessment |
|
Adaptation relevance |
Amber |
The green jobs definition signifies its relevance to adaptation. However, important to realise limitations around green jobs, for example – adaptation considered as thinking embedded into all businesses, and not just new jobs created. |
|
Representativeness |
Amber |
In its focus on employment/skills in relation to climate adaptation, this indicator represents well the business adaptation component of the Economy, Business and Industry outcome area. |
|
Data availability |
Green |
Data is publicly available and captured annually. It should be noted that this data is currently categorised as ‘official statistics in development’. This means the data is potentially subject to revision. However, as stated by the Office of National Statistics, this data, even when in development, is considered sufficient quality to be used.[7] |
|
Sensitivity |
Amber |
Changes in this indicator are sufficiently sensitive to the time-period of SNAP3 monitoring. There is a lag in reporting years, with data being published on average 2 years after (e.g. 2022 data was published in March 2024). The up-to-date data will therefore not be available immediately at the end of the Plan. |
|
Understanding |
Amber |
The connection between a ‘green job’ and its relevance to climate adaptation is potentially unclear, therefore terminology and definitions used must be clearly stated. |
|
Baseline |
Green |
Baseline data available between 2015-2022. |
|
Practicality |
Green |
Statistical data for this indicator is already being collected and publicly accessible, making it practical to monitor as an indicator. |
SUSTAINABLE PRACTICE IN THE AGRICULTURE SECTOR
Agriculture water-use efficiency
|
Criterion |
Rating |
Assessment |
|---|---|---|
|
Adaptation relevance |
Green |
Improve water use efficiency in agriculture increases the resilience of farms against several effects of climate change. |
|
Representativeness |
Amber |
The east of Scotland is more concerned by drought risk than the west of the country. Moreover, irrigation lagoons are large-scale projects, but other ways to increase water-use efficiency can also be implemented on farms and will not be captured by this indicator. |
|
Data availability |
Amber |
Data is captured annually by Scottish governmentGovernment but is not publicly available. |
|
Sensitivity |
Green |
Changes in this indicator are sufficiently sensitive to the time-period of SNAP3 monitoring. |
|
Understanding |
Green |
There is a clear connection between water use efficiency and adaptation in the agricultural sector. |
|
Baseline |
Green |
Data has been collated annually since 2015. |
|
Practicality |
Amber |
This information is not publicly available. |
Annex 5 – Baseline information for each indicator
|
Indicator |
Year |
Baseline |
Data source |
|
Nature Connects Nature connects across our lands, settlements, coasts, and seas | |||
|
Habitat Connectivity Index |
2020 |
Equivalent Connected Area (Probability of Connectivity) (ECA (PC)) values from 2020 are available for Scotland for semi-grassland, woodlands and heathland. The data used was the 2020 EUNIS Level 2 landcover map produced by Space Intelligence. To get an overall ECA (PC) value from the local authorities data, each value needs to be squared, the totals summed and then the square root taken. The total Equivalent Connected Area (Probability of Connectivity) (ECA (PC) value for Scotland was 35,570 ha for semi-grassland (2.9%), 5,655 ha for woodland (1.4%) and 214,277 ha for heathland (8.3%). The overall national percentage figure is always going to be lower for each habitat than the individual local authority figures. This is because in a larger area you have more individual habitat patches which results in a lower connectivity measurement. |
For CSGN data visualisation: Habitat Connectivity Indicator – CSGN (arcgis.com) The data for whole Scotland was provided directly by NatureScot. |
|
Proportion of surface water bodies classified in good or better condition |
2022 |
445 (13.7%) surface water bodies in high condition, 1664 surface water bodies in good condition (51.2%) on a total of 3 249 surface water bodies monitored. | |
|
Proportion of Scotland’s Protected Sites in Favourable Condition |
2024 |
65.1% of natural features in favourable condition ‘Site condition monitoring assessment). If we include the sites where monitoring has detected signs of recovery, but favourable condition has not been reached (6.1%) and the sites with positive management is in place that is expected to improve the condition of the site (4.4%), the overall number reaches 75.6%. For woodlands (the least favourable habitat type), the proportion of sites in favourable condition is 56.8%. |
The Proportion of Scotland’s Protected Sites in Favourable Condition 2024 | NatureScot |
|
Proportion of soft shorelines affected by coastal erosion |
2021 |
46% of the soft coast is affected by coastal erosion. The average rate of erosion is 0.43 m/year. | |
|
Extent of green-blue landcover in urban areas |
2024 |
As of April 2024, the total area of urban greenspace in Scotland, as defined by Ordnance Survey, is 3,166 km². | |
|
Proportion of adults who live within a 5-minute walk of their nearest green or blue space |
2022 |
70% of adults reported living within a 5-minute walk of their nearest green or blue space. |
Supporting documents – Scottish Household Survey 2022: Key Findings – gov.scot (www.gov.scot) |
|
Communities creating climate-resilient, healthy and equitable places | |||
|
Proportion of adults viewing climate change as an immediate and urgent problem |
2022 |
74% of adults viewing climate change as an immediate and urgent problem. “Adult” refers to those aged 16 and over. | |
|
Proportion of the population declaring that they understand what actions they should take to help tackle climate change |
2022 |
80% of adults agreed that they understood what actions they should take to help tackle climate change. “Adult” refers to those aged 16 and over. | |
|
Number of Community Climate Action Hubs |
2024 |
There are currently 20 hubs across Scotland supporting community-led climate action. It covers 81% of the Scottish council areas (26 council areas covered by the 20 hubs). | |
|
Number of Local Place Plans |
2024 |
No local place plans have been adopted yet. Many councils have recently invited communities to prepare Local Place Plans so that they can play a proactive role in defining the future of their places. |
This information has not been centralised and published in one place by the Scottish government. |
|
Progress of actions in local flood risk management plans |
2019/21 |
90% of the actions set out in the strategies to avoid an increase in flood risk are green. 10% of the actions are amber. By 2021, 100% of the actions are expected to be complete. 84% of the actions described in the strategies to reduce flood risk are green, 12% of the actions are amber and 4% are red. With 96% of the actions completed or underway by 2021, the actions developed to meet the reduce objectives will mostly be achieved. | |
|
Mental wellbeing score (WEMWBS) |
2022 |
In 2022, the mean WEMWBS score for all adults was 47.0. |
Scottish Health Survey 2022 Main Report Volume 1 (www.gov.scot) |
|
Public services are collaborating in effective, inclusive adaptation | |||
|
Number of public bodies members in the Public Sector Climate Adaptation Network |
2024 |
50 organisations are currently members of the Public Sector Climate Adaptation Network. |
Adaptation Scotland :: Public Sector Climate Adaptation Network |
|
Number of public bodies citing the Work in partnership & collaborations as a priority s for the year ahead in relation to climate change adaptation |
2022/23 |
53.2% of the 188 listed public bodies (100 public bodies) submitting an annual compliance report cite “Work in Partnerships & Collaborations” in their top 5 priorities for the year ahead in relation to climate change adaptation. |
Public Bodies Climate Change Reporting – Analysis Report 2022/23 (sustainablescotlandnetwork.org) |
|
Level of risk assessment across the public sector |
2022/23 |
70.2% of all listed public bodies submitting an annual compliance report have completed some form of risk assessment during or prior to the 2022/23 reporting period. 43.6% of bodies have carried out a limited assessment which does not provide an in-depth risk assessment addressing a range of climate hazards or risks. 20.7% of bodies have carried out a comprehensive risk assessment. 5.8% have completed an advanced risk assessment involving stakeholders and considering a range of climate or socioeconomic scenarios. |
Public Bodies Climate Change Reporting – Analysis Report 2022/23 (sustainablescotlandnetwork.org) |
|
Level of adaptation action taken across the public sector |
2022/23 |
71.8% of all listed public bodies submitting an annual compliance report have taken adaptation action during or prior to the 2022/23 reporting period. 44% of bodies have taken some action where a range of actions or policies exist but it is unclear how the actions are contributing to addressing specific climate risks or hazards. 21% of all bodies are taking good action, meaning the bodies are taking action to reduce specific risks and/or taking significant sector-specific adaptation actions. 6% of bodies are taking advanced action where a comprehensive set of actions are in place to address specific climate risks and plans are in place to measure progress against the management of these risks. |
Public Bodies Climate Change Reporting – Analysis Report 2022/23 (sustainablescotlandnetwork.org) |
|
Economies and industries are adapting and realising opportunities in Scotland’s Just Transition | |||
|
Proportion of businesses monitoring climate related risks (flooding, temperature increase, supply chain disruptions) |
2023 |
15.6% of Scotland businesses have assessed risks for supply chain disruption and distribution. 6.2% of Scotland businesses have assessed risks for increased flooding. 4.4% of Scotland businesses have assessed risks for temperature increase. 60.6% of Scotland businesses have not assessed any risks related to climate change. The scope of “businesses” taken into account by this survey are businesses which have not permanently stopped trading, with 10+ employees and with a presence in Scotland (n=1,061). |
Climate Change – BICS weighted Scotland estimates: data to wave 88 – gov.scot (www.gov.scot) |
|
Proportion of businesses taking action to adapt to the effects of climate change |
2023 |
26.5% of Scotland businesses declare they have already taken action to adapt to supply chain disruption and distribution. 11.5% of Scotland businesses declare they have already taken action to adapt to increased flooding. 5.7% of Scotland businesses declare they have already taken action to adapt to temperature increase. 21.2% of Scotland businesses have not assessed any risks related to climate change. 18.1% of businesses reported that they do not expect to be impacted by these climate change effects. The scope of “businesses” taken into account by this survey are businesses which have not permanently stopped trading, with 10+ employees and with a presence in Scotland (n=521). |
Climate Change – BICS weighted Scotland estimates: data to wave 88 – gov.scot (www.gov.scot) |
|
Number of green jobs |
2022 |
Using the industry approach, Scotland employment in green jobs in 2022 was estimated at 46,200 full-time equivalents (FTEs). |
Experimental estimates of green jobs, UK: 2015 to 2022 – Office for National Statistics (ons.gov.uk) |
|
Uptake of grants for agriculture storage reservoirs/ off season storage lagoons |
2024 |
5 AECS applications for irrigation lagoons were successful in 2024. 14 applications were submitted. |
Scottish government – unpublished data |
© The University of Edinburgh, 2024
Prepared by Ricardo on behalf of ClimateXChange, The University of Edinburgh. All rights reserved.
While every effort is made to ensure the information in this report is accurate, no legal responsibility is accepted for any errors, omissions or misleading statements. The views expressed represent those of the author(s), and do not necessarily represent those of the host institutions or funders.
ClimateXChange
Edinburgh Climate Change Institute
High School Yards
Edinburgh EH1 1LZ
+44 (0) 131 651 4783
If you require the report in an alternative format such as a Word document, please contact info@climatexchange.org.uk or 0131 651 4783.
https://www.gov.scot/isbn/9781836017264 ↑
Meeting notes from the four workshops are provided as supplementary materials to this report. ↑
Note: the objectives used here are taken from the draft SNAP3. The wording in the final SNAP3 differs slightly. ↑
Note: the objectives used here are taken from the draft SNAP3. The wording in the final SNAP differs slightly. ↑
Note: the objectives used here are taken from the draft SNAP3. The wording in the final SNAP differs slightly. ↑
Note: the objectives used here are taken from the draft SNAP3. The wording in the final SNAP differs slightly. ↑
See Office of National Statistics – https://www.ons.gov.uk/economy/environmentalaccounts/bulletins/experimentalestimatesofgreenjobsuk/2024#measuring-the-data ↑