
Carbon capture and storage (CCS) is a way of reducing emissions by capturing CO₂ produced by industrial activity or power generation, transporting it, then storing it deep underground.
As CCS projects develop in Scotland, public understanding and confidence will be key to their success. Nationally, awareness of CCS remains low and opinions are ambivalent. At a local level, concerns about safety, cost and environmental impacts can contribute to the failure of CCS projects. The Acorn project, which will store captured CO₂ beneath the North Sea, is Scotland’s most significant CCS development and highlights the importance of building trust with local communities and the wider public.
This report reviews the evidence on public perceptions of CCS, the factors that shape them, and the lessons for effective public engagement. It draws on published research and interviews with experts from academia, government, regulators, the third sector, and industry.
Key findings
- Public awareness of CCS is low and people tend to feel neutral, but opinions can change quickly as they learn more, or depending on the stage of a project.
- Many people see CCS as an unproven technology, increasing uncertainty and concern about how well it works.
- Safety is a key concern. People want reassurance that carbon CO₂ can be stored safely underground long-term, and many have safety concerns about the chemicals used during the capture process.
- People are concerned about costs and impacts, including higher energy bills, delays to cleaner alternatives, and disruption such as noise and traffic during construction.
- Trust is essential. Projects are more likely to gain public support when developers are open, honest and responsive, and when communities see clear local benefits.
- Local context and the type of project matters. Previous experiences with industry, the history of an area, and attitudes towards other energy projects all influence how CCS is perceived.
- Early, honest and ongoing engagement works best. Involving communities in decisions is more effective than simply providing information or reassurance.
Lessons learned
- Understand local views from the start, especially in communities likely to be affected by CCS projects, such as those near Acorn.
- Don’t assume public support. Offshore storage, industrial heritage or support for one project does not guarantee support for future CCS developments.
- Local context matters. Understanding local priorities and concerns is key to effective engagement. Previous experiences with industry and economic change may also influence how communities view new projects.
- Start engagement early and keep it going. Communities should have genuine opportunities to ask questions, raise concerns and help shape decisions throughout a project’s lifetime.
- Build trust through action and honesty. Deliver promised benefits, monitor project performance and share results openly. Explain potential risks clearly, how they will be managed, and what will happen if problems arise.
- CCS should be part of a wider conversation about Scotland’s journey to net zero. Raising awareness nationally can help provide context before local discussions take place.
For further information, please read the full report.
If you require the report or annex in an alternative format, such as a Word document, please contact info@climatexchange.org.uk or 0131 651 4783.
Research completed January 2026
DOI: https://doi.org/10.7488/era/7241
Executive summary
Aims and methods
Carbon capture and storage (CCS) is a way of reducing emissions by capturing the CO2 produced by power generation or industrial activity, transporting it and permanently storing it deep underground. As CCS projects advance, evidence is accumulating on the importance of understanding public perceptions. At national level in the UK, public awareness is still low and opinions are ambivalent. This creates both opportunities for dialogue and a risk that public attitudes are malleable to misinformation. At a local level, unaddressed public concerns such as safety, and a general lack of public engagement can contribute to the failure of CCS projects.
Public perceptions are highly influenced by national and local contexts. In the Scottish context, the Acorn project is the most significant CCS development. It will capture emissions from major industrial sites and permanently store them deep beneath the North Sea seabed. As the Acorn project in Scotland progresses and the country advances CCS and carbon removals as part of its Climate Change Plan, it will be important to consider public perceptions. The aim of this research was to review existing evidence on public perceptions of CCS, the factors which shape it, and lessons for public engagement with local communities and the wider public. We conducted a literature review and interviewed 20 expert stakeholders from academia, governments, regulatory authorities, third sector, and industry (project developers and emitters). Stakeholders were selected based on their experience with CCS projects, in the UK and internationally. The literature reviewed included public perception surveys but a survey to assess current public perception in Scotland was outside of the scope of this project.
Findings
We found that the public generally knows little about CCS and is mostly neutral towards it. However, perceptions can change quickly and vary depending on the context in question and across the CCS value chain. There is a persistent belief that CCS is immature or unproven at scale, which can exacerbate public concerns. Safety is a key concern, particularly at local level. This is most prominently linked to the long-term integrity of storage sites, and can be amplified by a lack of understanding of the subsurface. Public concerns may also manifest around capture sites and include potential health risks from the use of amines in carbon capture units. Other important concerns include fossil lock-in (that CCS will be used to prolong the life of fossil energy production), cost (additional consumer costs imposed by CCS, trade-off between investing in CCS and in alternatives), and disruption (e.g., noise and congestion during construction, ongoing impacts during operation).
A “social licence to operate” (SLO) refers to the approval or acceptance granted by the public beyond formal consent. Addressing the public’s concerns in a meaningful and transparent way is the first step in obtaining a SLO for CCS. Trust is one of the most vital precursors to an SLO and once lost can be difficult to regain. For example, following the failure of a CCS project in the Netherlands widespread scepticism around CCS continued in the country, with its first commercial-scale project only launched 10 years later. The equitable distribution of benefits to local communities is another essential precursor to an SLO. At the same time, compensation can be perceived as bribery, particularly if it is purely financial. Public perceptions of other infrastructure projects such as fracking will also influence whether an SLO is granted or not.
A range of factors affect how the public ultimately perceives CCS, and whether an SLO can be granted. The specific project and technology are also factors. Offshore CO2 storage is slightly preferred but depends significantly on the relationship communities have with the sea. Capturing industrial and biogenic emissions is perceived as slightly better than those from fossil-based energy production. Imported CO2 is generally less accepted for capture than CO2 generated domestically. The historical context of a community is another key factor, including industrial heritage, previous experience with transition management, legacy incidents, and prior interactions with CCS actors.
The quality of public engagement itself is another key factor in how CCS will be perceived. Across the evidence base, early, tailored, and sustained communication from credible messengers is highlighted as vital for public confidence in CCS, both at national and project level. Although there is some disagreement on the ultimate impact of increased public awareness, it was found that at national level CCS needs to be visible in the debate around climate change mitigation and Just Transition. At a local level, two-way communication which treats communities as partners who can contribute to decision-making, rather than passive audiences, is the most effective. CCS communicators need to be honest about all aspects of their projects, including risks, and remain visible across the project lifecycle.
Lessons learned
Understanding current public opinion on CCS in Scotland, particularly in communities near the Acorn project, is an important precursor to successful public engagement and long-term trust. Offshore storage should not be assumed to mean acceptance of CCS, given the existing importance and use of the sea by local communities. A CCS SLO is reliant on public confidence that project risks will be managed, and is not fixed in time. As such, current acceptance of the Acorn project does not mean acceptance of future projects or new capture sites connecting to the SCO2T pipeline. The SCO2T pipeline is the onshore pipeline network that links industrial centres directly to the Acorn project. The prominence and importance of industry in local communities, while beneficial in ensuring familiarity with industrial development, also does not automatically mean acceptance of CCS. If past experiences with industry are negative, CCS may by association have a negative connotation. This also applies to experience with transition management and the perception of “unjust transitions”, such as Scotland’s coal pit closures in the 1970s.
Public engagement is very context-specific. However, there are several general lessons learned. More frequent, visible debate around CCS, as part of a broader discussion on Scotland’s climate targets, will be an important foundation for engagement. The subsequent local engagement needs to be preceded by a deep understanding of the audience (“social site characterisation”) and appropriately resourced for early and ongoing two-way engagement. Following through on promised benefits and providing a clear plan for monitoring and disclosing project performance will also be important for trust-building and ultimate acceptance. Taking public concerns seriously, even if they are misinformed, will be key. Evidence from Scotland itself shows that the public does not want to be endlessly reassured on CCS, but rather honestly told how risks will be mitigated if they materialise.
Abbreviations table
CCS | Carbon Capture and Storage |
CCU | Carbon Capture and Utilisation |
CCUS | Carbon Capture, Utilisation, and Storage |
CCP | Scotland’s Climate Change Plan |
CO2 | Carbon dioxide |
EU | European Union |
Gt | Giga-tonnes (billion tonnes) |
ICCS | Industrial carbon capture and storage |
Mt | Mega-tonne (million tonnes) |
NET | Negative Emissions Technology |
NIMBY | Not-In-My-Backyard |
SLO | Social Licence to Operate |
t | Tonne |
UK | United Kingdom |
Introduction
Background
Carbon capture and storage (CCS) has the potential to be a key tool for decarbonising hard-to-abate industrial sectors and enabling negative emissions (International Energy Agency, 2022). Broadly, it involves a chain of technologies to capture carbon dioxide (CO2) from emission sources (e.g., an industrial manufacturing plant) or from the atmosphere, transport it, and inject it deep under the subsurface for permanent geological storage. CO2 can be transported through pipelines, as well as in trucks, trains, barges, or ships. It can be stored onshore or offshore (below the seabed). In either case storage happens at a minimum depth of 800m below the surface.
CCS has been deployed commercially since the 1970s, primarily to enhance oil and gas recovery (IEAGHG, no date). As a climate change mitigation tool, project development has only recently accelerated. The European Union (EU) sees CCS as a key component in its 2050 pathway to net zero (European Commission, 2024). It recently obligated oil and gas suppliers to prepare 50 million tonnes (Mt) of CO2 storage capacity on its territory by 2030. The United Kingdom (UK) is advanced in CCS development, having awarded government subsidies to four projects, including the Acorn project in Scotland. These and other planned CCS projects in the UK all involve capturing CO2 from industrial sources and storing it under the seabed: the HyNet project in the Irish Sea and the East Coast Cluster, Viking, Bacton, and Acorn projects in the North Sea. The Scottish North Sea, where Acorn will develop its CO2 storage, is estimated to hold the majority of the UK’s North Sea storage potential.
CCS is a relatively new technology in the context of climate change mitigation and has been less visible in the public debate compared to measures such as renewable energy and electrification. Public awareness of CCS is generally low, and its social acceptability is often assumed in studies estimating its deployment potential (Parliamentary Office of Science and Technology, 2017). However, a growing body of research and practical experience from frontrunner projects cautions against such assumptions. There have been challenges with social acceptability in projecting the rollout and impact of CCS, and in planning actual CCS projects. One of the most widely cited examples is the Barendrecht project in the Netherlands. This project was abandoned during the development stage in 2012, partially due to concerns around the local impact of onshore CO2 storage and a lack of public engagement to address these concerns. Public confidence took a long time to recover, onshore CO2 storage was banned, and the Netherlands is only now constructing its first commercial-scale CCS project (Carbon Gap, 2026). Other examples from Germany and the United States reinforce the potential impact of public resistance to CCS (Clean Air Taskforce, 2024; Oltra et al., 2012; The Copenhagen Post, 2009).
The experience of public resistance offers lessons for future project development. For example, in the wake of the Barendrecht project, the Dutch ROAD project prioritised local stakeholder engagement and intensive public communications (Lockwood, 2017). However, there is still room for improvement. In many cases, public engagement continues to be top-down and one-sided, which risks undermining the credibility of CCS and public trust in the project developers and national governments promoting it (Clean Air Task Force and Lockwood, 2022). The fact that CCS is not well-known and involves subsurface storage which is invisible to the public, creates a basis for concern, particularly around storage safety and environmental impact (Lambert et al., 2025). In addition, despite being most effective as a climate solution for heavy industry (E3G, 2023), CCS can also be applied to fossil energy production, including coal and gas power. This has created a concern around CCS being used to prolong the use of fossil fuels, known as “fossil lock-in”. Finally, it has an association with the oil and gas industry as most CCS project developers in Europe are oil and gas companies, given their ownership of suitable storage sites and transferable skills. Perceptions of the oil and gas industry may therefore shape public response to CCS projects.
Scotland is in the early stages of CCS deployment. The country has no dedicated strategy on CCS but highlights it as a key opportunity in its Green Industrial Strategy (Scottish Government, 2024). In Scotland’s Climate Change Plan, carbon capture, utilisation, and storage (CCUS) is seen to have a key role in industrial decarbonisation (Scottish Government, 2025a). The broader-termed Negative Emissions Technologies (NETs) are also cited as key measures. This encompasses CCS where carbon is captured from the atmosphere or the combustion of biomass. According to Scotland’s draft Climate Change Plan (CCP), over the 2036-2040 period NETs would be avoiding 12.2 Mt of CO2 emissions (Scottish Government, 2025b).
At the time of writing, Scotland’s only Government backed commercial-scale CCS project, the Acorn project, is still in the planning stage, with storage licenses granted but no infrastructure yet built. The project would involve CO2 capture from several emitters, including a gas-fired power plant at Peterhead and industrial facilities in North-Eastern Scotland and the Central Belt. The CO2 would be transported through a repurposed gas pipeline (the SCO2T pipeline) to an export terminal at St Fergus, then piped offshore and stored in the Scottish North Sea. Scotland focuses on offshore CO2 storage in the North Sea, with Acorn’s CO2 storage site located 100 km off the coast of Aberdeenshire (The Acorn Project, 2026). Some near-shore basins have recently been explored as potential storage sites (Cavanagh et al., 2024). The Scottish North Sea is a vast CO2 storage resource, estimated at around 50 giga-tonnes (Crown Estate Scotland, no date). Given this, the potential for Scotland to become a CO2 storage hub which imports emissions from abroad for storage has begun to permeate the public discussion (Optimat, 2025).
Beyond its potential contribution to climate change mitigation, CCS has been highlighted as a tool for safeguarding heavy industry, preventing economic downturn and job loss in industry-dependent areas. It has also been outlined as a measure to enable the Just Transition of the oil and gas sector. Workers could be reskilled to operate CO2 storage facilities as hydrocarbon production is phased out in line with climate goals (Scottish Carbon Capture and Storage, 2019). Both these aspects are pertinent in the Scottish context, given its strong oil and gas employment base and its industrial heritage. This is particularly relevant in communities surrounding the Acorn project’s planned capture sites and export terminal in Aberdeenshire. At the same time, Scotland has significant maritime skills which can be leveraged for the development of CCS, but there are also potential conflicts of sea use with shipping, fishing, and offshore wind energy.
Research aims and methodology
A robust understanding of how the public perceives CCS and how they can be meaningfully engaged on the topic is an important component for project deployment. The broad aim of this research was to review the existing evidence base on public perception and engagement, and extract lessons learned for Scotland’s CCS project pipeline. To do this, we collected evidence from the literature and stakeholders to answer the following questions:
- What evidence do we have on how the public perceives CCS?
- What are the main public concerns around CCS and precursors to its acceptability?
- What influence do technology and social factors have on public response?
- What are the opportunities, challenges, and risks of public engagement with CCS?
- How does the quality of communication affect public perception and response?
- What lessons can be learned from CCS public engagement in other jurisdictions?
We reviewed international literature on CCS perceptions and engagement. In total, we reviewed 58 academic articles and 69 grey literature items primarily reports from think tanks such as Clean Air Task Force, and project reports such as the Decatur project in the United States. The literature reviewed included public perception surveys but a survey to assess current public perception in Scotland was outside of the scope of this project. See Appendix A for more detail on our methodology.
We also interviewed stakeholders from academia, civil society, government, and project developers and emitters from industry in the UK or abroad. The interviews were based on the same research questions outlined above and tailored to each stakeholder. An aspect of particular focus in our stakeholder consultations was lessons on CCS perceptions and engagement from other jurisdictions, including England, Norway, Denmark, the Netherlands and France. We engaged a total of 20 stakeholders through virtual interviews or questionnaires.
This report presents the findings of our evidence review. It is structured into three main chapters, covering findings on public perceptions of CCS (Chapter 4), factors influencing public response (Chapter 5), and public engagement around CCS (Chapter 6). We close each chapter by outlining key lessons learned relevant to Scotland from the presented findings. The final section of this report summarises the evidence review findings and these key lessons learned, focusing on potential next steps for public engagement about CCS in Scotland.
Public perceptions of CCS
General public perceptions of CCS
The evidence review consistently indicates low levels of awareness of CCS in various countries (Anders, Liebe and Meyerhoff, 2024). This is similar in the UK, where polled publics display overall low public awareness and high ambivalence (Clean Air Task Force, 2023b). Some sources indicate there is slightly higher awareness in Scotland – 24% stating that they know at least “a fair amount” about CCS, compared to 20% at UK level (Department for Energy Security and Net Zero, 2024a). Stakeholders highlight a persistent public belief that CCS technologies are immature or unproven at scale.
More generally, public perceptions of CCS are affected by a range of factors. Higher awareness can be a precursor to support and reduce perceived safety risks, but in some cases can generate negative perceptions (Department for Energy Security and Net Zero, 2024). Prior research using focus groups in the UK has found that people with lower levels of knowledge around CCS often rely on comparisons to other subsurface or industrial technologies, most commonly fracking (Mabon and Littlecott, 2016). Therefore, historic interactions with technology could be critical determinants of support for CCS projects.
Positive perceptions of CCS in the UK cluster around industrial employment, regional economic benefits, and climate necessity (Department for Energy Security and Net Zero, 2024b). In 2023, a survey of 363 Scottish participants showed more awareness of CCS than comparable regions in the UK (Wales and Northern Ireland), with higher shares both supporting and opposing it. By 2025, support had fallen slightly below these comparable regions (41%, compared to 43% and 45%, respectively), and the share of those opposing it had increased from 8% to 13% (Department for Energy Security and Net Zero, 2023; Department for Energy Security and Net Zero, 2025). This increase was driven by a rise in the share of those strongly opposing CCS. The increase in opposition mirrors the rest of the UK but is stronger in Scotland. Beyond these surveys, recent in-depth evidence on Scottish opinions of CCS is sparse. In a small focus group in Scotland, Brunsting et al. (2013) found positive attitudes towards CCS, including seeing CCS as a pathway to preserve existing jobs in industrial areas, and also highlighting the potential the benefits of being a global CCS leader.
The literature shows that when CCS is presented as an isolated technical solution, public reactions tend to be cautious or negative. However, several studies show that when CCS is presented as essential for climate mitigation and part of a broader low-carbon transition, public opinion becomes more favourable (Gough and Mander, 2022; Shah et al., 2022). Support is further impacted by perceived necessity. In a UK polling study, 45% of respondents stated that CCS should be used only if it is the cheapest decarbonisation option, and 28% thought it should be used only if it is the only available option (Clean Air Task Force, 2023b).
A raft of other factors affects public understanding and support of CCS. They include proximity to sites, which can cause both more positive and more negative attitudes (Große-Kreul et al., 2024; Sovacool et al., 2025). Trust in government and industry is a widely-cited key factor (Clean Air Task Force and Lockwood, 2022; Anders et al., 2024). Experience with past projects is also a significant factor. Spain’s failed CASTOR CCS project, which generated seismic activity due to insufficient monitoring has caused local public opinion to turn negative (CCUS SET-Plan, 2024). In contrast, the Pycasso project in France had positive results due to early-stage public consultation and engagement addressing local concerns (Zero Emissions Platform, 2024). Two stakeholders also raised the role of the media in shaping public understanding of CCS. Media outlets and their associated storylines can play an influential role in shaping public discourse around trust, technology scepticism and awareness (Swain, 2025).
Public perception across the value chain and across levels of discussion
Public perception of CCS can also vary across the value chain. This is because the perception of risks and benefits changes depending on whether capture, transport, or storage is being proposed. It can also be varied because CCS value chains are long and involve different project developers interacting with different communities (Zero Emissions Platform, 2024). Capture is generally viewed as more beneficial, whereas storage raises safety concerns (CCUS SET-Plan, 2024; Clean Air Task Force and Gładysz, 2025).
Limited research is available on the differences in public perceptions between CCS at a socio-political level (e.g., CCS as part of a broader discussion on Scotland’s net zero targets) and at a local level (e.g., a specific CCS project being debated). However, it is expected that a concrete CCS project will generate different perceptions of risks, challenges, and opportunities than a theoretical discussion about CCS technologies (Miu et al., 2023). Stakeholders agreed that further research was needed on this topic. Some stakeholders maintain that practical concerns, particularly those around storage safety, are likely to be at the local/project level rather than the national/socio-political level. On the other hand, broader concerns such as the risk that CCS props up an unsustainable fossil fuel industry, may be more prevalent at national level.
Examples of public resistance
Public resistance is a persistent concern for CCS projects. Although 77 projects are live today (Global CCS Institute, 2025), resistance has stopped or delayed several projects. In many cases, public confidence in CCS technologies takes a long time to recover following these instances of public resistance. It is important to recognise that a lack of active protest does not indicate approval to develop CCS in any area and under any circumstance.
A widely quoted example of public resistance is the Barendrecht project in the Netherlands. This project provides key insights into why CCS projects may fail. Notably, engagement processes were not seen as open, and residents saw the project developer, Shell, and the national government as acting defensively about any concerns raised (Oltra et al., 2012). The benefits of the project for local people were not clearly articulated (Kuijper, 2011). Campaign groups in collaboration with local politicians mobilised to share anti-CCS messages which had a high level of public penetration (Terwel, ter Mors and Daamen, 2012). Similar challenges emerged in the failed Beeskow project in Germany with residents believing engagement was tokenistic and biased to enable the project to move forward. Failure to address major health concerns around carbon leakage into aquifers exacerbated public concerns and opposition (Oltra et al., 2012).
Main public concerns
Safety
The literature on CCS, as well as most stakeholders interviewed in this study, agree that long-term safety is one of the main public concerns around CCS. It is primarily related to CO2 storage and to some extent transport, although CO2 capture can also raise safety concerns (see Section 5.1). Safety concerns include leakage risk, induced seismicity, groundwater contamination, and monitoring. There is strong evidence that acceptance improves where project designs clearly demonstrate robust governance and contingency planning (Stavrianakis, Nielsen and Morrison, 2023; Zero Emissions Platform, 2024; Global CCS Institute, 2025).
Safety concerns are typically more prominent at the local level, and can be driven by uncertainty or lack of trust in the mitigation of leakage. Stakeholders noted that safety concerns can also be affected by a fear of the unknown, due to a lack of familiarity with subsurface technology. Furthermore, safety concerns are not isolated just to the area of where a project is deployed: people will not support a project if the safety risks are moved elsewhere (Witte, 2021).
Stakeholders drew a clear line between unaddressed safety concerns and the fate of some CCS projects, including Barendrecht. However, many of them maintain that safety-related risks are elevated because the risks are unfamiliar, and publics with low awareness are susceptible to arguments from those opposing CCS. For example, some publics draw analogies to historic incidents such as the Lake Nyos gas release, even though these are not truly comparable (Baxter, Kapila and Mfonfu, 1989). In the US, despite intensive and early public engagement in the Illinois Decatur project, when the stored CO2 migrated from its original subsurface position, it sparked public outrage. This happened even though the CO2 migration did not affect the local groundwater – a major public concern in the US (Clean Air Taskforce, 2024). The state of Illinois subsequently banned CO2 storage in 14 counties.
Safety concerns are present in the UK (Department for Energy Security and Net Zero, 2024a), and go back to the White Rose and Peterhead projects in the 2010s (White Rose, 2016; Peterhead CCS Project, 2015). Even earlier, Scottish CCS (2010) had identified earthquakes, landslides and water contamination as potential public concerns in Scotland. Project developers we consulted told us that safety is always under consideration as a public concern they may need to respond to, even when not yet manifested by the public (HyNet North West, 2020).
Fossil lock-in
Among climate‑concerned publics and civil society groups, concerns can emerge around CCS as a moral hazard that allows governments and companies to defer more transformative change and enable further dependence on fossil fuels (Whitmarsh, Xenias and Jones, 2019; Merk, 2022; CCUS SET-Plan, 2024). This is termed “fossil lock-in”, and stakeholders note that those concerned with it may be more informed on CCS than the broader public. This may be more prominent at a socio-political level rather than as a pressing issue for local communities. However, this is not easily generalisable.
Fossil lock-in can also fuel anti-CCS NGO sentiments related to whether the technology is a valid use of taxpayer money, as noted by some stakeholders. They also note that there is a perception that CCS is a solution lobbied and funded by oil and gas industry, with likely vested interests to continue oil and gas production. Some stakeholders highlighted that these are valid arguments, and can significantly affect perceptions, particularly when NGO voices are highly trusted.
Cost and disruption
The concern that CCS is an extremely costly solution is an important barrier to public acceptance, including in the UK and Scotland (Department for Energy Security and Net Zero, 2024b). Public cost concerns can be around the additional costs for consumers due to CCS. For example, increased energy costs due to added cost of carbon capture on power plants, or that investment in CCS will reduce investment in other low carbon solutions (Gough and Mander, 2022; Tardin-Coelho, Bharadwaj and Ashworth, 2025; Clean Air Task Force and Gładysz, 2025). Stakeholders echoed these concerns, relating both to the viability of CCS and the belief that the taxpayer should not be the one to foot the bill for industry’s “clean-up”. The latter was highlighted as an ethical concern that could be used as a key argument by anti-CCS NGO groups. Views on costs are heterogenous across different demographics. Waring and Longo (2025)find that higher income, female gender, older age, and higher levels of environmental concern are linked to higher willingness to pay for CCS.
Multiple stakeholders point to the disruption caused by CCS as a public concern. They highlight that if a project is local to a community then construction noise, traffic and congestion effects, or visual impact from large capture units could lead to local opposition. One project developer estimated that up to 80% of the questions and feedback they had received related to outright opposition to CCS developments due to the locally disruptive effects of construction or traffic, or to concerns around this level of this disruption, e.g. how long local roads would close for. The UK government’s survey on public opinion of CCS has indicated a perception of CCS as locally disruptive and too expensive as one of the main drivers of opposition (Department for Energy Security and Net Zero, 2024b). A decline in quality of life or in property values may also raise public concern (Zero Emissions Platform, 2024; Clean Air Task Force and Gładysz, 2025; ACCESS Network, 2024).
Other concerns
Safety, fossil lock-in, and costs are widely-cited public concerns around CCS, but it is worth highlighting several less frequently mentioned ones including:
- Perceived low effectiveness in tackling climate change, highlighted in UK literature (Department for Energy Security and Net Zero, 2024a) (Traverse, 2021) and our stakeholder consultations. This includes perceived low investment efficiency compared to alternatives, exacerbated by the perception that the technology is unproven at scale.
- Specific sectoral impacts e.g., impacts on agriculture and tourism (Zero Emissions Platform, 2024; Clean Air Taskforce, 2024). Land use and marine life are concerns in the UK (UK Government, 2025). In Scotland, the impact on fisheries and wildlife was flagged as a potential concern in the past (Peterhead CCS Project, 2015).
Main precursors to a Social License to Operate
A “social licence to operate” (SLO) refers to the level of acceptance or approval granted by local communities and wider publics to a project or sector, beyond formal consent. Addressing public concerns is a necessary precursor to obtaining an SLO, but it is also shaped by trust, awareness, and how the benefits of CCS are distributed.
A CCS SLO is not just generated at a local level, but rather is shaped by regional, national and international perspectives on CCS (Witte, 2021). Ultimately, it is dependent on whether CCS seems consistent with a credible national net zero strategy, particularly for storage (Gough and Mander, 2022). Several stakeholders also suggest that maintaining an SLO is a multi-actor process, involving project developers, local authorities, and national government, with flexible roles to match the local context of a project.
It is also important to note that an SLO is not fixed and can be “revoked” by newly emerging concerns. Managing this risk involves maintaining trust and transparent engagement, as well as a good safety record, across the project’s lifetime (Clean Air Task Force and Gładysz, 2025). It should also not be assumed that acceptance of one development will translate into acceptance of another, or of expanding the current one. The SLO also depends on the scale at which benefits and risks accrue. For example, a proposed coal-fired power plant with CCS in Ayr, Scotland, faced significant opposition due to fears around local pollution risks, despite the climate benefits (CCUS Projects Network, Parmiter and Bell, 2020). Some international sources suggest the differentiation of local-scale SLOs, which include demonstrating safety and providing proof-of-concept, and wider public engagement, which should focus on connecting with the bigger picture (Greenberg, 2020).
Trust in CCS actors
Trust in industry and government is one of the most important precursors of CCS SLO (Terwel et al., 2009; Clean Air Task Force and Lockwood, 2022). When it is low, acceptance of CCS is low, higher local risks are perceived (Gough and Mander, 2022). Critically, the provision of additional information does not increase levels of support (Terwel et al., 2009).
Trust is built through partnership, transparency, and procedural justice ((Nielsen, Stavrianakis and Morrison, 2022; Tardin-Coelho, Bharadwaj and Ashworth, 2025). The public must feel that their concerns are being taken on board, that they will not be bypassed in decision-making, that their input will have real effect, and that the actors they trust can influence decision-making (CCUS SET-Plan, 2024; Miu et al., 2023). If communities are treated as partners rather than passive audiences, positive perceptions of CCS can increase (Clean Air Task Force and Gładysz, 2025; Bellona Europa, 2023; Traverse, 2021).
Procedural injustice, with communities feeling like concerns are ignored and projects are imposed against local wishes, has been an important factor in the failure of some CCS projects, most prominently Barendrecht (ACCESS Network, 2024). Trust is easily lost when people feel excluded or misled (Gough, Cunningham and Mander, 2018), or when they perceive that information is being withheld, that concerns are not being taken seriously, and/or that risks are not thoroughly assessed (Scottish CCS, 2010). Once lost, trust from local communities can be difficult to regain (Miu et al., 2023) even if using high-quality information and engagement. Older research in Scotland shows that such engagement can be viewed as biased propaganda if it supports the standpoint of a project developer in which trust has been lost (Scottish CCS, 2010).
Process transparency is also important. A perception of vested commercial interests, especially if projects are publicly funded, is a further barrier to trust (CCUS Projects Network, Parmiter and Bell, 2020). The UK CCUS Public Dialogue highlights that the public wants contracts to be transparently awarded to “ethical” companies with good track record (Traverse, 2021). One stakeholder noted that industry-government cooperation is good for trust-building, preventing CCS being perceived as an industry-led profit-making tool.
Awareness and experience
Evidence around the influence of awareness on CCS perceptions is mixed (see Section 5.2). Stakeholders suggested that trust can also be garnered through general exposure to the term “CCS”. They raised that embedding CCS in the wider discourse is a precursor for local acceptance. Integrating education on the subsoil into the national curriculum could support an increased understanding of technology processes and risks, as well as potentially increasing skills and knowledge for future generations of employees in the CCS industry.
Stakeholders stressed the importance of raising awareness of CCS within a “toolkit” of other solutions without overplaying it, including showing that CCS can be applied immediately, compared to longer-term solutions. Insight from an interview with a Danish stakeholder shows that Denmark’s cross-party agreement on CCS was key to securing an SLO, as was ensuring that it is applied in a targeted way and accompanied by investments in other solutions, e.g., renewables.
The CCS SLO is also influenced by experience with other infrastructure projects seen to be similar to CCS, as well as general past experiences with industry (Linzenich, Arning and Ziefle, 2021). Stakeholders corroborated this, raising that local history is particularly important for an SLO, specifically prior local experiences with industry. Section 5.2 provides detail on how local history and experiences might affect public perception of CCS.
Compensation and benefits distribution
SLO will also depend on the provision of meaningful benefits, clearly articulated to communities impacted by CCS. The role of compensation and benefits redistribution is still an emerging research area, and there is no centrally agreed way to provide compensation.
Broadly, the literature shows that communities are more likely to support projects when there is appropriate compensation for the impacts in the area (Boomsma et al., 2020; Anders, Liebe and Meyerhoff, 2024). However, in some communities, particularly historically disenfranchised ones, financial compensation can be perceived as community bribery especially if there is pre-existing distrust (Miu et al., 2023). Most stakeholders agreed and noted the risk of the public perceiving they were being “paid off”, as this would suggest that CCS is a bad thing. Therefore, some communities may need financial compensation to be coupled with a long-term trust-building process (Boomsma et al., 2020).
CCS projects must have a coherent narrative around the benefits enabled by CCS, which go beyond compliance or profit-making (Zero Emissions Platform, 2024). Benefits should be balanced with project risks and tailored to relevant local conditions, creating local value for money (NORSAR et al., 2024). This can be through direct financial benefits, e.g., Danish ringfencing of local taxes for community funds, or indirect, through the provision of employment or other socio-economic or environmental benefits. Project developers can consider the remediation of existing problems to improve acceptance, for example removal of obsolete infrastructure (CCUS Projects Network; Parmiter and Bell, 2020).
In a Just Transition context, the social benefits of CCS, including industrial revival, employment and reskilling, are pertinent (Global CCS Institute, 2025). Jobs are consistently highlighted as a key benefit to be returned to local communities through creation of new jobs or safeguarding existing (Zero Emissions Platform, 2024; Department for Energy Security & Net Zero, 2024; Traverse, 2021). Some stakeholders noted examples of US upskilling programmes to enable local communities to work on the CCS project. The communication of job-related benefits should transparently indicate which of these will be temporary or permanent, and which will be local or further afield.
Other perceived benefits of CCS in the UK may include technological leadership and redefining regional identities (Department for Energy Security and Net Zero, 2024; Traverse, 2021). Stakeholders also note benefits to the local environment as potentially relevant in the UK. Early dialogue with local populations may indicate the most relevant benefits, with the understanding that the benefits desired by local communities may be biased towards short-term benefits (CCUS SET-Plan, 2024; Clean Air Task Force and Gładysz, 2025). As early as 2015, the Peterhead public engagement strategy suggested co-creating benefits with local communities (Peterhead CCS Project, 2015).
Finally, CCS benefits should be distributed justly (Clean Air Task Force and Gładysz, 2025; Sovacool et al., 2025). This is pertinent to long CCS value chains, which can span multiple communities, with benefits accruing at certain points along the value chain which may not reflect proximity to project risks. Stakeholders noted that employment is a contributing factor to positive perceptions, but only if jobs are marketed as available for the local community, rather than prioritising or promoting out-of-region talent.
There are some concrete examples of the role of benefits. For example, the mayor of Jurançon in southern France became supportive of the Total-Lacq CCS project after Total agreed to give €1.5M for environmental and social benefits (CCUS Projects Network, Parmiter and Bell, 2020). In Port Talbot, residents have expressed cautious support for CCUS, conditioned by investments in areas in need of regeneration (Sovacool et al., 2025).
Key lessons for Scotland
Like in other countries, Scotland’s attitudes towards CCS remain uninformed and ambivalent, in part due to a lack of public discourse. This ambivalence is a potential opportunity to create informed dialogue, as well as a risk given the malleability of attitudes to anti-CCS narratives. Understanding public perceptions is a precursor to developing CCS projects. One Danish stakeholder highlighted that even early-stage prospecting phases involve significant operations, and as such communities must be deeply understood even in the earliest stages of the project. Questions from the public will become more specific if projects progress and more companies are granted storage licenses, as would be in line with Scotland’s ambition to build a CO2 storage hub in the Scottish North Sea. Key public concerns to address in the early stages are safety and environmental impact around CO2 storage and transport (including offshore operations), fossil lock-in, and disruption.
There is near universal agreement that public concerns and SLO will vary significantly depending on the context, and public support will be shaped by various factors (see Chapter 5). This further reinforces that an understanding of local perceptions, preferences, and concerns in Scotland will be required to establish coherent narratives around CCS. Although strong climate change and net zero narratives will play a role in strengthening the national debate on CCS, economic and Just Transition benefits also will be key to the SLO for Scottish CCS projects. As one stakeholder highlighted, some Scottish communities have a very real lived experience of a Just Transition narrative and are inherently more interested in knowing how not to repeat the mistakes of the past in terms of transition management. The distribution of economic and environmental benefits to affected communities will be key, and any compensation mechanism may run the risk of being perceived as bribery.
Factors influencing public response to CCS
Chapter 4 has already introduced some of the factors affecting public perceptions of CCS. In this chapter, we review in more detail how these factors influence public perceptions, both in terms of concerns around CCS and the precursors to its SLO, based on a review of the literature and consultation with stakeholders.
Technology and design choices
Evidence is varied around how the public responds to different CCS technologies and project designs. Some sources suggest that the primary driver will be the perceived risks and benefits, which can indirectly be affected by technology and design specificities.
A frequently debated but still underexplored determinant of CCS perception is whether CO2 storage is onshore or offshore (Boomsma et al., 2020). As highlighted in Section 4.1.1, CO2 storage generally raises safety concerns. A certain level of risk is perceived regardless, and perceptions are context-specific. However, generally offshore projects have been more readily accepted; a recent Danish case study emphasised this by highlighting a greater willingness to pay for offshore storage (Kim and Ladenburg, 2024; Zuch, 2025). “Not-In-My-Backyard” (NIMBY) attitudes are regularly cited in the grey literature (NORSAR et al., 2024), although some academic literature finds that stronger support for CCS is often observed amongst local communities than distant ones (Whitmarsh, Xenias and Jones, 2019).
Although generally more acceptable, offshore storage can be opposed if it is perceived to negatively impact coastal communities and livelihoods (CCUS Projects Network, Parmiter and Bell, 2020). Stakeholders corroborated this. If a community depends on the sea for its economy, public resistance may be more likely. The notion of compensation also becomes more nuanced with offshore sites, where it is more challenging to identify impacted communities (Boomsma et al., 2020).
Project experience shared by stakeholders shows similar variation. For example, offshore CO2 storage in Denmark has faced little opposition, but CCS has been more negatively framed in the media since the launch of onshore storage sites. In the Netherlands, the 2012 ROAD project faced less negative attention than Barendrecht, attributed in part to its offshore storage plans. A decade down the line, the Dutch Porthos project, also involving offshore storage, has higher levels of acceptance, although public engagement was also much improved following Barendrecht (CCUS SET-Plan, 2024).
There is limited research on how the type of CO2 transport influences public response, although it is also linked to safety and disruption concerns (see Sections 4.2.1 and 4.2.3). Some sources suggest a preference for barge, truck, or tank-based CO2 transport over pipelines (Bellona Foundation, 2022). Others find the opposite. They postulate that this is due to familiarity with pipelines, and a perception of disruption caused by traffic from road transport (von Rothkirch and Ejderyan, 2021; Große-Kreul et al., 2024; Stavrianakis, Nielsen and Morrison, 2023). Additionally, CO2 pipelines can be long and span multiple communities (see Section 4.3.3). As such, the distribution of pipeline benefits needs to be addressed, as communities which are disrupted by pipeline development will likely not receive the opportunities CCS presents (von Rothkirch and Ejderyan, 2021). This could be important for Scotland, given the planned use of onshore pipelines in the Acorn project.
The perceived risks of pipelines can also be proactively managed. The Dutch Porthos project, where the onshore pipeline ran near a village, added a safeguard to the project design specifically to quell public safety concerns around mitigating leakage. This was done despite modelling showing that effects would be negligible even in the event of a leak and was a “no-regret” option that helped gain public trust and acceptance of the technology itself.
Although most public concerns and SLO precursors relate to the storage and transport part of the value chain, the choice of technology for CO2 capture may also generate safety concerns, for example, the carcinogenic effects of amine solvents used in capture units (ACCESS Network, 2024). This was also cited by the Peterhead CCS Project (2015) as a public concern emerging around the planned capture facility at the time. Most consulted stakeholders were unconcerned with public perceptions of the safety of CO2 capture, but one raised the example of Norway’s Mongstad project, where public concerns around amine health risks were seen as a potential “showstopper”.
In general, in almost all cases, energy efficiency and renewables remain preferred solutions over CCS, with the public generally seeing a trade-off between CCS and other technologies (Linzenich, Arning and Ziefle, 2021; Kim and Ladenburg, 2024; Vögele et al., 2018). Once again, these factors are highly contextual. Support for CCS also varies based on whether CCS involves industrial emissions, fossil energy, or carbon removals. Industrial CCS (ICCS) and carbon removals have tended to be more readily accepted than fossil energy CCS, linked to concerns around fossil lock-in (see Section 4.2.2) (Arning et al., 2019; Whitmarsh, Xenias and Jones, 2019; Witte, 2021). However, there are technology specific tensions including concerns for the cost of products where ICCS is used, pathways for long term storage in carbon removals, and perceived impact on land use (Buck, 2021; Tardin-Coelho, Bharadwaj and Ashworth, 2025).
There is also limited evidence on whether the public prefers CCS clusters over isolated (single-source-single-sink) projects. Some sources emphasise that hub-and-cluster models are perceived as more credible than standalone projects, as they signal long-term commitment and shared infrastructure (Greenberg, 2020; CCUS SET-Plan, 2024). Stakeholders highlighted that cluster projects also tend to be built out in areas with pre-existing industrial experience, which can enable an SLO (Section 4.3.2). However, cluster-only CCS developments would likely exclude the cement industry, which is typically located in more rural areas because of necessary land space for quarries.
Finally, there are differences in perception between whether stored CO2 is imported or domestic. Imported CO₂ is consistently less accepted than domestic storage (Merk et al., 2022; Anders et al., 2024; Mohammed et al., 2024) unless tied to clear local benefits, strict liability frameworks, and port safety (Gough and Mander, 2022). This applies to countries advanced in CCS as well. For example, in Norway, support for storage is 81%, for domestic CO2 and 40% for imports (Zero Emissions Platform, 2024). Some sources go as far as suggesting that CO2 should be captured locally to incentivise public acceptance (Reinhold Poulsen, 2021).
The UK’s CCUS Dialogue finds mixed perceptions. The typical concern on whether importing CO2 is equivalent to importing waste is reflected in queries of whether this would make the UK a “dumping ground”. In the small Scottish focus group for this study, some participants cited the potential economic benefit of charging other countries for CO2 storage, while others expressed that only Scottish CO2 should be stored in Scotland (Traverse, 2021). Older research has indicated some recognition of the role of Scotland as a carbon importer and the associated economic benefits, within a small Scottish focus group (Brunsting et al., 2013). However, this would need to be retested on a larger sample and considering current narratives around climate change and decarbonisation.
Stakeholders corroborate this variation in perceptions noting the challenge of perceptions around CO2 as waste. One project developer told us that even CO2 from England could face lower acceptability compared to Scottish CO2. Another suggested that people may be concerned about imports from abroad based on what is known about fracking. On the other hand, there are potential positive narratives around imported CO2, such as “powering” their own country with the stored CO2, or solidarity and meeting collective climate goals. The latter is an important narrative in Denmark, but may not work in all countries, as quoted by a Danish stakeholder. Several stakeholders noted that acceptance of imports would depend on local benefits or compensation, including job creation.
Historical, industrial and social contexts
The literature and stakeholders were in broad agreement that local context is one of the strongest mediating factors in public responses. Support varies between countries and within countries, depending significantly on local priorities, including resource protection and competing economic activities.
As indicated in Section 4.3.2, proximity to industry or historic industrial experience can affect the SLO of CCS. Prior experience and familiarity with industry often increases the likelihood of support for a CCS project (von Rothkirch and Ejderyan, 2021). Stakeholders corroborated this, sharing the example of the industrialised Teesside area, where the population is familiar with industrial development and understand the inherent risks. In these cases, the involvement of industry in CCS is seen as a good thing, as a narrative of “cleaning up their own emissions” – but trust is only generated if industry is funding the intervention. Communities with historic exposure to industry or a longstanding presence of hydrocarbon producers may also accept CO2 storage more readily (Witte, 2021; CCUS SET-Plan, 2024). The visibility of infrastructure and its perceived fit with existing industrial landscapes also matter.
On the other hand, positive perceptions can be undermined where communities have historically seen projects fail to materialise. In the UK, areas with histories of environmental injustice or unmet infrastructure promises exhibit higher baseline scepticism, regardless of project design (Department for Energy Security and Net Zero, 2024a). The UK CCUS Dialogue also found public concerns such as “promises being broken” (Traverse, 2021, p. 26). Perceptions of CCS can also be negatively affected in communities which have experienced accidents or hazards (Sovacool et al., 2025).
Another key determinant is experience with legacy incidents. In Spain, the failed CASTOR CCS project cost €4.7 billion and has driven lower public acceptance, coupled with the lack of a clear CCS policy framework (CCUS SET-Plan, 2024). Some stakeholders suggest that high trust in government can mitigate the persistence of legacy incidents in the collective memory. For example, the overall success of Norwegian CCS is broadly attributed to the political culture with high levels of support for CCS, and a recognition of the oil and gas industry as a driver of wealth and national pride.
The effect of experience is not restricted to CCS experience. People interpret CCS using familiar technologies which they perceive to be similar to CCS, although there may be little to no real similarity. One area which may require monitoring is the public reaction to fossil fuel-related incidents, e.g. pipeline accidents, which have in the past been seen as adjacent to CCS (McLaughlin et al., 2023). Judgements have also been made based on historical incidents perceived to be similar, for example in Lancashire, where residents drew on previous experiences with fracking to inform their mistrust of future CCS projects (Gough, Cunningham and Mander, 2017a). Recent climate effects may increase support for CCS – for example, support for CCS rose in Spain shortly after a major drought (von Rothkirch and Ejderyan, 2021). However, recent evidence from the US shows that this is more ambiguous, and influenced by the political context of the time (Shah et al., 2022). Whether or not the above interpretations still hold today and apply to Scotland, is less clear than the overall finding that public perception of CCS is susceptible to past experiences with other technologies, incidents, and events.
The literature identifies demographic characteristics which may affect local support. Some studies note that men are more likely to report higher levels of CCS awareness than (Anders, Liebe and Meyerhoff, 2024; Whitmarsh, Xenias and Jones, 2019; Zuch and Ladenburg, 2023). This contrasts with the finding that women are more willing to pay for CCS than men, highlighting a potential gap between awareness and support (Waring and Longo, 2025). Those concerned for the climate are also more likely to support CCS deployment (Anders, Liebe and Meyerhoff, 2024; Zuch, 2025). Similarly, higher-educated individuals are more aware of CCS. However, the impact on public response of increasing CCS knowledge is nebulous. Research on this is limited, but some older sources find that familiarity leads to acceptance (Arning et al., 2019), while others that it amplifies perceived risk (Braun, 2017). Stakeholders consulted for this study noted that familiarity is a key precursor for acceptance on a local level and can be boosted through education and increased communications around subsurface operations.
Communication source and timing
Message framing and narratives
How a CCS message is framed in communications influences public perception. Messaging that is accessible, evidence-based, and non-persuasive tends to generate more trust and engagement than communications perceived as promotional or controlling (Shackley et al., 2013). Climate and economic-focused frames raise acceptance, while overly risk-focused or overly reassuring messages both reduce credibility potentially eroding trust (von Rothkirch and Ejderyan, 2021). Framing CCS as part of the wider strategy for tackling climate change, including pairing it with bioenergy or CCU, increases CCS support; while mentioning even very modest costs can reduce it (Whitmarsh, Xenias and Jones, 2019). At the same time, technocratic communication often fails to resonate with publics, particularly where values-based concerns, such as fairness and long-term responsibility, are not acknowledged (Macgillivray and Livesey, 2021). Similarly, Sovacool et al. (2025) argue that framing CCS purely in terms of efficiency or cost-effectiveness undermines legitimacy, and rather framings that address justice, accountability, and governance are more effective. Some sources highlight that CCS could be more supported if it is framed as innovative (Clean Air Task Force, 2023a). On the other hand, providing distinct examples of successful CCS projects, grounded in tangible local contexts, may alleviate the perception of risk from CCS as an “unproven technology” (Traverse, 2021).
Behind the message framing itself, the coherence of narratives and message framing between communicators is a driver of credibility and public response. Coherent narratives around benefits are particularly important (see Section 4.3.3). Stakeholders exemplified Denmark, which has a written mandate that citizens, municipalities and regions must be involved with this narrative development. Such involvement may prove useful for understanding which communities would not be receptive to CCS, as highlighted by one stakeholder. Other actors’ role in narrative development, such as the media, should also be considered (Energy Policy Group, 2022b). Finally, CCS narratives can shift if wider narratives around climate change or Just Transition wax and wane, which can in turn affect the SLO.
Communication source
The credibility of CCS is highly shaped by the messenger who communicates on it (CCUS Projects Network, Parmiter and Bell, 2020). This is particularly key as CCS is a technology which the public is less aware of and so is more liable to be treated with suspicion (Energy Policy Group, 2022a, NORSAR et al., 2024). This suspicion has also been flagged as a specific concern in the UK, including in terms of “shifting” from a focus on proven technologies (UK Government, 2025).
How the choice of communication source impacts public perceptions of CCS is modulated by trust in that communicator (see Section 4.3.1). NGOs, universities, and independent experts are regularly noted as more trusted communication sources than industry or government (Eberenz et al., 2024; Große-Kreul et al., 2024). This also holds for the UK specifically but ultimately varies between local contexts (Traverse, 2021). The wider political context also matters. One stakeholder highlighted that since Brexit, and exacerbated by the Covid-19 pandemic, there has been a general distrust of “expertise” amongst the public.
Whoever the trusted actors are in a particular context, public trust increases if they are coordinated by “local champions” and supported by independent analysis (Zero Emissions Platform, 2024, Energy Policy Group, 2021, NORSAR et al., 2024). Key allies for CCS communication are suggested to be scientists, NGOs, and politicians, media experts, journalists, and respected community members. Opinion formers and community leaders are also essential to building local acceptance of projects (Scottish CCS, 2010). Support from environmental NGOs was also essential for the Porthos project in the Netherlands in gaining public acceptance (CCUS SET-Plan, 2024).
The importance of local stakeholders or champions as CCS messengers was stressed by consulted stakeholders, to “humanise” the industrial development which CCS projects bring. One stakeholder emphasised that best practice engagement would firstly identify who local community figureheads are and ensure their buy-in as a first port-of-call. Examples given included local sports club owners, vocal residents on community social media pages and pub owners. It was highlighted that this was very specific to the local context.
Involving multiple agencies in communicating on CCS can be helpful in balancing information but this must be done coherently (CCUS Projects Network, Parmiter and Bell, 2020). Cross-industry groups can also play a role, with one stakeholder pointing to the Humber Energy Board as a good-practice example. As highlighted above, coherent messaging between national and local levels is key. One stakeholder observed public suspicion of CCS could rise if CCS had not previously been part of national dialogue.
Communication timing
There is near-universal agreement across the literature and consulted stakeholders that public communication and engagement must start early and be sustained across the project lifecycle (Global CCS Institute, 2025; CCUS Projects Network, Parmiter and Bell, 2020). Early-stage communication, before key decisions are perceived as fixed, is essential for building trust (Shackley, Mabon and Evar, 2013).
A lack of early engagement is often cited as a driver of project failure, for example at Barendrecht (Zero Emissions Platform, 2024), alongside other factors cited earlier in this study. On the other hand, the Getica CCS demonstrator in Romania conducted educational and information activities as early as feasibility study stage (Energy Policy Group, 2021). In the UK, the CCUS public dialogue also highlights that communities are more receptive when CCS is introduced during agenda-setting phases, whilst engagement after key siting or design decisions have been made is perceived as procedural tokenism (Traverse, 2021). Macgillivray and Livesey (2021) point out that late-stage engagement often shifts public focus from substantive risk questions to issues of fairness and trust.
International evidence and feedback from consulted stakeholders reinforce the essential nature of early engagement. Stakeholders pinpointed that early engagement must focus on clear communication of costs and benefits. Caveats should be considered; one stakeholder highlighted that early engagement may open the project up to questions that might not be able to be answered.
Continuous, iterative engagement over a CCS project lifetime is essential. Stakeholders emphasised that communities should know where to voice concerns throughout the project lifecycle. Some noted that continuous engagement would also be necessary to ensure future project buy-in, mitigate potential negative attention from the media or vested interests, and secure trust in messengers. If the same messengers keep showing up consistently, over a long period of time, they are more likely to be trusted.
Key lessons for Scotland
Of the significant range of factors influencing public perceptions of CCS, several will be more relevant to Scotland and the country’s upcoming CCS project pipeline.
Possibly the most important lesson for Scotland, given the impending launch of the Acorn project, is the need for early, sustained, and credible engagement. Timing and continuity are critical success factors for public buy-in. In Denmark, engagement began five years before any project license were awarded, to lay foundational knowledge on the importance of CCS. The most credible communicator will depend on the particularities of the local context. Regardless of who they are, they will need to remain approachable and consistently visible across the project lifecycle. Their communication must be two-way, honest and balanced to avoid over-provision of information. Continuous transparency will be at the heart of public acceptance, including a recognition that CCS projects are learning by doing, do not have all the answers, and may face factors outside of their control.
Even though CO2 storage in Scotland will predominantly be offshore, safety concerns are likely to play a prominent role in public discussions, given the relative novelty of CCS technologies in Scotland’s net zero portfolio. Furthermore, given the importance to Scots of the marine habitats and renewable energy potential of Scotland’s seas (Scottish Government, 2019), the ability of CCS projects to safeguard marine life and renewable energy projects is likely to influence public perception around project safety. Finally, concerns around safety, but also around cost and fossil lock-in, are susceptible to return if they are not managed long-term, through continuous public engagement (see Chapter 6).
Public response will be influenced by Scotland’s history and familiarity with industry and oil and gas. In general, CCS may face less public opposition at a local level if projects are built in areas familiar with industrial activity and involve repurposed infrastructure. This is a positive starting point in Scotland, where the Acorn project transects areas with a rich industrial history and uses legacy gas infrastructure. However, this should not be assumed to automatically generate a positive response. Trust in Scottish industry, particularly the oil and gas sector, is variable, and lived experiences of poor transition management by industry and government will further raise concerns on CCS becoming a “broken promise”. These may be particularly sensitive, as some communities, such as in Scotland’s Central Belt and Fife regions, may still be grappling with the effects of “unjust” transitions in the 1970s and 1980s surrounding the closure of Scotland’s coal mining industry. Early engagement of communities in industrial areas is essential to identify current attitudes towards CCS and the actors involved in project deployment.
This early, place-specific engagement and assessment of perceptions, “social site characterisation”, as defined by Brunsting et al. (2013), can also distinguish perceptions influenced by technology and design factors. Given that the Acorn project plans to involve capture from fossil energy production and industrial sites, perceptions may vary between the project’s capture sites, with a possible preference for industrial CCS. Perceptions, and the ultimate SLO of Scottish CCS, may also vary depending on the planned role of CO2 imports as part of building out Scotland’s North Sea storage hub. On the one hand, narratives around CO2 imports may boost positive perceptions around leadership, but on the other they risk creating associations with waste dumping. This may be a particularly sensitive subject in the broader context of perceptions of fairness by Scots, including a belief that emissions should be dealt with by those responsible (Sovacool et al., 2025, University of Glasgow, 2024) Transparent communication around plans to import CO2 are best received if they include a clear presentation of economic benefits, safeguards around storage integrity, and regulatory mechanisms to preventing the acceptance of imports propping up fossil fuel use abroad.
Scotland’s wider political environment and current national debate will also influence perceptions of CCS. For example, cost concerns and doubts about the perceived effectiveness of CCS may be amplified by recent budgetary constraints and funding announcements, with many actors concerned about their expense. This is particularly important given the UK’s reliance on a Regulated Asset Base model for CO2 transport and storage infrastructure, involving significant subsidies and financial safeguards to project developers. Stakeholders point out that these cost concerns often do not consider potential future savings once the CCS market matures, which can be addressed through awareness-raising. Other concerns can be much more related to Scotland’s control over CCS funding, for example whether it is reserved to the British Government. Scepticism of a Westminster-managed transition may also extend to the language used in CCS communications, with one stakeholder highlighting that terms such as “levelling up” can be seen as political buzzwords.
An understanding of public perceptions and the factors shaping them will drive the design of public engagement on CCS. In the next chapter, we draw on literature findings and stakeholder inputs to present lessons learned on public engagement with CCS.
Public engagement with CCS
Opportunities and challenges of public engagement with CCS
Public engagement can be seen as an opportunity that benefits CCS projects, stakeholders, and the public. Good public engagement can raise awareness, build trust, secure public buy-in, and even establish a talent pipeline for a skilled CCUS workforce (Zero Emissions Platform, 2024; Sovacool et al., 2025). Consulted stakeholders highlighted the chance to highlight the benefits and economic potential of CCS, build genuine relationships in communities, and address public concerns head-on, including those of stakeholders with competing interests. In the Scottish context, the permitting process already requires consideration of alternative developments, and an engagement strategy to pre-empt undue issues with other users of the seabed. If such engagement is early and genuine, it can generate trust throughout the consultation process, and potentially secure political backing for future CCS projects.
There are several key challenges to public engagement with CCS. Stakeholders noted a general lack of public understanding both of CCS and its potential, which can lead to ambivalent, disinterested attitudes, low response rates in consultations and other engagement activities. Project developers generally quoted low response rates, such as less than 0.1% attendance at town hall meetings. Response rates have been slightly higher where storage sites are located closer to shore, such as the HyNet project. Others pointed to the risk of anti-CCS agendas being more readily received by publics with limited knowledge of CCS, particularly if these agendas are communicated with high levels of emotional content.
Other challenges highlighted by stakeholders include legal challenges by organised groups, such as the HyNOT group protesting the HyNet project. These can garner media attention and transform public ambivalence into discontent. Another prominent challenge is combating misinformation without adversarial messaging, and managing pre-existing negative bias against CCS, requiring collaboration with trusted actors to stop continuous opposition. In some cases referenced by stakeholders, success was simply to stop anti-CCS actors from publicly opposing development at every step in the consultation process, rather than to change the minds of the adamant voices against CCS as a concept.
Delivering public engagement around CCS also poses risks if it is not perceived as genuine (Terwel, ter Mors and Daamen, 2012). Even when there are pathways to share local views, if participants believe that their opinions will not lead to genuine change, trust can be damaged (ibid.). To address this risk, engagement should be transparent, two-way, proactive, and place specific. It should leverage local networks, take place early, provide clear pathways for communities, and respect the time scarcity of local residents by providing a variety of different ways to engage.
There is disagreement on the importance of general information and education of the public on CCS. Some literature sources consider it to be vital, to reduce the amplification of perceived risks and the susceptibility to influence by misinformation and controversy (Clean Air Task Force and Gładysz, 2025; Zero Emissions Platform, 2024). Some stakeholders agree that broader societal engagement is very important and not yet happening in the UK. Such engagement necessarily includes communicating the costs and benefits, which technologies are important and how they will be deployed. Not doing this broader engagement risks that the first time that communities hear about CCS as a concept is when a project is being developed in their locality. One stakeholder noted a “bad practice” example where the first interaction of local homeowners with a CCS project was to be asked by land agents about the mortgage position on their properties, with little context given. The stakeholder perceived that this prompted fear at the outset. Another stakeholder noted that this can damage trust surrounding the technology, working on the logic that if the technology was so important, it would be better-known. It was suggested that strengthening national-level dialogue whilst remaining consistent with current messaging around the economic and climate potential is key. This could be devolved regionally, with more specific dialogue on why certain regions have been selected for CCS.
In contrast, stakeholders also warn about risk of over-provision of information and point out that there is a limit to how transparent public engagement should be. One stakeholder noted a risk that being fully transparent can lead to opposition. For example, open-access information on pipeline leaks can be used to provoke fear. Others noted that despite the importance of transparency, the public may have specific questions for which there are no answers yet. In this case, it is important to communicate clearly a timeline of key dates and phases indicating what information will be available and when.
Some stakeholders consider that rather than a general education effort, CCS simply needs to be more visible as part of the UK’s national debate on climate and energy. One noted that the educational aspect of engagement has typically been left to project developers, rather than being more widely delivered in a national dialogue. Enabling more visibility of CCS in national discourse can also mitigate misinformed reporting driven by anti-CCS agendas.
Main public engagement models
Public engagement models exist on a spectrum from non-participation to citizen power (Arnstein, 1969). The method employed will depend on the rationale for the engagement. This can be simply for instrumental (aiming to achieve a set outcome, persuasion-focused “manipulation”), normative (aiming to do the right thing), or substantive purposes (aiming to co-create the outcome powers, where the local community has the final say) (European Environment Agency, 2023; Scottish CCS, 2010). The less the opportunity for public input, the higher the likelihood of opposition. Conversely, at higher levels of participation, the trade-offs include longer timelines, higher effort required from project actors, and the risk of project alteration to the public’s preference rather than the best choice for the project to be tenable. Table 1 sets out the main types of public engagement and their implications for CCS.
Engagement Description | Implications for CCS | References |
|---|---|---|
One-way information provision/ collection (e.g., websites, leaflets, polling) | Information provision is essential for inclusive engagement, however if the information comes from a sole untrusted source it may exacerbate fear or suspicion. Appropriate only as a supplement or where trust levels are extremely high. | (L’Orange Seigo, Dohle and Siegrist, 2014) |
Two-way processes (e.g. formal consultation, listening exercises, public meetings) | Effective when early, tailored to local context, and visibly influences decisions. Still limited if perceived as pseudo-voice. | (von Rothkirch and Ejderyan, 2021) |
Participatory processes (e.g., workshops, citizen juries, community advisory boards) | Strongest for building, trust, and long-term SLO. Allows genuine influence, supports transparent decision-making, responds to local identities and concerns (e.g. through stakeholder networks). | (Gough, Cunningham and Mander, 2018) |
The literature and stakeholders highlight the essential nature of appropriately resourced, two-way communication tailored to the specific audience being engaged (NORSAR et al., 2024; CCUS Projects Network, Parmiter and Bell, 2020; European Commission, 2024). High-quality public engagement includes specific measures to engage “hard-to-reach” groups and meets residents through local approaches in coffee shops, schools and community spaces (Süsser et al., 2024;Zero Emissions Platform, 2024). They also provide a diverse range of methods for participants to engage, prioritising face-to-face approaches and interactive messaging where possible. In some cases, citizen juries could improve awareness of CCS, as well as offer an opportunity to test and refine communication strategies (Zero Emissions Platform, 2024). Visible safety monitoring is highlighted as an important way to prove to citizens that their concerns are being taken seriously (Clean Air Task Force and Gładysz, 2025; CCUS Projects Network, Parmiter and Bell 2020). Some CCS projects have even involved citizens in these monitoring efforts, which is an example of participatory engagement (CCUS Projects Network, Parmiter and Bell, 2020).
Despite the higher effort required, many sources insist on the essential nature of sustained two-way public engagement on CCS, given the risks outlined in Section 6.1. Engagement should happen across the project lifecycle, starting with a solid understanding of pre-existing attitudes, perceptions, and preferences, including the “societal readiness level” for CCS (NORSAR et al., 2024). Based on this understanding, inclusive engagement plans can be developed at broad and project-specific levels, providing all relevant stakeholders with the opportunity to participate in discussions on CCS. At project level, tailoring communication to the issues of importance to different communities, involving communities in decision-making, and ongoing transparency including data-sharing and incident reporting are key (Clean Air Taskforce, 2024). One stakeholder defined “engaging well” as sticking to the facts, having answers in place to respond to concerns, and communicating clearly how any public opinions will be considered in the planning process. This included being clear on the degrees of permissible public involvement and the reasons behind this (Scottish CCS, 2010).
Lessons from other jurisdictions
In this section, we present additional lessons from other jurisdictions on public engagement with CCS, at national and project level. These are distinct lessons learned from those presented earlier in Chapter 6, or they reinforce them with specific examples on the ground.
Jurisdiction-level findings
At EU level, evidence emerges on the potential for mandating public engagement. The EU Innovation Fund, which funds CCUS projects, includes requirements for knowledge dissemination meant to increase peer-to-peer discussions at local level (Bellona Europa, 2025). In the United States developers seeking funding for CCS projects are obliged to develop a Community Benefit Plan including plans for community engagement, environmental justice, and workforce development (Bellona Europa, 2023). The requirements on public engagement for CO2 storage are more extensive than those for similar injection activities (US Environmental Protection Agency, 2010). In Victoria, Australia, publishing detailed project information and consulting communities first is a regulatory requirement (International Energy Agency, 2022).
National-level findings from other jurisdictions also reinforce the importance of committing to meaningful public engagement, as highlighted in Section 6.2. In the Netherlands, despite the failure of the Barendrecht project, the engagement framework of the 2019 Dutch Climate Agreement set a precedent for involving civil society on CCS strategy development (Clean Air Task Force, 2022). In our consultations, stakeholders from Denmark, one of the EU’s most advanced countries in CCS, reiterated the importance of public meetings, close dialogue, information campaigns, readily available expertise to answer questions and concerns, and obligations on project developers to keep communities informed. They added that at the local level, project developers should be preceded by public body representatives to set the scene and local messengers are essential to collaborate with. Other stakeholders with experience in Denmark and the UK pointed out that even a local accent can improve credibility.
Project-level examples
Concrete CCS projects reinforce some of our findings on public engagement, for example the importance of consistent visibility and transparency to the public (see Section 6.2). In Canada’s Shell Quest project, the set-up of a Community Advisory Panel improved public trust in the project (International Energy Agency, 2022). The project offered groundwater sampling services to locals for two years to monitor CO2 storage integrity, until asked to cease by landowners (CCUS Projects Network, Parmiter and Bell, 2020). In the US, the Decatur project in Illinois adopted a range of public engagement activities including a roadshow, media partnerships, and working with a community college including an outreach centre (CCUS Projects Network, Parmiter and Bell, 2020). Being public facing is also a feature of Norway’s Longship project, which hosts a visitor centre for public engagement and knowledge sharing (Clean Air Task Force and Gładysz, 2025).
The Tomakomai project in Japan is an example of successful public engagement which offers direct evidence for the importance of identifying local concerns early, conducting participatory engagement, and continuous transparency. The project developers conducted social site characterisation and established a CCS Promotion Association reflecting all key stakeholder groups in the region. They also set up a public information centre, offered site tours, openly published monitoring data, developed tailored communication materials and organised annual open fora (Sawada and Tanaka, 2020). A key aspect was the continuous focus on monitoring, with ongoing public disclosure and the receipt of continuous feedback (Mabon, Kita and Xue, 2017). Importantly, the project also reacted quickly to potential threats to public approval. After an earthquake struck the area, the developer commissioned an independent expert panel to assess whether CO2 injection had generated any seismic activity, pre-empting speculation (Kawabata, 2023).
Examples of failure in public engagement are also important to learn from. As mentioned throughout this report, the Barendrecht project has been extensively studied in this sense. Other projects also reinforce lessons on public engagement such as the risk of over-provision of information (see Section 6.1). For example, despite working to understand local concerns and build tailored solutions, the Carbfix project in Iceland published seismicity data without methods for communities to interpret it, increasing public concern. In this case, concerns only stabilised once an independent expert panel and coordinated communication protocol were introduced (Thorsteinsson and Gunnarsson, 2014; Andrić et al., 2018). Alongside over-informing, over-promising can also be risky. Australia’s Gorgon project failed to meet its CO2 storage targets, which undermined public confidence (Clean Air Task Force and Gładysz, 2025).
Key lessons for Scotland
Lessons on public engagement from the literature and stakeholders apply to national-level debate on CCS in Scotland, and to interacting with communities local to the Acorn and future projects. At national level, lessons learned on public engagement can be mapped to the “Understand, Participate, Act” pillars of Scotland’s Net Zero Nation public engagement strategy (Scottish Government, 2021). Such a streamlined approach to CCS communication could improve social engagement and unpick which of the lessons learned are CCS-specific, and which can be applied to wider infrastructure or net zero projects (Table 6‑2).
Engagement pillar of Net Zero Nation strategy | Lessons learned for public engagement (CCS-specific) | Lessons learned for public engagement (general) |
|---|---|---|
Understand: Increase knowledge and awareness of CCS in Scotland |
|
|
Participate: Offer public the chance to input into CCS strategies, ensuring procedural justice |
|
|
Act: Effectively respond to public concerns through long-term engagement |
|
|
The lessons outlined in Table 2 are umbrella issues within which project-specific public engagement will need to develop at specific sites. Similarly, it is useful to map findings onto project-specific public engagement of a typical CCS project lifecycle, focusing on the stages most relevant for Scotland. Table 3 charts the main lessons learned on public engagement against the appraisal, planning, construction and operation phases of a CCS project. More detail is provided in Appendix C (Table 4).
CCS lifecycle stage | Appraisal and planning before Final Investment Decision | Development and construction including mandatory public consultation | Operation including potential new capture sites |
Lessons learned |
|
|
|
Although less relevant for Scotland’s current project pipeline, successful public engagement continues in the final CCS project stage of decommissioning, storage site closure, and post-closure monitoring. In this stage, a clear assignment of monitoring responsibilities, coupled with continuous and accessible information on the behaviour of the sealed CO2 storage site, will be an essential part of maintaining long-term public trust.
Conclusions and lessons learned
There is a growing body of academic research on public perceptions of CCS, increasingly supplemented by valuable lessons from the deployment of CCS projects. They broadly indicate that:
- Scotland, as many other countries, displays low awareness of CCS in the general population, with ambivalent opinions susceptible to change.
- Among the key public concerns around CCS, safety, cost, fossil lock-in, and disruption are likely to be present in any forthcoming debate on CCS.
- Scotland’s rich industrial heritage may boost positive baseline perceptions of CCS.
- Past experiences with transition management, concern for the marine environment, and a general lack of public dialogue on CCS may hinder its SLO.
- Key precursors to acceptability will be confidence in project developers, reassurance regarding storage risk mitigation, and genuine bidirectional public engagement which delivers coherent messages early on and continuously across project lifecycles.
- Benefits redistribution to affected communities will be key. Employment benefits in Just Transition areas are likely to be essential, alongside environmental co-benefits.
Despite the challenges and risks associated with it, public engagement on CCS can increase awareness and improve trust, if done well. Research and project experience indicates several key findings for Scotland:
- Public engagement starts with enabling more visibility of CCS in the public debate on net-zero and Just Transition, in parallel with social site characterisation by project developers at the appraisal stage of CCS projects
- Two-way engagement methods in which trusted actors communicate benefits, risks, and mitigation measures have the highest chance of fostering meaningful dialogue with local communities and improving acceptability of CCS projects. They can be deployed at key decision points in the project.
- Continued public engagement using a range of methods will be required across project construction, operation, and decommissioning. Particularly in the operation stage, robust monitoring of project performance, including the behaviour of CO2 being transported and injected, can significantly improve trust in the project if results are disclosed transparently and well-explained.
- Successful examples of public engagement include the Porthos and Northern Lights projects in Europe, as well as projects in the US, Japan, and Canada. Lessons learned from these projects can be leveraged as part of Scotland’s existing public engagement strategy on net zero. This strategy and its associated “Understand, Participate, Act” framework for public engagement with climate change is a potential enabler for CCS engagement, although not entirely transferable.
Even if public engagement is exemplary in the short to medium term, as Scotland moves forward with its net zero transition, it is important to acknowledge that the SLO of CCS is neither guaranteed nor fixed in the long term. If Scotland expands its CCS project portfolio and utilisation of its North Sea storage capacity, acceptability may need to be revisited as more communities find themselves hosting CCS projects or CO2 begins to be imported. Conversely, some jurisdictions with a history of strong opposition to CCS are now some of the most advanced in project deployment, such as Denmark and the Netherlands. The key differentiators are learning from previous experiences, attending to public concerns early, and respecting local community contexts. These actions will influence how the public ultimately perceives, reacts, and ultimately accepts or rejects CCS.
References
ACCESS Network (2024) Case Study H- Carbon Capture and Storage in Barendrecht, Netherlands. Available at: https://accessnetwork.uk/case-study-h-carbon-capture-and-storage-in-barendrecht-netherlands/ (Accessed: 22 October 2025).
Anders, S. et al. (2024) Public Preferences and Behaviours around CCS Technology in Different Social and Geographical Contexts.
Anders, S., Liebe, U. and Meyerhoff, J. (2024) ‘Cross-border CO2 transport decreases public acceptance of carbon capture and storage’, Nature Climate Change 2024 14:7, 14(7), pp. 692–695. Available at: https://doi.org/10.1038/s41558-024-02023-0.
Andrić, I. et al. (2018) ‘CarbFix – public engagement and transparency’, Energy Procedia, 146, pp. 115–120. Available at: https://doi.org/10.1016/j.egypro.2018.07.015.
Arning, K. et al. (2019) ‘Same or different? Insights on public perception and acceptance of carbon capture and storage or utilization in Germany’, Energy Policy, 125, pp. 235–249. Available at: https://doi.org/10.1016/J.ENPOL.2018.10.039.
Arnstein, S.R. (1969) ‘A Ladder Of Citizen Participation’, Journal of the American Planning Association, 35(4), pp. 216–224. Available at: https://doi.org/10.1080/01944366908977225;WGROUP:STRING:PUBLICATION.
Baxter, P.J., Kapila, M. and Mfonfu, D. (1989) ‘Lake Nyos disaster, Cameroon, 1986: the medical effects of large scale emission of carbon dioxide?’, BMJ : British Medical Journal, 298(6685), p. 1437. Available at: https://doi.org/10.1136/BMJ.298.6685.1437.
Bellona Europa (2023) CCUS Forum 2023 – stocktake & where to go from here? – Bellona EU. Available at: https://eu.bellona.org/2023/12/20/ccus-forum-2023-stocktake-where-to-go-from-here/ (Accessed: 21 October 2025).
Bellona Europa (2025) What’s Blocking the CO₂ Market? Unpacking Potential Market Failures – Bellona EU. Available at: https://eu.bellona.org/2025/08/07/whats-blocking-the-co%e2%82%82-market-unpacking-potential-market-failures/ (Accessed: 21 October 2025).
Bellona Foundation (2022) Different situations require different solutions, Multi-modal CO2 transport key on path to net-zero – Bellona.org. Available at: https://bellona.org/news/eu/ten-t/2022-09-different-situations-require-different-solutions-multi-modal-co2-transport-key-on-path-to-net-zero (Accessed: 21 October 2025).
Boomsma, C. et al. (2020) ‘Community compensation in the context of Carbon Capture and Storage: Current debates and practices’, International Journal of Greenhouse Gas Control, 101, p. 103128. Available at: https://doi.org/10.1016/J.IJGGC.2020.103128.
Braun, C. (2017) ‘Not in My Backyard: CCS Sites and Public Perception of CCS’, Risk Analysis, 37(12), pp. 2264–2275. Available at: https://doi.org/10.1111/RISA.12793;REQUESTEDJOURNAL:JOURNAL:15396924;WGROUP:STRING:PUBLICATION.
Brunsting, S. et al. (2010) Stakeholder Participation and Onshore CCS: Lessons from the Dutch CCS Case Barendrecht Background and Method. Available at: https://publications.tno.nl/publication/34630217/Jd96F7/l10103.pdf (Accessed: 22 October 2025).
Brunsting, S. et al. (2013) ‘Social Site Characterisation for CO2 Storage Operations to Inform Public Engagement in Poland and Scotland’, Energy Procedia, 37, pp. 7327–7336. Available at: https://doi.org/10.1016/J.EGYPRO.2013.06.671.
Buck, H.J. (2021) ‘Social science for the next decade of carbon capture and storage’, The Electricity Journal, 34(7), p. 107003. Available at: https://doi.org/10.1016/J.TEJ.2021.107003.
Carbon Gap (2026) Carbon Removal in the Netherlands – National Policy Overview. Available at: https://tracker.carbongap.org/regional-analysis/national/netherlands/ (Accessed: 20 January 2026).
Cavanagh, A. et al. (2024) Onshore and inshore storage of carbon dioxide. Available at: https://www.climatexchange.org.uk/publications/onshore-and-inshore-storage-of-carbon-dioxide/ (Accessed: 16 December 2025).
CCUS Projects Network, Parmiter, P. and Bell, R. (2020) Public perception of CCS: A Review of Public Engagement for CCS Projects.
CCUS SET-Plan (2024) Deliverable 2.4Report on key enablers and hurdles for CCS/CCU projects focus on public perception. Available at: https://ec.europa.eu/research/participants/documents/downloadPublic?documentIds=080166e50b7b90ac&appId=PPGMS (Accessed: 22 October 2025).
Clean Air Task Force (2022) Five core components of a national carbon management strategy in Germany – Clean Air Task Force. Available at: https://www.catf.us/2022/07/carbon-manegement-strategy-part-2/ (Accessed: 20 October 2025).
Clean Air Task Force (2023a) Perceptions of clean energy technologies in Europe Results from public perception survey in Germany. Available at: https://cdn.catf.us/wp-content/uploads/2023/11/30102107/CATF_PublicPerceptions_Full_11.29-1.pdf?_gl=1*y9fwvg*_gcl_au*MTkzMTY1MzY3OC4xNzU2OTczNTEz*_ga*R0ExLjEuR0ExLjEuR0ExLjEuR0ExLjEuR0ExLjEuR0ExLjEuR0ExLjEuNjM2MzM5NTYwLjE3NTY5NzM1MTM.*_ga_88025VJ2M0*czE3NjA5NzY5MDYkbzQkZzEkdDE3NjA5NzY5NDMkajUyJGwwJGgxNTE3OTA0MTE4*_fplc*cmJwSmF5Q1YlMkJHRm9ySjc5bjgwaXZoWnlYSUxZY05NbWpiR1ZBU1JVV3lIRiUyQkFYM0JPZ2ZTcGtHc1JWYkwlMkJCTzF0aEJOYXd5VmxrTUNQeWxaN1NkZzNmTHU3TjZ2bCUyQnVqYk94UnZNRWJzRUI5Z3Z5OTl0bEdhRm9lcDVJenclM0QlM0Q. (Accessed: 20 October 2025).
Clean Air Task Force (2023b) Polling shows that Europe is ready for clean firm energy technologies – Clean Air Task Force. Available at: https://www.catf.us/2023/11/polling-shows-that-europe-is-ready-for-clean-firm-energy-technologies/#038;swpmtxnonce=8e785b0ae9 (Accessed: 20 October 2025).
Clean Air Task Force and Gładysz, P. (2025) Capturing Public Trust: Social Acceptance of CCS in Poland 2 CATF-Capturing Public Trust: Social Acceptance of CCS in Poland. Available at: https://cdn.catf.us/wp-content/uploads/2025/10/20031148/CATF-Social-Acceptance-of-CCS-in-Poland-Brief.pdf?_gl=1*pgk9s8*_gcl_au*MTkzMTY1MzY3OC4xNzU2OTczNTEz*_ga*R0ExLjEuR0ExLjEuR0ExLjEuR0ExLjEuR0ExLjEuR0ExLjEuR0ExLjEuNjM2MzM5NTYwLjE3NTY5NzM1MTM.*_ga_88025VJ2M0*czE3NjA5NzY5MDYkbzQkZzEkdDE3NjA5NzY5MzUkajYwJGwwJGgxNTE3OTA0MTE4*_fplc*cmJwSmF5Q1YlMkJHRm9ySjc5bjgwaXZoWnlYSUxZY05NbWpiR1ZBU1JVV3lIRiUyQkFYM0JPZ2ZTcGtHc1JWYkwlMkJCTzF0aEJOYXd5VmxrTUNQeWxaN1NkZzNmTHU3TjZ2bCUyQnVqYk94UnZNRWJzRUI5Z3Z5OTl0bEdhRm9lcDVJenclM0QlM0Q. (Accessed: 20 October 2025).
Clean Air Task Force and Lockwood, T. (2022) A European Strategy for Carbon Capture and Storage: Key policy recommendations for commercialisation of carbon capture and storage and carbon removal and storage technologies. Available at: https://cdn.catf.us/wp-content/uploads/2024/02/07052545/CATF_CCSEuropeStrategy_Report_final.pdf?_gl=1*6ijccj*_gcl_au*MTkzMTY1MzY3OC4xNzU2OTczNTEz*_ga*R0ExLjEuR0ExLjEuR0ExLjEuR0ExLjEuR0ExLjEuR0ExLjEuR0ExLjEuR0ExLjEuR0ExLjEuR0ExLjEuR0ExLjEuR0ExLjEuR0ExLjEuNjM2MzM5NTYwLjE3NTY5NzM1MTM.*_ga_88025VJ2M0*czE3NjA5NzY5MDYkbzQkZzEkdDE3NjA5Nzc1MzYkajkkbDAkaDE1MTc5MDQxMTg.*_fplc*cmJwSmF5Q1YlMkJHRm9ySjc5bjgwaXZoWnlYSUxZY05NbWpiR1ZBU1JVV3lIRiUyQkFYM0JPZ2ZTcGtHc1JWYkwlMkJCTzF0aEJOYXd5VmxrTUNQeWxaN1NkZzNmTHU3TjZ2bCUyQnVqYk94UnZNRWJzRUI5Z3Z5OTl0bEdhRm9lcDVJenclM0QlM0Q. (Accessed: 20 October 2025).
Clean Air Taskforce (2024) ‘MMV Public Acceptance and Transparency’. Available at: https://sccs.stanford.edu/sites/g/files/sbiybj17761/files/media/file/grove-mmv-public-acceptance-and-transparency.pdf (Accessed: 27 October 2025).
Crown Estate Scotland (no date) Carbon capture and storage. Available at: https://www.crownestatescotland.com/scotlands-property/marine/carbon-capture-and-storage (Accessed: 20 January 2026).
Department for Energy Security and Net Zero (2023) DESNZ Public Attitudes Tracker: Crosstabulations, DESNZ Public Attitudes Tracker – Spring 2023. Available at: https://view.officeapps.live.com/op/view.aspx?src=https%3A%2F%2Fassets.publishing.service.gov.uk%2Fmedia%2F6509715f22a783001343e85b%2FDESNZ_Public_Attitudes_Tracker_Spring_2023_Crosstabulations_Sep_23_update.xlsx&wdOrigin=BROWSELINK (Accessed: 22 January 2026).
Department for Energy Security and Net Zero (2024a) DESNZ Public Attitudes Tracker. Available at: https://www.gov.uk/government/collections/public-attitudes-tracking-survey (Accessed: 12 December 2025).
Department for Energy Security and Net Zero (2024b) DESNZ Public Attitudes Tracker: Energy infrastructure and energy security, Spring 2024, UK – GOV.UK. Available at: https://www.gov.uk/government/statistics/desnz-public-attitudes-tracker-spring-2024/desnz-public-attitudes-tracker-energy-infrastructure-and-energy-security-spring-2024-uk (Accessed: 21 October 2025).
Department for Energy Security and Net Zero (2025) DESNZ Public Attitudes Tracker: Spring 2025, DESNZ Public Attitudes Tracker. Available at: https://www.gov.uk/government/statistics/desnz-public-attitudes-tracker-spring-2025 (Accessed: 22 January 2026).
E3G (2023) Carbon capture and storage ladder . Available at: https://www.e3g.org/publications/carbon-capture-and-storage-ladder/ (Accessed: 20 January 2026).
Eberenz, S. et al. (2024) ‘Nine recommendations for engaging with the public and stakeholders for Carbon Capture, Transportation, Utilization, and Storage’, Energy Research & Social Science, 118, p. 103804. Available at: https://doi.org/10.1016/J.ERSS.2024.103804.
Energy Policy Group (2021) Assessment of current state, past experiences and potential for CCS deployment in the CEE region – EPG. Available at: https://www.epg-thinktank.org/assessment-of-current-state-past-experiences-and-potential-for-ccs-deployment-in-the-cee-region/ (Accessed: 21 October 2025).
Energy Policy Group (2022a) Contrasting Public Acceptance of Carbon Capture and Storage in Norway and Germany – EPG. Available at: https://www.epg-thinktank.org/contrasting-public-acceptance-of-carbon-capture-and-storage-in-norway-and-germany/ (Accessed: 21 October 2025).
Energy Policy Group (2022b) Stories of carbon capture, utilization and storage-dubbed in Romanian. Available at: https://www.epg-thinktank.org/wp-content/uploads/2022/07/EPG_oped_ConsenCUS.pdf (Accessed: 21 October 2025).
European Commission (2024) Communication from the Commission to the European Parliament, the Council, the European Economic and Social Committee and the Committee of the Regions Towards an ambitious Industrial Carbon Management for the EU.
European Environment Agency (2023) The case for public participation in sustainability transitions. Copenhagen. Available at: https://doi.org/10.2800/805480.
Global CCS Institute (2025) ‘Global Status of CCS 2025 – Staying the Course’. Available at: https://www.globalccsinstitute.com/wp-content/uploads/2025/10/Global-Status-of-CCS-2025-report-9-October.pdf (Accessed: 27 October 2025).
Gough, C., Cunningham, R. and Mander, S. (2017a) ‘Societal Responses to CO2 Storage in the UK: Media, Stakeholder and Public Perspectives’, Energy Procedia, 114, pp. 7310–7316. Available at: https://doi.org/10.1016/J.EGYPRO.2017.03.1861.
Gough, C., Cunningham, R. and Mander, S. (2017b) ‘Societal Responses to CO2 Storage in the UK: Media, Stakeholder and Public Perspectives’, Energy Procedia, 114, pp. 7310–7316. Available at: https://doi.org/10.1016/J.EGYPRO.2017.03.1861.
Gough, C., Cunningham, R. and Mander, S. (2018) ‘Understanding key elements in establishing a social license for CCS: An empirical approach’, International Journal of Greenhouse Gas Control, 68, pp. 16–25. Available at: https://doi.org/10.1016/J.IJGGC.2017.11.003.
Gough, C. and Mander, S. (2022) ‘CCS industrial clusters: Building a social license to operate’, International Journal of Greenhouse Gas Control, 119, p. 103713. Available at: https://doi.org/10.1016/J.IJGGC.2022.103713.
Greenberg, S.E. (2015) ‘A Long-term Approach to Public Participation at the Illinois Basin-Decatur Project’. Available at: http://conference.co2geonet.com/ (Accessed: 27 October 2025).
Greenberg, S.E. (2020) ‘Success Stories: Tomakomai and the Illinois Basin-Decatur Project’.
Große-Kreul, F. et al. (2024) ‘Understanding public acceptance amidst controversy and ignorance: The case of industrial Carbon Capture and Storage in Germany’, Energy Research & Social Science, 118, p. 103838. Available at: https://doi.org/10.1016/j.erss.2024.103838.
HyNet North West (2020) HyNet CCUS Pre-FEED: Key Knowledge Deliverable – WP1 Final report. Available at: https://assets.publishing.service.gov.uk/media/629534ca8fa8f503978288d4/HyNet_CCUS_Pre-FEED_KKD_WP1_-_Final_Report-with-sig.pdf (Accessed: 21 October 2025).
IEAGHG (no date) ‘A Brief History of CCS and Current Status’. Available at: https://publications.ieaghg.org/docs/General_Docs/Publications/Information_Sheets_for_CCS_2.pdf (Accessed: 20 January 2026).
International Energy Agency (2022) Legal and Regulatory Frameworks for CCUS – An IEA CCUS Handbook. Available at: https://iea.blob.core.windows.net/assets/bda8c2b2-2b9c-4010-ab56-b941dc8d0635/LegalandRegulatoryFrameworksforCCUS-AnIEACCUSHandbook.pdf (Accessed: 27 October 2025).
Kawabata, T. (2023) ‘Tomakomai CCS Demonstration Project ~ focus on public acceptance ~’. Available at: https://www.energy.gov/sites/default/files/2023-08/9.%20Workshop%20Takashi%20Kawabata%20JCCS.pdf (Accessed: 27 October 2025).
Kim, J. and Ladenburg, J. (2024) ‘Public demand for carbon capture and storage varies with information, development magnitude and prior familiarity’, Communications Earth & Environment 2024 5:1, 5(1), pp. 739-. Available at: https://doi.org/10.1038/s43247-024-01900-y.
Krause, R.M. et al. (2014) ‘“Not in (or Under) My Backyard”: Geographic Proximity and Public Acceptance of Carbon Capture and Storage Facilities’, Risk Analysis, 34(3), pp. 529–540. Available at: https://doi.org/10.1111/RISA.12119.
Kuijper, M. (2011) ‘Public acceptance challenges for onshore CO2 storage in Barendrecht’, Energy Procedia, 4, pp. 6226–6233. Available at: https://doi.org/10.1016/J.EGYPRO.2011.02.635.
Lambert, C.E. et al. (2025) ‘The uncanny underground: Psychological and cultural associations of subterranean technologies for climate mitigation’, Energy Research & Social Science, 128, p. 104341. Available at: https://doi.org/10.1016/J.ERSS.2025.104341.
Linzenich, A., Arning, K. and Ziefle, M. (2021) ‘Acceptance of energy technologies in context: Comparing laypeople’s risk perceptions across eight infrastructure technologies in Germany’, Energy Policy, 152(12), p. 112071. Available at: https://doi.org/10.1016/j.enpol.2020.112071.
Lockwood, T. (2017) Public outreach approaches for carbon capture and storage projects. Available at: https://usea.org/sites/default/files/ccc276.pdf (Accessed: 22 October 2025).
L’Orange Seigo, S., Dohle, S. and Siegrist, M. (2014) ‘Public perception of carbon capture and storage (CCS): A review’, Renewable and Sustainable Energy Reviews, 38, pp. 848–863. Available at: https://doi.org/10.1016/J.RSER.2014.07.017.
Mabon, L. et al. (2015) ‘Local perceptions of the QICS experimental offshore CO2 release: Results from social science research’, International Journal of Greenhouse Gas Control, 38, pp. 18–25. Available at: https://doi.org/10.1016/J.IJGGC.2014.10.022.
Mabon, L., Kita, J. and Xue, D.Z. (2017) ‘Public and stakeholder understandings of offshore CO2 storage and implications for monitoring: The case of the Tomakomai CCS Demonstration Project PRIDE IN FISHERIES’. Available at: https://doi.org/10.1016/j.marpol.2017.06.015.
Mabon, L. and Littlecott, C. (2016) ‘Stakeholder and public perceptions of CO2-EOR in the context of CCS – Results from UK focus groups and implications for policy’, International Journal of Greenhouse Gas Control, 49, pp. 128–137. Available at: https://doi.org/10.1016/J.IJGGC.2016.02.031.
Macgillivray, A. and Livesey, H. (2021) Evaluation of a public dialogue on Carbon Capture Utilisation and Storage (CCUS) Report to BEIS and Sciencewise. Available at: https://assets.publishing.service.gov.uk/media/61b87d8fe90e0704439f43e7/evaluation-of-a-public-dialogue_on-ccus.pdf (Accessed: 21 October 2025).
McLaughlin, H. et al. (2023) ‘Carbon capture utilization and storage in review: Sociotechnical implications for a carbon reliant world’, Renewable and Sustainable Energy Reviews, 177, p. 113215. Available at: https://doi.org/10.1016/j.rser.2023.113215.
Merk, C. (2022) ‘Carbon Dioxide Storage: A Long-standing Favorite in Norway’, Kiel Focus [Preprint]. Available at: https://www.kielinstitut.de/publications/kiel-focus/carbon-dioxide-storage-a-long-standing-favorite-in-norway/ (Accessed: 21 October 2025).
Miu, L. et al. (2023) CCUS Forum WG on public perception of CCUS Working Group Paper. Available at: https://circabc.europa.eu/ui/group/75b4ad48-262d-455d-997a-7d5b1f4cf69c/library/ad3aab68-e28b-4fb6-82ff-524f88b0b8b5/details (Accessed: 22 October 2025).
Nielsen, J.A.E., Stavrianakis, K. and Morrison, Z. (2022) ‘Community acceptance and social impacts of carbon capture, utilization and storage projects: A systematic meta-narrative literature review’, PLOS ONE, 17(8), p. e0272409. Available at: https://doi.org/10.1371/journal.pone.0272409.
NORSAR et al. (2024) Comprehensive sets of recommendations that advance industry partners’ communication and public engagement around CCS technology benefits, acceptance, and trust in energy technology applications. Available at: https://ensure.norsar.no/wp-content/uploads/sites/2/2024/11/ensure-report-d3-3.pdf (Accessed: 21 October 2025).
Oltra, C. et al. (2012) ‘Public responses to CO2 storage sites: Lessons from five European cases’, Energy and Environment, 23(2), pp. 227–248. Available at: https://doi.org/10.1260/0958-305X.23.2-3.227;REQUESTEDJOURNAL:JOURNAL:EAEA;WEBSITE:WEBSITE:SAGE;WGROUP:STRING:PUBLICATION.
Optimat (2025) Assessment of the CCUS Supply Chain in Scotland.
Parliamentary Office of Science and Technology (2017) Greenhouse Gas Removal. Available at: https://researchbriefings.files.parliament.uk/documents/POST-PN-0549/POST-PN-0549.pdf (Accessed: 21 October 2025).
Peterhead CCS Project (2015) Stakeholder and Public Engagement and Communications Plan. Available at: https://assets.publishing.service.gov.uk/media/5a7f793ce5274a2e87db6118/11.063_-_Stakeholder_and_Public_Engagement_and_Communications_Plan.pdf (Accessed: 21 October 2025).
Reinhold Poulsen, S. (2021) ‘Greensand CO 2 transport & storage project’.
von Rothkirch, J. and Ejderyan, O. (2021) ‘Anticipating the social fit of CCS projects by looking at place factors’, International Journal of Greenhouse Gas Control, 110, p. 103399. Available at: https://doi.org/10.1016/J.IJGGC.2021.103399.
Sawada, Y. and Tanaka, J. (2020) ‘Tomakomai CCS Demonstration Project-Results and Lessons Learned’.
Scottish Carbon Capture and Storage (2019) The role of CCS in a just transition. Available at: www.sccs.org.uk (Accessed: 22 January 2026).
Scottish CCS (2010) Towards a Public Communication and Engagement Strategy for Carbon Dioxide Capture and Storage Projects in Scotland. Available at: https://www.sccs.org.uk/sites/default/files/2023-05/wp-2010-08.pdf (Accessed: 22 October 2025).
Scottish Government (2019) Attitudes in Scotland on the Marine Environment and Marine Issues.
Scottish Government (2021) Net Zero Nation: Public Engagement Strategy for Climate Change Contents.
Scottish Government (2024) Green industrial strategy, https://www.gov.scot/publications/ecosystem-restoration-code-engagement-paper/. Available at: https://www.gov.scot/publications/green-industrial-strategy/ (Accessed: 20 January 2026).
Scottish Government (2025a) Scotland’s Climate Change Plan – 2026-2040. Available at: https://www.gov.scot/publications/scotlands-climate-change-plan-2026-2040/ (Accessed: 26 November 2025).
Scottish Government (2025b) Sectoral Contributions – Scotland’s Climate Change Plan – 2026-2040. Available at: https://www.gov.scot/publications/scotlands-climate-change-plan-2026-2040/pages/10/ (Accessed: 20 January 2026).
Shackley, S. and Hammond, J. (2010) ‘Towards a Public Communication and Engagement Strategy for Carbon Dioxide Capture and Storage Projects in Scotland: A Review of Research Findings, CCS Project Experiences, Tools, Resources and Best Practices’. Available at: https://www.research.ed.ac.uk/en/publications/towards-a-public-communication-and-engagement-strategy-for-carbon/ (Accessed: 12 December 2025).
Shackley, S., Mabon, L. and Evar, B. (2013) Response to the UK Parliament Energy and Climate Change Committee, Enquiry on Carbon Capture and Storage (CCS). Available at: https://doi.org/https://committees.parliament.uk/writtenevidence/44923/html/.
Shah, P. et al. (2022) ‘Framing climate change mitigation technology: The impact of risk versus benefit messaging on support for carbon capture and storage’, International Journal of Greenhouse Gas Control, 119, p. 103737. Available at: https://doi.org/10.1016/j.ijggc.2022.103737.
Sovacool, B. et al. (2025) IDRIC Industrial Decarbonisation Frontiers Report: Public Perceptions and Just Transitions.
Stavrianakis, K., Nielsen, J. and Morrison, Z. (2023) ‘Public perception and acceptance of CCUS: preliminary findings of a qualitative case study in Greece’, Open Research Europe, 3, p. 205. Available at: https://journals.plos.org/plosone/article?id=10.1371/journal.pone.0272409 (Accessed: 12 December 2025).
Süsser, D. et al. (2024) Impact assessment of case studies: Assessing the impacts of public engagement in energy infrastructure projects.
Tardin-Coelho, R., Bharadwaj, B. and Ashworth, P. (2025) ‘Carbon capture utilisation and storage (CCUS) and public perceptions: A systematic literature review’, International Journal of Greenhouse Gas Control, 145, p. 104393. Available at: https://doi.org/10.1016/J.IJGGC.2025.104393.
Tcvetkov, P., Cherepovitsyn, A. and Fedoseev, S. (2019) ‘Public perception of carbon capture and storage: A state-of-the-art overview’, Heliyon, 5(12), p. e02845. Available at: https://doi.org/10.1016/J.HELIYON.2019.E02845.
Terwel, B.W. et al. (2009) ‘Trust as predictor of public acceptance of CCS’, Energy Procedia, 1(1), pp. 4613–4616. Available at: https://doi.org/10.1016/J.EGYPRO.2009.02.282.
Terwel, B.W., ter Mors, E. and Daamen, D.D.L. (2012) ‘It’s not only about safety: Beliefs and attitudes of 811 local residents regarding a CCS project in Barendrecht’, International Journal of Greenhouse Gas Control, 9, pp. 41–51. Available at: https://doi.org/10.1016/J.IJGGC.2012.02.017.
The Acorn Project (2026) Acorn CO2 Transport and Storage. Available at: https://theacornproject.uk/projects (Accessed: 16 January 2026).
The Copenhagen Post (2009) ‘CO2 storage protests’, Jyllands Posten. Available at: https://jyllands-posten.dk/ece4187838 (Accessed: 22 January 2026).
Thorsteinsson, H. and Gunnarsson, G. (2014) Induced seismicity-stakeholder engagement in Iceland. Available at: https://www.researchgate.net/publication/289289177_Induced_seismicity-stakeholder_engagement_in_Iceland (Accessed: 12 December 2025).
Traverse (2021) Carbon Capture Usage and Storage Public Dialogue. Available at: https://assets.publishing.service.gov.uk/media/60faa0c9e90e0703aee75850/ccus-public-perceptions-traverse-report.pdf (Accessed: 21 October 2025).
UK Government (2025) RTA: Carbon management. Available at: https://www.gov.uk/government/publications/rapid-technology-assessment-carbon-management/rta-carbon-management (Accessed: 21 October 2025).
University of Glasgow (2024) CC ( U ) S FUTURES 1.
Upham, P. and Roberts, T. (2011) ‘Public perceptions of CCS in context: Results of NearCO2 focus groups in the UK, Belgium, the Netherlands, Germany, Spain and Poland’, Energy Procedia, 4, pp. 6338–6344. Available at: https://doi.org/10.1016/J.EGYPRO.2011.02.650.
US Environmental Protection Agency (2010) Federal Requirements Under the Underground Injection Control (UIC) Program for Carbon Dioxide (CO2) Geologic Sequestration (GS) Wells. Available at: https://www.govinfo.gov/content/pkg/FR-2010-12-10/pdf/2010-29954.pdf (Accessed: 27 October 2025).
Vögele, S. et al. (2018) ‘Germany’s “No” to carbon capture and storage: Just a question of lacking acceptance?’, Applied Energy, 214, pp. 205–218. Available at: https://doi.org/10.1016/J.APENERGY.2018.01.077.
Waring, T. and Longo, A. (2025) ‘Implementing Carbon Capture and Storage in the United Kingdom: Estimating Willingness to Pay through a Contingent Valuation Survey’, Environmental Management 2025 75:6, 75(6), pp. 1432–1443. Available at: https://doi.org/10.1007/S00267-025-02174-6.
White Rose (2016) K45: Full chain public and stakeholder engagement Commercial; Project Management.
Whitmarsh, L., Xenias, D. and Jones, C.R. (2019) ‘Framing effects on public support for carbon capture and storage’, Palgrave Communications 2019 5:1, 5(1), pp. 17-. Available at: https://doi.org/10.1057/s41599-019-0217-x.
Witte, K. (2021) ‘Social Acceptance of Carbon Capture and Storage (CCS) from Industrial Applications’, Sustainability 2021, Vol. 13, 13(21). Available at: https://doi.org/10.3390/SU132112278.
Yasemi, S. et al. (2023) ‘Carbon Capture and Storage: Application in the Oil and Gas Industry’, Sustainability 2023, Vol. 15, 15(19). Available at: https://doi.org/10.3390/SU151914486.
Zero Emissions Platform (2024) Public perception: Key enablers and hurdles for CCS and CCU projects. Available at: https://zeroemissionsplatform.eu/wp-content/uploads/2024/07/ZEP-Public-Perception-Report_2024.pdf (Accessed: 21 October 2025).
Zuch, M. and Ladenburg, J. (2023) ‘Navigating the information pathway to carbon capture and storage acceptance: Patterns and insights from a literature review’, Energy Research & Social Science, 105, p. 103283. Available at: https://doi.org/10.1016/J.ERSS.2023.103283.
Zuch, M.P. (2025) ‘Public Acceptance and Perception of Carbon Capture and Storage Technologies: Measuring Consumer Preferences and Willingness to Pay for CCS in Denmark’.
Appendices
Appendix A: Additional detail on research methods
Our literature review encompassed academic literature as well as “grey literature” such as reports from think tanks and non-governmental organisations, non-academic research institutes, governments, and industry. We used relevant keyword combinations on Google Scholar, Scopus, and Web of Science (for academic articles) and via Google searches and relevant organisation websites (for grey literature). We screened article summaries for relevance, and logged articles into a common Excel spreadsheet, summarising whether and how each article answered the above research questions.
Keywords used in academic and grey literature searches
(“carbon capture and storage” OR “carbon capture and sequestration” OR “CO2 storage” OR “CCS” OR “CCUS”) AND (“social license to operate” OR “social license” OR “social licence” OR “public perception” OR “public acceptance” OR “community acceptance” OR “social legitimacy” OR “public response” OR stakeholder engagement” OR “public engagement”) AND (“CO2 imports” OR “carbon dioxide imports” OR “cross-border CO2 transport” OR “transboundary CO2 transport”)
Grey literature sources reviewed
- Policy documents (e.g., strategies, action plans) & government/Parliament reports (EU, UK, Denmark, Norway, Netherlands), with a focus on North Sea countries
- Reports/policy papers from think tanks and NGOs with concerted research activity on CCS (e.g., Clean Air Task Force, Bellona Europa, Energy Policy Group)
- Reports/policy papers from CCS associations and networks: Scottish CCS, CCS Association, Global CCS Institute, Zero Emissions Platform, European Commission SET-Plan IWG9
- Project-specific literature (e.g., site closure reports for unsuccessful projects, progress reports, research investigations by competent authorities), covering European countries e.g. Barendrecht (Netherlands), Belchatow (Poland), Northern Lights (Norway), Porthos (Netherlands), Greensand (Denmark), and specific examples of public engagement from non-EU projects: Tomakomai (Japan), Decatur (USA), Quest (Canada).
Appendix B: Guiding questions for stakeholder interviews
Public perceptions and concerns around CCS
- In your work so far, what have you found to be the main public concerns around CCS?
- Conversely, what have you found to be the precursors to a Social License to Operate (SLO) for CCS projects (i.e., continued acceptance of CCS technologies and projects)?
- Do public concerns and SLO precursors change depending on whether the CO2 is imported from a different jurisdiction or is from the UK?
- Have you observed any role for compensation/project benefits redistribution to local communities in obtaining and maintaining a CCS SLO?
- Are there differences between acceptance of CCS across multiple levels and across the CCS value chain?
Interviewer’s note: multiple levels could mean, for example, at “socio-political level” (general acceptance of CCS as a solution) and “local level” (acceptance of a specific CCS project); across the value chain could mean, for example, acceptance of capture technologies, transport infrastructure, storage sites.
- What do you think must be done to maintain acceptance across levels and the value chain, and whose responsibility is it?
- What do you think is the role of industrial clusters in influencing public opinion on CCS?
Public engagement with CCS
- Public engagement with CCS will likely be a key component of project pipelines, as well as securing a strategic place for CCS in national transition pathways. What opportunities and challenges do you see for public engagement programmes at project level and conversely at broad, topical level (e.g., general communication of climate change mitigation)?
- Similarly, what risks does engaging the public with CCS bring, and how can these be mitigated?How might risks and their mitigation measures differ between project-specific and broad, topical levels?
- In your work so far, what have you found to be the effect of communication source (i.e., the messenger), timing, and format of public engagement on public perception and response to CCS? (please also feel free to draw on lessons from public engagement with other large-scale infrastructure or subsurface projects in the UK or Scotland, if relevant)
- Similarly, what influence have you found technology and design choices to exert on public perception and response to CCS?
- Interviewer’s note: for example, the choice of capture technology or industrial application, the choice of transport method, the project financial design (proportion of public funding), liability and insurance, monitoring and verification of storage sites.
- Similarly, what influence have you found historical, industrial, and socio-economic contexts exert on public perception and response?
- Interviewer’s note: for example, local community experience with subsurface projects, importance of industry in local economy, and level of poverty or unemployment, respectively.
- Do you have any examples of where the above contexts have impacted perception of CCS?
Lessons from other jurisdictions
- We are looking for key lessons from other jurisdictions that could provide lessons for Scotland’s future public engagement with CCS. What lessons do you think can be learned from public engagement in other jurisdictions’ CCS projects? (please feel free to refer to specific projects or larger engagement efforts at regional, national, or international scale)
- Based on your knowledge of the Scottish and UK context, what do you think are aspects of particular interest or concern regarding public perception and engagement around CCS?
- Are there any additional lessons you think are relevant from public perception and engagement around other large-scale infrastructure or subsurface projects in Scotland and the UK (e.g., natural gas pipelines, mining)
Appendix C: Additional detail on key lessons for public engagement across the project life-cycle
Appraisal and planning (before Final Investment Decision) |
|
Development and construction (including mandatory public consultation) |
|
Operation (including potential connection of new capture sites to backbone infrastructure) |
|
How to cite this publication:
Miu, L., Wells, R., Hill, D., Grebot, B., Bedford, T. and Whitmarsh, L. (2026) ‘Public perceptions of Carbon Capture and Storage’, ClimateXChange. 10.7488/era/7241
© The University of Edinburgh, 2026
Prepared by Logika Group and University of Bath on behalf of ClimateXChange, The University of Edinburgh. All rights reserved.
While every effort is made to ensure the information in this report is accurate as at the date of the report, no legal responsibility is accepted for any errors, omissions or misleading statements. The views expressed represent those of the author(s), and do not necessarily represent those of the host institutions or funders.
This work was supported by the Rural and Environment Science and Analytical Services Division of the Scottish Government (CoE – CXC).
ClimateXChange
Edinburgh Climate Change Institute
High School Yards
Edinburgh EH1 1LZ
+44 (0) 131 651 4783
If you require the report in an alternative format such as a Word document, please contact info@climatexchange.org.uk or 0131 651 4783.
Achieving Scotland’s target of net zero greenhouse gas emissions by 2045 will require significant emissions reductions across all sectors of the economy. Road transport and building heating remain among the most challenging sectors to decarbonise, despite progress elsewhere. Carbon pricing is a mechanism that can incentivise emissions reductions by increasing the cost of carbon-intensive fuels and encouraging the uptake of lower-carbon alternatives.
This research explores the potential role that carbon pricing instruments could play in reducing emissions from Scotland’s transport and building heating sectors. It reviews evidence on the effectiveness of carbon pricing and models the potential impacts of different carbon pricing scenarios in Scotland. The analysis is intended to provide early-stage evidence to inform future discussion and does not contain or assess policy proposals.
Key findings
- The literature indicates that carbon pricing can contribute to emissions reductions in transport and building heating, but the impact tends to be uncertain and relatively modest.
- Carbon pricing could reduce emissions by an additional 2.9–11 MtCO₂ between 2027 and 2045, with higher carbon tax producing the largest emissions reductions.
- Most emissions savings arise from reduced fuel use, particularly in buildings, rather than large-scale switching to electric vehicles or heat pumps.
- Carbon pricing could result in additional direct costs to Scottish consumers of between £1 billion and £8 billion between 2027 and 2045, primarily through higher fossil fuel prices.
- The average additional cost to households is relatively modest, estimated at £29–£172 per year.
- Lower-income households are more affected, with costs representing up to 1.4% of median income for the lowest-income groups.
- The disproportionate impact on low-income consumers can be alleviated through revenue recycling, which should be further investigated as a next step.
For further information, please read the full report.
If you require the report in an alternative format, such as a Word document, please contact info@climatexchange.org.uk or 0131 651 4783.
Research completed February 2026
DOI: https://doi.org/10.7488/era/7240
Executive summary
Research aims and scope
To achieve net-zero by 2045, Scotland will require deep emissions reductions. Carbon pricing is a mechanism for imposing a cost on greenhouse gas emissions to incentivise emitters to cut pollution. This research assesses whether and how carbon pricing instruments could contribute to decarbonising the road transport and building heating sectors, which lag behind other parts of the Scottish economy in emissions reductions. This study provides early-stage analytical evidence on the potential role of carbon pricing in these sectors, as part of a wider decarbonisation strategy. It does not contain or examine policy proposals.
The study has two objectives. First, it reviews evidence on the performance of carbon pricing instruments applied to transport and buildings. Second, it models and assesses the impact of introducing carbon pricing instruments on these sectors in Scotland. The analysis is limited to carbon taxes (flat-rate charges on the carbon content of fuels) and cap-and-trade systems, also known as emissions trading systems (ETS), where suppliers buy allowances covering emissions from the fuels they sell, at a market price.
We model four scenarios: two carbon tax levels (£25/tCO₂ and £75/tCO₂) and two cap-and-trade system scenarios (with and without a soft price cap). In each scenario, a carbon price is applied to transport and building heating fuels. This cost is then either fully (100%) or partially (50%) passed on by fuel suppliers to household and business consumers. Our approach uses a simple investment model in which consumers are assumed to either reduce their fuel consumption or invest in low-carbon heating (heat pumps) and transport alternatives (electric vehicles (EVs)).
We model the potential emissions reduction effects of these carbon price scenarios relative to a baseline scenario which aligns with the Climate Change Committee 7th Carbon Budget. This baseline already reflects a relatively ambitious emissions reduction pathway, which has important implications for the assessment. Against this baseline, we present the modelled effects of carbon pricing on emissions reductions, the anticipated direct costs to consumers, and the potential revenues to government.
We do not assess any potential options for using the revenues from carbon pricing to further support decarbonisation. We also do not assess the corresponding secondary effects of revenue recycling on emissions abatement, technology uptake or mitigation of adverse effects on specific consumer groups. This also has implications for our assessment, as investment in low-carbon alternatives could be higher if carbon pricing revenues were recycled through targeted subsidies, such as for purchasing EVs or heat pumps.
Findings
Evidence on the performance and impact of carbon pricing
The literature indicates that carbon pricing can contribute to emissions reductions in transport and building heating, but the impact tends to be uncertain and relatively modest. This impact is significantly affected by differences in national context, including the affordability of low-carbon alternatives and complementary policies. As such, there is no strong consensus in the literature on the magnitude of the effect of carbon pricing.
In higher-income countries, carbon pricing is typically regressive, i.e., it imposes proportionately higher costs on low-income households. Recycling carbon pricing revenues can alleviate this burden, which can further improve the social feasibility of carbon pricing.
Modelled emissions abatement under carbon pricing in Scotland
The model projects a cumulative emissions abatement of 2.9-11 million tonnes (Mt) between 2027 and 2045, on top of that already expected to be in the baseline scenario. The highest anticipated emissions reduction is in the higher £75 carbon tax scenario where costs are fully passed on to customers. In this scenario, annual emissions are 3.6% lower in 2030 than the baseline, and 13% lower in 2045. The lowest emissions abatements were in the lower £25 carbon tax scenario, where costs are partially passed on. Our modelled ETS prices generate less emissions abatement than steadier price signals under a carbon tax. The model shows that most additional emissions reductions occur in the buildings sector.
Our modelled emissions reductions due to carbon pricing are relatively modest. This is partly due to simplifying assumptions in the model, but also to the already ambitious baseline, which leaves limited scope for further gains from carbon pricing alone. The modelling suggests that consumers would primarily respond to the carbon price by reducing their fuel consumption rather than switching to low-carbon alternatives. Persistent barriers to investment, especially in lower-income groups, and without modelled revenue recycling, drive consumers to reduce demand rather than invest in alternatives.
Modelled consumer costs and distributional impact
Under our modelled carbon price, consumers either invest in low-carbon technologies, or they pay the carbon cost of the fossil fuels they continue to use. In our model, over the entire period 2027-2045, Scottish consumers are assumed to incur a direct additional cost of between £1 billion and £8 billion. Crucially, these costs are mainly the additional direct fuel costs incurred by consumers under a carbon price. As such they are not directly comparable to abatement costs cited in the literature, which generally include only the cost of deploying low-carbon alternatives.
Despite the substantial costs from the modelled carbon pricing instruments cited above, they are relatively modest at a household level, between £29 – £172 per year. However, they are more significant for lower-income households, representing up to 1.4% of the median income of the lowest-income households. The disproportionate impact on low-income consumers can be alleviated through revenue recycling, which as noted above we do not assess.
Lessons learned
Our research finds that if added to an ambitious baseline policy mix, carbon pricing instruments could generate small additional emissions reductions in Scotland’s transport and buildings sectors. Given that our modelled baseline is ambitious, the abatement effects we find are small. However, carbon pricing schemes could deliver a signal for consumer behaviour change if baseline emissions reductions fail to materialise. At the same time, complementary policies can ensure that consumers can overcome investment barriers, and alleviate the burden of carbon costs for those who cannot yet invest.
This research is early-stage and relies on simplifying assumptions for modelling the impact of carbon prices. Additional research is needed to further assess carbon pricing against less ambitious baseline policy mixes, and including a wider range of low-carbon technologies such as heat networks and low-carbon liquid fuels. Crucially, modelling the effect of revenue recycling can help identify how the use of carbon pricing revenues can increase the effectiveness of emissions abatement and reduce the impact on those most vulnerable.
Abbreviations table
7CB | 7th Carbon Budget |
BC | British Columbia |
CAD | Canadian dollar |
CAPEX | Capital expenditure |
CCC | Climate Change Committee |
CCP | Climate Change Plan |
CO2 | Carbon dioxide |
CO2e | Carbon dioxide equivalent |
DCT | Direct Carbon Tax |
DESNZ | Department for Energy Security and Net Zero |
EU | European Union |
ETS | Emissions Trading System |
EVs | Electric vehicles |
GHG | Greenhouse gas |
GDP | Gross Domestic Product |
GW | Gigawatt |
GWh | Gigawatt-hour |
HGV | Heavy goods vehicle |
ICEs | Internal combustion engine vehicles |
kW | Kilowatt |
LGV | Light goods vehicle |
LNG | Liquefied Natural Gas |
MSR | Market Stability Reserve |
Mt | Million tonnes |
MWh | Megawatt-hour |
NOK | Norwegian Krone |
NOx | Nitrous oxides |
NPV | Net Present Value |
PM 2.5 | Particulate matter |
SG | Steering Group |
tCO2 | Tonne of CO2 |
TNAC | Total number of allowances in circulation |
UK | United Kingdom |
Introduction and background
Context and rationale of research
In 2025, there were 113 carbon pricing instruments implemented in 55 countries and 44 subnational jurisdictions around the world (World Bank, 2025). Although varying in design and levels of impact (see Section 3.3), they are all underpinned by the “polluter pays” principle, ensuring that the social cost of greenhouse gas (GHG) emissions is borne by the polluter (UK Government, 2022). The rationale behind carbon pricing is that pricing carbon emissions will drive emissions reductions by polluters, if the carbon price is higher than the cost of abatement (World Bank Group, 2025).
Carbon pricing instruments are of particular interest where the pace of decarbonisation is slower than the average. They have recently come into focus for decarbonising the transport and building sectors, with the launch of an EU-wide Emission Trading System (the EU ETS2) which prices carbon emissions from these sectors (European Commission, no date). The UK ETS covers the electricity, industry and domestic aviation sectors, while transport and building heating emissions are primarily covered through non-price policies, such as standards (Sturge et al., 2024a). As with the wider UK, in Scotland, transport and buildings emissions reductions lag behind other sectors (Climate Change Committee, 2025a; Scottish Government, 2025a). This indicates a potential role for carbon pricing as a complementary decarbonisation instrument.
By their nature, carbon pricing instruments are “stick” rather than “carrot” policies. They create a price pressure which incentivises decarbonisation, but do not implicitly include supporting mechanisms for polluters to switch to less emissions-intensive activities. As such, carbon pricing instruments require complementary policies to achieve their decarbonisation potential while minimising the financial burden on consumers and economies. They also function best as part of wider policy portfolios because of their ability to mitigate shortfalls in the pace and/or rate of decarbonisation incentivised by other policies (Raiser and Rault, 2025a). They can also be politically controversial. For example, the European Union (EU) and its Member States have had long-standing debate on the design of the EU ETS2, the (EU’s) carbon pricing scheme for transport and building emissions. Since its original design, the scheme has been significantly relaxed, primarily due to concerns over potential consumer impacts (European Commission, 2025). The impact on low-income consumers of carbon pricing can be mitigated through revenue recycling mechanisms, to avoid exacerbating existing inequalities such as the disproportionate incidence of fuel poverty amongst low-income groups.
The aim of this research is to examine evidence and provide further analysis on the potential for carbon pricing to accelerate emission reductions in the transport and buildings sectors in Scotland. The scope is limited to two types of carbon pricing instruments: cap-and trade systems (also known as ‘emissions trading systems’ – ETS) and carbon taxes. ETS are policy measures establishing a market where GHG emitters from target sectors must purchase allowances (permits) to cover their emissions, from a pre-set jurisdictional cap on emissions. The pre-set cap decreases year on year. Carbon taxes are pre-determined rates applied to the carbon content of fuels, energy vectors, or products.
A third type of carbon pricing instrument is carbon credit markets (World Bank Group, 2025). These are largely voluntary, are not typically applied for sectoral emissions, and their effectiveness is debated (Romm, Lezak and Alshamsi, 2025). They are not within the scope of this report.
The research questions of this study are:
- What options already exist for pricing carbon, and what evidence is there around their cost-effectiveness, distributional impact, and shortfalls?
- What are the environmental, economic, social, and distributional implications of cap-and-trade and carbon tax instruments on Scottish transport and buildings, and their associated limitations and feasibility?
- Based on (1) and (2), what options are the most promising as cost-effective measures to decarbonise the Scottish transport and buildings sectors while protecting those most vulnerable?
First, we review evidence on carbon pricing schemes in the transport and building heating sectors in selected countries (Sections 3.2 – 3.4). Second, we model and analyse effects of four carbon pricing scenarios on Scotland’s transport and building heating sectors (Section 4.1 – 4.5). Conclusions and lessons learned are then formulated (Section 5).
It is important to note that the study in no way implies a policy proposal to introduce new carbon pricing measures in Scotland. Rather, it is early-stage research which provides preliminary evidence by modelling carbon pricing schemes, alongside a review of secondary literature. Additional methodological information and data is presented in the report appendices.
Carbon pricing schemes on transport and building sectors
The two types of carbon pricing schemes reviewed in this study, cap-and-trade and carbon tax systems, have been applied around the world, including on the transport and building sectors. Below we briefly describe 7 such schemes, selected based on comparability to Scotland, availability of information on their performance, and direction from the project Steering Group (SG).
The EU ETS2 is new carbon pricing scheme, covering fuels combusted in road transport and buildings. It will function on the same principles of the EU ETS, but is completely separate from it. Allowances will be made available to fuel suppliers, who must purchase and surrender allowances equivalent to the CO2 emissions from the combustion of the fuels they sell. The system will have a ‘soft price cap’. That is, when the price of allowances exceeds €45 (approx. £39) in 2020 terms over a certain period, market stabilisation mechanisms will be triggered to release allowances from a reserve, which will drive down the price. Revenues from the ETS2 will be collected into a Social Climate Fund, to be used by Member States to alleviate the impact of carbon pricing on consumers. The scheme will start in 2028, after an agreement to postpone it (International Carbon Action Partnership, 2026).
British Columbia’s Direct Carbon Tax (DCT) was the world’s first subnational carbon tax, applied to all fuels, including transport and heating fuels. It started with broad sectoral coverage, accommodating sectoral exemptions over time, and rose from CAD 10/tCO2 (approx. £5/tCO2) in 2008 to CAD 95/tCO2 (approx. £51/tCO2) in 2025. Revenue was recycled through tax cuts and transfers to individuals and firms (Sloan et al., 2024). This tax paved the way for the federal (i.e., national) Canadian carbon tax (Fairbrother and Rhodes, 2023). However, in 2025 the Canadian and British Columbia carbon taxes were scrapped to focus on pricing carbon from large industrial emitters (Government of Canada, 2025).
Sweden’s DCT, in force since 1991, covers all fossil fuels, including road transport and building heating (Sloan et al., 2024). The tax rate has increased from €22/tCO2 (approx. £19/tCO2) in 1991 to €134/tCO2 (approx. £116/tCO2) in 2025. Around 90% of the tax revenues come from gasoline and motor diesel charges, totalling around €2 billion (approx. £1.74 billion) in 2023 (World Bank, 2023; Statistik Databasen, 2025). Revenues are not earmarked for specific purposes (Government Offices of Sweden, 2025).
Austria’s National ETS, launched in 2022, complements the EU ETS by pricing carbon emissions from sectors not covered by the latter, including transport and buildings. The allowance price was pre-set and as of 2025 stood at €55/tCO2 (approx. £48/tCO2), which is above the soft price cap of the EU ETS2 (see below). Revenue from emissions allowances goes directly into Austria’s main government budget, with ‘climate bonus’ payments returned to all Austrian households as a set price per person. This means poorer households, which typically emit less, gain more than richer households. The scheme has consistently been revenue negative, with government expenditure for rebates being greater than income from carbon pricing. From January 2028 it will be replaced with the EU ETS2 covering road transport and buildings (International Carbon Action Partnership, 2025a).
Norway’s National DCT, introduced in 1991, is levied on fossil energy products, including those used in road traffic and natural gas used for heating (Norwegian Ministry of the Environment, 2005). The tax level was NOK 944 (approx. £70/tCO2) in 2025, and is planned to more than double by 2030 (to approx. £148/tCO2), to support transport emission targets. Norwegian emissions from heating buildings are already relatively low, reflecting a pre-existing ban on the use of fossil oil as a heat source in 2020, and generally low use of natural gas. The carbon tax revenue is used to reduce other taxes (Norwegian Ministry of Climate and Environment, 2022).
Germany’s National ETS, launched in 2021, complements the EU ETS. It is being phased in with a fixed carbon price, rising to €55/tCO2 in 2025 (approx. £48/tCO2), and a flexible allowance supply determined in line with Germany’s emissions reduction targets. The scheme covers all main fossil fuels, including those used in heating and transport. As of 2024, total revenue generation was €12.97 billion (approx. £11.25 billion) (International Carbon Action Partnership, 2025b). Revenues are directed to the “Climate and Transformation Fund”, used to finance technologies and climate protection measures within Germany, as well as refinancing electricity price and carbon leakage compensation (Deutsche Emissionshandelsstelle, 2025).
Performance and impact of carbon pricing schemes
In this and the following sections we review wider literature around the performance, impact, shortfalls and limitations of carbon pricing schemes covering the transport and heating sectors, focusing on the ones listed above. This is not a systematic literature review, rather its purpose is to set the context of subsequent modelling and analysis for Scotland.
Emissions abatement
The literature indicates that carbon pricing can contribute, and has contributed, to emissions reductions in heating and transport, by stimulating investment in clean technologies. Details of the emissions reductions found in the reviewed literature are set out in Appendix D (Table 14). However, technology adoption likely reflects many factors, including other influences on fossil fuel use such as the effect of different policies, underlying fuel prices, and national economic and social characteristics. It is also influenced by the availability of alternative technologies, as well as the elasticity of demand for transport and heating fuels, i.e., how responsive fuel demand is to price changes. In general, demand for these fuels, particularly heating fuels, is less responsive to price changes. As such, the EU expects that the ETS2 will not generate major demand reductions, but that some technologies could be profitably switched to low-carbon alternatives (European Commission, 2021). Another study modelling the expected impact of the EU ETS2 found that emissions reductions would likely be higher in road transport than in heating, due to the relatively quicker turnover of car ownership compared to boilers (Fazekas et al., 2021).
The literature shows a mostly positive rate of emissions reduction in transport and buildings under carbon pricing schemes (see Appendix D, Table 14). The exact figures are not easily generalisable, due to the range of factors affecting technology adoption including the wider policy and national contexts for specific instruments, as well as methodological differences. Research uncertainty is also a factor, particularly for studies on newer or hypothetical carbon pricing systems, which rely on modelling. This is partly because carbon pricing on heating and transport is expected to generate behaviour change in individuals and the complexities of behavioural modelling introduce further research uncertainty.
Studies on certain jurisdictions with long-running carbon pricing find mixed performance (Appendix D, Table 14), due to differences in the design of schemes as well as the parameters used in different research. In BC, some studies cite short-run aggregate emission reductions of between 5-15% (Murray and Rivers, 2015), while others find a decline only in transport emissions or even increased transport emissions (Pretis, 2022; Winter, 2024; Arcila and Baker, 2022). Studies in other countries find similar decreases. For example, a 1.7% in transport emissions and 6.9% in building heating emissions in Germany between 2022 and 2023, 7.7% in per capita transport emissions in Sweden between 1990 and 2005 and 4% decrease in total Austrian CO2 emissions within the first five years of the national ETS (Emissions Trading Authority at the German Environment Agency, 2025; Yu, 2024; Streicher, Kettner and Schratzenstaller, 2025).
In the UK, modelling of a hypothetical ETS on transport and buildings finds that a £40-£80/tCO2 carbon price could drive economy-wide emissions reductions of 6.1-10.6% in transport and 10-14.7% in heating buildings (Sturge et al., 2024). This study finds that greater emissions reductions occur in the heating sector, partly due to existing excise duties on transport fuels. This is in contrast to a study on the EU by Fazekas et al. (2021), which finds higher emissions reductions in the transport sector compared to the heating sector under a modelled EU ETS2. Bretschger and Grieg (2024) find that a hypothetical carbon tax on transport fuels in the UK reduces emissions by 0.352 tCO2/capita/year relative to the baseline. There are fewer relevant studies that focus on the Scottish context. The most recent relevant study from 2014 did not look specifically on transport and heating buildings. However, it found that a carbon tax of £50/tCO2 would allow Scotland to achieve 37% aggregate emissions reductions by 2020 relative to 2000 emission levels (Allan et al., 2014). These projected emissions reductions are not additional to an existing ETS, as the goal of the 2014 study was to model what a carbon tax could achieve in case of Scottish independence or further devolution of fiscal powers. It should also be noted that the study was published before Scotland agreed its net-zero targets and before the implementation of the UK ETS.
In addition to abating CO2 emissions, some literature finds that carbon pricing can also reduce non-CO2 emissions, including nitrous oxides (NOx) and particulate matter (PM 2.5) (European Commission, 2021). Sileci (2023) models PM2.5 reductions of 5.2-10.9% (2008-2023) driven by reductions in transport fuel demand under BC’s carbon tax. The resulting positive health outcomes may partially or fully offset the costs of carbon pricing.
While the literature shows generally positive effects of carbon pricing on emissions abatement in heating and transport, there is no strong consensus on the ultimate magnitude of the effect. This is a finding in itself, and reinforces that the contribution of carbon pricing to emissions abatement is highly context-dependent.
Economic and distributional impact
Abating emissions through carbon pricing comes at a cost to consumers, as the price of fossil fuels absorbs the cost of associated emissions, and as such increases. The literature shows a range of economic and consumer impacts of carbon pricing schemes, detailed in Table 15 (Appendix D). In BC, studies find small consumer impacts of approx. €0.015-€0.048/l of gasoline, but with a negligible effect on economic growth (Fairbrother and Rhodes, 2023). However, the tax was initially revenue negative (GIZ and UNDP, 2019). If revenue positivity were a priority, the tax may have had a higher economic impact. Similarly, modelled analyses found no projected negative impact on income or economic growth from the UK’s fuel duty, as the increase in public services financed by fuel tax revenue counterbalances impact on households (Bretschger and Grieg, 2024; European Commission; BloombergNEF, 2025).
Such economic impacts are not evenly distributed. They can vary by geography as well as by consumer type (Winter et al., 2023; Pretis, 2022). For example, Swedish commercial buildings already use a higher share of clean heating than residential ones (Ministry of Finance, 2023), and so are less impacted by a carbon price. Importantly, carbon pricing schemes tend to have a regressive impact across income groups in higher-income countries, especially those targeting transport and building heating fuels (World Bank, 2020; Ohlendorf et al., 2021). This is because such carbon pricing schemes directly impact end consumers. Suppliers of transport and heating fuels have limited options to decarbonise their fuel supply themselves, and so are likely to fully pass through the carbon price to end consumers (European Commission, 2021). There will probably be a disproportionate impact on low-income groups because for these groups the incidence of fuel poverty is higher. These groups also spend more of their income on fuels, and a higher share of this is essential consumption, especially heating (Federal government of Germany, 2024; European Commission, 2021; Fazekas et al., 2021; Sturge et al., 2024b). Middle-income consumers may see a more pronounced impact from transport carbon pricing, as they are more likely than low-income groups to have a private vehicle (European Commission, 2021). Lower-income households also face investment barriers to low-carbon technologies, such as lack of capital, increased likelihood of living in rented accommodation, and other constraints (Fazekas et al., 2021).
Although less clear, the distributional impact of indirect health benefits from carbon pricing have also been noted in the literature. Reductions in air pollutants enabled by carbon pricing typically benefit lower-income and vulnerable households to a greater extent, as they tend to suffer greater exposure (European Commission, 2021). On the other hand, Sileci (2023) finds greater health benefits in less polluted, less dense, and better-off areas in BC. This suggests that carbon pricing may exacerbate pre-existing pollution-income gaps.
Revenue recycling
Carbon pricing revenues can be used to mitigate their economic and distributional impact (European Commission, 2021). This is aligned with the expectations of the “double dividend” theory of environmental taxation, in which a wide range of literature indicates that using environmental tax revenues to mitigate distortionary taxes provides both environmental and economic benefits. The EU ETS2 is expected to have a negative effect on Gross Domestic Product (GDP), unless revenues from the scheme are recycled. Recycling revenues into low carbon technology investments is found to lead to a more positive GDP impact than use of revenues for outright tax reductions (Fazekas et al., 2021). A 2014 modelling study on Scotland found that if revenues of a hypothetical £50/tCO2 carbon tax are recycled by reducing income tax rates, emissions and unemployment would fall, and GDP and real wages would increase, compared to expanding general government expenditure (Allan et al., 2014). The study does not account for wider UK climate change policies, and given its publication date, findings should be treated with caution.
Various options are available for carbon price revenue recycling, and their suitability varies by country. Generally, a combination of mechanisms, including direct income support, is required to address equity, efficiency, and environmental concerns (Streicher, Kettner and Schratzenstaller, 2025). Many existing revenue recycling schemes include measures targeted at specific income groups, for example tax credits for lower-income groups in BC, or income tax reductions for low- and middle-income households in Sweden (GIZ and UNDP, 2019; Fairbrother and Rhodes, 2023; Ministry of Finance, 2023). Others target support for specific low-carbon measures, for example temporary aid schemes for renewable heating in Sweden or energy efficiency, clean heat, and low-carbon mobility in EU Member States (Ministry of Finance, 2023; European Commission, 2025).
If recycled revenues are not targeted at specific consumers, carbon pricing schemes can be revenue-negative. For example, Austria’s Regional Climate Bonus recycles carbon pricing revenues through a flat-rate income support to all residents. Total payments were estimated to exceed carbon pricing revenues by €930 million in 2022 (Austrian Court of Audit, 2021). Unintended effects may also occur unless the schemes are carefully managed. For example, the redistribution of revenues through tax relief for commuter trips in Germany may favour higher-income households (European Environmental Bureau, 2022). Revenue redistribution can also offset the reduction in fossil fuel demand driven by carbon pricing, as found in Norway. Here, the impact of CO2 taxes is mitigated by redistributing revenues to reduce other road transport taxes, thus reducing the cost of transport and counteracting emissions reductions (Norwegian Ministry of Climate and Environment, 2022). However, modelling of a UK ETS on transport and buildings finds such counteraction effects to be insignificant (Sturge et al., 2024b).
As with emissions abatement, the economic and distributional effects of carbon pricing are highly context-dependent, as are the potential impact of revenue recycling. As such, there is no strong consensus in the literature on optimal mechanisms for use of carbon pricing revenues. However, the reviewed literature does outline the importance of closely assessing consumer impact before implementing carbon pricing instruments. This includes particular attention to low-income households and groups at risk of fuel poverty, on which research generally agrees that the impact will be disproportionate.
Shortfalls and limitations of carbon pricing schemes
While carbon pricing schemes could deliver emissions abatement and manage associated consumer impact, they present risks, shortfalls and limitations. Their impact is often difficult to quantify precisely, given the wider policy environment and market forces.
Complementary policies
A near-universal finding on the performance of carbon pricing schemes is that they are more effective in reducing emissions if they are part of a mix of complementary policies (Raiser and Rault, 2025). The price of ETS allowances is significantly influenced by the stringency of complementary policies and ambition of targets. (Günther et al., 2024). For example, Sweden’s and Norway’s successes in decarbonisation are partly dependent on integration of carbon pricing with subsidies, alternative fuel quotas, other taxes and support mechanisms, as well as research and development incentives (Ma, 2023; Norwegian Ministry of Climate and Environment, 2022). Multilevel policy mixes can be mutually reinforcing if they are designed with a view to maximising efficiency and minimising overlap (European Commission, 2021; Winter, 2024).
Existing taxes and levies must be carefully considered to avoid double burdening of consumers. The UK has a long-standing excise duty system on the transport and heating sectors, and an existing environmental tax charged on business energy use (the Climate Change Levy), which could introduce a risk of double counting of emissions taxes (UK Government, 2016). This could be mitigated by phasing out or adjusting these taxes as the ETS on affected sectors is phased in (Sturge et al., 2024b). The EU is also designing compensation regimes and coordinating with Member States to mitigate overlaps between the EU ETS2 and national schemes (European Commission, 2021; Federal government of Germany, 2024, Bach et al., 2023).
Complementary policies can also inadvertently reduce the effectiveness of carbon pricing. For example, if subsidies encouraging the deployment of clean technologies in a certain sector are introduced alongside an ETS, they risk lowering carbon prices. If an ETS covers the electricity and heating sectors, and simultaneously there are subsidies available for renewable electricity deployment, electricity producers could decarbonise more quickly, increasing the number of available ETS permits and thus depressing the carbon price. The lower carbon price could in turn disincentivise the decarbonisation of heating producers and reduce the efficiency of the overall ETS scheme. This is also known as the waterbed effect. (Raiser and Rault, 2025). This is why market stabilisation mechanisms such as the EU ETS2 Market Stability Reserve (MSR) are seen as essential (Marcantonini et al., 2017).
Carbon taxes and ETS schemes each have relative advantages and disadvantages if being considered for standalone application. They can also be applied simultaneously, but the effects of doing so are context-dependent. In some cases, applying them to the same emissions base could render one of them redundant. However, they can also complement each other. For example, a carbon tax acting as a price floor can help stabilise volatile prices in an ETS. This was shown to be successful in the UK ETS for electricity sector emissions (Raiser and Rault, 2025; International Carbon Action Partnership, 2025c).
Social and political feasibility
Ultimately, emissions reduction from carbon pricing is driven by the magnitude of the price signal which itself creates challenges for social and political acceptability (Arcila and Baker, 2022). These have been evident throughout the negotiation of the EU ETS2 and the current debates surrounding its implementation (Germanwatch, 2025). Elsewhere, the literature shows varying public reactions and degree of support across countries, but also across time. For example, after an initial backlash, the BC carbon tax received greater public acceptance once revenue recycling progressed (Pretis, 2022; GIZ and UNDP, 2019). This link between social acceptance and revenue recycling is found more broadly across the literature. In Sweden, social acceptability was found to depend on the perceived quality of existing social insurance programmes and the measures taken to address collective, rather than personal, distributional impacts (Nordbrandt et al., 2025; Lindvall et al., 2024).
Apart from through revenue recycling, public acceptability of carbon pricing may increase if the policy is introduced gradually. This can allow consumers to adapt to the scheme before it causes major lifestyle changes, thereby reducing adjustment costs. Moreover, effective communication techniques can increase feasibility of carbon pricing by highlighting benefits, reducing misperceptions and tackling biases. This includes making the financial and environmental benefits of the scheme prominent in communications. For example, this could be through showing revenue recycling to individuals via their payslips, or by using positive language, such as ‘climate contribution’ instead of ‘carbon tax’, to frame the scheme (Barrez and Bachus, 2023).
Political feasibility will strongly depend on social acceptance of carbon pricing, as well as wider social challenges. Political support for carbon pricing can be increased if schemes are designed to clearly address environmental and economic issues (Knaggård and Hildingsson, 2025). The administrative burden of carbon pricing schemes must also be considered and can affect political feasibility. Carbon tax systems can often be implemented relatively inexpensively for governments, using existing fuel tax infrastructure (Stavins, 2022; Ministry of Finance, 2023). ETSs tend to be more administratively complex and generally require a separate regulatory authority. This complexity may be less burdensome if an ETS is already in place on other sectors, as is the case in the UK.
The Scottish context
The ultimate impact of any carbon pricing scheme will depend on its national context, including existing policies, climate ambitions, and socio-economic challenges. In Scotland, the ambitious national commitment to reaching net zero emissions by 2045 will require steep reductions in emissions from road transport and buildings. According to the draft Climate Change Plan (CCP), the transport sector will need to reduce emissions by 74% between the 2026-2030 and 2036-2040 periods. The buildings sector will need to reduce emissions by 42% between the 2026-2030 and 2036-2040 periods (Scottish Government, 2025a). Scotland’s Heat in Buildings Strategy (2021) set out even steeper reductions for emissions from building heating: 68% by 2030 (Scottish Government, 2021). This strategy is due to be revised in 2026.
Reaching these climate targets is expected to require a significant ramp-up in the pace of adoption of low-carbon transport and heating. The Scottish Government estimates that 1.9 million homes and 13,000 commercial properties must transition to heat pumps or heat networks by 2045 (Scottish Government, 2025a). For transport, the UK Climate Change Committee (CCC) projects an increase in the share of battery electric vehicles from 4.8% in 2025 to nearly 30% in 2030 and 94% in 2045 as part of a balanced pathway to net-zero emissions (Climate Change Committee, 2025b). At the same time, Scotland’s transport and buildings sectors have been slower to decarbonise than other sectors, and recent emissions projections under the Climate Change Plan update of November 2025 are less optimistic than in the previous Climate Change Plan (CCP) from 2020 (Scottish Government, 2025b; Climate Change Committee, 2025a).
Carbon pricing policies could play a role in accelerating the pace of decarbonisation in Scotland’s transport and buildings sectors, as part of a wider policy portfolio. Scotland has numerous policies addressing decarbonisation in transport and buildings, including: subsidy schemes for building energy efficiency and low-carbon heating heat standards for new buildings proposed energy efficiency standards for existing buildings a phase-out of new petrol and diesel car sales by 2030 interest-free loans for EV purchases and a zero-emissions vehicle mandate (Scottish Government, 2025a; Scottish Government, 2025b; Scottish Parliament, 2025; Scottish Government, 2022; UK Government, 2025c; Transport Scotland, 2023). Transport fuels are also covered through wider taxation schemes with implicit impact on emissions, such as the UK fuel duty. Under the fuel duty, EV owners will pay per-mile rates equivalent to around half of that charged to internal combustion engine vehicles (HM Treasury, 2025). Such policies and support schemes could be key complements to carbon pricing, by ensuring that consumers can effectively respond to a carbon price signal by investing in new technologies or adjusting their demand.
Reducing consumer impact and avoiding policy regressiveness would be important in the Scottish context, where household disposable incomes are still recovering from recent inflation shocks (Scottish Government, 2024c). Distributional impact, meaning impacts on low-income and other vulnerable consumers, is a key concern given Scotland’s a legally binding target to reach a 5% rate of fuel poverty by 2040 from current rates of 39% (Scottish Parliament, 2019). 20% of the population is also at risk of transport poverty (Scottish Parliament Cross Party Group on Sustainable Transport, 2025). These socio-economic characteristics mean that any additional cost burden from carbon pricing needs to be managed especially carefully. However, if accompanied by revenue recycling mechanisms designed to alleviate distributional effects, carbon pricing instruments could also become effective tools in addressing fuel poverty. Revenue recycling mechanisms can also remove barriers to investment in low-carbon measures, such as heat pumps, for low-income and vulnerable populations.
Effects of a carbon price on Scotland’s road transport and buildings
In this section, we model the effects of a carbon price on Scotland’s road transport and building sectors, and discuss the implications given the Scottish context outlined above.
Overview of carbon pricing model
To simulate the effects of a carbon price levied on Scotland’s transport and building heating fuels, we constructed a simple investment model. The model simulates the application of a carbon price to transport and heating fuels based on their carbon content. Figure 1 shows the general modelling framework of the model used in this study, which simulates:
- the change in fuel consumption by several “consumer archetypes” in response to changing fuel costs (including the addition of a carbon price)
- decisions by these archetypes to invest into alternative low-carbon technologies under the carbon price.
The above consumer archetypes are defined as: household consumers (differentiated by income level); and commercial consumers for heating (small and large offices, retail spaces, and other non-residential spaces, such as warehouses) and transport (light goods vehicles (LGVs) and heavy goods vehicles (HGVs) for business purposes).
Our model also includes a baseline scenario, which simulates a mix of existing and expected policies on Scotland’s transport and building sectors. The primary variables we model in our carbon pricing scenarios are: emissions abatement, the costs incurred by consumers and fuel suppliers, and the distribution of costs between commercial and residential consumers and across residential consumer income deciles. We cite our findings relative to the baseline scenario, for example additional emissions abatement and additional spending on fuel.
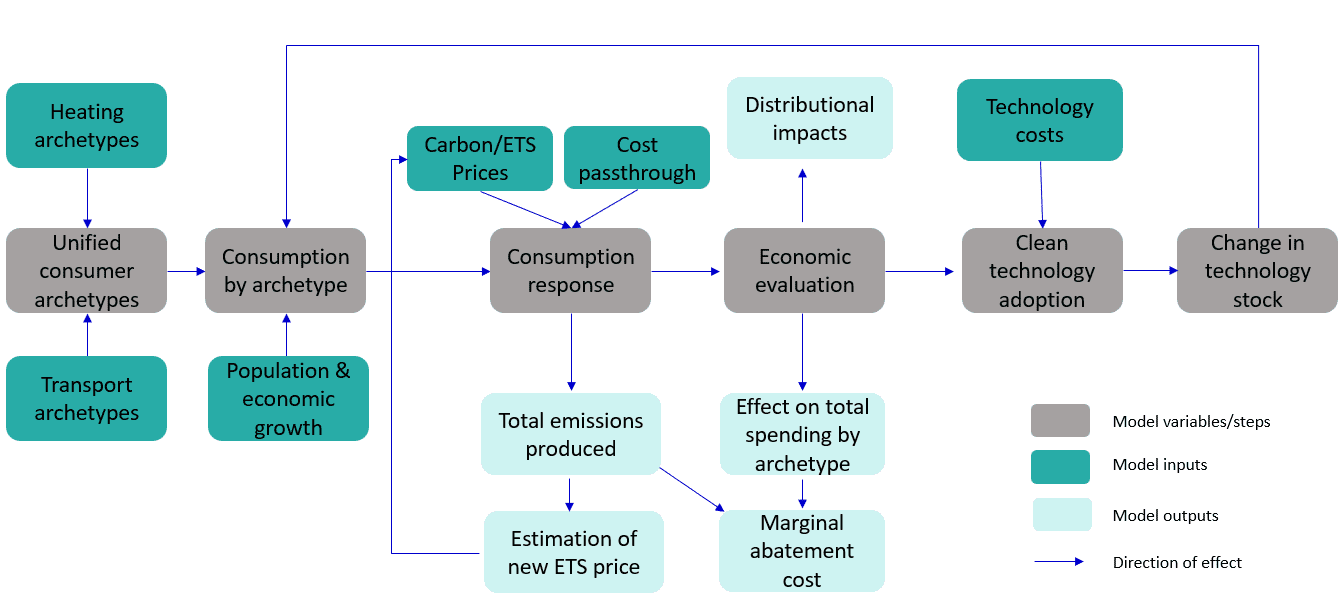
General modelling framework
The model is implemented in Excel. It is initiated through a baseline scenario, which accounts for the impact of existing and expected UK and Scottish policies on consumption behaviour, as well as projected economic and demographic changes in Scotland. We then model a carbon price on top of these policies and projected changes, implemented through a carbon tax (2 scenarios – low tax and high tax rates) and an ETS (2 scenarios – with and without a soft price cap). Full details are provided in Appendix A. This price then generates a consumer response additional to the baseline scenario: adjusting fuel consumption, or investing in a lower-carbon technology if it makes economic sense. The technologies we model are limited to heat pumps and electric vehicles (EVs), given their anticipated prominent role as low-carbon alternatives and the constraints on modelling additional technologies imposed by the simplicity of our model. The carbon price is pre-set in the carbon tax scenarios, and derived from a simulated ETS market in the ETS scenarios. Demand for heating and transport is assumed to be relatively inelastic, more so for heating than for transport. Additional details are provided in Appendix A.
Model scenarios, data sources and assumptions
Our baseline scenario follows the CCC 7th Carbon Budget (7CB) Balanced Pathway trajectory until 2030, which provides the best available holistic picture of policy evolution. After 2030, our baseline scenario diverges from CCC projections, particularly for heating, due to the more conservative assumptions we make about technology uptake. These assumptions are necessary simplifications and broadly mean that in our model low-carbon technologies are only deployed when their incumbent counterparts are retired. Second-hand markets and leasing for vehicles are not considered. Our scenarios also do not assume the full range of supporting policies and regulatory changes that are modelled in the 7CB scenario, which accelerate technology deployment.
Despite this divergence, our baseline scenario remains ambitious, as it includes current and key expected decarbonisation policies (see Appendix A for the full list of policies). This was an intentional design choice, aiming to assess the effect of carbon pricing as part of a policy portfolio, rather than in isolation. However, the ambitious nature of the baseline scenarios means that emissions reductions are already steep before carbon pricing effects are even modelled. This impacts the modelled emissions abatement and costs of carbon pricing instruments (see Section 4.2).
Features of the four carbon pricing scenarios and our main assumptions are detailed in Appendix A. The carbon tax is set to start in 2027, and the ETS in 2028. This was necessary to avoid circularity in the model. The period over which carbon pricing is analysed in this study, referred to as the “study period”, is 2027-2045 (with no ETS in 2027). The low carbon tax rate is set at £25/tCO2 and the higher at £75/tCO2, with the rates selected based on low and high ranges of carbon taxes in EU Member States. In the ETS scenarios, the price is dynamically modelled based on ongoing emissions reductions and pre-set market rules (see Appendix A). Carbon prices in these ETS scenarios reach £110-£133/tCO2 by 2045. For each of the four scenarios, we simulate the effects of a full pass-through rate in which the carbon price is fully borne by consumers, and a 50% rate in which suppliers and consumers each pay half the carbon price.
The data sources used in this model are outlined in Appendix B. They are primarily sourced from national-level statistics and projections (e.g., Climate Change Committee, 2025b). The ETS scenarios are constructed based on the design of the EU ETS2 (see Appendix A).
We make a series of simplifying assumptions in the model. Namely, we do not model non-price factors influencing technology uptake, such as energy literacy. We also model the perceived affordability of alternative technologies indirectly, varying across income groups, and set affordability factors artificially based on income deciles. This is due to challenges with obtaining robust data on affordability of investments across income groups. We use simplified cost curves and S-curve technology deployments. This means that the uptake of heat pumps and EVs in our model follows the S-shaped curve typical of adoption trajectories for low-carbon technologies. The S-shaped curve represents slow adoption whilst new technologies are more expensive than incumbents, then rapid acceleration once cost parity or advantage is reached and finally tapering off as the market approaches saturation. Our model also does not include a minimum acceptable fuel consumption, as for the modelled carbon prices we do not see a reduction in consumption beneath levels required for maintaining quality of life. Further assumptions and detail are available in Appendix A.
Limitations
The simplicity of the investment model is intentional, given how complex it is to model multiple sectors. This imposes a limit on how realistic the simulated effects are. It is intended as a starting point to assess the order of magnitude of potential impact. Detailed explanations of the model limitations are presented in Appendix A.
An important limitation is that because we assume that technologies are only switched when they approach their end of life, rather than over a shorter term, the uptake of new technologies modelled in this study may be relatively conservative. For example, in the real world, a household may replace a car before their current car reaches the end of its life. The complexity of ETS schemes also means that the carbon price trajectory in an implemented scheme may unfold quite differently than set in the modelling. Detailed policy interactions are not modelled due to the inherent complexity. Another important limitation is that we do not model the effect of revenue recycling on technology uptake. This affects the modelled consumer behaviour, as revenue redistribution through low-carbon subsidies could drive more appetite for investment. We do not treat price elasticity of substitution (i.e., responsiveness to differences between the price of fossil and low-carbon alternatives) directly in the model. It is assessed implicitly in the calculations underpinning technology switching by consumer archetypes, however it is an additional limitation. Finally, the modelled impact of carbon pricing will necessarily depend on assumptions about whether agent behaviour is forward-looking or myopic (Allan et al., 2014). In our model, we assume that agents react purely on an economic basis, comparing the costs of different technologies with prices and technology capital costs in the year of investment decisions. In reality, consumers will be at least partially forward-looking, and will make decisions to invest or not in low-carbon alternatives based on more than economics.
Modelling results
Carbon prices
The simulated yearly ETS carbon prices are shown in Appendix C. The carbon prices start at £62.5/tCO2 in 2028 and reach £76/tCO2 and £78/tCO2 in 2030 and £134 and £110 in 2045, for the scenario with and without a price cap, respectively (Table 1). The differences in average carbon price between the ETS scenarios with and without a price cap are minor (£95/tCO2 and £101.7/tCO2, respectively). The price-capped scenario has a much more volatile carbon price due to the MSR alternately releasing and withdrawing allowances to keep the market stable and prices low (see Appendix A). ETS prices in both scenarios are lower than indicated in literature for the EU ETS2 (BloombergNEF, 2025). This is primarily because the baseline scenario is already ambitious.
Scenario | 2027 | 2030 | 2035 | 2040 | 2045 |
Carbon tax £25 | 10 | 25 | 25 | 25 | 25 |
Carbon tax £75 | 25 | 75 | 75 | 75 | 75 |
ETS with price cap | 0 | 76.10 | 99.17 | 115.45 | 133.43 |
ETS without price cap | 0 | 78.31 | 107.43 | 121.53 | 110.06 |
Table 1. Carbon prices under the four modelled scenarios (£/tCO2).
The effects of the above carbon prices on fuel prices are shown in Figure 2 for natural gas prices, where the effect of carbon pricing under the four scenarios is most noticeable. The 50% passthrough rate calculations are not shown for brevity, but are included in Appendix C. The £25/tCO2 carbon tax drives only modest uplifts, whereas the £75/tCO2 carbon tax and ETS scenarios provide stronger upwards pressure on fuel prices. As expected, the ETS scenarios exhibit greater short-term price fluctuations compared to carbon taxes, which comes on top of the existing volatility of natural gas prices. The overall reduction over time in underlying natural gas prices in all scenarios is due to external market forces, primarily the large wave of new liquefied natural gas (LNG) supply which reduces prices over the long term (Department for Energy Security and Net Zero, 2024). Diesel and petrol price trends are also shown in Appendix C.
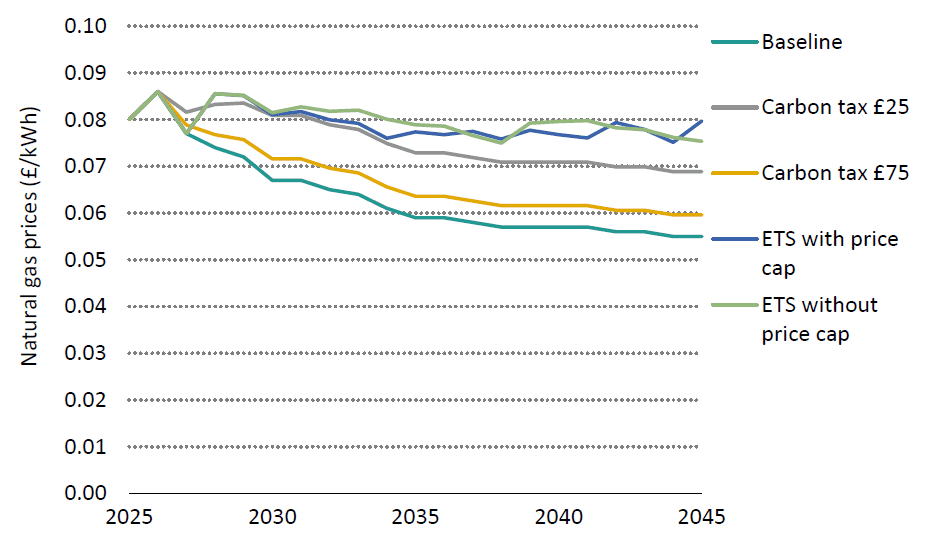
The simulated carbon prices and their impacts on fuel price levels generate emissions abatement and costs to consumers, manifested differently across income groups. The following sections present the headline modelling results for these parameters.
Emissions abatement
Our model shows a cumulative emissions abatement relative to the baseline scenario of 2.9-11 MtCO2 over the study period (2027-2045). The highest reductions are in the £75 carbon tax scenario with full passthrough, and the lowest in the £25 carbon tax scenario with 50% passthrough (Figure 3). Under the ETS scenarios, cumulative additional reductions are in the range of 6.4-6.8 Mt, with slightly higher reductions in the price-capped scenario driven by higher price volatility especially in later years.
In 2030, aggregate transport and building emissions under the modelled carbon pricing scenarios would be up to 3.7% lower than in the baseline scenario, with the highest reductions in the capped ETS scenario with full pass-through. This is only slightly higher than the £75 carbon tax with full passthrough. By 2045, aggregate emissions are up to 13% lower than the baseline, with the highest reductions in the £75 carbon tax with full pass-through (Figure 4). This indicates that while short-term emissions reductions are comparable between a high-range carbon tax and ETS, in the longer-term carbon taxes lead to a more consistent response to the carbon price signal, compared to ETS schemes where the carbon price fluctuates significantly.
In our model, the primary consumer response to a carbon price is a reduction in fossil fuel consumption, rather than a change in technology, despite demand for fossil fuels being inelastic (i.e., having low responsiveness to price changes). This is due to the relatively small impacts of carbon pricing on the overall levelised cost of heat or transport, as well as investment barriers for heat pumps and EVs. However, several important caveats apply. Firstly, we do not model revenue recycling, which could be used to remove technology investment barriers, for example through subsidies. Secondly, our model assumes that technologies are only replaced at the end of their life, due to data availability challenges. As such, our assumptions around technology switching may be conservative, particularly for EVs, given that vehicles may be replaced before the end of their life. Thirdly, our baseline scenario is already quite ambitious in terms of expectations on technology uptake, being aligned with the 7CB pathway. Finally, consumers will not reduce their fuel consumption indefinitely. While the reduction in consumption in our model does not approach this level, stronger carbon price signals would likely push more consumers towards technology switching, rather than continued reduction in fuel consumption.
In all scenarios, the primary source of emissions reductions is the domestic buildings sector, with cumulative emissions reductions of 2.6-9.5 MtCO2 over the study period. On the other hand, cumulative emissions reductions in the transport sector are at most 1.55 MtCO2 over the study period, which occurs in the £75 carbon tax scenario. This reflects the baseline scenario already seeing significant EV uptake, leaving little room for the carbon price mechanisms to make additional gains.
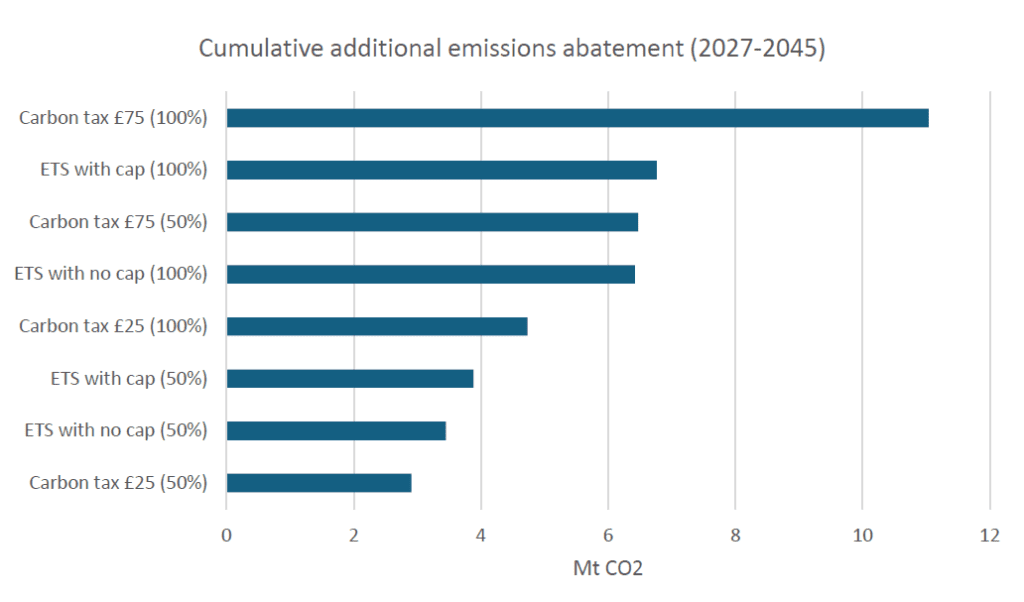
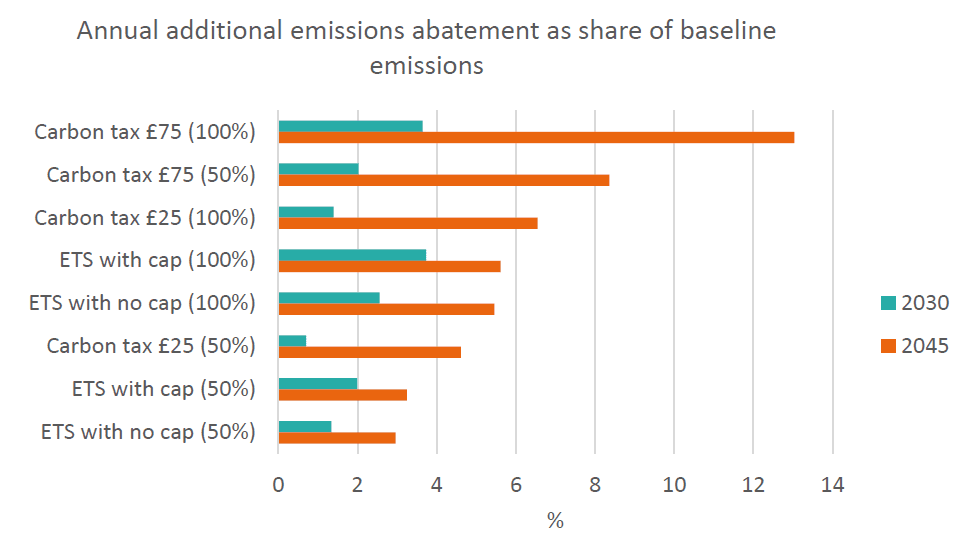
In all scenarios, transport and heating emissions fall as lower-carbon technologies become cheaper and their uptake accelerates. Emissions persist particularly in domestic heating across all scenarios (Figure 5). Introducing a carbon tax at £25/tCO2 delivers a limited abatement effect compared to the baseline, largely through prompting a reduction in the consumption of petrol, diesel and natural gas. This implies a limited effect of this low tax rate on technology switching. Raising the carbon tax to £75/tCO2 accelerates emissions reductions and delivers the lowest emissions levels in 2045. Material emissions reductions in domestic heating are expected relative to the baseline, due to a reduction in natural gas consumption and some additional uptake of heat pumps. However, even at £75/tCO2, residual emissions remain across all sectors by 2045, suggesting that complementary policies are needed to incentivise a substantially larger rate of technology switching.
The ETS scenarios sit between the two carbon tax scenarios in terms of overall expected impacts on emissions. The fluctuations in emissions pricing means that the effect on yearly consumption levels alternately increases and decreases. The increase to a constant price under the higher-range carbon tax scenario delivers slightly larger emissions reductions.
Technology deployment levels underline the differences in abatement between carbon pricing scenarios (Figure 6). Higher carbon prices are expected to have the most notable impact on commercial heating, which sees limited deployment in the baseline scenario. Domestic heat pumps and EVs see some increase in deployment under higher carbon pricing scenarios. However, as indicated above, deployment additional to the baseline is low due to the ambitious nature of the baseline, the relatively small carbon pricing signal, and the assumptions used in this study.
Although our model shows modest additional emissions abatement driven by carbon pricing, such instruments can be valuable complementary policies to an ambitious existing policy mix. In particular, if emissions reductions under the baseline scenario fail to materialise as expected, a continued carbon price signal could incentivise low-carbon switching, insuring against the risk of exceeding Scotland’s carbon budgets.
Cost to consumers
In our model, carbon pricing generates emissions reductions through incentivising investments into low-carbon technologies (heat pumps and EVs) and disincentivising consumption of fossil fuels by raising price levels. Throughout this section, “investment” refers to investment by consumers in low-carbon technologies. The effectiveness of each carbon pricing scenario will depend on the balance between these two effects and how they change over time. As indicated in Section 4.2.2, consumers’ primary response to a carbon price is to reduce their fuel consumption, rather than invest in low-carbon technologies. This is reflected in relatively stable levels of investment under the carbon pricing scenarios over across the time period. Investment levels are similar to the baseline scenario under carbon taxes, but the ETS scenarios have lower levels of total capital investment by consumers than the carbon tax scenarios and the baseline scenario. This is largely due to the ETS scenarios incentivising larger uptake of heat pumps in the domestic sector pre-2030 whilst the subsidy for heat pump is modelled at current levels of £7,500 per unit (see Section 4.4).
Whilst the scenario with largest capital investments (the £75 carbon tax with full pass-through) does not generate a marked increase in total investment in low-carbon technologies relative to the baseline, it does drive a reduction in fossil fuel consumption. However, this reduction is not enough to offset the additional fuel costs due to the carbon price. As such, fuel consumption costs paid by consumers increase by £7.8 billion/year compared to the baseline. The domestic heating sector accounts for nearly 50% of this additional cost, reflecting the lower price elasticity and the baseline uptake already incentivised through heat pump subsidies. This is an undesirable effect, as it will mean that consumers who cannot switch their heating systems yet are forced to pay a higher fuel price, or reduce their heating use. Investment barriers are likely a significant factor in the observed low switching rates, and will be particularly important in the lowest income deciles (see Section 4.2.4). We note again that some of the restrictions on technology switching reflect assumptions built into the model such as switching only occurring when the existing technology reaches its end of life. As such, these findings may be conservative. The preference to reduce fossil fuel consumption rather than invest in low-carbon technologies occurs across all carbon pricing scenarios.
The different carbon pricing levels also translate into different levels of government revenue raised through the respective schemes (Figure 6). Those with 50% passthrough generate slightly higher revenues, given that fuel suppliers are assumed to not reduce their sales and simply pay their half of the carbon costs. Between the scenarios themselves, the £75 carbon tax with 50% passthrough generates the highest revenue to government (exceeding £10 billion across the total time period), higher than the ETS scenarios (£6-6.5bn), despite the latter having higher average carbon prices over the study period. This is because the ETS scenarios drive a sharper reduction in consumption in earlier years, reducing the effective tax base, whereas the £75 carbon tax does not reduce consumption as sharply, therefore consumption and associated revenues stay higher for longer. Whilst not explicitly modelled here, recycling these tax revenues to support targeted interventions could enable an acceleration in emissions reductions by removing some of the cost barriers of low-carbon technologies (see Section 4.5.2).
The overall cost per tonne of CO2 abated in each scenario is the additional system cost (investment and consumption costs are borne by consumers and suppliers), divided by the additional emissions reductions. Under these conditions our model finds that the system abatement costs range from £591/tCO2 (£25 carbon tax with 50% pass-through) to £1,217/tCO2 (uncapped ETS scenario with 50% pass-through). These costs include the carbon costs paid by a population which is assumed to be relatively demand-inelastic. As such, they are not directly comparable to the abatement costs cited in other literature for the UK. These costs also accrue above baseline where substantial emissions reductions have already been realised, and are not supported through revenue recycling. This preliminary finding indicates that revenue recycling and complementary policies will be key to enable the full cost-effectiveness of carbon pricing instruments as emissions reductions tools.
Distribution of costs
This section examines the distribution of the modelled costs across commercial and residential consumer archetypes, and across residential consumer income archetypes[1]. The consumer costs are materially different across incomes and archetypes, due to variations in the total energy consumption, travel footprint and ability to afford the high upfront costs of low-carbon technologies. Across all scenarios, commercial buildings and the lowest income deciles are the archetypes which consistently incur the highest additional consumption costs relative to the baseline (Figure 7). The highest difference in costs across all archetypes is in the £75 carbon tax with full passthrough – as much as 8% higher than the baseline costs. Domestic consumers in higher income deciles see a much smaller impact on their fuel bills, as despite higher energy consumption they are already more likely to own an electric vehicle and/or heat pump and can more easily switch to low-carbon technologies. Commercial transport also sees a lower impact across all carbon pricing scenarios, as diesel vehicles are more prominent and carbon pricing leads to a smaller percentage increase in cost under future price scenarios.
Impact on emissions
This section analyses the implications of the model results for emissions abatement and modelled changes in the fuel mix.
Relative to 2023, when Scotland’s GHG emissions were 39.6 MtCO2e (Scottish Government, 2025b), a policy mix aligned with the CCC’s 7CB decarbonisation trajectory for Scotland can keep both buildings and transport emissions within Scotland’s carbon budgets, regardless of whether carbon pricing is in place. Carbon pricing slightly enhances these emissions reductions. Our modelled results show emissions reductions between 2027 and 2045 lower than the 16.3-25.8% reductions in transport and building emissions modelled by others at UK level (Sturge et al., 2024), but they are similar to those envisaged in the design of the EU ETS2 (European Commission, 2021). It is worth highlighting that additional measures, such as energy efficiency or modal shift, represent lower-hanging fruit that in a real carbon pricing environment may be further incentivised. As our simple model excludes these measures, it may underestimate emissions abatement.
The primary driver of emissions abatement under carbon pricing is a reduction in fuel consumption to avoid carbon costs. This mostly occurs in the residential buildings sector, where modelled heating demand is reduced by an additional 525-2,444 GWh per year on average, relative to the baseline scenario. The highest additional demand reductions are in the £75 carbon tax and the uncapped ETS scenario (both with 100% passthrough), and the lowest in the £25 carbon tax scenario with 50% passthrough. This demand also shifts from natural gas to heat pumps, although additional effects compared to the baseline scenario are minor (Table 2 and Table 3). Pricing emissions from heating fuels drives the deployment of an additional 11,000-115,000 heat pumps on average each year, relative to the baseline scenario. The highest deployment (115,000) is in the capped ETS scenario. If the capital cost of heat pumps is further reduced by recycling carbon pricing revenue (see Section 4.5.2), uptake could be further increased.
Fuel | 2025 | Baseline, 2045 | Carbon tax £25, 100%, 2045 | Carbon tax £25, 50%, 2045 | Carbon tax £75, 100%, 2045 | Carbon tax £75, 50%, 2045 |
Gas | 47% | 22% | 23% | 24% | 21% | 23% |
Petrol | 28% | 5% | 5% | 5% | 5% | 5% |
Diesel | 14% | 6% | 6% | 6% | 6% | 6% |
Electricity | 11% | 67% | 66% | 65% | 68% | 66% |
Fuel | 2025 | Baseline, 2045 | ETS with cap, 100%, 2045 | ETS with cap, 50%, 2045 | ETS without cap, 100%, 2045 | ETS without cap, 50%, 2045 |
Gas | 47% | 22% | 21% | 22% | 21% | 22% |
Petrol | 28% | 5% | 5% | 5% | 5% | 5% |
Diesel | 14% | 6% | 6% | 6% | 6% | 6% |
Electricity | 11% | 67% | 68% | 67% | 68% | 67% |
On the other hand, modelled results suggest the transport sector only weakly responds to a carbon price. Overall, transport energy demand is reduced by an additional 52-390 GWh per year on average, with the highest additional demand reductions in the uncapped ETS scenario with 100% passthrough, and the lowest in the £25 carbon tax scenario with 50% passthrough. Petrol and diesel consumption change negligibly relative to the baseline scenario. This contrasts with some literature findings on the relative ease of changing travel behaviour compared to heating systems (Fazekas et al., 2021). In our case, the modelled carbon price levels do not – in isolation – significantly shift the relative cost of car ownership between EVs and internal combustion engine vehicles (ICEs). Not accounting for second-hand car sales in the model may also contribute to somewhat lower estimates of additional switching to EVs. Emissions reductions in commercial transport are primarily from light goods vehicles (LGVs), but are marginal compared to the baseline scenario where the fleet already switches almost fully to EVs by 2045.
Although the modelled technology uptake driven by carbon pricing is relatively low, it is worth highlighting other environmental effects which they may imply. An increased uptake of EVs may add to existing challenges in end-of-life battery disposal recycling. The baseline scenario foresees an uptake of 24.4 million EVs across the study period, reducing domestic road transport emissions to nearly zero by 2045. Over 1 million of these will be approaching the end of a typical 20-year life by 2045, and ensuring their reuse and recycling will be key, particularly if they are deployed in rural or island areas where appropriate waste management systems may be scarcer. In the buildings sector, increased heat pump installation and maintenance must be appropriately managed to prevent refrigerant leaks and other life-cycle environmental impacts (International Energy Agency, 2022).
While our modelled carbon pricing instruments deliver limited additional emissions abatement, it is worth highlighting that this does not diminish their role in supporting existing decarbonisation policies. Indeed, as highlighted in Section 4.2, our already-ambitious baseline scenario is partially responsible for the muted investment response to carbon pricing. If the policies assumed in the baseline scenario are discontinued (or if future ones fail to materialise), carbon pricing could act as a “backstop” policy to continue incentivising a switch to low-carbon heating and transport alternatives. Furthermore, as mentioned in Section 4.2.3, revenue recycling (which we do not model) could further incentivise investments in low-carbon technologies and increase the associated emissions abatement.
Cost to consumers
In this chapter, we analyse the consumption and investment costs incurred by consumers under the selected carbon pricing scenarios. Our analysis is not a commentary on the cost-effectiveness of carbon pricing, but rather it sets out the costs to consumers in the absence of revenue recycling. It serves to provide a first indication of the magnitude of consumer payments under carbon pricing, and to reinforce the importance of revenue recycling (further addressed in Section 4.5.2).
As shown in Section 4.2.3, in our carbon pricing scenarios the total payments by consumers per tonne of abated CO2 range from £591 in a £25 tax with 100% passthrough scenario to £1,217 in an uncapped ETS scenario with 50% passthrough. Payments are higher in scenarios with 50% passthrough rates because suppliers, who pay half of the carbon costs in these scenarios, are assumed to not have the ability to reduce their emissions. Across scenarios with 100% passthrough, payments are higher in ETS scenarios, reflecting the effect of price volatility on costs. As ETS prices fluctuate, overall consumption responses are weaker than under a steadily rising carbon price that reaches a peak.
Consumer costs comprise the additional fuel costs paid by consumers who do not switch their heating or transport technologies, and the cost of investments in low-carbon alternatives by those who do decide to switch under the pressure of a carbon price. The total cumulative amount that consumers in Scotland pay under the selected carbon pricing scenarios ranges between £1.5 billion and £8 billion over 2025-2045, 0.5-3.7% higher than in the baseline. The highest total cost is in the £75 carbon tax scenario with full cost pass-through. The majority share of these consumer payments (82-83% in all scenarios) is for additional fuel costs, and as such is a transfer to the Scottish Government, collected either as taxes or payments for ETS permits. As such, the total costs to consumers are not comparable to official GHG abatement costs for the UK, which are much lower (Climate Change Committee, 2019).
Crucially, revenue redistribution, which we did not model, could reduce the ultimate net cost to consumers of carbon pricing. As indicated by the majority share of fuel costs in consumer costs, if revenue is not recycled, under a carbon price consumers would mostly reduce their consumption, rather than invest in alternatives. However, the savings from demand reduction only partially cover the carbon cost of fuels, leading to additional fuel payments of between £1.3 billion and £7.8 billion. What proportion of these additional fuel costs is offset for consumers depends on whether and how carbon pricing revenues is recycled.
When it comes to the consumer investments in low-carbon alternatives, differences between the carbon pricing scenarios and the baseline scenario are minor. In all carbon pricing scenarios, additional investments primarily occur in the heating sector, as opposed to the transport sector. This is primarily because the baseline scenario already shows strong investment in EVs, due to an assumed fall in EV costs for and a ban on new ICE purchases from 2030 (see Section 4.1.2). Additional investments in clean heat are higher than in transport, and are highest in the commercial buildings on a cumulative basis across the study period. This is because residential heat pump deployment, which carbon pricing does encourage, primarily occurs in the short-term and benefits from the heat pump subsidy assumed in our model. Specifically, carbon pricing incentivises earlier heat pump adoption whilst the subsidy is still at its current value of £7,500. We model a gradual phase out of the subsidy from 2029 onwards, which slightly increases the investment cost to consumers over time.
In the baseline scenario a larger stock of fossil technologies remains until the mid-2030s, when the heat pump subsidy begins to taper off, thus increasing heat pump unit costs, and the modelled phase-out of gas boilers and ICE sales triggers rapid technology switching. Thus, in the baseline scenario investment in heat pumps is higher because it occurs later and from a larger pool of fossil technologies.
This may indicate that the earlier technology switching incentivised by carbon pricing, particularly in ETS scenarios, could relieve consumers of a potentially steep investment cost due to the abrupt ban on fossil technologies and tapering off of heat pump subsidies as modelled in this study. However, the limited uptake of heat pumps in recent years indicate that cost is not the only consideration that consumers are accounting for when making decisions about domestic heating.
The above model assumptions mean that in the ETS scenarios, where carbon prices are highest, cumulative investment by consumers in low-carbon technology over the 2027-2045 period is lower than in the baseline scenario, with most of the difference due to the timing of residential heat pump deployment. In the carbon tax scenarios, additional investments in EVs and heat pumps across 2025-2045 are £69 – £119 million, or on average £4 million – £6 million annually. This is on top of the baseline scenario, where average annual investment costs reach £2.3 billion per year. As with additional fuel costs, the ultimate net cost to consumers of investing in low-carbon technologies depends on revenue recycling mechanisms – for example, by using some of the revenues to subsidise (or continue subsidising) heat pumps or EVs.
Beyond what consumers pay, technology switching under carbon pricing will require additional investments in supporting infrastructure. Increased electrification from heat pumps will necessitate wider grid and energy network investments. Using estimates from Love et al (2017), peak demand from households due to the use of heat pumps could rise by up 0.2 GW compared to the baseline scenario. Furthermore, local distribution networks will need to be reinforced to avoid overloading infrastructure. A baseline policy scenario aligned with the CCC 7CB and enhanced with carbon pricing could require an increase in substation capacity of up to 21 percentage points higher in the capped ETS scenario with full cost pass-through, compared to the baseline scenario. This is based on a conservative assumption that an additional 20% uptake of heat pumps requires additional 14% increase in substation capacity. These infrastructure costs were not included in our model, but are essential to support high electrification and decarbonisation pathways.
Other cost implications of carbon pricing schemes should not be discounted. For example, the administrative cost to the Scottish Government of implementing such schemes. This cost is not yet known, however administrative complexity and associated burden may be higher under an ETS. The administrative costs of administering the UK ETS were estimated at around £7 million to government and £4 million to businesses (Department for Business, 2020). In case of a carbon tax, government administrative costs are likely to be compared to those of an ETS, as a new tax could be administered using existing government structures.
The above findings do not reflect the broader economics of carbon pricing, but focus on the gross additional consumers payments for fuels and for investing in low-carbon technologies, under a modelled carbon price. In the following section, we present how these additional payments vary across groups, and reflect on revenue redistribution mechanisms to alleviate consumer cost impacts.
Social implications
In this section, we present the cost to Scottish society of the modelled carbon prices, discuss distributional impact, and outline potential mechanisms to alleviate this impact.
Social and distributional implications
Scottish consumers will bear most of the additional cost generated by carbon pricing. The ultimate costs they bear will depend on how much of the carbon cost is passed through by fossil fuel suppliers. The level of cost pass-through is ultimately a business decision and difficult to elucidate in a simple model.
The main additional cost faced by consumers under our modelled carbon pricing schemes is the carbon cost of the fossil fuels they continue to consume. For context, this is a relatively minor share of the baseline scenario consumer costs – on average 0.79%-4.44% on a yearly basis. On a per-household basis, the average yearly consumption costs due to carbon pricing in the four modelled scenarios are £29-£172 (Appendix C, Table 9), with the highest costs incurred under the £75 carbon tax with full cost passthrough. These additional costs are relatively evenly split between heating and transport (60% and 40%, respectively). Households are the hardest-hit by heating carbon costs, while transport costs are slightly higher for commercial customers than domestic ones.
The distribution of costs across household income groups shows that low-income groups are likely the hardest hit, in line with findings from our evidence review. Averaged across 2027-2045, the lowest-income households which keep using natural gas are estimated to pay 0.2%-1.4% of their assumed median income (£10,000/year) annually in additional carbon costs relative to the baseline, compared to 0.1%-0.2% in the highest-income group (Appendix C, Table 10). In transport, the differences are less pronounced, however the second- and third-lowest income groups (household income up to £30,000/year) are the most impacted (Appendix C, Table 11). They are estimated to pay on average 0.2%-0.3% of their median income in additional petrol costs. Our findings thus indicate a higher distributional impact in the heating sector, as found in studies on the EU ETS2 (European Commission, 2021).
Fuel poverty is a challenge in Scotland, and in our baseline scenario, lower-income groups already spend a disproportionate share of their income on heating and transport fuels. Without mitigation measures, both ETS and carbon taxes risk deepen this disproportion compared to the baseline scenario, most prominently in the £75 carbon tax scenario. As such, again without mitigation, carbon pricing may risk increased fuel poverty even with reduced consumption to cope with carbon prices. The ETS price cap does not change the difference between the lowest and highest income groups in what proportion of their income they spend on natural gas and petrol, indicating that a price cap on its own will not reduce the disproportionate burden on low-income households.
Our model finds substantial potential for emissions reductions arising from technology switching in low- and middle-income groups (up to £50,000/year), largely due to the fact that they have higher shares of natural gas boilers than higher-income groups. To achieve this potential, low- and middle-income groups will require targeted support for investing in low-carbon alternatives. They may also face non-cost barriers such as restrictions by landlords on heat pump installations, given they are more likely to rent rather than own their homes Scottish Government, 2023). Specific support may also be required for rural, highlands and island populations, where fuel poverty is already more pronounced (Scottish Government, 2021, Wilson et al.,2024), and switching to low-carbon transport faces more infrastructure barriers (Thomson et al., 2023).
The cost of any carbon pricing scheme comes against the backdrop of an ongoing cost of living crisis in the UK. Average gas and electricity bills in Scotland rose steeply in 2022 and remain high – approx. £948 and £2,250 per year, respectively (UK Government, 2025b). However, Scottish citizens are generally positive or neutral towards short-term climate policy (Scottish Government, 2025), broadly supportive of stronger net-zero policy, and generally support progressive taxation to fund public services. Some evidence suggests a slim majority (58%) are prepared to support a small additional cost due to net zero policy (Hawkey, 2024). This could indicate some support for carbon pricing, but will be heavily dependent on actual willingness to pay and will vary substantially across income groups.
Revenue recycling mechanisms
The modelled carbon pricing scenarios could potentially raise £3.5-£10.3 billion revenues for the Scottish Government over the study period (see Figure 8 and Appendix C, Table 12). The available evidence suggests recycling this revenue would be a key requirement for Scottish carbon pricing, to avoid disproportionately impacting low-income and other vulnerable groups, as well as to improve political saliency and public acceptability. Various revenue recycling options are available, each with advantages and drawbacks (see Appendix D, Table 15). Any planned use of government revenue for supporting consumers will need to account for a gradual decrease in consumption of fossil fuels reduces in response to the carbon price, which will affect the carbon price revenues as well as potentially other revenues, such as transport fuel duty. Revenue recycling could also be important for social feasibility, as despite being generally supportive of climate action and progressive taxation, the Scottish public cites cost as one of the main barriers to climate action (Scottish Government, 2025; Oxfam, 2024; Hawkey, 2024).
A combination of revenue redistribution methods is likely preferable (Streicher, Kettner and Schratzenstaller, 2025), for example short-term financial support to vulnerable groups, coupled with targeted subsidy schemes and public investments in infrastructure and public transport. Targeted financial compensation in the form of lump-sum payments, rebates, or dividends could be suitable options. They could be regionally differentiated or means-tested on a constellation of factors including income, but also relative risk of transport or fuel poverty, or overall deprivation risk. A focus on rural and island areas would be needed to mitigate the higher prevalence of fuel poverty, however, urban areas will also require attention given their higher prevalence of severe poverty (Scottish Government, 2025d)) and higher emissions from heating and transport (Department for Transport, 2023).
If some of the modelled government revenues are targeted for financial support to specific groups, the remaining revenue could contribute to subsidising clean heat and transport technologies or investing in enabling public infrastructure. For illustration, if the 2027 revenue from a £75 carbon tax with full passthrough were redistributed to cover the additional carbon costs of fossil fuel consumption in Scotland’s five lowest-income classes, enough revenue would remain to fully subsidise the purchase of over 19,000 domestic heat pumps or over 7,700 EVs. Regional targeting of investment can increase public spending efficiency. For example, the government may wish to subsidise EVs in deprived rural areas with high transport emissions, such as West Dunbartonshire, but invest in public transport in deprived urban areas with high transport emissions, such as Glasgow City or North Ayrshire (Department for Transport, 2023).
Conclusions
Our model shows that carbon pricing could drive an additional 2%-13% in annual emissions abatement in Scotland’s road transport and building heating, by 2045. The highest abatement is expected in a £75 carbon tax scenario with 100% passthrough, which would provide a stable carbon price signal estimated to reduce emissions by an additional 11 Mt over the 2027-2045 period, compared to the baseline. ETS instruments also generate abatement, but their greater inherent price volatility means overall abatement is lower. In all scenarios, the primary driver of emissions reductions is a reduction in fossil fuel demand, with limited switching to low-carbon alternatives, compared to the baseline. This is strongly driven by the fact that our baseline already includes ambitious decarbonisation policies, aligned with CCC projections. However, if this baseline decarbonisation fails to materialise, a continued carbon price signal could encourage low-carbon switching and insure against the risk of exceeding carbon budgets.
The particularities and assumptions of our model significantly influence the direct costs incurred by consumers under carbon pricing. For each tonne of CO2 abated, we estimate that consumers and suppliers incur direct costs of between £591 (£25 tax with 50% passthrough) and £1,217 (uncapped ETS with 50% passthrough) over the study period (2027-2045). These are not abatement costs, rather they are the sum of investments in low-carbon alternatives by consumers who deem them economically preferable and own a technology close to its end of life, and the carbon costs consumers and suppliers pay if they continue using and selling fossil fuels, respectively. The latter carbon costs are the bulk of consumer payments, because in our model consumers primarily respond to the carbon price by reducing their demand. Some of this is due to the already-ambitious baseline scenario. It is also important that we did not model revenue recycling, which if implemented could increase technology switching, particularly in low-income groups. The potential for non-economic benefits, such as improved health outcomes, is also not modelled.
Low-income consumers pay the most in additional fuel costs as a share of their income, in our modelled carbon pricing scenarios. Households with income below £10,000/year could be spending 1.4%-8% more on fuel than in the baseline scenario. Most of these consumers continue using fossil fuels, and pay the carbon price, because in our model they cannot afford to invest in heat pumps or EVs. The £75 carbon tax with full pass-through has the highest distributional impact, both in terms of the added spending on lowest-income households, and the discrepancy in spending between low- and high-income households.
This distributional impact could be mitigated if carbon pricing revenue is recycled and targeted at low-income consumers. Our model shows that government revenues could reach £10 billion over the 2027-2045 period. We only assess the impact of putting a price on carbon, without considering the subsequent use of carbon pricing revenues. Such revenue use would alter the outcomes of our model. For example, reducing consumer costs and incentivising additional investments, thus abating emissions further. Revenue recycling could be targeted as support to low-income households, complemented by public investments in enabling infrastructure. Revenue recycling could also be important for social feasibility.
Lessons learned
Carbon pricing schemes have been applied around the world, but there is still significant uncertainty around their impact on emissions and consumers. Broadly, they are shown to contribute to emissions reductions in sectors where decarbonisation is progressing more slowly, such as transport and building heating. The literature further indicates that carbon pricing on these sectors risks being regressive in high-income countries, and that its performance depends on how their revenues are recycled. To avoid the impact being regressive, revenue recycling would need to target low-income groups more at risk of fuel poverty and facing barriers to switching to low-carbon alternatives. Further research into the potential economic benefits of carbon pricing revenues is an important next step.
Our findings indicate that carbon pricing could enhance Scotland’s emissions reduction trajectories in road transport and building heating. While additional emissions reductions are modest if existing policies are already ambitious, carbon pricing instruments can be key supporting policies, incentivising decarbonisation if other policies fail to deliver. A focus on high and steady carbon prices, whether through a flat tax rate or an appropriately designed ETS, offers the most significant emissions reduction potential. However, the cost to Scottish consumers imposed by carbon pricing instruments will need to be mitigated. More precisely, reducing barriers to investment in low-carbon technologies can ensure that consumers do not just respond by restricting their fuel demand. This is particularly the case for low-income households, for whom targeted support would be required to alleviate distributional impact – which is highest when carbon prices are high and steadiest.
This research is a first step in assessing the potential of carbon pricing instruments, and is necessarily a simplified representation of possible effects. Future research should examine a wider range of potential low-carbon alternatives in heating and road transport, including heat networks and biomass heating in buildings, and biofuels and e-fuels in transport. Refining assumptions around investment barriers would also increase the reliability of our results. Modelling the distributional impact across non-income categories (e.g., rural vs urban) and the effect of revenue recycling would also sharpen recommendations on the ultimate design of carbon pricing schemes. Future research could also assess the administrative costs associated with carbon tax and ETS schemes, based on the likely level of oversight and intervention required by the Scottish Government.
How carbon pricing helps Scotland achieve its 2045 climate targets is ultimately dependent on the design of these instruments, and how they fit into the existing policy environment. Ultimately, the role of carbon pricing is to provide a signal as to the true cost of emitting CO2 – when other policies come up short, it can insure against losing traction in emissions reductions. How this happens, and how effectively it incentivises consumer change, depends on the careful investigation of complementarities and trade-offs. This is an essential topic for future research to deepen our understanding of how carbon pricing can help achieve Scotland’s 2045 climate targets.
References
Allan, G. et al. (2014) “The economic and environmental impact of a carbon tax for Scotland: A computable general equilibrium analysis,” Ecological Economics, 100, pp. 40–50. Available at: https://doi.org/10.1016/J.ECOLECON.2014.01.012.
Almström, P., Anderstig, C. and Sundberg, M. (2024) “Effects on sectors and regions of a carbon tax increase in Sweden: analysis with an SCGE model,” Annals of Regional Science, 73(2), pp. 731–756. Available at: https://doi.org/10.1007/s00168-024-01269-y.
Arcila, A. and Baker, J.D. (2022) “Evaluating carbon tax policy: A methodological reassessment of a natural experiment,” Energy Economics, 111. Available at: https://doi.org/10.1016/j.eneco.2022.106053.
Austrian Court of Audit (2021) Austrian Court of Audit (Rechnungshof) statement on the 2022 eco-social tax reform. Available at: www.rechnungshof.gv.at.
Bach, S. et al. (2023) “Facilitating the transport and heating transition: strengthen carbon pricing, introduce a climate dividend, and reduce adaptation costs.” Available at: https://doi.org/10.18723/diw_dwr:2023-23-1.
Barrez, J. and Bachus, K. (2023) Public Acceptability of Carbon Pricing A Literature Review. Available at: https://hiva.kuleuven.be/en/research/theme/climateandsd/p/reports-environment/literature-report-public-acceptability-of-carbon.pdf (Accessed: February 13, 2026).
BloombergNEF (2025) EU ETS II Pricing Scenarios Balancing Cuts and Costs.
Bretschger, L. and Grieg, E. (2024) “Carbon taxes, CO2 emissions, and the economy: The effects of fuel taxation in the UK,” Energy Policy, 195, p. 114359. Available at: https://doi.org/10.1016/J.ENPOL.2024.114359.
Bruvoll, A. and Larsen, B.M. (2002) Greenhouse gas emissions in Norway Do carbon taxes work? Available at: http://www.ssb.no.
Canadian Energy Centre (2023) Assessing the Impact of the Carbon Tax on Business Costs in Various Industries in British Columbia (factsheet). Available at: https://www.canadianenergycentre.ca/wp-content/uploads/2023/08/CEC-Fact-Sheet-93-V2-Aug-17-2023.pdf (Accessed: November 25, 2025).
Climate Change Committee (2025a) Scotland’s Carbon Budgets. Available at: https://www.theccc.org.uk/publication/scotlands-carbon-budgets/ (Accessed: November 26, 2025).
Climate Change Committee (2025b) Scotland’s Carbon Budgets advice – Charts and data. Available at: https://view.officeapps.live.com/op/view.aspx?src=https%3A%2F%2Fwww.theccc.org.uk%2Fwp-content%2Fuploads%2F2025%2F05%2FCharts-and-figures-for-the-Scotland-Target-Advice.xlsx&wdOrigin=BROWSELINK (Accessed: January 15, 2026).
Committee on Climate Change (2019) Net Zero – The UK’s contribution to stopping global warming . Available at: https://www.theccc.org.uk/publication/net-zero-the-uks-contribution-to-stopping-global-warming/ (Accessed: January 21, 2026).
Department for Business, E.& I.S. (2020) The Future of UK Carbon Pricing Impact Assessment.
Department for Energy Security and Net Zero (2024) Fossil fuel price assumptions. Available at: https://www.gov.uk/government/collections/fossil-fuel-price-assumptions (Accessed: January 22, 2026).
Department for Energy Security and Net Zero (2025) National Energy Efficiency Data-Framework (NEED): consumption data tables 2025. Available at: https://www.gov.uk/government/statistics/national-energy-efficiency-data-framework-need-consumption-data-tables-2025 (Accessed: January 22, 2026).
Department for Transport (2023) Greenhouse gas emissions from transport by local authority. Available at: https://maps.dft.gov.uk/ghg-emissions-by-local-authority/index.html (Accessed: January 15, 2026).
Department for Transport (2024) TAG UNIT M2.1: Variable Demand Modelling. Available at: https://www.gov.uk/transport-analysis-guidance-tag (Accessed: December 1, 2025).
Deutsche Emissionshandelsstelle (2025) Understanding national emissions trading. Available at: https://www.dehst.de/EN/Topics/nEHS/understanding-nEHS/understanding-nehs_node.html#doc286158bodyText11 (Accessed: December 5, 2025).
Emissions Trading Authority at the German Environment Agency (2025) 2023 Emission Situation in National Emissions Trading System (nEHS). Available at: www.dehst.de/English.
European Commission (2021) Commission Staff Working Document, Impact Assessment Report, SWD(2021) 601 final.
European Commission (2025) Commission proposes targeted adjustments to the Market Stability Reserve Decision to support a smoother start for ETS2. Available at: https://climate.ec.europa.eu/news-other-reads/news/commission-proposes-targeted-adjustments-market-stability-reserve-decision-support-smoother-start-2025-11-27_en (Accessed: December 3, 2025).
European Commission (no date) ETS2: buildings, road transport and additional sectors. Available at: https://climate.ec.europa.eu/eu-action/carbon-markets/ets2-buildings-road-transport-and-additional-sectors_en (Accessed: January 21, 2026).
European Environmental Bureau (2022) Lessons from the German Emissions Trading System for buildings and road transport.
Fæhn, Karlsen and Kaushal (2024) “Norwegian abatement targets for 2035 : a CGE analysis.” Available at: https://savearchive.zbw.eu/termsofuse (Accessed: December 11, 2025).
Fairbrother, M. and Rhodes, E. (2023) “Climate policy in British Columbia: An unexpected journey,” Frontiers in Climate, 4, p. 1043672. Available at: https://doi.org/10.3389/FCLIM.2022.1043672/BIBTEX.
Fazekas, D. et al. (2021) Exploring the trade-offs in different paths to reduce transport and heating emissions in Europe. Available at: www.camecon.com (Accessed: November 26, 2025).
Federal government of Germany (2024) Second report by the Federal Government on its experiences with the Fuel Emissions Trading Act and Report by the Federal Government with a proposal for the transition from national to European fuel emissions trading. Available at: https://dserver.bundestag.de/btd/20/144/2014488.pdf (Accessed: November 25, 2025).
Germanwatch (2025) New Emissions Trading System under Fire. Available at: https://www.germanwatch.org/en/blog/new-emissions-trading-system-under-fire (Accessed: December 5, 2025).
GIZ and UNDP (2019) Scaling up ambition: lessons from British Columbia’s carbon tax. Available at: https://ndcpartnership.org/knowledge-portal/good-practice-database/scaling-ambition-lessons-british-columbias-carbon-tax (Accessed: November 25, 2025).
Government of Canada (2025) Removing the consumer carbon price, effective April 1, 2025 – Canada.ca. Available at: https://www.canada.ca/en/department-finance/news/2025/03/removing-the-consumer-carbon-price-effective-april-1-2025.html (Accessed: January 13, 2026).
Government Offices of Sweden (2025) Sweden’s carbon tax. Available at: https://www.government.se/government-policy/taxes-and-tariffs/swedens-carbon-tax/ (Accessed: January 5, 2026).
Günther, C. et al. (2024) “Carbon prices on the rise? Shedding light on the emerging second EU Emissions Trading System (EU ETS 2),” SSRN Electronic Journal [Preprint]. Available at: https://doi.org/10.2139/SSRN.4808605.
Hawkey, D. (2024) Political leaders in Scotland must be bold on climate and tax | IPPR. Available at: https://www.ippr.org/articles/political-leaders-in-scotland-must-be-bold-on-climate-and-tax (Accessed: December 11, 2025).
HM Treasury (2025) Budget 2025 speech. Available at: https://www.gov.uk/government/speeches/budget-2025-speech (Accessed: January 5, 2026).
International Carbon Action Partnership (2025a) Austrian National Emissions Certificate Trading System. Available at: https://icapcarbonaction.com/en/ets/austrian-national-emissions-certificate-trading-system (Accessed: December 5, 2025).
International Carbon Action Partnership (2025b) German National Emissions Trading System.
International Carbon Action Partnership (2025c) UK Emissions Trading Scheme. Available at: https://icapcarbonaction.com/en/ets/uk-emissions-trading-scheme (Accessed: December 5, 2025).
International Carbon Action Partnership (2026) EU reaches agreement on 2040 climate target, postpones ETS 2 by one year . Available at: https://icapcarbonaction.com/en/news/eu-reaches-agreement-2040-climate-target-postpones-ets-2-one-year (Accessed: January 22, 2026).
International Energy Agency (2022) Executive Summary – The Future of Heat Pumps. Available at: https://www.iea.org/reports/the-future-of-heat-pumps/executive-summary (Accessed: January 21, 2026).
Kettner, C. et al. (2024) Investigating Equity and Efficiency in Carbon Pricing with Revenue Recycling: A Combined Macro- and Micro-modelling Approach. Available at: https://www.wifo.ac.at/publication/pid/53174084.
Knaggård, Å. and Hildingsson, R. (2025) “The adoption of the Swedish carbon tax: Influences and interactions across multiple political levels, jurisdictions, and policy areas,” Policy Studies Journal, 53(2), pp. 414–435. Available at: https://doi.org/10.1111/psj.70011.
Kohlscheen, E., Moessner, R. and Takáts, E. (2021) Effects of Carbon Pricing and Other Climate Policies on CO2 Emissions. Available at: https://www.ifo.de/DocDL/cesifo1_wp9347.pdf (Accessed: November 26, 2025).
Lindvall, D. et al. (2024) “The Role of Fairness for Accepting Stricter Carbon Taxes in Sweden,” Climate, 12(11). Available at: https://doi.org/10.3390/cli12110170.
Love, J. et al. (2017) “The addition of heat pump electricity load profiles to GB electricity demand: Evidence from a heat pump field trial,” Applied Energy, 204, pp. 332–342.
Ma, W. (2023) “A Comparative Study of Carbon Pricing Policies in China and the Scandinavian Countries: Lessons for Effective Climate Change Mitigation with a Focus on Sweden,” E3S Web of Conferences. EDP Sciences. Available at: https://doi.org/10.1051/e3sconf/202342404005.
Marcantonini, C. et al. (2017) The EU ETS and its Interactions with other Climate and Energy Policies. Available at: http://lifesideproject.eu/event/eu-ets-and-its-interaction- (Accessed: November 26, 2025).
Maria D’arcangelo, F. et al. (2022) Estimating the CO2 emission and revenue effects of carbon pricing: New evidence from a large cross-country dataset. Available at: https://doi.org/10.1787/39aa16d4-en.
Martinsson, G. et al. (2024) “The Effect of Carbon Pricing on Firm Emissions: Evidence from the Swedish CO2 Tax,” Review of Financial Studies, 37(6), pp. 1848–1886. Available at: https://doi.org/10.1093/rfs/hhad097.
Mildenberger, M. et al. (2022) “Limited impacts of carbon tax rebate programmes on public support for carbon pricing,” Nature Climate Change, 12(2), pp. 141–147. Available at: https://doi.org/10.1038/s41558-021-01268-3.
Ministry of Finance, S. (2023) Carbon Taxation in Sweden. Available at: https://www.government.se/contentassets/419eb2cafa93423c891c09cb9914801b/230323-carbon-tax-sweden—general-info.pdf (Accessed: November 25, 2025).
Murray, B. and Rivers, N. (2015) “British Columbia’s revenue-neutral carbon tax: A review of the latest ‘grand experiment’ in environmental policy,” Energy Policy, 86, pp. 674–683. Available at: https://doi.org/10.1016/J.ENPOL.2015.08.011.
Nordbrandt, M. et al. (2025) “Combating climate change through the welfare state: can social insurance boost support for carbon taxes in Europe?,” Journal of European Public Policy, 32(1), pp. 81–103. Available at: https://doi.org/10.1080/13501763.2023.2294146.
Norwegian Ministry of Climate and Environment (2022) Norway’s Climate Action Plan for 2021-2030 Norwegian Ministry of Climate and Environment. Available at: https://www.regjeringen.no/contentassets/a78ecf5ad2344fa5ae4a394412ef8975/en-gb/pdfs/stm202020210013000engpdfs.pdf (Accessed: November 25, 2025).
Norwegian Ministry of the Environment (2005) “Norway’s Report on Demonstrable Progress under the Kyoto Protocol Status report as of December 2005.”
Office for Budget Responsibility (2023) How gas demand and supply have responded to higher gas prices. Available at: https://obr.uk/box/how-gas-demand-and-supply-have-responded-to-higher-gas-prices/ (Accessed: December 1, 2025).
Ohlendorf, N. et al. (2021) “Distributional Impacts of Carbon Pricing: A Meta-Analysis,” Environmental and Resource Economics, 78(1), pp. 1–42. Available at: https://doi.org/10.1007/S10640-020-00521-1/TABLES/8.
Pretis, F. (2022) “Does a Carbon Tax Reduce CO2 Emissions? Evidence from British Columbia,” Environmental and Resource Economics, 83(1), pp. 115–144. Available at: https://doi.org/10.1007/s10640-022-00679-w.
Raiser, K. and Rault, A. (2025a) Packaging and sequencing policies for more effective climate action. Available at: https://www.oecd.org/en/about/programmes/net-zero-building-climate-and-economic-resilience.html (Accessed: November 26, 2025).
Raiser, K. and Rault, A. (2025b) Packaging and sequencing policies for more effective climate action. Available at: https://www.oecd.org/en/about/programmes/net-zero-building-climate-and-economic-resilience.html (Accessed: November 26, 2025).
Romm, J., Lezak, S. and Alshamsi, A. (2025) “Are Carbon Offsets Fixable?,” Annual Review of Environment and Resources, 50(1), pp. 649–680. Available at: https://doi.org/10.1146/ANNUREV-ENVIRON-112823-064813/CITE/REFWORKS.
Scottish Government (2021) Heat in Buildings Strategy. Available at: https://www.gov.scot/binaries/content/documents/govscot/publications/strategy-plan/2021/10/heat-buildings-strategy-achieving-net-zero-emissions-scotlands-buildings/documents/heat-buildings-strategy-achieving-net-zero-emissions-scotlands-buildings/heat-buildings-strategy-achieving-net-zero-emissions-scotlands-buildings/govscot%3Adocument/heat-buildings-strategy-achieving-net-zero-emissions-scotlands-buildings.pdf (Accessed: November 26, 2025).
Scottish Government (2022) Home energy and fuel poverty. Available at: https://www.gov.scot/policies/home-energy-and-fuel-poverty/energy-saving-home-improvements/ (Accessed: January 8, 2026).
Scottish Government (2023) Cost of Living Bill – Key Statistics, Director-General Communities. Available at: https://www.gov.scot/publications/cost-living-bill-key-statistics/ (Accessed: December 23, 2025).
Scottish Government (2025a) Scotland’s Climate Change Plan – 2026-2040. Available at: https://www.gov.scot/publications/scotlands-climate-change-plan-2026-2040/ (Accessed: November 26, 2025).
Scottish Government (2025b) Scottish Greenhouse Gas Statistics 2023, Statistics.
Scottish Government (2025c) Scottish House Condition Survey: 2023 Key Findings. Available at: https://www.gov.scot/publications/scottish-house-condition-survey-2023-key-findings/pages/1-key-attributes-of-the-scottish-housing-stock/ (Accessed: December 3, 2025).
Scottish Government (2025d) Supporting data – Poverty and Income Inequality in Scotland National Statistics report. Available at: https://view.officeapps.live.com/op/view.aspx?src=https%3A%2F%2Fdata.gov.scot%2Fpoverty%2Fxls%2Fdata2025.xlsx&wdOrigin=BROWSELINK (Accessed: December 11, 2025).
Scottish Government (no date a) Home Energy Scotland grant and loan, 2024. Available at: https://www.mygov.scot/energy-saving-funding/home-energy-scotland-grant-and-loan (Accessed: December 23, 2025).
Scottish Government (no date b) Scottish economic insights: October 2024 – Recent Labour Market Trends, 2024. Available at: https://www.gov.scot/publications/scottish-economic-insights-october-2024/pages/4/ (Accessed: January 12, 2026).
Scottish Parliament (2019) Fuel Poverty (Targets, Definition and Strategy) (Scotland) Act 2019. Available at: https://www.legislation.gov.uk/asp/2019/10 (Accessed: January 12, 2026).
Scottish Parliament (2025) Draft Buildings (Heating and Energy Performance) and Heat Networks (Scotland) Bill.
Scottish Parliament Cross Party Group on Sustainable Transport (2025) “MIND THE GAP: TACKLING TRANSPORT INEQUALITIES IN SCOTLAND.”
Sileci, L. (2023) “Carbon pricing with regressive co-benefits: evidence from British Columbia’s carbon tax.” Available at: https://www.lse.ac.uk/granthaminstitute/wp-content/uploads/2023/11/working-paper-405_Sileci.pdf (Accessed: January 15, 2026).
Sloan, B. et al. (2024) “International evidence on fiscal levers to deliver reductions in greenhouse gas emissions.” Available at: https://doi.org/10.7488/era/4033.
Statistik Databasen (2025) Environmental taxes by industry SNI 2007. Year 2008 – 2023. PxWeb. Available at: https://www.statistikdatabasen.scb.se/pxweb/sv/ssd/START__MI__MI1301__MI1301E/MiljoSkattSNI07Niv/ (Accessed: December 5, 2025).
Stavins, R.N. (2022) “The Relative Merits of Carbon Pricing Instruments: Taxes versus Trading,” Review of Environmental Economics and Policy, 16(1), pp. 62–82. Available at: https://doi.org/10.1086/717773.
Streicher, G., Kettner, C. and Schratzenstaller, M. (2025) “Analysis of the Regional Impacts of the Austrian Carbon Price.” Available at: https://ssrn.com/abstract=5116990.
Sturge, D. et al. (2024a) Extending the UK Emissions Trading Scheme to heating and road transport fuels: What role can it play in decarbonising the UK economy? .
Sturge, D. et al. (2024b) Extending the UK Emissions Trading Scheme to heating and road transport fuels: What role can it play in decarbonising the UK economy? .
Thomson, S. et al. (2023) “Rural and Islands Report: 2023 – An Insights Report.” Available at: https://doi.org/10.58073/SRUC.23807703.V1.
Transport & Environment (2025) How to turn the ETS2 implementation into a success. Available at: www.transportenvironment.org (Accessed: December 23, 2025).
Transport Scotland (2023) The Vehicle Emissions Trading Schemes Order 2023. Available at: https://www.transport.gov.scot/publication/partial-island-communities-impact-assessment-the-vehicle-emissions-trading-schemes-order-2023/background/ (Accessed: January 8, 2026).
UK Government (2016) Climate Change Levy rates. Available at: https://www.gov.uk/guidance/climate-change-levy-rates (Accessed: February 13, 2026).
UK Government (2022) Environmental principles policy statement. Available at: https://www.gov.uk/government/publications/environmental-principles-policy-statement/environmental-principles-policy-statement (Accessed: February 12, 2026).
UK Government (2025a) Average domestic gas bills by countries in Great Britain. Available at: https://view.officeapps.live.com/op/view.aspx?src=https%3A%2F%2Fassets.publishing.service.gov.uk%2Fmedia%2F6942b6c79273c48f554cf51b%2Ftable_232.xlsx&wdOrigin=BROWSELINK (Accessed: December 23, 2025).
UK Government (2025b) Phasing out the sale of new petrol and diesel cars from 2030 and support for zero emission vehicle (ZEV) transition. Available at: https://www.gov.uk/government/speeches/phasing-out-the-sale-of-new-petrol-and-diesel-cars-from-2030-and-support-for-zero-emission-vehicle-zev-transition (Accessed: December 5, 2025).
Winter, J. (2024) “Exploring the Landscape of Canadian Climate Policy,” Canadian Public Policy, 50, pp. 73–102. Available at: https://doi.org/10.3138/cpp.2023-055.
Winter, J., Dolter, B. and Fellows, G.K. (2023) “Carbon Pricing Costs for Households and the Progressivity of Revenue Recycling Options in Canada,” Canadian Public Policy, 49(1), pp. 13–45. Available at: https://doi.org/10.3138/cpp.2022-036.
World Bank (2020) Distributional impacts of carbon pricing on households. Available at: www.carbonpricingleadership.org (Accessed: November 26, 2025).
World Bank (2023) “State and Trends of Carbon Pricing 2023,” State and Trends of Carbon Pricing 2023 [Preprint]. Available at: https://doi.org/10.1596/39796.
World Bank (2025) State and Trends of Carbon Pricing Dashboard. Available at: https://carbonpricingdashboard.worldbank.org/compliance/price (Accessed: December 5, 2025).
World Bank Group (2025) What is Carbon Pricing? Available at: https://carbonpricingdashboard.worldbank.org/what-carbon-pricing (Accessed: November 26, 2025).
Yu, Y. (2024) “Carbon Taxes and CO2Emissions: A Replication of Andersson (American Economic Journal: Economic Policy, 2019),” Economics. Walter de Gruyter GmbH. Available at: https://doi.org/10.1515/econ-2022-0109.
Appendices
Appendix A Additional methodological details
Main investment model
The model is initiated through a baseline scenario, which accounts for the impact of existing policies on consumption behaviour. Our baseline scenario is based on cost inputs from the 7th Carbon Budget (7CB), with results initially calibrated to the 7CB Balanced Pathway emissions trajectories for the first five years out to 2030 (including starting levels). This decision was justified by the fact that the 7CB provides the best holistic picture of how domestic energy and climate policy are likely to evolve under the UK and Scotland’s net zero commitments in the short term (to 2030). After 2030, we model continued emissions reductions driven by the uptake of EVs and heat pumps, assuming that these technologies are taken up when fossil technologies are retired, and if the cost of the alternative makes economic sense to the consumer, constrained by “affordability factors” which we set based on income (see “Detailed modelling assumptions” below).
The current and future policies included in our baseline scenario, which result in an emissions reduction trajectory aligned with the 7CB Balance Pathway, are the New Build Heat Standard, a phase-out of new gas boiler installations in Scotland by 2035, no new sales of internal combustion vehicles from 2030, minimum efficiency standard targets for domestic buildings, and fuel efficiency standards for internal combustion vehicles. The Scottish Government’s current heat pump subsidy (£7,500 per unit) is also modelled, and assumed to taper off at a rate of £500/year from 2029 (the end of the UK Boiler Upgrade Scheme), which under future heat pump cost reductions slowly exposes the consumer to more of the total cost of deployment. These policies are all included in the carbon pricing scenarios as well, meaning that they model an additional carbon price signal on top of the existing policy context.
In the carbon tax scenarios, the carbon price is completely exogenous, i.e., it is pre-set and is not an output of the modelling calculations itself. In the ETS scenarios, the carbon price is the price of ETS allowances that must be purchased by fuel suppliers to cover emissions from the combustion of transport and heating fuels which they sell. This price is a function of allowance supply (the number of allowances available to buy in a year, which is capped and declines each year), and demand (the emissions from combusting transport and building heating fuels, that year). The difference between supply and demand acts as an “allowance scarcity”, which affects the carbon price (the higher the allowance scarcity, the higher the carbon price). The carbon price in a given year is determined based on the marginal abatement cost given the allowance scarcity, and the historic carbon price (see next section).
Consumption responses are assumed to vary by archetype (see Section 4.1), with differences primarily driven by differentiated price elasticity of demand and the average annual fuel demand. The price elasticity of demand is set at -0.1 for building heating (Office for Budget Responsibility, 2023). This figure refers to natural gas consumption, which makes up most Scotland’s heating fuel consumption (Scottish Government, 2025c). A demand elasticity of -0.1 means that a doubling of the price will result in a 10% reduction in demand.
The price elasticity of demand is set at -0.25 for transport (Department for Transport, 2024). After consultation with the project Steering Group (SG) we have assumed that the price elasticity of demand for transport varies by income level (-0.15 – -0.35 from high to low income deciles, respectively, with linear interpolation). Demand elasticity of -0.25 means that a doubling of liquid transport fuel prices will result in a 25% reduction in demand.
Features of the four carbon pricing scenarios are shown in Table 4 and Table 5. Carbon taxes are assumed to start in 2027, and ETS schemes in 2028 (this was necessary to avoid circularity in the model). In the ETS scenarios, the supply of allowances is set at the start of the scheme as the projected annual emissions for Scotland’s transport and building sectors, decreasing year-on-year by a reduction factor increasing from 5.38% in 2028 to 10% in 2045. We assume that all allowances are auctioned with no free allocation, and a Market Stability Reserve (MSR) is simulated to address issues of over- or under-supply of allowances in the market. This is done by withdrawing allowances from the market and releasing them from the MSR, respectively, based on the total number of allowances in circulation (TNAC – the number of allowances remaining unclaimed in the market after all emissions have been covered) being above or below, respectively, a pre-set threshold (see Table 5). In the ETS scenario with a price cap, the MSR is also triggered to release allowances if the allowance price exceeds £50/tCO2 (equivalent to the EU ETS2 soft price cap level after accounting for inflation). Withdrawal and release from the MSR are assumed to occur in the year following over- or under-supply or of price exceedance, and only one rule can be triggered at a time.
Carbon tax scenario | Starting rate | Final rate | Increase to final rate | Rate of increase |
|---|---|---|---|---|
Low tax rate | £10/ tCO2 | £25/tCO2 | Over 3 years | Linear |
High tax rate | £25/tCO2 | £75/tCO2 | Over 5 years | Linear |
ETS scenario | Market Stability Reserve withdrawal rules | Market Stability Reserve release rules (quantity-based) | Market Stability Reserve release rules (price-based) |
|---|---|---|---|
With price cap | If TNAC > 40% of allowance cap, withdraw 18% of TNAC into the MSR, increasing to 30% if TNAC >=100% of allowance cap | If TNAC <15% of allowance cap, release 5% of MSR allowances, increasing to 10% if TNAC <10% of allowance cap | If carbon price exceeds a certain level, release 5% of MSR, rising to 10% if the price reaches £100/tCO2. The trigger level is set to £50/tCO2 in 2027, increasing by £5/year |
Without price cap | No price rule |
Simulation of the ETS module
The carbon price in the ETS scenarios is simulated through an ETS “module”, linked to the main investment model. Two scenarios are modelled: one with a price cap and one without. For the scenario with the price cap, we set the price cap at £50/tCO2 at the start of the scheme, increasing year on year to reflect increasing decarbonisation ambition. As it is a soft price cap, there is no hard limit on the ETS price – rather, when the ETS price exceeds the cap, the supply of allowances is increased (see below).
The basic logic of the ETS module is that the allowance scarcity (i.e., the difference between the annual allowance cap and the actual emissions generated under the scenario) drives a carbon price on the heating and transport sectors. This carbon price feeds into the main investment model, generating behaviour change and emissions reductions. The updated yearly emissions are then fed back into the ETS module, changing the allowance scarcity and thus the supply of allowances via behaviour of the Market Stability Reserve (see below). The carbon price triggers behaviour change starting from 2028, even though the scheme is simulated to start in 2027. This was necessary to avoid circularity in the investment model.
The supply of allowances (or allowance cap) is pre-set for 2025 at the level of surface transport and building emissions projected by the CCC in its 7th Carbon Budget (Climate Change Committee, 2025b). At the start of the project, the supply was set based on historic average emissions of these sectors, but this made the initial market much too tight and drove the early-year carbon prices very high. As this would not be expected in an ETS, a more generous allowance supply was set as the starting value for 2025. The same value was used for 2026, following which a linear reduction factor (LRF), increasing from 5.38%/year in 2027 to 10% by 2045. This LRF is quite high compared to that used in the EU ETS2 (5.38%) but at lower values the market becomes very “loose” because emissions reduce rapidly even under the baseline scenarios. The allowance supply is rebased in 2030, 2035, and 2040 by calibrating it to the actual emissions generated under the ETS scenarios for the same years, to ensure the cap is tracking actual emissions reductions.
The supply of allowances is influenced by a simulated Market Stabilisation Mechanism (MSR), mimicking that designed for the EU ETS2. The MSR withdraws and releases allowances based on specific trigger rules (see Table 5): quantity-based withdrawal and release trigger rules, related to the Total Number of Allowances in Circulation (TNAC, a measure of market liquidity) and price-based release trigger rules, related the carbon price (in the price-capped scenario). Only one trigger rule can be applied at a time. The MSR behaviour thus affects the allowance supply and resulting allowance scarcity. The MSR is triggered in year+1, i.e., the TNAC of the previous year is evaluated and the MSR is triggered subsequently to rebalance the market. This may happen multiple times per year in an actual ETS, but could not be simulated in our simple model.
The allowance scarcity (i.e., the difference between the annual allowance cap and the actual emissions generated under the scenario) would in theory lead to the lowest marginal abatement needed to close the allowance scarcity setting the carbon price. Marginal abatement costs are calculated at an archetype level for each year by evaluating the additional costs associated with the relevant low-carbon technology (including both capital and operating expenditures) and dividing it by the lifetime emissions savings from switching from the fossil to clean technology. Given that we only model one technology per sector (heat pumps for buildings and EVs for transport), the abatement costs decrease as technology costs decline and in some of the commercial archetypes are very low due to the modelling of a “representative” building or goods vehicle. As such, instead of translating the minimum marginal abatement cost to meet the required allowance scarcity, we calculate the median marginal abatement cost and combine it with a “market tightness” factor (see below).
The ultimate carbon (allowance) price is made up of the marginal abatement cost, combined with the historic (previous year’s) carbon price. The relative contribution of the marginal abatement cost and historic carbon price is driven by the allowance scarcity through a “market tightness” parameter. When the market is tight (i.e., low amount of surplus allowances available), the carbon price tends towards the marginal abatement cost, as consumers will be forced to decarbonise. Conversely, when the market is loose the carbon price will be more driven by previous year values, as the market will track historic price trends in the absence of allowance scarcity to drive decarbonisation. To generate an increasing carbon price trajectory, in line with expectations from literature, the contribution of the marginal abatement cost was set at a lower value at the start of the scheme, assuming to account for the phase-in of the scheme and eventual association exemptions. By 2035, both the marginal abatement cost and historic price are fully contributing to the carbon price, with relative contributions set by market tightness at the time. A carbon price floor is set, equivalent to the Auction Reserve Price (ARP) in the UK ETS (£28 in 2026, increasing with inflation to reach £49.1 in 2045).
The carbon prices generated under the two ETS scenarios are shown below. The carbon prices are much more volatile in the capped ETS scenario, which is unintuitive. This is due to the behaviour of the MSR. As carbon prices are above our soft price cap early in the ETS scenarios, the MSR is constantly triggered to release, flooding the market with allowances and subsequently being triggered to withdraw allowances to keep the market reasonably tight. This shows that the price cap is designed to keep the scheme affordable, not necessarily stable (this is a wider remit of the MSR).
Detailed modelling assumptions
In addition to the assumptions presented in the main text, key assumptions used to implement the model in Excel are the following:
- Consumer-related assumptions: Consumers act as rational economic agents when taking investment decisions, with archetypes reflecting the average activity of consumers and subsectors and income deciles assumed to remain constant. Investments are constrained by “affordability factors”, artificially set ranging from 0.5 – 1.5 across income ranges to progressively constrain affordability across decreasing income deciles due to the absence of suitable data to construct these affordability factors. Affordability concerns are also reflected in the discount rates used for evaluation of the net present value (NPV) of alternative technologies, which range from 2-38% for domestic consumers also in line with income ranges. Behavioural factors influencing technology uptake are not modelled.
- Technology-related assumptions: Technologies were assumed to be available up to the limit of desired consumer investments, with S-curve deployments modelled based on the relative costs of fossil and clean technologies. Technologies were assumed to be taken up at the end of life of their predecessors (e.g. heat pumps replace gas boilers at the end of life of the gas boiler). Due to the scope of the modelling and analysis, second-hand markets for vehicles were not modelled and simplified cost curves were used for new technologies (not reflecting the range of possible technology models).
- Carbon pricing and policy assumptions: Electricity prices and consumption were assumed to not be covered by carbon pricing or emissions trading schemes, given that the existing UK ETS covers power generation, with carbon pricing modelled at an annual value. Banking or re-sale of allowances under ETS scenarios is not permitted. Revenue recycling effects were not modelled due to complexity, though are discussed in Section 4.5.2. Only CO2 emissions are priced, and non-CO2 emissions are not considered (as they were assumed to be negligible in the target sectors). Future changes in policy and regulatory support for low-carbon technologies were not modelled apart from a halt in the sale of new gas boilers from 2035, which may produce conservative estimates for technology rollout compared to other modelling results (e.g., the 7th Carbon Budget), and a gradual phase out of the £7,500 grant for heat pumps and other low-carbon domestic heat (which is assumed to fall by £500 p.a. from 2029. This is the end date of England and Wales’ current Boiler Upgrade Scheme).
The ETS scenarios are based on several distinct assumptions, outlined below:
- The TNAC in the first year of operation of the ETS is assumed to be equal to the allowance surplus (i.e., allowance cap minus emissions) as there is no MSR adjustment until the second year of operation.
- The price threshold increases with time, in contrast to the EU ETS2 design where it is set at a fixed value; this was introduced as the carbon price regularly exceeds the originally-designed price cap of £50/tCO2. Under this increase, the price trigger level reaches £140 in 2025.
- The MSR trigger rules are more stringent than those in the EU ETS2 (withdrawal of 18%-30% of allowances rather than 12%-24%, release only when TNAC is less than 15% of allowance cap rather than 20%).
- The market tightness parameter is calculated based on the assumption that a very loose market is one where TNAC is more than 80% of the allowance cap, and a very tight one is where TNAC is less than 10% of allowance cap.
Model limitations
The simplicity of the investment model is intentional, given the complexity of cross sector scenario modelling, which imposes a limit on how realistic the simulated effects of carbon pricing are. It is intended as a starting point to assess the order of magnitude of potential impact of a carbon pricing system which future studies can build on. This also applies to simulation of wider economic and market factors. For example, changes in future fossil fuel prices beyond the DESNZ fossil fuel price assumptions are not accounted for, including the effect of future supply-side shocks.
The assumptions outlined above also introduce several limitations. Most prominently, excluding the early retirement of conventional fossil technologies means that the uptake of new technologies modelled in this study may be relatively conservative. The complexity of ETS schemes also means that the carbon price trajectory in an implemented scheme may unfold quite differently than in the modelling. We do not model the effects of revenue recycling on technology uptake and the subsequent emissions abatement.
Second-order effects of accelerated uptake on technology capital costs are not included, and policy interactions between carbon pricing and other policies are not modelled due to the inherent complexity. Policy interventions that affect the cost of fuel and electricity for specific income deciles and consumer groups were not included, due to data challenges. Our simple model also does not account for non-price barriers and non-economic factors, such as availability of financing, energy literacy, the “hassle factor” and access to quality equipment and installers, which can be a substantial barrier for low-income groups.
It should be noted that our model does not include minimum acceptable fuel consumption limits, thus an increasing carbon price would cause consumption to decrease ad infinitum. This is a theoretical result due to the simple nature of our model. In practice, consumers are likely to change their investment behaviour if further reducing their fuel consumption becomes unsustainable for their quality of life.
Appendix B Full list of model data sources
The data sources used in the investment model are outlined in Table 6 and Table 7.
Sector | Variable(s) | Data source |
|---|---|---|
Transport (personal & commercial) | Capital costs and operating costs | |
Heating (domestic & commercial) | ||
Transport (personal & commercial) | Petrol prices | DESNZ Fossil fuel price assumptions 2024, Scenario B |
Heating (commercial) | Natural gas prices | DESNZ Fossil fuel price assumptions 2024, Scenario B |
Heating (domestic) | Natural gas prices | |
Heating (domestic & commercial), Transport (personal) | Electricity prices | |
Transport (commercial) | Electricity prices |
Sector | Variable(s) | Data source |
|---|---|---|
All | Population growth | |
All | GDP growth | |
Transport (personal & commercial) | Stock of domestic vehicles and commercial vehicles | |
Transport (commercial) | Commercial vehicle kms | |
Heating (domestic) | Number of dwellings and household income deciles | |
Heating (domestic) | Existing heating fuel type | |
Heating (domestic) | Average electricity & gas consumption by income decile | |
Heating (commercial) | Total consumption |
Archetype (income decile) | Income range |
|---|---|
I1 | Less than £15,000 |
I2 | £15,000 – £19,999 |
I3 | £20,000 – £29,999 |
I4 | £30,000 – £39,999 |
I5 | £40,000 – £49,999 |
I6 | £50,000 – £59,999 |
I7 | £60,000 – £69,999 |
I8 | £70,000 – £99,999 |
I9 | £100,000 – £149,999 |
I10 | £150,000 or more |
Appendix C: Detailed modelling results
Modelling results
Scenario | Carbon tax £25 | Carbon tax £75 | ETS with price cap | ETS without price cap |
|---|---|---|---|---|
2027 | 10 | 25 | – | – |
2028 | 15 | 50 | 62.38 | 62.38 |
2029 | 20 | 62.5 | 70.92 | 71.18 |
2030 | 25 | 75 | 76.32 | 78.54 |
2031 | 25 | 75 | 79.82 | 85.33 |
2032 | 25 | 75 | 80.32 | 90.07 |
2033 | 25 | 75 | 80.76 | 95.77 |
2034 | 25 | 75 | 79.16 | 100.32 |
2035 | 25 | 75 | 99.82 | 103.45 |
2036 | 25 | 75 | 96.81 | 100.61 |
2037 | 25 | 75 | 84.66 | 94.90 |
2038 | 25 | 75 | 38.76 | 91.84 |
2039 | 25 | 75 | 102.64 | 112.88 |
2040 | 25 | 75 | 99.47 | 114.44 |
2041 | 25 | 75 | 95.80 | 112.36 |
2042 | 25 | 75 | 116.12 | 109.07 |
System and consumer costs
Social and distributional costs
Scenario | Sector | 2030 | 2035 | 2040 | 2045 | Yearly average |
|---|---|---|---|---|---|---|
Carbon tax £75 (100%) | Heating | 116.40 | 117.74 | 118.11 | 118.49 | 104.77 |
Carbon tax £75 (100%) | Transport | 76.83 | 75.27 | 74.05 | 74.05 | 67.09 |
Carbon tax £75 (50%) | Heating | 58.47 | 59.18 | 59.38 | 59.58 | 52.65 |
Carbon tax £75 (50%) | Transport | 38.68 | 37.88 | 37.24 | 37.24 | 33.75 |
Carbon tax £25 (100%) | Heating | 39.05 | 39.53 | 39.66 | 39.80 | 35.10 |
Carbon tax £25 (100%) | Transport | 25.85 | 25.31 | 24.88 | 24.88 | 22.51 |
Carbon tax £25 (50%) | Heating | 19.56 | 19.80 | 19.87 | 19.94 | 17.58 |
Carbon tax £25 (50%) | Transport | 12.96 | 12.68 | 12.46 | 12.46 | 11.28 |
ETS with cap (100%) | Heating | 123.63 | 55.99 | 65.07 | 75.61 | 64.04 |
ETS with cap (100%) | Transport | 81.58 | 35.84 | 40.81 | 47.26 | 41.17 |
ETS with cap (50%) | Heating | 62.12 | 28.07 | 32.64 | 37.95 | 32.89 |
ETS with cap (50%) | Transport | 41.09 | 17.97 | 20.47 | 23.72 | 21.18 |
ETS without cap (100%) | Heating | 72.48 | 79.59 | 58.45 | 70.83 | 60.44 |
ETS without cap (100%) | Transport | 50.65 | 53.93 | 38.89 | 46.97 | 41.02 |
ETS without cap (50%) | Heating | 40.44 | 44.07 | 32.64 | 39.46 | 33.61 |
ETS without cap (50%) | Transport | 26.77 | 28.21 | 20.47 | 24.67 | 21.54 |
Scenario | 2030 | 2035 | 2040 | 2045 | ||||
|---|---|---|---|---|---|---|---|---|
Lowest-income | Highest-income | Lowest-income | Highest-income | Lowest-income | Highest-income | Lowest-income | Highest-income | |
Carbon tax £75 (100%) | 1.4 | 0.2 | 1.5 | 0.2 | 1.5 | 0.2 | 1.5 | 0.2 |
Carbon tax £75 (50%) | 0.7 | 0.1 | 0.7 | 0.1 | 0.7 | 0.1 | 0.7 | 0.1 |
Carbon tax £25 (100%) | 0.5 | 0.1 | 0.5 | 0.1 | 0.5 | 0.1 | 0.5 | 0.1 |
Carbon tax £25 (50%) | 0.2 | 0.0 | 0.2 | 0.0 | 0.2 | 0.0 | 0.2 | 0.0 |
ETS with cap (100%) | 1.5 | 0.2 | 0.7 | 0.1 | 0.8 | 0.1 | 0.9 | 0.1 |
ETS with cap (50%) | 0.8 | 0.1 | 0.3 | 0.1 | 0.4 | 0.1 | 0.5 | 0.1 |
ETS without cap (100%) | 1.0 | 0.2 | 1.1 | 0.2 | 0.8 | 0.1 | 1.0 | 0.1 |
ETS without cap (50%) | 0.5 | 0.1 | 0.5 | 0.1 | 0.4 | 0.1 | 0.5 | 0.1 |
Scenario | 2030 | 2035 | 2040 | 2045 | ||||
|---|---|---|---|---|---|---|---|---|
Lowest-income | Highest-income | Lowest-income | Highest-income | Lowest-income | Highest-income | Lowest-income | Highest-income | |
Carbon tax £75 (100%) | 0.2 | 0.1 | 0.3 | 0.2 | 0.3 | 0.2 | 0.3 | 0.2 |
Carbon tax £75 (50%) | 0.1 | 0.1 | 0.1 | 0.1 | 0.1 | 0.1 | 0.1 | 0.1 |
Carbon tax £25 (100%) | 0.1 | 0.1 | 0.1 | 0.1 | 0.1 | 0.1 | 0.1 | 0.1 |
Carbon tax £25 (50%) | 0.0 | 0.0 | 0.0 | 0.0 | 0.0 | 0.0 | 0.0 | 0.0 |
ETS with cap (100%) | 0.3 | 0.2 | 0.1 | 0.1 | 0.1 | 0.1 | 0.2 | 0.1 |
ETS with cap (50%) | 0.2 | 0.1 | 0.1 | 0.0 | 0.1 | 0.0 | 0.1 | 0.1 |
ETS without cap (100%) | 0.2 | 0.1 | 0.2 | 0.1 | 0.1 | 0.1 | 0.2 | 0.1 |
ETS without cap (50%) | 0.1 | 0.1 | 0.1 | 0.1 | 0.1 | 0.0 | 0.1 | 0.1 |
Scenario | Average annual government revenue (million £) | Total government revenue (2027-2045) (billion £) |
|---|---|---|
Carbon Tax 75 (100%) | 527.79 | 10.03 |
Carbon Tax 75 (50%) | 545.45 | 10.36 |
Carbon Tax 25 (100%) | 183.61 | 3.49 |
Carbon Tax 25 (50%) | 185.95 | 3.53 |
ETS price cap (100%) | 333.51 | 6.34 |
ETS price cap (50%) | 350.78 | 6.66 |
ETS no cap (100%) | 333.09 | 6.33 |
ETS no cap (50%) | 339.52 | 6.45 |
Appendix D Information on carbon pricing schemes
Jurisdiction and instrument | Carbon price/fuel price | Cited impact | Source |
|---|---|---|---|
Global | $10/tCO2 increase in carbon tax rate | -1.3% (short-run economy-wide CO2 emissions per capita) -4.6% (long-run CO2 emissions per capita) | (Kohlscheen, Moessner and Takáts, 2021) |
$10/tCO2 increase in ETS allowance rate | -1.4% (short-run economy-wide CO2 emissions per capita) -5% (long-run economy-wide CO2 emissions per capita) | ||
€10/tCO2 increase in effective carbon rate Effective carbon rates measure how explicit carbon taxes, emissions trading systems (ETSs) and fuel excise taxes put a price on CO2 emissions from energy use. These are pricing instruments that either set an explicit price per unit of CO2 (e.g. tonnes) or that set a price on units of fuel, which is then proportional to resulting emissions. | -3.7% – -7.3% (average long-term economy-wide CO2 emissions reductions) | (Maria D’arcangelo et al., 2022) | |
British Columbia carbon tax | $30/tCO2 $0.078/l (additional fuel cost) | -12% (gasoline consumption) -5 – -15% (aggregate GHG emissions on targeted sectors) -7% – -10% (natural gas consumption) All reductions are for 2008-2011. | (Fairbrother and Rhodes, 2023) |
$10-$30/tCO2 (2008-2015) | -5% – -19% (transport CO2 emissions) (2008-2015) | (Pretis, 2022) | |
Swedish Direct Carbon Tax | €22-€134/tCO2 (1990-2005) | -11%/year (transport CO2 emissions) (1990-2005) | (Andersson, 2019) |
€22-€134/tCO2 (1990-2005) | -7.7%/capita/year (transport CO2 emissions) (1990-2005) | (Yu, 2024) | |
€122/tCO2 | -70% by 2030 compared to 2010 (domestic transport emissions) (anticipated) | (Ministry of Finance, 2023) | |
Increase in tax rate of 100% | -18% (consumption of refined petroleum products) relative to 2010 Also cites figures from other studies ranging from 11% to 21% for emissions reductions for a doubling of the carbon tax rate. | (Almström, Anderstig and Sundberg, 2024) | |
Norwegian Direct Carbon Tax | Increase in tax rate of 7.6% (gasoline) and 17% (heating oils) from baseline of $51/tCO2 and $19-22/tCO2 for heating oils | -4.2% consumption of gasoline -6.2% consumption of heating oils 0.4%-1.2% public transport use (The authors also note a counteracting effect from an increased uptake of air travel, which is exempt from Norway’s carbon tax) | (Bruvoll and Larsen, 2002) |
Increase in tax rate from NOK590 (~£43) in 2021 to NOK2000 (~£148) in 2030 | -3.5 Mt (transport GHG emissions, including shipping) by 2030 (anticipated) | (Norwegian Ministry of Climate and Environment, 2022) | |
German Emissions Trading System | Unclear | -10.2 Mt GHG emissions by 2030 (transport and heating sectors) (anticipated) | (Federal government of Germany, 2024) |
€30/tCO2 | -1.7%/year (2022-2023) (transport emissions, mostly driven by a reduction in demand for freight transport) -6.9%/year (2022-2023) (building heating emissions) | (Emissions Trading Authority at the German Environment Agency, 2025) | |
Austrian Emissions Trading System | €55/tCO2 | -4% (total CO2 emissions) within first five years | (Streicher, Kettner and Schratzenstaller, 2025) |
EU ETS2 | €48/tCO2 | Additional 10% reduction in GHG emissions by 2030 compared to 2005 | (European Commission, 2021) |
UK (hypothetical ETS2) | £40/tCO2 (low) £80/tCO2 (high) | -6.1% – -10.6% (economy-wide emissions if road transport fuels are priced) by 2040 -10% – -14.7% (economy-wide emissions if heating fuels are priced) by 2040 | (Sturge et al., 2024b) |
UK (hypothetical carbon tax on transport) | ~£0.4-£0.75 fuel duty per litre of gasoline (2017 prices) | -0.352 tCO2/capita per year | (Bretschger and Grieg, 2024) |
Scotland (hypothetical economy-wide carbon tax) | £50/tCO2 | -37% economy-wide CO2 emissions | (Allan et al., 2014) |
Jurisdiction and instrument | Carbon price | Increase in costs | Source |
|---|---|---|---|
British Columbia carbon tax | $170/tCO2 | 7.4% (transport and warehousing sector) | (Canadian Energy Centre, 2023) |
$10/tCO2 | $0.024/l (additional fuel cost) | (Fairbrother and Rhodes, 2023) | |
$30/tCO2 | $0.078/l (additional fuel cost) | ||
German ETS | €45/tonne | Minor increase in fossil fuel prices | (Federal government of Germany, 2024) |
€150/tCO2 | 2.1% of income. Burden on lower income groups is higher than on upper income groups. However, if a “climate dividend” of €422/person/year is paid, burden i(Bach et al., 2023)f income. | (Bach et al., 2023) | |
Austrian ETS | €55/tCO2 | -0.4% in real GDP -0.7% in employment Neutral effect on household income (in the fifth year after introduction) | (Streicher, Kettner and Schratzenstaller, 2025) |
EU ETS2 | €122/tCO2 | 33% (heating oil) 24% (natural gas) 22% (diesel) 18% (petrol) | (BloombergNEF, 2025) |
€48/tCO2 | 10%-28% (heating oil) 10%-33% (natural gas) 52%-100% (coal) 9%-14% (diesel) 7%-12% (petrol) Ranges are across EU Member States. | (European Commission, 2021) |
Revenue recycling mechanism | Advantages | Drawbacks and risks |
|---|---|---|
Population-wide lump sum payments, rebates, or dividends | Progressive (benefits lower-income more than higher-income groups) Can be diversified through “top-ups” for specific constituencies, similar to Scotland’s existing heating bill support system (Scottish Government, no date a) | May be challenged by low public awareness Risk of overestimating adequate rebate amounts Contrasting evidence on ability to neutralize distortionary effects Risk of interaction with pre-existing labour taxation |
Targeted financial support | Can be tailored to specific target groups, e.g., regional differentiation, means testing, support for small businesses | Challenging to determine target populations and appropriate compensation formula |
Reduction in other taxes (“double dividend”) | Can be tailored to specific costs (e.g., electricity bills) or taxes (e.g., labour taxes, income tax) | Some evidence of regressiveness, e.g. for sales tax exemptions and increase in income tax exemptions |
Targeted subsidies for clean technologies | Variety of financial transfer options (vouchers, grants, low-interest loans) |
|
Public investments | Can create enabling conditions for reducing fossil fuel consumption without forcing individual investments, e.g., public transport improvements | Effects are less visible and take time to alleviate immediate carbon cost impact |
How to cite this publication:
Miu, L., Umer, H., Hill, D., Sayers, J., Kulaga, D., Tyrer, D. Hawkes, A. and Hatton, L. (2026) ‘How can carbon pricing help achieve Scotland’s 2045 targets?’, ClimateXChange. https://doi.org/10.7488/era/7240
© The University of Edinburgh, 2026
Prepared by Logika Group and Imperial Consultants on behalf of ClimateXChange, The University of Edinburgh. All rights reserved.
While every effort is made to ensure the information in this report is accurate as at the date of the report, no legal responsibility is accepted for any errors, omissions or misleading statements. The views expressed represent those of the author(s), and do not necessarily represent those of the host institutions or funders.
This work was supported by the Rural and Environment Science and Analytical Services Division of the Scottish Government (CoE – CXC).
ClimateXChange
Edinburgh Climate Change Institute
High School Yards
Edinburgh EH1 1LZ
+44 (0) 131 651 4783
If you require the report in an alternative format such as a Word document, please contact info@climatexchange.org.uk or 0131 651 4783.
Income archetypes were based on the ten income ranges used in reporting of subnational residential gas and electricity consumption by Department for Energy Security and Net Zero (2025) Department for Energy Security and Net Zero (2025) (see Appendix B, Table 8). ↑