

How can carbon pricing help achieve Scotland’s 2045 targets?
Research completed February 2026
DOI: https://doi.org/10.7488/era/7240
Executive summary
Research aims and scope
To achieve net-zero by 2045, Scotland will require deep emissions reductions. Carbon pricing is a mechanism for imposing a cost on greenhouse gas emissions to incentivise emitters to cut pollution. This research assesses whether and how carbon pricing instruments could contribute to decarbonising the road transport and building heating sectors, which lag behind other parts of the Scottish economy in emissions reductions. This study provides early-stage analytical evidence on the potential role of carbon pricing in these sectors, as part of a wider decarbonisation strategy. It does not contain or examine policy proposals.
The study has two objectives. First, it reviews evidence on the performance of carbon pricing instruments applied to transport and buildings. Second, it models and assesses the impact of introducing carbon pricing instruments on these sectors in Scotland. The analysis is limited to carbon taxes (flat-rate charges on the carbon content of fuels) and cap-and-trade systems, also known as emissions trading systems (ETS), where suppliers buy allowances covering emissions from the fuels they sell, at a market price.
We model four scenarios: two carbon tax levels (£25/tCO₂ and £75/tCO₂) and two cap-and-trade system scenarios (with and without a soft price cap). In each scenario, a carbon price is applied to transport and building heating fuels. This cost is then either fully (100%) or partially (50%) passed on by fuel suppliers to household and business consumers. Our approach uses a simple investment model in which consumers are assumed to either reduce their fuel consumption or invest in low-carbon heating (heat pumps) and transport alternatives (electric vehicles (EVs)).
We model the potential emissions reduction effects of these carbon price scenarios relative to a baseline scenario which aligns with the Climate Change Committee 7th Carbon Budget. This baseline already reflects a relatively ambitious emissions reduction pathway, which has important implications for the assessment. Against this baseline, we present the modelled effects of carbon pricing on emissions reductions, the anticipated direct costs to consumers, and the potential revenues to government.
We do not assess any potential options for using the revenues from carbon pricing to further support decarbonisation. We also do not assess the corresponding secondary effects of revenue recycling on emissions abatement, technology uptake or mitigation of adverse effects on specific consumer groups. This also has implications for our assessment, as investment in low-carbon alternatives could be higher if carbon pricing revenues were recycled through targeted subsidies, such as for purchasing EVs or heat pumps.
Findings
Evidence on the performance and impact of carbon pricing
The literature indicates that carbon pricing can contribute to emissions reductions in transport and building heating, but the impact tends to be uncertain and relatively modest. This impact is significantly affected by differences in national context, including the affordability of low-carbon alternatives and complementary policies. As such, there is no strong consensus in the literature on the magnitude of the effect of carbon pricing.
In higher-income countries, carbon pricing is typically regressive, i.e., it imposes proportionately higher costs on low-income households. Recycling carbon pricing revenues can alleviate this burden, which can further improve the social feasibility of carbon pricing.
Modelled emissions abatement under carbon pricing in Scotland
The model projects a cumulative emissions abatement of 2.9-11 million tonnes (Mt) between 2027 and 2045, on top of that already expected to be in the baseline scenario. The highest anticipated emissions reduction is in the higher £75 carbon tax scenario where costs are fully passed on to customers. In this scenario, annual emissions are 3.6% lower in 2030 than the baseline, and 13% lower in 2045. The lowest emissions abatements were in the lower £25 carbon tax scenario, where costs are partially passed on. Our modelled ETS prices generate less emissions abatement than steadier price signals under a carbon tax. The model shows that most additional emissions reductions occur in the buildings sector.
Our modelled emissions reductions due to carbon pricing are relatively modest. This is partly due to simplifying assumptions in the model, but also to the already ambitious baseline, which leaves limited scope for further gains from carbon pricing alone. The modelling suggests that consumers would primarily respond to the carbon price by reducing their fuel consumption rather than switching to low-carbon alternatives. Persistent barriers to investment, especially in lower-income groups, and without modelled revenue recycling, drive consumers to reduce demand rather than invest in alternatives.
Modelled consumer costs and distributional impact
Under our modelled carbon price, consumers either invest in low-carbon technologies, or they pay the carbon cost of the fossil fuels they continue to use. In our model, over the entire period 2027-2045, Scottish consumers are assumed to incur a direct additional cost of between £1 billion and £8 billion. Crucially, these costs are mainly the additional direct fuel costs incurred by consumers under a carbon price. As such they are not directly comparable to abatement costs cited in the literature, which generally include only the cost of deploying low-carbon alternatives.
Despite the substantial costs from the modelled carbon pricing instruments cited above, they are relatively modest at a household level, between £29 – £172 per year. However, they are more significant for lower-income households, representing up to 1.4% of the median income of the lowest-income households. The disproportionate impact on low-income consumers can be alleviated through revenue recycling, which as noted above we do not assess.
Lessons learned
Our research finds that if added to an ambitious baseline policy mix, carbon pricing instruments could generate small additional emissions reductions in Scotland’s transport and buildings sectors. Given that our modelled baseline is ambitious, the abatement effects we find are small. However, carbon pricing schemes could deliver a signal for consumer behaviour change if baseline emissions reductions fail to materialise. At the same time, complementary policies can ensure that consumers can overcome investment barriers, and alleviate the burden of carbon costs for those who cannot yet invest.
This research is early-stage and relies on simplifying assumptions for modelling the impact of carbon prices. Additional research is needed to further assess carbon pricing against less ambitious baseline policy mixes, and including a wider range of low-carbon technologies such as heat networks and low-carbon liquid fuels. Crucially, modelling the effect of revenue recycling can help identify how the use of carbon pricing revenues can increase the effectiveness of emissions abatement and reduce the impact on those most vulnerable.
Abbreviations table
7CB | 7th Carbon Budget |
BC | British Columbia |
CAD | Canadian dollar |
CAPEX | Capital expenditure |
CCC | Climate Change Committee |
CCP | Climate Change Plan |
CO2 | Carbon dioxide |
CO2e | Carbon dioxide equivalent |
DCT | Direct Carbon Tax |
DESNZ | Department for Energy Security and Net Zero |
EU | European Union |
ETS | Emissions Trading System |
EVs | Electric vehicles |
GHG | Greenhouse gas |
GDP | Gross Domestic Product |
GW | Gigawatt |
GWh | Gigawatt-hour |
HGV | Heavy goods vehicle |
ICEs | Internal combustion engine vehicles |
kW | Kilowatt |
LGV | Light goods vehicle |
LNG | Liquefied Natural Gas |
MSR | Market Stability Reserve |
Mt | Million tonnes |
MWh | Megawatt-hour |
NOK | Norwegian Krone |
NOx | Nitrous oxides |
NPV | Net Present Value |
PM 2.5 | Particulate matter |
SG | Steering Group |
tCO2 | Tonne of CO2 |
TNAC | Total number of allowances in circulation |
UK | United Kingdom |
Introduction and background
Context and rationale of research
In 2025, there were 113 carbon pricing instruments implemented in 55 countries and 44 subnational jurisdictions around the world (World Bank, 2025). Although varying in design and levels of impact (see Section 3.3), they are all underpinned by the “polluter pays” principle, ensuring that the social cost of greenhouse gas (GHG) emissions is borne by the polluter (UK Government, 2022). The rationale behind carbon pricing is that pricing carbon emissions will drive emissions reductions by polluters, if the carbon price is higher than the cost of abatement (World Bank Group, 2025).
Carbon pricing instruments are of particular interest where the pace of decarbonisation is slower than the average. They have recently come into focus for decarbonising the transport and building sectors, with the launch of an EU-wide Emission Trading System (the EU ETS2) which prices carbon emissions from these sectors (European Commission, no date). The UK ETS covers the electricity, industry and domestic aviation sectors, while transport and building heating emissions are primarily covered through non-price policies, such as standards (Sturge et al., 2024a). As with the wider UK, in Scotland, transport and buildings emissions reductions lag behind other sectors (Climate Change Committee, 2025a; Scottish Government, 2025a). This indicates a potential role for carbon pricing as a complementary decarbonisation instrument.
By their nature, carbon pricing instruments are “stick” rather than “carrot” policies. They create a price pressure which incentivises decarbonisation, but do not implicitly include supporting mechanisms for polluters to switch to less emissions-intensive activities. As such, carbon pricing instruments require complementary policies to achieve their decarbonisation potential while minimising the financial burden on consumers and economies. They also function best as part of wider policy portfolios because of their ability to mitigate shortfalls in the pace and/or rate of decarbonisation incentivised by other policies (Raiser and Rault, 2025a). They can also be politically controversial. For example, the European Union (EU) and its Member States have had long-standing debate on the design of the EU ETS2, the (EU’s) carbon pricing scheme for transport and building emissions. Since its original design, the scheme has been significantly relaxed, primarily due to concerns over potential consumer impacts (European Commission, 2025). The impact on low-income consumers of carbon pricing can be mitigated through revenue recycling mechanisms, to avoid exacerbating existing inequalities such as the disproportionate incidence of fuel poverty amongst low-income groups.
The aim of this research is to examine evidence and provide further analysis on the potential for carbon pricing to accelerate emission reductions in the transport and buildings sectors in Scotland. The scope is limited to two types of carbon pricing instruments: cap-and trade systems (also known as ‘emissions trading systems’ – ETS) and carbon taxes. ETS are policy measures establishing a market where GHG emitters from target sectors must purchase allowances (permits) to cover their emissions, from a pre-set jurisdictional cap on emissions. The pre-set cap decreases year on year. Carbon taxes are pre-determined rates applied to the carbon content of fuels, energy vectors, or products.
A third type of carbon pricing instrument is carbon credit markets (World Bank Group, 2025). These are largely voluntary, are not typically applied for sectoral emissions, and their effectiveness is debated (Romm, Lezak and Alshamsi, 2025). They are not within the scope of this report.
The research questions of this study are:
- What options already exist for pricing carbon, and what evidence is there around their cost-effectiveness, distributional impact, and shortfalls?
- What are the environmental, economic, social, and distributional implications of cap-and-trade and carbon tax instruments on Scottish transport and buildings, and their associated limitations and feasibility?
- Based on (1) and (2), what options are the most promising as cost-effective measures to decarbonise the Scottish transport and buildings sectors while protecting those most vulnerable?
First, we review evidence on carbon pricing schemes in the transport and building heating sectors in selected countries (Sections 3.2 – 3.4). Second, we model and analyse effects of four carbon pricing scenarios on Scotland’s transport and building heating sectors (Section 4.1 – 4.5). Conclusions and lessons learned are then formulated (Section 5).
It is important to note that the study in no way implies a policy proposal to introduce new carbon pricing measures in Scotland. Rather, it is early-stage research which provides preliminary evidence by modelling carbon pricing schemes, alongside a review of secondary literature. Additional methodological information and data is presented in the report appendices.
Carbon pricing schemes on transport and building sectors
The two types of carbon pricing schemes reviewed in this study, cap-and-trade and carbon tax systems, have been applied around the world, including on the transport and building sectors. Below we briefly describe 7 such schemes, selected based on comparability to Scotland, availability of information on their performance, and direction from the project Steering Group (SG).
The EU ETS2 is new carbon pricing scheme, covering fuels combusted in road transport and buildings. It will function on the same principles of the EU ETS, but is completely separate from it. Allowances will be made available to fuel suppliers, who must purchase and surrender allowances equivalent to the CO2 emissions from the combustion of the fuels they sell. The system will have a ‘soft price cap’. That is, when the price of allowances exceeds €45 (approx. £39) in 2020 terms over a certain period, market stabilisation mechanisms will be triggered to release allowances from a reserve, which will drive down the price. Revenues from the ETS2 will be collected into a Social Climate Fund, to be used by Member States to alleviate the impact of carbon pricing on consumers. The scheme will start in 2028, after an agreement to postpone it (International Carbon Action Partnership, 2026).
British Columbia’s Direct Carbon Tax (DCT) was the world’s first subnational carbon tax, applied to all fuels, including transport and heating fuels. It started with broad sectoral coverage, accommodating sectoral exemptions over time, and rose from CAD 10/tCO2 (approx. £5/tCO2) in 2008 to CAD 95/tCO2 (approx. £51/tCO2) in 2025. Revenue was recycled through tax cuts and transfers to individuals and firms (Sloan et al., 2024). This tax paved the way for the federal (i.e., national) Canadian carbon tax (Fairbrother and Rhodes, 2023). However, in 2025 the Canadian and British Columbia carbon taxes were scrapped to focus on pricing carbon from large industrial emitters (Government of Canada, 2025).
Sweden’s DCT, in force since 1991, covers all fossil fuels, including road transport and building heating (Sloan et al., 2024). The tax rate has increased from €22/tCO2 (approx. £19/tCO2) in 1991 to €134/tCO2 (approx. £116/tCO2) in 2025. Around 90% of the tax revenues come from gasoline and motor diesel charges, totalling around €2 billion (approx. £1.74 billion) in 2023 (World Bank, 2023; Statistik Databasen, 2025). Revenues are not earmarked for specific purposes (Government Offices of Sweden, 2025).
Austria’s National ETS, launched in 2022, complements the EU ETS by pricing carbon emissions from sectors not covered by the latter, including transport and buildings. The allowance price was pre-set and as of 2025 stood at €55/tCO2 (approx. £48/tCO2), which is above the soft price cap of the EU ETS2 (see below). Revenue from emissions allowances goes directly into Austria’s main government budget, with ‘climate bonus’ payments returned to all Austrian households as a set price per person. This means poorer households, which typically emit less, gain more than richer households. The scheme has consistently been revenue negative, with government expenditure for rebates being greater than income from carbon pricing. From January 2028 it will be replaced with the EU ETS2 covering road transport and buildings (International Carbon Action Partnership, 2025a).
Norway’s National DCT, introduced in 1991, is levied on fossil energy products, including those used in road traffic and natural gas used for heating (Norwegian Ministry of the Environment, 2005). The tax level was NOK 944 (approx. £70/tCO2) in 2025, and is planned to more than double by 2030 (to approx. £148/tCO2), to support transport emission targets. Norwegian emissions from heating buildings are already relatively low, reflecting a pre-existing ban on the use of fossil oil as a heat source in 2020, and generally low use of natural gas. The carbon tax revenue is used to reduce other taxes (Norwegian Ministry of Climate and Environment, 2022).
Germany’s National ETS, launched in 2021, complements the EU ETS. It is being phased in with a fixed carbon price, rising to €55/tCO2 in 2025 (approx. £48/tCO2), and a flexible allowance supply determined in line with Germany’s emissions reduction targets. The scheme covers all main fossil fuels, including those used in heating and transport. As of 2024, total revenue generation was €12.97 billion (approx. £11.25 billion) (International Carbon Action Partnership, 2025b). Revenues are directed to the “Climate and Transformation Fund”, used to finance technologies and climate protection measures within Germany, as well as refinancing electricity price and carbon leakage compensation (Deutsche Emissionshandelsstelle, 2025).
Performance and impact of carbon pricing schemes
In this and the following sections we review wider literature around the performance, impact, shortfalls and limitations of carbon pricing schemes covering the transport and heating sectors, focusing on the ones listed above. This is not a systematic literature review, rather its purpose is to set the context of subsequent modelling and analysis for Scotland.
Emissions abatement
The literature indicates that carbon pricing can contribute, and has contributed, to emissions reductions in heating and transport, by stimulating investment in clean technologies. Details of the emissions reductions found in the reviewed literature are set out in Appendix D (Table 14). However, technology adoption likely reflects many factors, including other influences on fossil fuel use such as the effect of different policies, underlying fuel prices, and national economic and social characteristics. It is also influenced by the availability of alternative technologies, as well as the elasticity of demand for transport and heating fuels, i.e., how responsive fuel demand is to price changes. In general, demand for these fuels, particularly heating fuels, is less responsive to price changes. As such, the EU expects that the ETS2 will not generate major demand reductions, but that some technologies could be profitably switched to low-carbon alternatives (European Commission, 2021). Another study modelling the expected impact of the EU ETS2 found that emissions reductions would likely be higher in road transport than in heating, due to the relatively quicker turnover of car ownership compared to boilers (Fazekas et al., 2021).
The literature shows a mostly positive rate of emissions reduction in transport and buildings under carbon pricing schemes (see Appendix D, Table 14). The exact figures are not easily generalisable, due to the range of factors affecting technology adoption including the wider policy and national contexts for specific instruments, as well as methodological differences. Research uncertainty is also a factor, particularly for studies on newer or hypothetical carbon pricing systems, which rely on modelling. This is partly because carbon pricing on heating and transport is expected to generate behaviour change in individuals and the complexities of behavioural modelling introduce further research uncertainty.
Studies on certain jurisdictions with long-running carbon pricing find mixed performance (Appendix D, Table 14), due to differences in the design of schemes as well as the parameters used in different research. In BC, some studies cite short-run aggregate emission reductions of between 5-15% (Murray and Rivers, 2015), while others find a decline only in transport emissions or even increased transport emissions (Pretis, 2022; Winter, 2024; Arcila and Baker, 2022). Studies in other countries find similar decreases. For example, a 1.7% in transport emissions and 6.9% in building heating emissions in Germany between 2022 and 2023, 7.7% in per capita transport emissions in Sweden between 1990 and 2005 and 4% decrease in total Austrian CO2 emissions within the first five years of the national ETS (Emissions Trading Authority at the German Environment Agency, 2025; Yu, 2024; Streicher, Kettner and Schratzenstaller, 2025).
In the UK, modelling of a hypothetical ETS on transport and buildings finds that a £40-£80/tCO2 carbon price could drive economy-wide emissions reductions of 6.1-10.6% in transport and 10-14.7% in heating buildings (Sturge et al., 2024). This study finds that greater emissions reductions occur in the heating sector, partly due to existing excise duties on transport fuels. This is in contrast to a study on the EU by Fazekas et al. (2021), which finds higher emissions reductions in the transport sector compared to the heating sector under a modelled EU ETS2. Bretschger and Grieg (2024) find that a hypothetical carbon tax on transport fuels in the UK reduces emissions by 0.352 tCO2/capita/year relative to the baseline. There are fewer relevant studies that focus on the Scottish context. The most recent relevant study from 2014 did not look specifically on transport and heating buildings. However, it found that a carbon tax of £50/tCO2 would allow Scotland to achieve 37% aggregate emissions reductions by 2020 relative to 2000 emission levels (Allan et al., 2014). These projected emissions reductions are not additional to an existing ETS, as the goal of the 2014 study was to model what a carbon tax could achieve in case of Scottish independence or further devolution of fiscal powers. It should also be noted that the study was published before Scotland agreed its net-zero targets and before the implementation of the UK ETS.
In addition to abating CO2 emissions, some literature finds that carbon pricing can also reduce non-CO2 emissions, including nitrous oxides (NOx) and particulate matter (PM 2.5) (European Commission, 2021). Sileci (2023) models PM2.5 reductions of 5.2-10.9% (2008-2023) driven by reductions in transport fuel demand under BC’s carbon tax. The resulting positive health outcomes may partially or fully offset the costs of carbon pricing.
While the literature shows generally positive effects of carbon pricing on emissions abatement in heating and transport, there is no strong consensus on the ultimate magnitude of the effect. This is a finding in itself, and reinforces that the contribution of carbon pricing to emissions abatement is highly context-dependent.
Economic and distributional impact
Abating emissions through carbon pricing comes at a cost to consumers, as the price of fossil fuels absorbs the cost of associated emissions, and as such increases. The literature shows a range of economic and consumer impacts of carbon pricing schemes, detailed in Table 15 (Appendix D). In BC, studies find small consumer impacts of approx. €0.015-€0.048/l of gasoline, but with a negligible effect on economic growth (Fairbrother and Rhodes, 2023). However, the tax was initially revenue negative (GIZ and UNDP, 2019). If revenue positivity were a priority, the tax may have had a higher economic impact. Similarly, modelled analyses found no projected negative impact on income or economic growth from the UK’s fuel duty, as the increase in public services financed by fuel tax revenue counterbalances impact on households (Bretschger and Grieg, 2024; European Commission; BloombergNEF, 2025).
Such economic impacts are not evenly distributed. They can vary by geography as well as by consumer type (Winter et al., 2023; Pretis, 2022). For example, Swedish commercial buildings already use a higher share of clean heating than residential ones (Ministry of Finance, 2023), and so are less impacted by a carbon price. Importantly, carbon pricing schemes tend to have a regressive impact across income groups in higher-income countries, especially those targeting transport and building heating fuels (World Bank, 2020; Ohlendorf et al., 2021). This is because such carbon pricing schemes directly impact end consumers. Suppliers of transport and heating fuels have limited options to decarbonise their fuel supply themselves, and so are likely to fully pass through the carbon price to end consumers (European Commission, 2021). There will probably be a disproportionate impact on low-income groups because for these groups the incidence of fuel poverty is higher. These groups also spend more of their income on fuels, and a higher share of this is essential consumption, especially heating (Federal government of Germany, 2024; European Commission, 2021; Fazekas et al., 2021; Sturge et al., 2024b). Middle-income consumers may see a more pronounced impact from transport carbon pricing, as they are more likely than low-income groups to have a private vehicle (European Commission, 2021). Lower-income households also face investment barriers to low-carbon technologies, such as lack of capital, increased likelihood of living in rented accommodation, and other constraints (Fazekas et al., 2021).
Although less clear, the distributional impact of indirect health benefits from carbon pricing have also been noted in the literature. Reductions in air pollutants enabled by carbon pricing typically benefit lower-income and vulnerable households to a greater extent, as they tend to suffer greater exposure (European Commission, 2021). On the other hand, Sileci (2023) finds greater health benefits in less polluted, less dense, and better-off areas in BC. This suggests that carbon pricing may exacerbate pre-existing pollution-income gaps.
Revenue recycling
Carbon pricing revenues can be used to mitigate their economic and distributional impact (European Commission, 2021). This is aligned with the expectations of the “double dividend” theory of environmental taxation, in which a wide range of literature indicates that using environmental tax revenues to mitigate distortionary taxes provides both environmental and economic benefits. The EU ETS2 is expected to have a negative effect on Gross Domestic Product (GDP), unless revenues from the scheme are recycled. Recycling revenues into low carbon technology investments is found to lead to a more positive GDP impact than use of revenues for outright tax reductions (Fazekas et al., 2021). A 2014 modelling study on Scotland found that if revenues of a hypothetical £50/tCO2 carbon tax are recycled by reducing income tax rates, emissions and unemployment would fall, and GDP and real wages would increase, compared to expanding general government expenditure (Allan et al., 2014). The study does not account for wider UK climate change policies, and given its publication date, findings should be treated with caution.
Various options are available for carbon price revenue recycling, and their suitability varies by country. Generally, a combination of mechanisms, including direct income support, is required to address equity, efficiency, and environmental concerns (Streicher, Kettner and Schratzenstaller, 2025). Many existing revenue recycling schemes include measures targeted at specific income groups, for example tax credits for lower-income groups in BC, or income tax reductions for low- and middle-income households in Sweden (GIZ and UNDP, 2019; Fairbrother and Rhodes, 2023; Ministry of Finance, 2023). Others target support for specific low-carbon measures, for example temporary aid schemes for renewable heating in Sweden or energy efficiency, clean heat, and low-carbon mobility in EU Member States (Ministry of Finance, 2023; European Commission, 2025).
If recycled revenues are not targeted at specific consumers, carbon pricing schemes can be revenue-negative. For example, Austria’s Regional Climate Bonus recycles carbon pricing revenues through a flat-rate income support to all residents. Total payments were estimated to exceed carbon pricing revenues by €930 million in 2022 (Austrian Court of Audit, 2021). Unintended effects may also occur unless the schemes are carefully managed. For example, the redistribution of revenues through tax relief for commuter trips in Germany may favour higher-income households (European Environmental Bureau, 2022). Revenue redistribution can also offset the reduction in fossil fuel demand driven by carbon pricing, as found in Norway. Here, the impact of CO2 taxes is mitigated by redistributing revenues to reduce other road transport taxes, thus reducing the cost of transport and counteracting emissions reductions (Norwegian Ministry of Climate and Environment, 2022). However, modelling of a UK ETS on transport and buildings finds such counteraction effects to be insignificant (Sturge et al., 2024b).
As with emissions abatement, the economic and distributional effects of carbon pricing are highly context-dependent, as are the potential impact of revenue recycling. As such, there is no strong consensus in the literature on optimal mechanisms for use of carbon pricing revenues. However, the reviewed literature does outline the importance of closely assessing consumer impact before implementing carbon pricing instruments. This includes particular attention to low-income households and groups at risk of fuel poverty, on which research generally agrees that the impact will be disproportionate.
Shortfalls and limitations of carbon pricing schemes
While carbon pricing schemes could deliver emissions abatement and manage associated consumer impact, they present risks, shortfalls and limitations. Their impact is often difficult to quantify precisely, given the wider policy environment and market forces.
Complementary policies
A near-universal finding on the performance of carbon pricing schemes is that they are more effective in reducing emissions if they are part of a mix of complementary policies (Raiser and Rault, 2025). The price of ETS allowances is significantly influenced by the stringency of complementary policies and ambition of targets. (Günther et al., 2024). For example, Sweden’s and Norway’s successes in decarbonisation are partly dependent on integration of carbon pricing with subsidies, alternative fuel quotas, other taxes and support mechanisms, as well as research and development incentives (Ma, 2023; Norwegian Ministry of Climate and Environment, 2022). Multilevel policy mixes can be mutually reinforcing if they are designed with a view to maximising efficiency and minimising overlap (European Commission, 2021; Winter, 2024).
Existing taxes and levies must be carefully considered to avoid double burdening of consumers. The UK has a long-standing excise duty system on the transport and heating sectors, and an existing environmental tax charged on business energy use (the Climate Change Levy), which could introduce a risk of double counting of emissions taxes (UK Government, 2016). This could be mitigated by phasing out or adjusting these taxes as the ETS on affected sectors is phased in (Sturge et al., 2024b). The EU is also designing compensation regimes and coordinating with Member States to mitigate overlaps between the EU ETS2 and national schemes (European Commission, 2021; Federal government of Germany, 2024, Bach et al., 2023).
Complementary policies can also inadvertently reduce the effectiveness of carbon pricing. For example, if subsidies encouraging the deployment of clean technologies in a certain sector are introduced alongside an ETS, they risk lowering carbon prices. If an ETS covers the electricity and heating sectors, and simultaneously there are subsidies available for renewable electricity deployment, electricity producers could decarbonise more quickly, increasing the number of available ETS permits and thus depressing the carbon price. The lower carbon price could in turn disincentivise the decarbonisation of heating producers and reduce the efficiency of the overall ETS scheme. This is also known as the waterbed effect. (Raiser and Rault, 2025). This is why market stabilisation mechanisms such as the EU ETS2 Market Stability Reserve (MSR) are seen as essential (Marcantonini et al., 2017).
Carbon taxes and ETS schemes each have relative advantages and disadvantages if being considered for standalone application. They can also be applied simultaneously, but the effects of doing so are context-dependent. In some cases, applying them to the same emissions base could render one of them redundant. However, they can also complement each other. For example, a carbon tax acting as a price floor can help stabilise volatile prices in an ETS. This was shown to be successful in the UK ETS for electricity sector emissions (Raiser and Rault, 2025; International Carbon Action Partnership, 2025c).
Social and political feasibility
Ultimately, emissions reduction from carbon pricing is driven by the magnitude of the price signal which itself creates challenges for social and political acceptability (Arcila and Baker, 2022). These have been evident throughout the negotiation of the EU ETS2 and the current debates surrounding its implementation (Germanwatch, 2025). Elsewhere, the literature shows varying public reactions and degree of support across countries, but also across time. For example, after an initial backlash, the BC carbon tax received greater public acceptance once revenue recycling progressed (Pretis, 2022; GIZ and UNDP, 2019). This link between social acceptance and revenue recycling is found more broadly across the literature. In Sweden, social acceptability was found to depend on the perceived quality of existing social insurance programmes and the measures taken to address collective, rather than personal, distributional impacts (Nordbrandt et al., 2025; Lindvall et al., 2024).
Apart from through revenue recycling, public acceptability of carbon pricing may increase if the policy is introduced gradually. This can allow consumers to adapt to the scheme before it causes major lifestyle changes, thereby reducing adjustment costs. Moreover, effective communication techniques can increase feasibility of carbon pricing by highlighting benefits, reducing misperceptions and tackling biases. This includes making the financial and environmental benefits of the scheme prominent in communications. For example, this could be through showing revenue recycling to individuals via their payslips, or by using positive language, such as ‘climate contribution’ instead of ‘carbon tax’, to frame the scheme (Barrez and Bachus, 2023).
Political feasibility will strongly depend on social acceptance of carbon pricing, as well as wider social challenges. Political support for carbon pricing can be increased if schemes are designed to clearly address environmental and economic issues (Knaggård and Hildingsson, 2025). The administrative burden of carbon pricing schemes must also be considered and can affect political feasibility. Carbon tax systems can often be implemented relatively inexpensively for governments, using existing fuel tax infrastructure (Stavins, 2022; Ministry of Finance, 2023). ETSs tend to be more administratively complex and generally require a separate regulatory authority. This complexity may be less burdensome if an ETS is already in place on other sectors, as is the case in the UK.
The Scottish context
The ultimate impact of any carbon pricing scheme will depend on its national context, including existing policies, climate ambitions, and socio-economic challenges. In Scotland, the ambitious national commitment to reaching net zero emissions by 2045 will require steep reductions in emissions from road transport and buildings. According to the draft Climate Change Plan (CCP), the transport sector will need to reduce emissions by 74% between the 2026-2030 and 2036-2040 periods. The buildings sector will need to reduce emissions by 42% between the 2026-2030 and 2036-2040 periods (Scottish Government, 2025a). Scotland’s Heat in Buildings Strategy (2021) set out even steeper reductions for emissions from building heating: 68% by 2030 (Scottish Government, 2021). This strategy is due to be revised in 2026.
Reaching these climate targets is expected to require a significant ramp-up in the pace of adoption of low-carbon transport and heating. The Scottish Government estimates that 1.9 million homes and 13,000 commercial properties must transition to heat pumps or heat networks by 2045 (Scottish Government, 2025a). For transport, the UK Climate Change Committee (CCC) projects an increase in the share of battery electric vehicles from 4.8% in 2025 to nearly 30% in 2030 and 94% in 2045 as part of a balanced pathway to net-zero emissions (Climate Change Committee, 2025b). At the same time, Scotland’s transport and buildings sectors have been slower to decarbonise than other sectors, and recent emissions projections under the Climate Change Plan update of November 2025 are less optimistic than in the previous Climate Change Plan (CCP) from 2020 (Scottish Government, 2025b; Climate Change Committee, 2025a).
Carbon pricing policies could play a role in accelerating the pace of decarbonisation in Scotland’s transport and buildings sectors, as part of a wider policy portfolio. Scotland has numerous policies addressing decarbonisation in transport and buildings, including: subsidy schemes for building energy efficiency and low-carbon heating heat standards for new buildings proposed energy efficiency standards for existing buildings a phase-out of new petrol and diesel car sales by 2030 interest-free loans for EV purchases and a zero-emissions vehicle mandate (Scottish Government, 2025a; Scottish Government, 2025b; Scottish Parliament, 2025; Scottish Government, 2022; UK Government, 2025c; Transport Scotland, 2023). Transport fuels are also covered through wider taxation schemes with implicit impact on emissions, such as the UK fuel duty. Under the fuel duty, EV owners will pay per-mile rates equivalent to around half of that charged to internal combustion engine vehicles (HM Treasury, 2025). Such policies and support schemes could be key complements to carbon pricing, by ensuring that consumers can effectively respond to a carbon price signal by investing in new technologies or adjusting their demand.
Reducing consumer impact and avoiding policy regressiveness would be important in the Scottish context, where household disposable incomes are still recovering from recent inflation shocks (Scottish Government, 2024c). Distributional impact, meaning impacts on low-income and other vulnerable consumers, is a key concern given Scotland’s a legally binding target to reach a 5% rate of fuel poverty by 2040 from current rates of 39% (Scottish Parliament, 2019). 20% of the population is also at risk of transport poverty (Scottish Parliament Cross Party Group on Sustainable Transport, 2025). These socio-economic characteristics mean that any additional cost burden from carbon pricing needs to be managed especially carefully. However, if accompanied by revenue recycling mechanisms designed to alleviate distributional effects, carbon pricing instruments could also become effective tools in addressing fuel poverty. Revenue recycling mechanisms can also remove barriers to investment in low-carbon measures, such as heat pumps, for low-income and vulnerable populations.
Effects of a carbon price on Scotland’s road transport and buildings
In this section, we model the effects of a carbon price on Scotland’s road transport and building sectors, and discuss the implications given the Scottish context outlined above.
Overview of carbon pricing model
To simulate the effects of a carbon price levied on Scotland’s transport and building heating fuels, we constructed a simple investment model. The model simulates the application of a carbon price to transport and heating fuels based on their carbon content. Figure 1 shows the general modelling framework of the model used in this study, which simulates:
- the change in fuel consumption by several “consumer archetypes” in response to changing fuel costs (including the addition of a carbon price)
- decisions by these archetypes to invest into alternative low-carbon technologies under the carbon price.
The above consumer archetypes are defined as: household consumers (differentiated by income level); and commercial consumers for heating (small and large offices, retail spaces, and other non-residential spaces, such as warehouses) and transport (light goods vehicles (LGVs) and heavy goods vehicles (HGVs) for business purposes).
Our model also includes a baseline scenario, which simulates a mix of existing and expected policies on Scotland’s transport and building sectors. The primary variables we model in our carbon pricing scenarios are: emissions abatement, the costs incurred by consumers and fuel suppliers, and the distribution of costs between commercial and residential consumers and across residential consumer income deciles. We cite our findings relative to the baseline scenario, for example additional emissions abatement and additional spending on fuel.
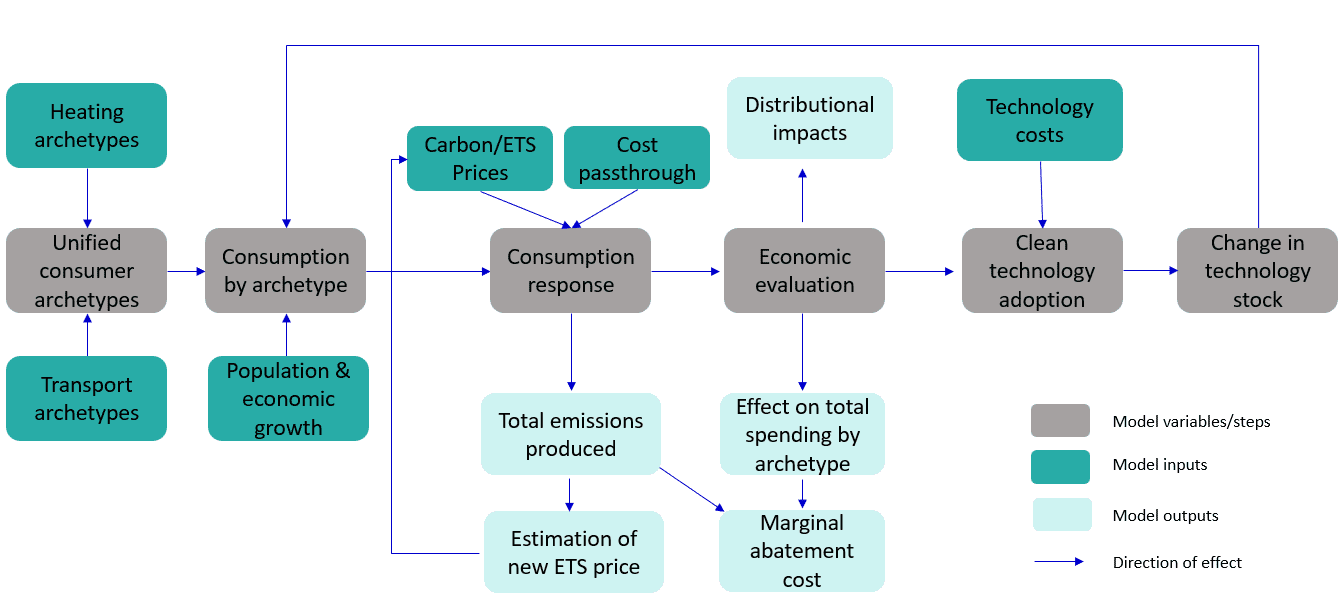
General modelling framework
The model is implemented in Excel. It is initiated through a baseline scenario, which accounts for the impact of existing and expected UK and Scottish policies on consumption behaviour, as well as projected economic and demographic changes in Scotland. We then model a carbon price on top of these policies and projected changes, implemented through a carbon tax (2 scenarios – low tax and high tax rates) and an ETS (2 scenarios – with and without a soft price cap). Full details are provided in Appendix A. This price then generates a consumer response additional to the baseline scenario: adjusting fuel consumption, or investing in a lower-carbon technology if it makes economic sense. The technologies we model are limited to heat pumps and electric vehicles (EVs), given their anticipated prominent role as low-carbon alternatives and the constraints on modelling additional technologies imposed by the simplicity of our model. The carbon price is pre-set in the carbon tax scenarios, and derived from a simulated ETS market in the ETS scenarios. Demand for heating and transport is assumed to be relatively inelastic, more so for heating than for transport. Additional details are provided in Appendix A.
Model scenarios, data sources and assumptions
Our baseline scenario follows the CCC 7th Carbon Budget (7CB) Balanced Pathway trajectory until 2030, which provides the best available holistic picture of policy evolution. After 2030, our baseline scenario diverges from CCC projections, particularly for heating, due to the more conservative assumptions we make about technology uptake. These assumptions are necessary simplifications and broadly mean that in our model low-carbon technologies are only deployed when their incumbent counterparts are retired. Second-hand markets and leasing for vehicles are not considered. Our scenarios also do not assume the full range of supporting policies and regulatory changes that are modelled in the 7CB scenario, which accelerate technology deployment.
Despite this divergence, our baseline scenario remains ambitious, as it includes current and key expected decarbonisation policies (see Appendix A for the full list of policies). This was an intentional design choice, aiming to assess the effect of carbon pricing as part of a policy portfolio, rather than in isolation. However, the ambitious nature of the baseline scenarios means that emissions reductions are already steep before carbon pricing effects are even modelled. This impacts the modelled emissions abatement and costs of carbon pricing instruments (see Section 4.2).
Features of the four carbon pricing scenarios and our main assumptions are detailed in Appendix A. The carbon tax is set to start in 2027, and the ETS in 2028. This was necessary to avoid circularity in the model. The period over which carbon pricing is analysed in this study, referred to as the “study period”, is 2027-2045 (with no ETS in 2027). The low carbon tax rate is set at £25/tCO2 and the higher at £75/tCO2, with the rates selected based on low and high ranges of carbon taxes in EU Member States. In the ETS scenarios, the price is dynamically modelled based on ongoing emissions reductions and pre-set market rules (see Appendix A). Carbon prices in these ETS scenarios reach £110-£133/tCO2 by 2045. For each of the four scenarios, we simulate the effects of a full pass-through rate in which the carbon price is fully borne by consumers, and a 50% rate in which suppliers and consumers each pay half the carbon price.
The data sources used in this model are outlined in Appendix B. They are primarily sourced from national-level statistics and projections (e.g., Climate Change Committee, 2025b). The ETS scenarios are constructed based on the design of the EU ETS2 (see Appendix A).
We make a series of simplifying assumptions in the model. Namely, we do not model non-price factors influencing technology uptake, such as energy literacy. We also model the perceived affordability of alternative technologies indirectly, varying across income groups, and set affordability factors artificially based on income deciles. This is due to challenges with obtaining robust data on affordability of investments across income groups. We use simplified cost curves and S-curve technology deployments. This means that the uptake of heat pumps and EVs in our model follows the S-shaped curve typical of adoption trajectories for low-carbon technologies. The S-shaped curve represents slow adoption whilst new technologies are more expensive than incumbents, then rapid acceleration once cost parity or advantage is reached and finally tapering off as the market approaches saturation. Our model also does not include a minimum acceptable fuel consumption, as for the modelled carbon prices we do not see a reduction in consumption beneath levels required for maintaining quality of life. Further assumptions and detail are available in Appendix A.
Limitations
The simplicity of the investment model is intentional, given how complex it is to model multiple sectors. This imposes a limit on how realistic the simulated effects are. It is intended as a starting point to assess the order of magnitude of potential impact. Detailed explanations of the model limitations are presented in Appendix A.
An important limitation is that because we assume that technologies are only switched when they approach their end of life, rather than over a shorter term, the uptake of new technologies modelled in this study may be relatively conservative. For example, in the real world, a household may replace a car before their current car reaches the end of its life. The complexity of ETS schemes also means that the carbon price trajectory in an implemented scheme may unfold quite differently than set in the modelling. Detailed policy interactions are not modelled due to the inherent complexity. Another important limitation is that we do not model the effect of revenue recycling on technology uptake. This affects the modelled consumer behaviour, as revenue redistribution through low-carbon subsidies could drive more appetite for investment. We do not treat price elasticity of substitution (i.e., responsiveness to differences between the price of fossil and low-carbon alternatives) directly in the model. It is assessed implicitly in the calculations underpinning technology switching by consumer archetypes, however it is an additional limitation. Finally, the modelled impact of carbon pricing will necessarily depend on assumptions about whether agent behaviour is forward-looking or myopic (Allan et al., 2014). In our model, we assume that agents react purely on an economic basis, comparing the costs of different technologies with prices and technology capital costs in the year of investment decisions. In reality, consumers will be at least partially forward-looking, and will make decisions to invest or not in low-carbon alternatives based on more than economics.
Modelling results
Carbon prices
The simulated yearly ETS carbon prices are shown in Appendix C. The carbon prices start at £62.5/tCO2 in 2028 and reach £76/tCO2 and £78/tCO2 in 2030 and £134 and £110 in 2045, for the scenario with and without a price cap, respectively (Table 1). The differences in average carbon price between the ETS scenarios with and without a price cap are minor (£95/tCO2 and £101.7/tCO2, respectively). The price-capped scenario has a much more volatile carbon price due to the MSR alternately releasing and withdrawing allowances to keep the market stable and prices low (see Appendix A). ETS prices in both scenarios are lower than indicated in literature for the EU ETS2 (BloombergNEF, 2025). This is primarily because the baseline scenario is already ambitious.
Scenario | 2027 | 2030 | 2035 | 2040 | 2045 |
Carbon tax £25 | 10 | 25 | 25 | 25 | 25 |
Carbon tax £75 | 25 | 75 | 75 | 75 | 75 |
ETS with price cap | 0 | 76.10 | 99.17 | 115.45 | 133.43 |
ETS without price cap | 0 | 78.31 | 107.43 | 121.53 | 110.06 |
Table 1. Carbon prices under the four modelled scenarios (£/tCO2).
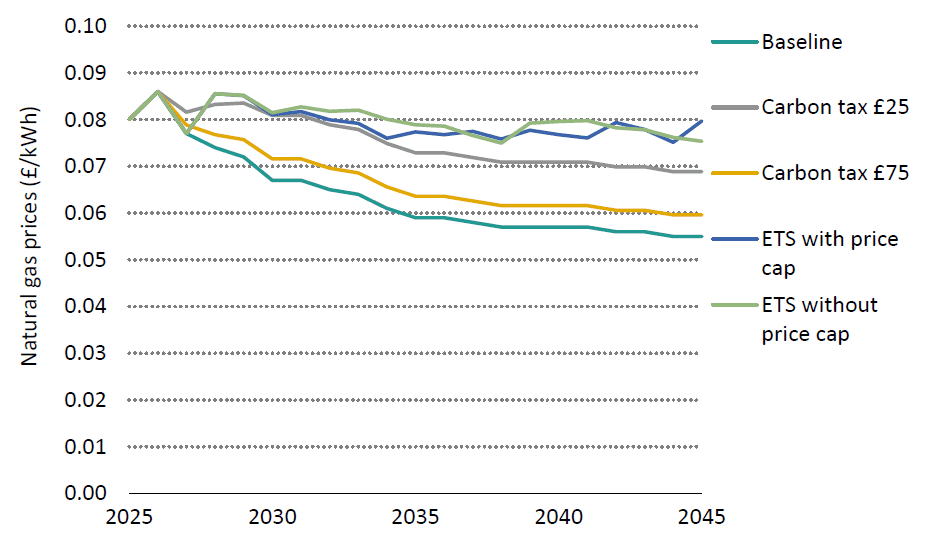
The effects of the above carbon prices on fuel prices are shown in Figure 2 for natural gas prices, where the effect of carbon pricing under the four scenarios is most noticeable. The 50% passthrough rate calculations are not shown for brevity, but are included in Appendix C. The £25/tCO2 carbon tax drives only modest uplifts, whereas the £75/tCO2 carbon tax and ETS scenarios provide stronger upwards pressure on fuel prices. As expected, the ETS scenarios exhibit greater short-term price fluctuations compared to carbon taxes, which comes on top of the existing volatility of natural gas prices. The overall reduction over time in underlying natural gas prices in all scenarios is due to external market forces, primarily the large wave of new liquefied natural gas (LNG) supply which reduces prices over the long term (Department for Energy Security and Net Zero, 2024). Diesel and petrol price trends are also shown in Appendix C.
The simulated carbon prices and their impacts on fuel price levels generate emissions abatement and costs to consumers, manifested differently across income groups. The following sections present the headline modelling results for these parameters.
Emissions abatement
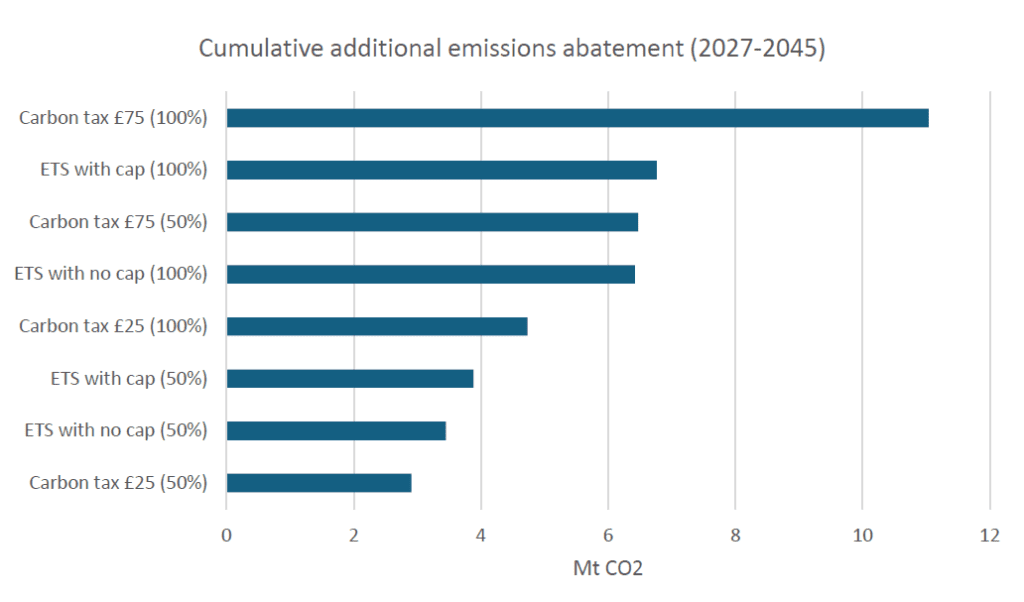
Our model shows a cumulative emissions abatement relative to the baseline scenario of 2.9-11 MtCO2 over the study period (2027-2045). The highest reductions are in the £75 carbon tax scenario with full passthrough, and the lowest in the £25 carbon tax scenario with 50% passthrough (Figure 3). Under the ETS scenarios, cumulative additional reductions are in the range of 6.4-6.8 Mt, with slightly higher reductions in the price-capped scenario driven by higher price volatility especially in later years.
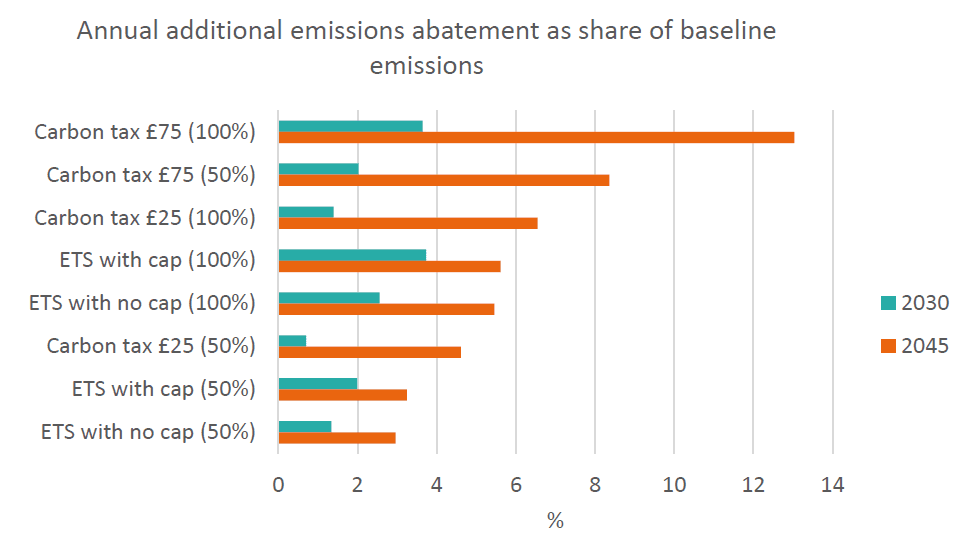
In 2030, aggregate transport and building emissions under the modelled carbon pricing scenarios would be up to 3.7% lower than in the baseline scenario, with the highest reductions in the capped ETS scenario with full pass-through. This is only slightly higher than the £75 carbon tax with full passthrough. By 2045, aggregate emissions are up to 13% lower than the baseline, with the highest reductions in the £75 carbon tax with full pass-through (Figure 4). This indicates that while short-term emissions reductions are comparable between a high-range carbon tax and ETS, in the longer-term carbon taxes lead to a more consistent response to the carbon price signal, compared to ETS schemes where the carbon price fluctuates significantly.
In our model, the primary consumer response to a carbon price is a reduction in fossil fuel consumption, rather than a change in technology, despite demand for fossil fuels being inelastic (i.e., having low responsiveness to price changes). This is due to the relatively small impacts of carbon pricing on the overall levelised cost of heat or transport, as well as investment barriers for heat pumps and EVs. However, several important caveats apply. Firstly, we do not model revenue recycling, which could be used to remove technology investment barriers, for example through subsidies. Secondly, our model assumes that technologies are only replaced at the end of their life, due to data availability challenges. As such, our assumptions around technology switching may be conservative, particularly for EVs, given that vehicles may be replaced before the end of their life. Thirdly, our baseline scenario is already quite ambitious in terms of expectations on technology uptake, being aligned with the 7CB pathway. Finally, consumers will not reduce their fuel consumption indefinitely. While the reduction in consumption in our model does not approach this level, stronger carbon price signals would likely push more consumers towards technology switching, rather than continued reduction in fuel consumption.
In all scenarios, the primary source of emissions reductions is the domestic buildings sector, with cumulative emissions reductions of 2.6-9.5 MtCO2 over the study period. On the other hand, cumulative emissions reductions in the transport sector are at most 1.55 MtCO2 over the study period, which occurs in the £75 carbon tax scenario. This reflects the baseline scenario already seeing significant EV uptake, leaving little room for the carbon price mechanisms to make additional gains.
In all scenarios, transport and heating emissions fall as lower-carbon technologies become cheaper and their uptake accelerates. Emissions persist particularly in domestic heating across all scenarios (Figure 5). Introducing a carbon tax at £25/tCO2 delivers a limited abatement effect compared to the baseline, largely through prompting a reduction in the consumption of petrol, diesel and natural gas. This implies a limited effect of this low tax rate on technology switching. Raising the carbon tax to £75/tCO2 accelerates emissions reductions and delivers the lowest emissions levels in 2045. Material emissions reductions in domestic heating are expected relative to the baseline, due to a reduction in natural gas consumption and some additional uptake of heat pumps. However, even at £75/tCO2, residual emissions remain across all sectors by 2045, suggesting that complementary policies are needed to incentivise a substantially larger rate of technology switching.
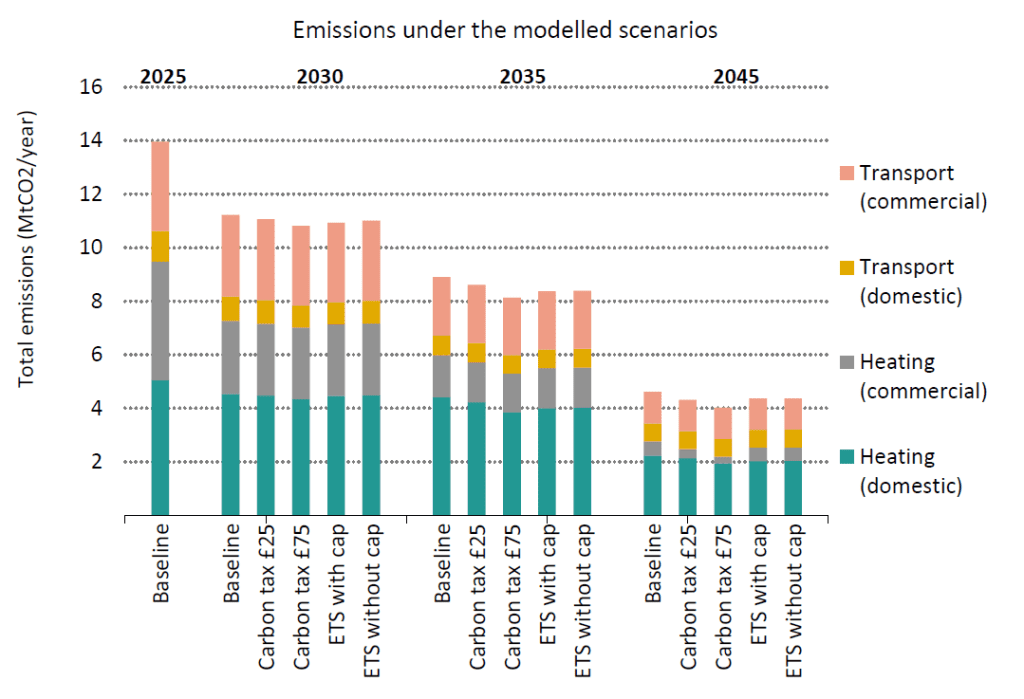
The ETS scenarios sit between the two carbon tax scenarios in terms of overall expected impacts on emissions. The fluctuations in emissions pricing means that the effect on yearly consumption levels alternately increases and decreases. The increase to a constant price under the higher-range carbon tax scenario delivers slightly larger emissions reductions.
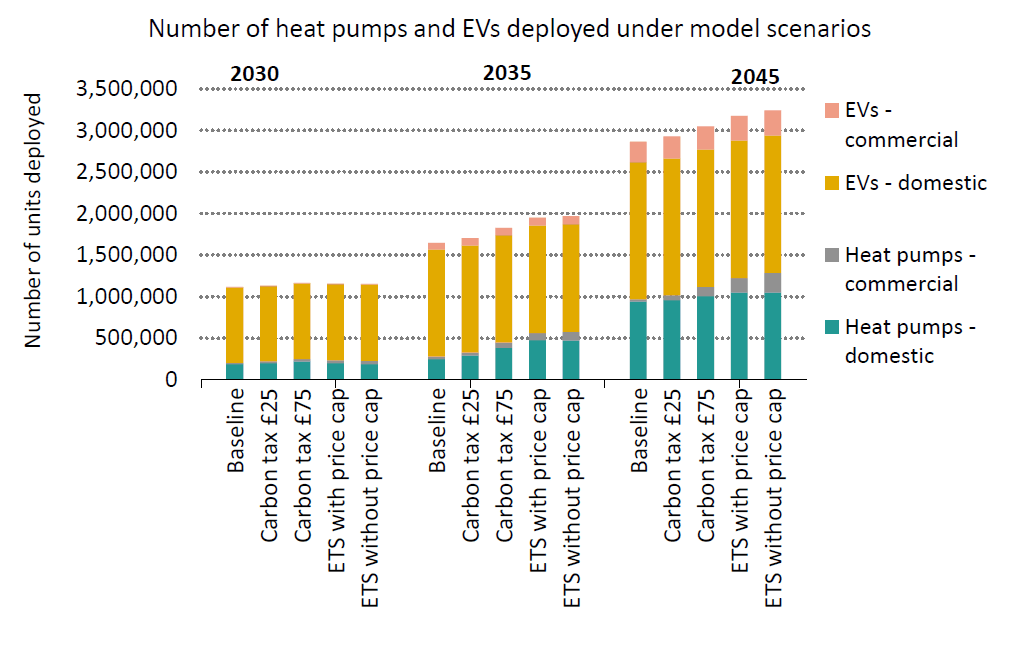
Technology deployment levels underline the differences in abatement between carbon pricing scenarios (Figure 6). Higher carbon prices are expected to have the most notable impact on commercial heating, which sees limited deployment in the baseline scenario. Domestic heat pumps and EVs see some increase in deployment under higher carbon pricing scenarios. However, as indicated above, deployment additional to the baseline is low due to the ambitious nature of the baseline, the relatively small carbon pricing signal, and the assumptions used in this study.
Although our model shows modest additional emissions abatement driven by carbon pricing, such instruments can be valuable complementary policies to an ambitious existing policy mix. In particular, if emissions reductions under the baseline scenario fail to materialise as expected, a continued carbon price signal could incentivise low-carbon switching, insuring against the risk of exceeding Scotland’s carbon budgets.
Cost to consumers
In our model, carbon pricing generates emissions reductions through incentivising investments into low-carbon technologies (heat pumps and EVs) and disincentivising consumption of fossil fuels by raising price levels. Throughout this section, “investment” refers to investment by consumers in low-carbon technologies. The effectiveness of each carbon pricing scenario will depend on the balance between these two effects and how they change over time. As indicated in Section 4.2.2, consumers’ primary response to a carbon price is to reduce their fuel consumption, rather than invest in low-carbon technologies. This is reflected in relatively stable levels of investment under the carbon pricing scenarios over across the time period. Investment levels are similar to the baseline scenario under carbon taxes, but the ETS scenarios have lower levels of total capital investment by consumers than the carbon tax scenarios and the baseline scenario. This is largely due to the ETS scenarios incentivising larger uptake of heat pumps in the domestic sector pre-2030 whilst the subsidy for heat pump is modelled at current levels of £7,500 per unit (see Section 4.4).
Whilst the scenario with largest capital investments (the £75 carbon tax with full pass-through) does not generate a marked increase in total investment in low-carbon technologies relative to the baseline, it does drive a reduction in fossil fuel consumption. However, this reduction is not enough to offset the additional fuel costs due to the carbon price. As such, fuel consumption costs paid by consumers increase by £7.8 billion/year compared to the baseline. The domestic heating sector accounts for nearly 50% of this additional cost, reflecting the lower price elasticity and the baseline uptake already incentivised through heat pump subsidies. This is an undesirable effect, as it will mean that consumers who cannot switch their heating systems yet are forced to pay a higher fuel price, or reduce their heating use. Investment barriers are likely a significant factor in the observed low switching rates, and will be particularly important in the lowest income deciles (see Section 4.2.4). We note again that some of the restrictions on technology switching reflect assumptions built into the model such as switching only occurring when the existing technology reaches its end of life. As such, these findings may be conservative. The preference to reduce fossil fuel consumption rather than invest in low-carbon technologies occurs across all carbon pricing scenarios.
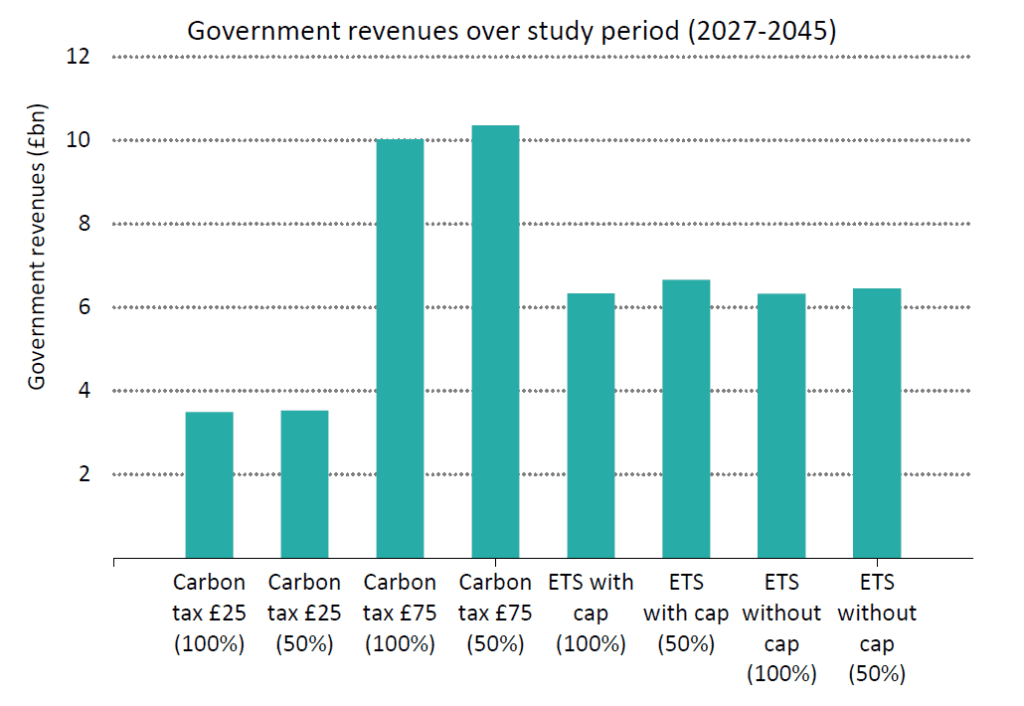
The different carbon pricing levels also translate into different levels of government revenue raised through the respective schemes (Figure 6). Those with 50% passthrough generate slightly higher revenues, given that fuel suppliers are assumed to not reduce their sales and simply pay their half of the carbon costs. Between the scenarios themselves, the £75 carbon tax with 50% passthrough generates the highest revenue to government (exceeding £10 billion across the total time period), higher than the ETS scenarios (£6-6.5bn), despite the latter having higher average carbon prices over the study period. This is because the ETS scenarios drive a sharper reduction in consumption in earlier years, reducing the effective tax base, whereas the £75 carbon tax does not reduce consumption as sharply, therefore consumption and associated revenues stay higher for longer. Whilst not explicitly modelled here, recycling these tax revenues to support targeted interventions could enable an acceleration in emissions reductions by removing some of the cost barriers of low-carbon technologies (see Section 4.5.2).
The overall cost per tonne of CO2 abated in each scenario is the additional system cost (investment and consumption costs are borne by consumers and suppliers), divided by the additional emissions reductions. Under these conditions our model finds that the system abatement costs range from £591/tCO2 (£25 carbon tax with 50% pass-through) to £1,217/tCO2 (uncapped ETS scenario with 50% pass-through). These costs include the carbon costs paid by a population which is assumed to be relatively demand-inelastic. As such, they are not directly comparable to the abatement costs cited in other literature for the UK. These costs also accrue above baseline where substantial emissions reductions have already been realised, and are not supported through revenue recycling. This preliminary finding indicates that revenue recycling and complementary policies will be key to enable the full cost-effectiveness of carbon pricing instruments as emissions reductions tools.
Distribution of costs
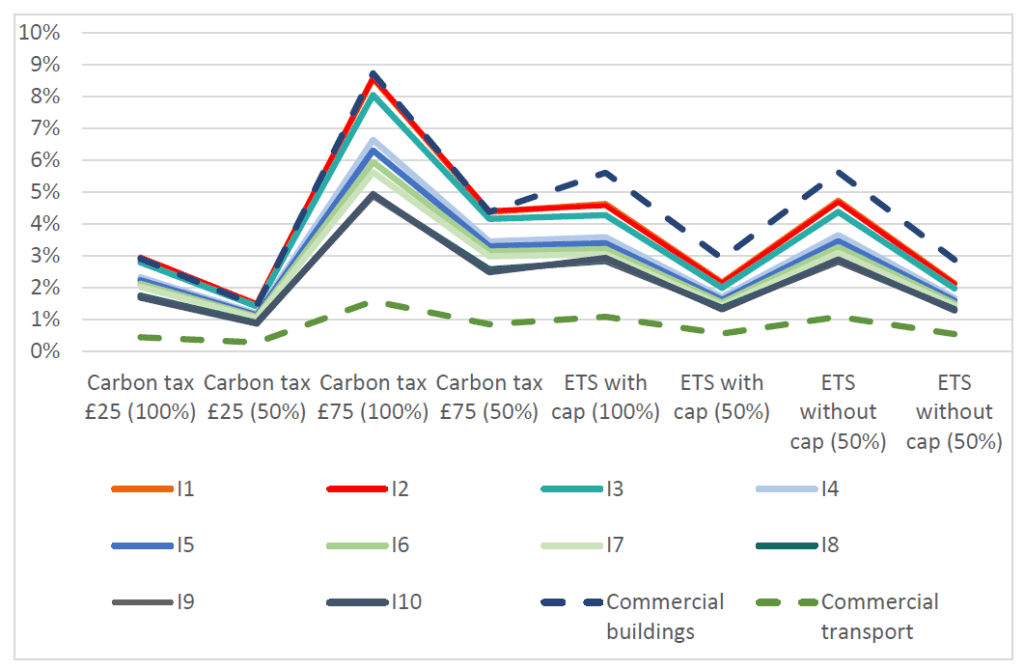
This section examines the distribution of the modelled costs across commercial and residential consumer archetypes, and across residential consumer income archetypes[1]. The consumer costs are materially different across incomes and archetypes, due to variations in the total energy consumption, travel footprint and ability to afford the high upfront costs of low-carbon technologies. Across all scenarios, commercial buildings and the lowest income deciles are the archetypes which consistently incur the highest additional consumption costs relative to the baseline (Figure 7). The highest difference in costs across all archetypes is in the £75 carbon tax with full passthrough – as much as 8% higher than the baseline costs. Domestic consumers in higher income deciles see a much smaller impact on their fuel bills, as despite higher energy consumption they are already more likely to own an electric vehicle and/or heat pump and can more easily switch to low-carbon technologies. Commercial transport also sees a lower impact across all carbon pricing scenarios, as diesel vehicles are more prominent and carbon pricing leads to a smaller percentage increase in cost under future price scenarios.
Impact on emissions
This section analyses the implications of the model results for emissions abatement and modelled changes in the fuel mix.
Relative to 2023, when Scotland’s GHG emissions were 39.6 MtCO2e (Scottish Government, 2025b), a policy mix aligned with the CCC’s 7CB decarbonisation trajectory for Scotland can keep both buildings and transport emissions within Scotland’s carbon budgets, regardless of whether carbon pricing is in place. Carbon pricing slightly enhances these emissions reductions. Our modelled results show emissions reductions between 2027 and 2045 lower than the 16.3-25.8% reductions in transport and building emissions modelled by others at UK level (Sturge et al., 2024), but they are similar to those envisaged in the design of the EU ETS2 (European Commission, 2021). It is worth highlighting that additional measures, such as energy efficiency or modal shift, represent lower-hanging fruit that in a real carbon pricing environment may be further incentivised. As our simple model excludes these measures, it may underestimate emissions abatement.
The primary driver of emissions abatement under carbon pricing is a reduction in fuel consumption to avoid carbon costs. This mostly occurs in the residential buildings sector, where modelled heating demand is reduced by an additional 525-2,444 GWh per year on average, relative to the baseline scenario. The highest additional demand reductions are in the £75 carbon tax and the uncapped ETS scenario (both with 100% passthrough), and the lowest in the £25 carbon tax scenario with 50% passthrough. This demand also shifts from natural gas to heat pumps, although additional effects compared to the baseline scenario are minor (Table 2 and Table 3). Pricing emissions from heating fuels drives the deployment of an additional 11,000-115,000 heat pumps on average each year, relative to the baseline scenario. The highest deployment (115,000) is in the capped ETS scenario. If the capital cost of heat pumps is further reduced by recycling carbon pricing revenue (see Section 4.5.2), uptake could be further increased.
Fuel | 2025 | Baseline, 2045 | Carbon tax £25, 100%, 2045 | Carbon tax £25, 50%, 2045 | Carbon tax £75, 100%, 2045 | Carbon tax £75, 50%, 2045 |
Gas | 47% | 22% | 23% | 24% | 21% | 23% |
Petrol | 28% | 5% | 5% | 5% | 5% | 5% |
Diesel | 14% | 6% | 6% | 6% | 6% | 6% |
Electricity | 11% | 67% | 66% | 65% | 68% | 66% |
Fuel | 2025 | Baseline, 2045 | ETS with cap, 100%, 2045 | ETS with cap, 50%, 2045 | ETS without cap, 100%, 2045 | ETS without cap, 50%, 2045 |
Gas | 47% | 22% | 21% | 22% | 21% | 22% |
Petrol | 28% | 5% | 5% | 5% | 5% | 5% |
Diesel | 14% | 6% | 6% | 6% | 6% | 6% |
Electricity | 11% | 67% | 68% | 67% | 68% | 67% |
On the other hand, modelled results suggest the transport sector only weakly responds to a carbon price. Overall, transport energy demand is reduced by an additional 52-390 GWh per year on average, with the highest additional demand reductions in the uncapped ETS scenario with 100% passthrough, and the lowest in the £25 carbon tax scenario with 50% passthrough. Petrol and diesel consumption change negligibly relative to the baseline scenario. This contrasts with some literature findings on the relative ease of changing travel behaviour compared to heating systems (Fazekas et al., 2021). In our case, the modelled carbon price levels do not – in isolation – significantly shift the relative cost of car ownership between EVs and internal combustion engine vehicles (ICEs). Not accounting for second-hand car sales in the model may also contribute to somewhat lower estimates of additional switching to EVs. Emissions reductions in commercial transport are primarily from light goods vehicles (LGVs), but are marginal compared to the baseline scenario where the fleet already switches almost fully to EVs by 2045.
Although the modelled technology uptake driven by carbon pricing is relatively low, it is worth highlighting other environmental effects which they may imply. An increased uptake of EVs may add to existing challenges in end-of-life battery disposal recycling. The baseline scenario foresees an uptake of 24.4 million EVs across the study period, reducing domestic road transport emissions to nearly zero by 2045. Over 1 million of these will be approaching the end of a typical 20-year life by 2045, and ensuring their reuse and recycling will be key, particularly if they are deployed in rural or island areas where appropriate waste management systems may be scarcer. In the buildings sector, increased heat pump installation and maintenance must be appropriately managed to prevent refrigerant leaks and other life-cycle environmental impacts (International Energy Agency, 2022).
While our modelled carbon pricing instruments deliver limited additional emissions abatement, it is worth highlighting that this does not diminish their role in supporting existing decarbonisation policies. Indeed, as highlighted in Section 4.2, our already-ambitious baseline scenario is partially responsible for the muted investment response to carbon pricing. If the policies assumed in the baseline scenario are discontinued (or if future ones fail to materialise), carbon pricing could act as a “backstop” policy to continue incentivising a switch to low-carbon heating and transport alternatives. Furthermore, as mentioned in Section 4.2.3, revenue recycling (which we do not model) could further incentivise investments in low-carbon technologies and increase the associated emissions abatement.
Cost to consumers
In this chapter, we analyse the consumption and investment costs incurred by consumers under the selected carbon pricing scenarios. Our analysis is not a commentary on the cost-effectiveness of carbon pricing, but rather it sets out the costs to consumers in the absence of revenue recycling. It serves to provide a first indication of the magnitude of consumer payments under carbon pricing, and to reinforce the importance of revenue recycling (further addressed in Section 4.5.2).
As shown in Section 4.2.3, in our carbon pricing scenarios the total payments by consumers per tonne of abated CO2 range from £591 in a £25 tax with 100% passthrough scenario to £1,217 in an uncapped ETS scenario with 50% passthrough. Payments are higher in scenarios with 50% passthrough rates because suppliers, who pay half of the carbon costs in these scenarios, are assumed to not have the ability to reduce their emissions. Across scenarios with 100% passthrough, payments are higher in ETS scenarios, reflecting the effect of price volatility on costs. As ETS prices fluctuate, overall consumption responses are weaker than under a steadily rising carbon price that reaches a peak.
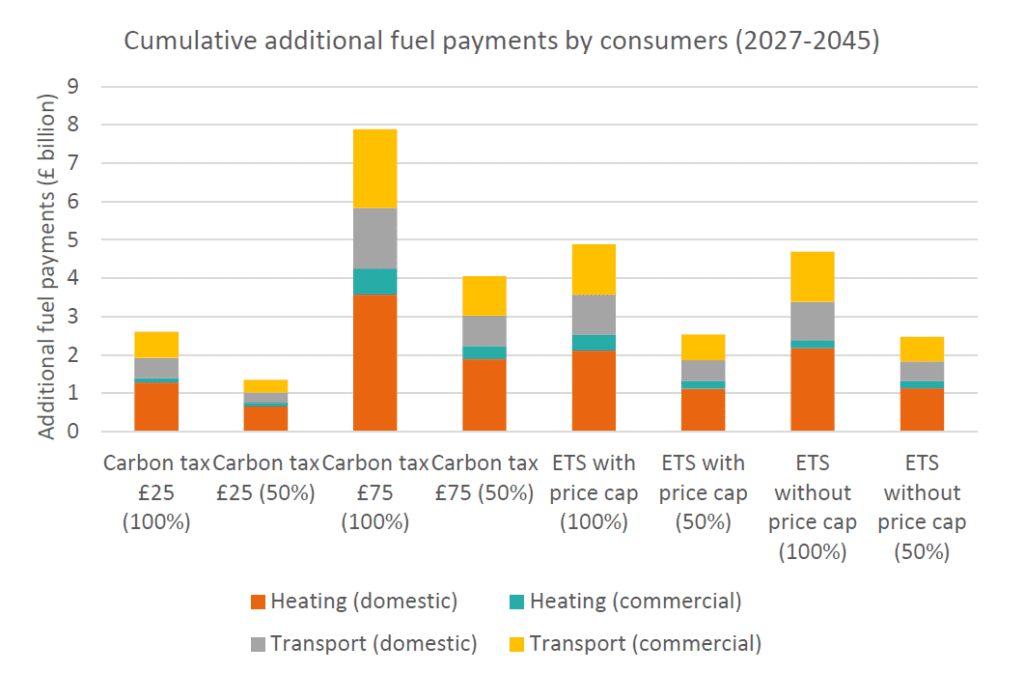
Consumer costs comprise the additional fuel costs paid by consumers who do not switch their heating or transport technologies, and the cost of investments in low-carbon alternatives by those who do decide to switch under the pressure of a carbon price. The total cumulative amount that consumers in Scotland pay under the selected carbon pricing scenarios ranges between £1.5 billion and £8 billion over 2025-2045, 0.5-3.7% higher than in the baseline. The highest total cost is in the £75 carbon tax scenario with full cost pass-through. The majority share of these consumer payments (82-83% in all scenarios) is for additional fuel costs, and as such is a transfer to the Scottish Government, collected either as taxes or payments for ETS permits. As such, the total costs to consumers are not comparable to official GHG abatement costs for the UK, which are much lower (Climate Change Committee, 2019).
Crucially, revenue redistribution, which we did not model, could reduce the ultimate net cost to consumers of carbon pricing. As indicated by the majority share of fuel costs in consumer costs, if revenue is not recycled, under a carbon price consumers would mostly reduce their consumption, rather than invest in alternatives. However, the savings from demand reduction only partially cover the carbon cost of fuels, leading to additional fuel payments of between £1.3 billion and £7.8 billion. What proportion of these additional fuel costs is offset for consumers depends on whether and how carbon pricing revenues is recycled.
When it comes to the consumer investments in low-carbon alternatives, differences between the carbon pricing scenarios and the baseline scenario are minor. In all carbon pricing scenarios, additional investments primarily occur in the heating sector, as opposed to the transport sector. This is primarily because the baseline scenario already shows strong investment in EVs, due to an assumed fall in EV costs for and a ban on new ICE purchases from 2030 (see Section 4.1.2). Additional investments in clean heat are higher than in transport, and are highest in the commercial buildings on a cumulative basis across the study period. This is because residential heat pump deployment, which carbon pricing does encourage, primarily occurs in the short-term and benefits from the heat pump subsidy assumed in our model. Specifically, carbon pricing incentivises earlier heat pump adoption whilst the subsidy is still at its current value of £7,500. We model a gradual phase out of the subsidy from 2029 onwards, which slightly increases the investment cost to consumers over time.
In the baseline scenario a larger stock of fossil technologies remains until the mid-2030s, when the heat pump subsidy begins to taper off, thus increasing heat pump unit costs, and the modelled phase-out of gas boilers and ICE sales triggers rapid technology switching. Thus, in the baseline scenario investment in heat pumps is higher because it occurs later and from a larger pool of fossil technologies.
This may indicate that the earlier technology switching incentivised by carbon pricing, particularly in ETS scenarios, could relieve consumers of a potentially steep investment cost due to the abrupt ban on fossil technologies and tapering off of heat pump subsidies as modelled in this study. However, the limited uptake of heat pumps in recent years indicate that cost is not the only consideration that consumers are accounting for when making decisions about domestic heating.
The above model assumptions mean that in the ETS scenarios, where carbon prices are highest, cumulative investment by consumers in low-carbon technology over the 2027-2045 period is lower than in the baseline scenario, with most of the difference due to the timing of residential heat pump deployment. In the carbon tax scenarios, additional investments in EVs and heat pumps across 2025-2045 are £69 – £119 million, or on average £4 million – £6 million annually. This is on top of the baseline scenario, where average annual investment costs reach £2.3 billion per year. As with additional fuel costs, the ultimate net cost to consumers of investing in low-carbon technologies depends on revenue recycling mechanisms – for example, by using some of the revenues to subsidise (or continue subsidising) heat pumps or EVs.
Beyond what consumers pay, technology switching under carbon pricing will require additional investments in supporting infrastructure. Increased electrification from heat pumps will necessitate wider grid and energy network investments. Using estimates from Love et al (2017), peak demand from households due to the use of heat pumps could rise by up 0.2 GW compared to the baseline scenario. Furthermore, local distribution networks will need to be reinforced to avoid overloading infrastructure. A baseline policy scenario aligned with the CCC 7CB and enhanced with carbon pricing could require an increase in substation capacity of up to 21 percentage points higher in the capped ETS scenario with full cost pass-through, compared to the baseline scenario. This is based on a conservative assumption that an additional 20% uptake of heat pumps requires additional 14% increase in substation capacity. These infrastructure costs were not included in our model, but are essential to support high electrification and decarbonisation pathways.
Other cost implications of carbon pricing schemes should not be discounted. For example, the administrative cost to the Scottish Government of implementing such schemes. This cost is not yet known, however administrative complexity and associated burden may be higher under an ETS. The administrative costs of administering the UK ETS were estimated at around £7 million to government and £4 million to businesses (Department for Business, 2020). In case of a carbon tax, government administrative costs are likely to be compared to those of an ETS, as a new tax could be administered using existing government structures.
The above findings do not reflect the broader economics of carbon pricing, but focus on the gross additional consumers payments for fuels and for investing in low-carbon technologies, under a modelled carbon price. In the following section, we present how these additional payments vary across groups, and reflect on revenue redistribution mechanisms to alleviate consumer cost impacts.
Social implications
In this section, we present the cost to Scottish society of the modelled carbon prices, discuss distributional impact, and outline potential mechanisms to alleviate this impact.
Social and distributional implications
Scottish consumers will bear most of the additional cost generated by carbon pricing. The ultimate costs they bear will depend on how much of the carbon cost is passed through by fossil fuel suppliers. The level of cost pass-through is ultimately a business decision and difficult to elucidate in a simple model.
The main additional cost faced by consumers under our modelled carbon pricing schemes is the carbon cost of the fossil fuels they continue to consume. For context, this is a relatively minor share of the baseline scenario consumer costs – on average 0.79%-4.44% on a yearly basis. On a per-household basis, the average yearly consumption costs due to carbon pricing in the four modelled scenarios are £29-£172 (Appendix C, Table 9), with the highest costs incurred under the £75 carbon tax with full cost passthrough. These additional costs are relatively evenly split between heating and transport (60% and 40%, respectively). Households are the hardest-hit by heating carbon costs, while transport costs are slightly higher for commercial customers than domestic ones.
The distribution of costs across household income groups shows that low-income groups are likely the hardest hit, in line with findings from our evidence review. Averaged across 2027-2045, the lowest-income households which keep using natural gas are estimated to pay 0.2%-1.4% of their assumed median income (£10,000/year) annually in additional carbon costs relative to the baseline, compared to 0.1%-0.2% in the highest-income group (Appendix C, Table 10). In transport, the differences are less pronounced, however the second- and third-lowest income groups (household income up to £30,000/year) are the most impacted (Appendix C, Table 11). They are estimated to pay on average 0.2%-0.3% of their median income in additional petrol costs. Our findings thus indicate a higher distributional impact in the heating sector, as found in studies on the EU ETS2 (European Commission, 2021).
Fuel poverty is a challenge in Scotland, and in our baseline scenario, lower-income groups already spend a disproportionate share of their income on heating and transport fuels. Without mitigation measures, both ETS and carbon taxes risk deepen this disproportion compared to the baseline scenario, most prominently in the £75 carbon tax scenario. As such, again without mitigation, carbon pricing may risk increased fuel poverty even with reduced consumption to cope with carbon prices. The ETS price cap does not change the difference between the lowest and highest income groups in what proportion of their income they spend on natural gas and petrol, indicating that a price cap on its own will not reduce the disproportionate burden on low-income households.
Our model finds substantial potential for emissions reductions arising from technology switching in low- and middle-income groups (up to £50,000/year), largely due to the fact that they have higher shares of natural gas boilers than higher-income groups. To achieve this potential, low- and middle-income groups will require targeted support for investing in low-carbon alternatives. They may also face non-cost barriers such as restrictions by landlords on heat pump installations, given they are more likely to rent rather than own their homes Scottish Government, 2023). Specific support may also be required for rural, highlands and island populations, where fuel poverty is already more pronounced (Scottish Government, 2021, Wilson et al.,2024), and switching to low-carbon transport faces more infrastructure barriers (Thomson et al., 2023).
The cost of any carbon pricing scheme comes against the backdrop of an ongoing cost of living crisis in the UK. Average gas and electricity bills in Scotland rose steeply in 2022 and remain high – approx. £948 and £2,250 per year, respectively (UK Government, 2025b). However, Scottish citizens are generally positive or neutral towards short-term climate policy (Scottish Government, 2025), broadly supportive of stronger net-zero policy, and generally support progressive taxation to fund public services. Some evidence suggests a slim majority (58%) are prepared to support a small additional cost due to net zero policy (Hawkey, 2024). This could indicate some support for carbon pricing, but will be heavily dependent on actual willingness to pay and will vary substantially across income groups.
Revenue recycling mechanisms
The modelled carbon pricing scenarios could potentially raise £3.5-£10.3 billion revenues for the Scottish Government over the study period (see Figure 8 and Appendix C, Table 12). The available evidence suggests recycling this revenue would be a key requirement for Scottish carbon pricing, to avoid disproportionately impacting low-income and other vulnerable groups, as well as to improve political saliency and public acceptability. Various revenue recycling options are available, each with advantages and drawbacks (see Appendix D, Table 15). Any planned use of government revenue for supporting consumers will need to account for a gradual decrease in consumption of fossil fuels reduces in response to the carbon price, which will affect the carbon price revenues as well as potentially other revenues, such as transport fuel duty. Revenue recycling could also be important for social feasibility, as despite being generally supportive of climate action and progressive taxation, the Scottish public cites cost as one of the main barriers to climate action (Scottish Government, 2025; Oxfam, 2024; Hawkey, 2024).
A combination of revenue redistribution methods is likely preferable (Streicher, Kettner and Schratzenstaller, 2025), for example short-term financial support to vulnerable groups, coupled with targeted subsidy schemes and public investments in infrastructure and public transport. Targeted financial compensation in the form of lump-sum payments, rebates, or dividends could be suitable options. They could be regionally differentiated or means-tested on a constellation of factors including income, but also relative risk of transport or fuel poverty, or overall deprivation risk. A focus on rural and island areas would be needed to mitigate the higher prevalence of fuel poverty, however, urban areas will also require attention given their higher prevalence of severe poverty (Scottish Government, 2025d)) and higher emissions from heating and transport (Department for Transport, 2023).
If some of the modelled government revenues are targeted for financial support to specific groups, the remaining revenue could contribute to subsidising clean heat and transport technologies or investing in enabling public infrastructure. For illustration, if the 2027 revenue from a £75 carbon tax with full passthrough were redistributed to cover the additional carbon costs of fossil fuel consumption in Scotland’s five lowest-income classes, enough revenue would remain to fully subsidise the purchase of over 19,000 domestic heat pumps or over 7,700 EVs. Regional targeting of investment can increase public spending efficiency. For example, the government may wish to subsidise EVs in deprived rural areas with high transport emissions, such as West Dunbartonshire, but invest in public transport in deprived urban areas with high transport emissions, such as Glasgow City or North Ayrshire (Department for Transport, 2023).
Conclusions
Our model shows that carbon pricing could drive an additional 2%-13% in annual emissions abatement in Scotland’s road transport and building heating, by 2045. The highest abatement is expected in a £75 carbon tax scenario with 100% passthrough, which would provide a stable carbon price signal estimated to reduce emissions by an additional 11 Mt over the 2027-2045 period, compared to the baseline. ETS instruments also generate abatement, but their greater inherent price volatility means overall abatement is lower. In all scenarios, the primary driver of emissions reductions is a reduction in fossil fuel demand, with limited switching to low-carbon alternatives, compared to the baseline. This is strongly driven by the fact that our baseline already includes ambitious decarbonisation policies, aligned with CCC projections. However, if this baseline decarbonisation fails to materialise, a continued carbon price signal could encourage low-carbon switching and insure against the risk of exceeding carbon budgets.
The particularities and assumptions of our model significantly influence the direct costs incurred by consumers under carbon pricing. For each tonne of CO2 abated, we estimate that consumers and suppliers incur direct costs of between £591 (£25 tax with 50% passthrough) and £1,217 (uncapped ETS with 50% passthrough) over the study period (2027-2045). These are not abatement costs, rather they are the sum of investments in low-carbon alternatives by consumers who deem them economically preferable and own a technology close to its end of life, and the carbon costs consumers and suppliers pay if they continue using and selling fossil fuels, respectively. The latter carbon costs are the bulk of consumer payments, because in our model consumers primarily respond to the carbon price by reducing their demand. Some of this is due to the already-ambitious baseline scenario. It is also important that we did not model revenue recycling, which if implemented could increase technology switching, particularly in low-income groups. The potential for non-economic benefits, such as improved health outcomes, is also not modelled.
Low-income consumers pay the most in additional fuel costs as a share of their income, in our modelled carbon pricing scenarios. Households with income below £10,000/year could be spending 1.4%-8% more on fuel than in the baseline scenario. Most of these consumers continue using fossil fuels, and pay the carbon price, because in our model they cannot afford to invest in heat pumps or EVs. The £75 carbon tax with full pass-through has the highest distributional impact, both in terms of the added spending on lowest-income households, and the discrepancy in spending between low- and high-income households.
This distributional impact could be mitigated if carbon pricing revenue is recycled and targeted at low-income consumers. Our model shows that government revenues could reach £10 billion over the 2027-2045 period. We only assess the impact of putting a price on carbon, without considering the subsequent use of carbon pricing revenues. Such revenue use would alter the outcomes of our model. For example, reducing consumer costs and incentivising additional investments, thus abating emissions further. Revenue recycling could be targeted as support to low-income households, complemented by public investments in enabling infrastructure. Revenue recycling could also be important for social feasibility.
Lessons learned
Carbon pricing schemes have been applied around the world, but there is still significant uncertainty around their impact on emissions and consumers. Broadly, they are shown to contribute to emissions reductions in sectors where decarbonisation is progressing more slowly, such as transport and building heating. The literature further indicates that carbon pricing on these sectors risks being regressive in high-income countries, and that its performance depends on how their revenues are recycled. To avoid the impact being regressive, revenue recycling would need to target low-income groups more at risk of fuel poverty and facing barriers to switching to low-carbon alternatives. Further research into the potential economic benefits of carbon pricing revenues is an important next step.
Our findings indicate that carbon pricing could enhance Scotland’s emissions reduction trajectories in road transport and building heating. While additional emissions reductions are modest if existing policies are already ambitious, carbon pricing instruments can be key supporting policies, incentivising decarbonisation if other policies fail to deliver. A focus on high and steady carbon prices, whether through a flat tax rate or an appropriately designed ETS, offers the most significant emissions reduction potential. However, the cost to Scottish consumers imposed by carbon pricing instruments will need to be mitigated. More precisely, reducing barriers to investment in low-carbon technologies can ensure that consumers do not just respond by restricting their fuel demand. This is particularly the case for low-income households, for whom targeted support would be required to alleviate distributional impact – which is highest when carbon prices are high and steadiest.
This research is a first step in assessing the potential of carbon pricing instruments, and is necessarily a simplified representation of possible effects. Future research should examine a wider range of potential low-carbon alternatives in heating and road transport, including heat networks and biomass heating in buildings, and biofuels and e-fuels in transport. Refining assumptions around investment barriers would also increase the reliability of our results. Modelling the distributional impact across non-income categories (e.g., rural vs urban) and the effect of revenue recycling would also sharpen recommendations on the ultimate design of carbon pricing schemes. Future research could also assess the administrative costs associated with carbon tax and ETS schemes, based on the likely level of oversight and intervention required by the Scottish Government.
How carbon pricing helps Scotland achieve its 2045 climate targets is ultimately dependent on the design of these instruments, and how they fit into the existing policy environment. Ultimately, the role of carbon pricing is to provide a signal as to the true cost of emitting CO2 – when other policies come up short, it can insure against losing traction in emissions reductions. How this happens, and how effectively it incentivises consumer change, depends on the careful investigation of complementarities and trade-offs. This is an essential topic for future research to deepen our understanding of how carbon pricing can help achieve Scotland’s 2045 climate targets.
References
Allan, G. et al. (2014) “The economic and environmental impact of a carbon tax for Scotland: A computable general equilibrium analysis,” Ecological Economics, 100, pp. 40–50. Available at: https://doi.org/10.1016/J.ECOLECON.2014.01.012.
Almström, P., Anderstig, C. and Sundberg, M. (2024) “Effects on sectors and regions of a carbon tax increase in Sweden: analysis with an SCGE model,” Annals of Regional Science, 73(2), pp. 731–756. Available at: https://doi.org/10.1007/s00168-024-01269-y.
Arcila, A. and Baker, J.D. (2022) “Evaluating carbon tax policy: A methodological reassessment of a natural experiment,” Energy Economics, 111. Available at: https://doi.org/10.1016/j.eneco.2022.106053.
Austrian Court of Audit (2021) Austrian Court of Audit (Rechnungshof) statement on the 2022 eco-social tax reform. Available at: www.rechnungshof.gv.at.
Bach, S. et al. (2023) “Facilitating the transport and heating transition: strengthen carbon pricing, introduce a climate dividend, and reduce adaptation costs.” Available at: https://doi.org/10.18723/diw_dwr:2023-23-1.
Barrez, J. and Bachus, K. (2023) Public Acceptability of Carbon Pricing A Literature Review. Available at: https://hiva.kuleuven.be/en/research/theme/climateandsd/p/reports-environment/literature-report-public-acceptability-of-carbon.pdf (Accessed: February 13, 2026).
BloombergNEF (2025) EU ETS II Pricing Scenarios Balancing Cuts and Costs.
Bretschger, L. and Grieg, E. (2024) “Carbon taxes, CO2 emissions, and the economy: The effects of fuel taxation in the UK,” Energy Policy, 195, p. 114359. Available at: https://doi.org/10.1016/J.ENPOL.2024.114359.
Bruvoll, A. and Larsen, B.M. (2002) Greenhouse gas emissions in Norway Do carbon taxes work? Available at: http://www.ssb.no.
Canadian Energy Centre (2023) Assessing the Impact of the Carbon Tax on Business Costs in Various Industries in British Columbia (factsheet). Available at: https://www.canadianenergycentre.ca/wp-content/uploads/2023/08/CEC-Fact-Sheet-93-V2-Aug-17-2023.pdf (Accessed: November 25, 2025).
Climate Change Committee (2025a) Scotland’s Carbon Budgets. Available at: https://www.theccc.org.uk/publication/scotlands-carbon-budgets/ (Accessed: November 26, 2025).
Climate Change Committee (2025b) Scotland’s Carbon Budgets advice – Charts and data. Available at: https://view.officeapps.live.com/op/view.aspx?src=https%3A%2F%2Fwww.theccc.org.uk%2Fwp-content%2Fuploads%2F2025%2F05%2FCharts-and-figures-for-the-Scotland-Target-Advice.xlsx&wdOrigin=BROWSELINK (Accessed: January 15, 2026).
Committee on Climate Change (2019) Net Zero – The UK’s contribution to stopping global warming . Available at: https://www.theccc.org.uk/publication/net-zero-the-uks-contribution-to-stopping-global-warming/ (Accessed: January 21, 2026).
Department for Business, E.& I.S. (2020) The Future of UK Carbon Pricing Impact Assessment.
Department for Energy Security and Net Zero (2024) Fossil fuel price assumptions. Available at: https://www.gov.uk/government/collections/fossil-fuel-price-assumptions (Accessed: January 22, 2026).
Department for Energy Security and Net Zero (2025) National Energy Efficiency Data-Framework (NEED): consumption data tables 2025. Available at: https://www.gov.uk/government/statistics/national-energy-efficiency-data-framework-need-consumption-data-tables-2025 (Accessed: January 22, 2026).
Department for Transport (2023) Greenhouse gas emissions from transport by local authority. Available at: https://maps.dft.gov.uk/ghg-emissions-by-local-authority/index.html (Accessed: January 15, 2026).
Department for Transport (2024) TAG UNIT M2.1: Variable Demand Modelling. Available at: https://www.gov.uk/transport-analysis-guidance-tag (Accessed: December 1, 2025).
Deutsche Emissionshandelsstelle (2025) Understanding national emissions trading. Available at: https://www.dehst.de/EN/Topics/nEHS/understanding-nEHS/understanding-nehs_node.html#doc286158bodyText11 (Accessed: December 5, 2025).
Emissions Trading Authority at the German Environment Agency (2025) 2023 Emission Situation in National Emissions Trading System (nEHS). Available at: www.dehst.de/English.
European Commission (2021) Commission Staff Working Document, Impact Assessment Report, SWD(2021) 601 final.
European Commission (2025) Commission proposes targeted adjustments to the Market Stability Reserve Decision to support a smoother start for ETS2. Available at: https://climate.ec.europa.eu/news-other-reads/news/commission-proposes-targeted-adjustments-market-stability-reserve-decision-support-smoother-start-2025-11-27_en (Accessed: December 3, 2025).
European Commission (no date) ETS2: buildings, road transport and additional sectors. Available at: https://climate.ec.europa.eu/eu-action/carbon-markets/ets2-buildings-road-transport-and-additional-sectors_en (Accessed: January 21, 2026).
European Environmental Bureau (2022) Lessons from the German Emissions Trading System for buildings and road transport.
Fæhn, Karlsen and Kaushal (2024) “Norwegian abatement targets for 2035 : a CGE analysis.” Available at: https://savearchive.zbw.eu/termsofuse (Accessed: December 11, 2025).
Fairbrother, M. and Rhodes, E. (2023) “Climate policy in British Columbia: An unexpected journey,” Frontiers in Climate, 4, p. 1043672. Available at: https://doi.org/10.3389/FCLIM.2022.1043672/BIBTEX.
Fazekas, D. et al. (2021) Exploring the trade-offs in different paths to reduce transport and heating emissions in Europe. Available at: www.camecon.com (Accessed: November 26, 2025).
Federal government of Germany (2024) Second report by the Federal Government on its experiences with the Fuel Emissions Trading Act and Report by the Federal Government with a proposal for the transition from national to European fuel emissions trading. Available at: https://dserver.bundestag.de/btd/20/144/2014488.pdf (Accessed: November 25, 2025).
Germanwatch (2025) New Emissions Trading System under Fire. Available at: https://www.germanwatch.org/en/blog/new-emissions-trading-system-under-fire (Accessed: December 5, 2025).
GIZ and UNDP (2019) Scaling up ambition: lessons from British Columbia’s carbon tax. Available at: https://ndcpartnership.org/knowledge-portal/good-practice-database/scaling-ambition-lessons-british-columbias-carbon-tax (Accessed: November 25, 2025).
Government of Canada (2025) Removing the consumer carbon price, effective April 1, 2025 – Canada.ca. Available at: https://www.canada.ca/en/department-finance/news/2025/03/removing-the-consumer-carbon-price-effective-april-1-2025.html (Accessed: January 13, 2026).
Government Offices of Sweden (2025) Sweden’s carbon tax. Available at: https://www.government.se/government-policy/taxes-and-tariffs/swedens-carbon-tax/ (Accessed: January 5, 2026).
Günther, C. et al. (2024) “Carbon prices on the rise? Shedding light on the emerging second EU Emissions Trading System (EU ETS 2),” SSRN Electronic Journal [Preprint]. Available at: https://doi.org/10.2139/SSRN.4808605.
Hawkey, D. (2024) Political leaders in Scotland must be bold on climate and tax | IPPR. Available at: https://www.ippr.org/articles/political-leaders-in-scotland-must-be-bold-on-climate-and-tax (Accessed: December 11, 2025).
HM Treasury (2025) Budget 2025 speech. Available at: https://www.gov.uk/government/speeches/budget-2025-speech (Accessed: January 5, 2026).
International Carbon Action Partnership (2025a) Austrian National Emissions Certificate Trading System. Available at: https://icapcarbonaction.com/en/ets/austrian-national-emissions-certificate-trading-system (Accessed: December 5, 2025).
International Carbon Action Partnership (2025b) German National Emissions Trading System.
International Carbon Action Partnership (2025c) UK Emissions Trading Scheme. Available at: https://icapcarbonaction.com/en/ets/uk-emissions-trading-scheme (Accessed: December 5, 2025).
International Carbon Action Partnership (2026) EU reaches agreement on 2040 climate target, postpones ETS 2 by one year . Available at: https://icapcarbonaction.com/en/news/eu-reaches-agreement-2040-climate-target-postpones-ets-2-one-year (Accessed: January 22, 2026).
International Energy Agency (2022) Executive Summary – The Future of Heat Pumps. Available at: https://www.iea.org/reports/the-future-of-heat-pumps/executive-summary (Accessed: January 21, 2026).
Kettner, C. et al. (2024) Investigating Equity and Efficiency in Carbon Pricing with Revenue Recycling: A Combined Macro- and Micro-modelling Approach. Available at: https://www.wifo.ac.at/publication/pid/53174084.
Knaggård, Å. and Hildingsson, R. (2025) “The adoption of the Swedish carbon tax: Influences and interactions across multiple political levels, jurisdictions, and policy areas,” Policy Studies Journal, 53(2), pp. 414–435. Available at: https://doi.org/10.1111/psj.70011.
Kohlscheen, E., Moessner, R. and Takáts, E. (2021) Effects of Carbon Pricing and Other Climate Policies on CO2 Emissions. Available at: https://www.ifo.de/DocDL/cesifo1_wp9347.pdf (Accessed: November 26, 2025).
Lindvall, D. et al. (2024) “The Role of Fairness for Accepting Stricter Carbon Taxes in Sweden,” Climate, 12(11). Available at: https://doi.org/10.3390/cli12110170.
Love, J. et al. (2017) “The addition of heat pump electricity load profiles to GB electricity demand: Evidence from a heat pump field trial,” Applied Energy, 204, pp. 332–342.
Ma, W. (2023) “A Comparative Study of Carbon Pricing Policies in China and the Scandinavian Countries: Lessons for Effective Climate Change Mitigation with a Focus on Sweden,” E3S Web of Conferences. EDP Sciences. Available at: https://doi.org/10.1051/e3sconf/202342404005.
Marcantonini, C. et al. (2017) The EU ETS and its Interactions with other Climate and Energy Policies. Available at: http://lifesideproject.eu/event/eu-ets-and-its-interaction- (Accessed: November 26, 2025).
Maria D’arcangelo, F. et al. (2022) Estimating the CO2 emission and revenue effects of carbon pricing: New evidence from a large cross-country dataset. Available at: https://doi.org/10.1787/39aa16d4-en.
Martinsson, G. et al. (2024) “The Effect of Carbon Pricing on Firm Emissions: Evidence from the Swedish CO2 Tax,” Review of Financial Studies, 37(6), pp. 1848–1886. Available at: https://doi.org/10.1093/rfs/hhad097.
Mildenberger, M. et al. (2022) “Limited impacts of carbon tax rebate programmes on public support for carbon pricing,” Nature Climate Change, 12(2), pp. 141–147. Available at: https://doi.org/10.1038/s41558-021-01268-3.
Ministry of Finance, S. (2023) Carbon Taxation in Sweden. Available at: https://www.government.se/contentassets/419eb2cafa93423c891c09cb9914801b/230323-carbon-tax-sweden—general-info.pdf (Accessed: November 25, 2025).
Murray, B. and Rivers, N. (2015) “British Columbia’s revenue-neutral carbon tax: A review of the latest ‘grand experiment’ in environmental policy,” Energy Policy, 86, pp. 674–683. Available at: https://doi.org/10.1016/J.ENPOL.2015.08.011.
Nordbrandt, M. et al. (2025) “Combating climate change through the welfare state: can social insurance boost support for carbon taxes in Europe?,” Journal of European Public Policy, 32(1), pp. 81–103. Available at: https://doi.org/10.1080/13501763.2023.2294146.
Norwegian Ministry of Climate and Environment (2022) Norway’s Climate Action Plan for 2021-2030 Norwegian Ministry of Climate and Environment. Available at: https://www.regjeringen.no/contentassets/a78ecf5ad2344fa5ae4a394412ef8975/en-gb/pdfs/stm202020210013000engpdfs.pdf (Accessed: November 25, 2025).
Norwegian Ministry of the Environment (2005) “Norway’s Report on Demonstrable Progress under the Kyoto Protocol Status report as of December 2005.”
Office for Budget Responsibility (2023) How gas demand and supply have responded to higher gas prices. Available at: https://obr.uk/box/how-gas-demand-and-supply-have-responded-to-higher-gas-prices/ (Accessed: December 1, 2025).
Ohlendorf, N. et al. (2021) “Distributional Impacts of Carbon Pricing: A Meta-Analysis,” Environmental and Resource Economics, 78(1), pp. 1–42. Available at: https://doi.org/10.1007/S10640-020-00521-1/TABLES/8.
Pretis, F. (2022) “Does a Carbon Tax Reduce CO2 Emissions? Evidence from British Columbia,” Environmental and Resource Economics, 83(1), pp. 115–144. Available at: https://doi.org/10.1007/s10640-022-00679-w.
Raiser, K. and Rault, A. (2025a) Packaging and sequencing policies for more effective climate action. Available at: https://www.oecd.org/en/about/programmes/net-zero-building-climate-and-economic-resilience.html (Accessed: November 26, 2025).
Raiser, K. and Rault, A. (2025b) Packaging and sequencing policies for more effective climate action. Available at: https://www.oecd.org/en/about/programmes/net-zero-building-climate-and-economic-resilience.html (Accessed: November 26, 2025).
Romm, J., Lezak, S. and Alshamsi, A. (2025) “Are Carbon Offsets Fixable?,” Annual Review of Environment and Resources, 50(1), pp. 649–680. Available at: https://doi.org/10.1146/ANNUREV-ENVIRON-112823-064813/CITE/REFWORKS.
Scottish Government (2021) Heat in Buildings Strategy. Available at: https://www.gov.scot/binaries/content/documents/govscot/publications/strategy-plan/2021/10/heat-buildings-strategy-achieving-net-zero-emissions-scotlands-buildings/documents/heat-buildings-strategy-achieving-net-zero-emissions-scotlands-buildings/heat-buildings-strategy-achieving-net-zero-emissions-scotlands-buildings/govscot%3Adocument/heat-buildings-strategy-achieving-net-zero-emissions-scotlands-buildings.pdf (Accessed: November 26, 2025).
Scottish Government (2022) Home energy and fuel poverty. Available at: https://www.gov.scot/policies/home-energy-and-fuel-poverty/energy-saving-home-improvements/ (Accessed: January 8, 2026).
Scottish Government (2023) Cost of Living Bill – Key Statistics, Director-General Communities. Available at: https://www.gov.scot/publications/cost-living-bill-key-statistics/ (Accessed: December 23, 2025).
Scottish Government (2025a) Scotland’s Climate Change Plan – 2026-2040. Available at: https://www.gov.scot/publications/scotlands-climate-change-plan-2026-2040/ (Accessed: November 26, 2025).
Scottish Government (2025b) Scottish Greenhouse Gas Statistics 2023, Statistics.
Scottish Government (2025c) Scottish House Condition Survey: 2023 Key Findings. Available at: https://www.gov.scot/publications/scottish-house-condition-survey-2023-key-findings/pages/1-key-attributes-of-the-scottish-housing-stock/ (Accessed: December 3, 2025).
Scottish Government (2025d) Supporting data – Poverty and Income Inequality in Scotland National Statistics report. Available at: https://view.officeapps.live.com/op/view.aspx?src=https%3A%2F%2Fdata.gov.scot%2Fpoverty%2Fxls%2Fdata2025.xlsx&wdOrigin=BROWSELINK (Accessed: December 11, 2025).
Scottish Government (no date a) Home Energy Scotland grant and loan, 2024. Available at: https://www.mygov.scot/energy-saving-funding/home-energy-scotland-grant-and-loan (Accessed: December 23, 2025).
Scottish Government (no date b) Scottish economic insights: October 2024 – Recent Labour Market Trends, 2024. Available at: https://www.gov.scot/publications/scottish-economic-insights-october-2024/pages/4/ (Accessed: January 12, 2026).
Scottish Parliament (2019) Fuel Poverty (Targets, Definition and Strategy) (Scotland) Act 2019. Available at: https://www.legislation.gov.uk/asp/2019/10 (Accessed: January 12, 2026).
Scottish Parliament (2025) Draft Buildings (Heating and Energy Performance) and Heat Networks (Scotland) Bill.
Scottish Parliament Cross Party Group on Sustainable Transport (2025) “MIND THE GAP: TACKLING TRANSPORT INEQUALITIES IN SCOTLAND.”
Sileci, L. (2023) “Carbon pricing with regressive co-benefits: evidence from British Columbia’s carbon tax.” Available at: https://www.lse.ac.uk/granthaminstitute/wp-content/uploads/2023/11/working-paper-405_Sileci.pdf (Accessed: January 15, 2026).
Sloan, B. et al. (2024) “International evidence on fiscal levers to deliver reductions in greenhouse gas emissions.” Available at: https://doi.org/10.7488/era/4033.
Statistik Databasen (2025) Environmental taxes by industry SNI 2007. Year 2008 – 2023. PxWeb. Available at: https://www.statistikdatabasen.scb.se/pxweb/sv/ssd/START__MI__MI1301__MI1301E/MiljoSkattSNI07Niv/ (Accessed: December 5, 2025).
Stavins, R.N. (2022) “The Relative Merits of Carbon Pricing Instruments: Taxes versus Trading,” Review of Environmental Economics and Policy, 16(1), pp. 62–82. Available at: https://doi.org/10.1086/717773.
Streicher, G., Kettner, C. and Schratzenstaller, M. (2025) “Analysis of the Regional Impacts of the Austrian Carbon Price.” Available at: https://ssrn.com/abstract=5116990.
Sturge, D. et al. (2024a) Extending the UK Emissions Trading Scheme to heating and road transport fuels: What role can it play in decarbonising the UK economy? .
Sturge, D. et al. (2024b) Extending the UK Emissions Trading Scheme to heating and road transport fuels: What role can it play in decarbonising the UK economy? .
Thomson, S. et al. (2023) “Rural and Islands Report: 2023 – An Insights Report.” Available at: https://doi.org/10.58073/SRUC.23807703.V1.
Transport & Environment (2025) How to turn the ETS2 implementation into a success. Available at: www.transportenvironment.org (Accessed: December 23, 2025).
Transport Scotland (2023) The Vehicle Emissions Trading Schemes Order 2023. Available at: https://www.transport.gov.scot/publication/partial-island-communities-impact-assessment-the-vehicle-emissions-trading-schemes-order-2023/background/ (Accessed: January 8, 2026).
UK Government (2016) Climate Change Levy rates. Available at: https://www.gov.uk/guidance/climate-change-levy-rates (Accessed: February 13, 2026).
UK Government (2022) Environmental principles policy statement. Available at: https://www.gov.uk/government/publications/environmental-principles-policy-statement/environmental-principles-policy-statement (Accessed: February 12, 2026).
UK Government (2025a) Average domestic gas bills by countries in Great Britain. Available at: https://view.officeapps.live.com/op/view.aspx?src=https%3A%2F%2Fassets.publishing.service.gov.uk%2Fmedia%2F6942b6c79273c48f554cf51b%2Ftable_232.xlsx&wdOrigin=BROWSELINK (Accessed: December 23, 2025).
UK Government (2025b) Phasing out the sale of new petrol and diesel cars from 2030 and support for zero emission vehicle (ZEV) transition. Available at: https://www.gov.uk/government/speeches/phasing-out-the-sale-of-new-petrol-and-diesel-cars-from-2030-and-support-for-zero-emission-vehicle-zev-transition (Accessed: December 5, 2025).
Winter, J. (2024) “Exploring the Landscape of Canadian Climate Policy,” Canadian Public Policy, 50, pp. 73–102. Available at: https://doi.org/10.3138/cpp.2023-055.
Winter, J., Dolter, B. and Fellows, G.K. (2023) “Carbon Pricing Costs for Households and the Progressivity of Revenue Recycling Options in Canada,” Canadian Public Policy, 49(1), pp. 13–45. Available at: https://doi.org/10.3138/cpp.2022-036.
World Bank (2020) Distributional impacts of carbon pricing on households. Available at: www.carbonpricingleadership.org (Accessed: November 26, 2025).
World Bank (2023) “State and Trends of Carbon Pricing 2023,” State and Trends of Carbon Pricing 2023 [Preprint]. Available at: https://doi.org/10.1596/39796.
World Bank (2025) State and Trends of Carbon Pricing Dashboard. Available at: https://carbonpricingdashboard.worldbank.org/compliance/price (Accessed: December 5, 2025).
World Bank Group (2025) What is Carbon Pricing? Available at: https://carbonpricingdashboard.worldbank.org/what-carbon-pricing (Accessed: November 26, 2025).
Yu, Y. (2024) “Carbon Taxes and CO2Emissions: A Replication of Andersson (American Economic Journal: Economic Policy, 2019),” Economics. Walter de Gruyter GmbH. Available at: https://doi.org/10.1515/econ-2022-0109.
Appendices
Appendix A Additional methodological details
Main investment model
The model is initiated through a baseline scenario, which accounts for the impact of existing policies on consumption behaviour. Our baseline scenario is based on cost inputs from the 7th Carbon Budget (7CB), with results initially calibrated to the 7CB Balanced Pathway emissions trajectories for the first five years out to 2030 (including starting levels). This decision was justified by the fact that the 7CB provides the best holistic picture of how domestic energy and climate policy are likely to evolve under the UK and Scotland’s net zero commitments in the short term (to 2030). After 2030, we model continued emissions reductions driven by the uptake of EVs and heat pumps, assuming that these technologies are taken up when fossil technologies are retired, and if the cost of the alternative makes economic sense to the consumer, constrained by “affordability factors” which we set based on income (see “Detailed modelling assumptions” below).
The current and future policies included in our baseline scenario, which result in an emissions reduction trajectory aligned with the 7CB Balance Pathway, are the New Build Heat Standard, a phase-out of new gas boiler installations in Scotland by 2035, no new sales of internal combustion vehicles from 2030, minimum efficiency standard targets for domestic buildings, and fuel efficiency standards for internal combustion vehicles. The Scottish Government’s current heat pump subsidy (£7,500 per unit) is also modelled, and assumed to taper off at a rate of £500/year from 2029 (the end of the UK Boiler Upgrade Scheme), which under future heat pump cost reductions slowly exposes the consumer to more of the total cost of deployment. These policies are all included in the carbon pricing scenarios as well, meaning that they model an additional carbon price signal on top of the existing policy context.
In the carbon tax scenarios, the carbon price is completely exogenous, i.e., it is pre-set and is not an output of the modelling calculations itself. In the ETS scenarios, the carbon price is the price of ETS allowances that must be purchased by fuel suppliers to cover emissions from the combustion of transport and heating fuels which they sell. This price is a function of allowance supply (the number of allowances available to buy in a year, which is capped and declines each year), and demand (the emissions from combusting transport and building heating fuels, that year). The difference between supply and demand acts as an “allowance scarcity”, which affects the carbon price (the higher the allowance scarcity, the higher the carbon price). The carbon price in a given year is determined based on the marginal abatement cost given the allowance scarcity, and the historic carbon price (see next section).
Consumption responses are assumed to vary by archetype (see Section 4.1), with differences primarily driven by differentiated price elasticity of demand and the average annual fuel demand. The price elasticity of demand is set at -0.1 for building heating (Office for Budget Responsibility, 2023). This figure refers to natural gas consumption, which makes up most Scotland’s heating fuel consumption (Scottish Government, 2025c). A demand elasticity of -0.1 means that a doubling of the price will result in a 10% reduction in demand.
The price elasticity of demand is set at -0.25 for transport (Department for Transport, 2024). After consultation with the project Steering Group (SG) we have assumed that the price elasticity of demand for transport varies by income level (-0.15 – -0.35 from high to low income deciles, respectively, with linear interpolation). Demand elasticity of -0.25 means that a doubling of liquid transport fuel prices will result in a 25% reduction in demand.
Features of the four carbon pricing scenarios are shown in Table 4 and Table 5. Carbon taxes are assumed to start in 2027, and ETS schemes in 2028 (this was necessary to avoid circularity in the model). In the ETS scenarios, the supply of allowances is set at the start of the scheme as the projected annual emissions for Scotland’s transport and building sectors, decreasing year-on-year by a reduction factor increasing from 5.38% in 2028 to 10% in 2045. We assume that all allowances are auctioned with no free allocation, and a Market Stability Reserve (MSR) is simulated to address issues of over- or under-supply of allowances in the market. This is done by withdrawing allowances from the market and releasing them from the MSR, respectively, based on the total number of allowances in circulation (TNAC – the number of allowances remaining unclaimed in the market after all emissions have been covered) being above or below, respectively, a pre-set threshold (see Table 5). In the ETS scenario with a price cap, the MSR is also triggered to release allowances if the allowance price exceeds £50/tCO2 (equivalent to the EU ETS2 soft price cap level after accounting for inflation). Withdrawal and release from the MSR are assumed to occur in the year following over- or under-supply or of price exceedance, and only one rule can be triggered at a time.
Carbon tax scenario | Starting rate | Final rate | Increase to final rate | Rate of increase |
|---|---|---|---|---|
Low tax rate | £10/ tCO2 | £25/tCO2 | Over 3 years | Linear |
High tax rate | £25/tCO2 | £75/tCO2 | Over 5 years | Linear |
ETS scenario | Market Stability Reserve withdrawal rules | Market Stability Reserve release rules (quantity-based) | Market Stability Reserve release rules (price-based) |
|---|---|---|---|
With price cap | If TNAC > 40% of allowance cap, withdraw 18% of TNAC into the MSR, increasing to 30% if TNAC >=100% of allowance cap | If TNAC <15% of allowance cap, release 5% of MSR allowances, increasing to 10% if TNAC <10% of allowance cap | If carbon price exceeds a certain level, release 5% of MSR, rising to 10% if the price reaches £100/tCO2. The trigger level is set to £50/tCO2 in 2027, increasing by £5/year |
Without price cap | No price rule |
Simulation of the ETS module
The carbon price in the ETS scenarios is simulated through an ETS “module”, linked to the main investment model. Two scenarios are modelled: one with a price cap and one without. For the scenario with the price cap, we set the price cap at £50/tCO2 at the start of the scheme, increasing year on year to reflect increasing decarbonisation ambition. As it is a soft price cap, there is no hard limit on the ETS price – rather, when the ETS price exceeds the cap, the supply of allowances is increased (see below).
The basic logic of the ETS module is that the allowance scarcity (i.e., the difference between the annual allowance cap and the actual emissions generated under the scenario) drives a carbon price on the heating and transport sectors. This carbon price feeds into the main investment model, generating behaviour change and emissions reductions. The updated yearly emissions are then fed back into the ETS module, changing the allowance scarcity and thus the supply of allowances via behaviour of the Market Stability Reserve (see below). The carbon price triggers behaviour change starting from 2028, even though the scheme is simulated to start in 2027. This was necessary to avoid circularity in the investment model.
The supply of allowances (or allowance cap) is pre-set for 2025 at the level of surface transport and building emissions projected by the CCC in its 7th Carbon Budget (Climate Change Committee, 2025b). At the start of the project, the supply was set based on historic average emissions of these sectors, but this made the initial market much too tight and drove the early-year carbon prices very high. As this would not be expected in an ETS, a more generous allowance supply was set as the starting value for 2025. The same value was used for 2026, following which a linear reduction factor (LRF), increasing from 5.38%/year in 2027 to 10% by 2045. This LRF is quite high compared to that used in the EU ETS2 (5.38%) but at lower values the market becomes very “loose” because emissions reduce rapidly even under the baseline scenarios. The allowance supply is rebased in 2030, 2035, and 2040 by calibrating it to the actual emissions generated under the ETS scenarios for the same years, to ensure the cap is tracking actual emissions reductions.
The supply of allowances is influenced by a simulated Market Stabilisation Mechanism (MSR), mimicking that designed for the EU ETS2. The MSR withdraws and releases allowances based on specific trigger rules (see Table 5): quantity-based withdrawal and release trigger rules, related to the Total Number of Allowances in Circulation (TNAC, a measure of market liquidity) and price-based release trigger rules, related the carbon price (in the price-capped scenario). Only one trigger rule can be applied at a time. The MSR behaviour thus affects the allowance supply and resulting allowance scarcity. The MSR is triggered in year+1, i.e., the TNAC of the previous year is evaluated and the MSR is triggered subsequently to rebalance the market. This may happen multiple times per year in an actual ETS, but could not be simulated in our simple model.
The allowance scarcity (i.e., the difference between the annual allowance cap and the actual emissions generated under the scenario) would in theory lead to the lowest marginal abatement needed to close the allowance scarcity setting the carbon price. Marginal abatement costs are calculated at an archetype level for each year by evaluating the additional costs associated with the relevant low-carbon technology (including both capital and operating expenditures) and dividing it by the lifetime emissions savings from switching from the fossil to clean technology. Given that we only model one technology per sector (heat pumps for buildings and EVs for transport), the abatement costs decrease as technology costs decline and in some of the commercial archetypes are very low due to the modelling of a “representative” building or goods vehicle. As such, instead of translating the minimum marginal abatement cost to meet the required allowance scarcity, we calculate the median marginal abatement cost and combine it with a “market tightness” factor (see below).
The ultimate carbon (allowance) price is made up of the marginal abatement cost, combined with the historic (previous year’s) carbon price. The relative contribution of the marginal abatement cost and historic carbon price is driven by the allowance scarcity through a “market tightness” parameter. When the market is tight (i.e., low amount of surplus allowances available), the carbon price tends towards the marginal abatement cost, as consumers will be forced to decarbonise. Conversely, when the market is loose the carbon price will be more driven by previous year values, as the market will track historic price trends in the absence of allowance scarcity to drive decarbonisation. To generate an increasing carbon price trajectory, in line with expectations from literature, the contribution of the marginal abatement cost was set at a lower value at the start of the scheme, assuming to account for the phase-in of the scheme and eventual association exemptions. By 2035, both the marginal abatement cost and historic price are fully contributing to the carbon price, with relative contributions set by market tightness at the time. A carbon price floor is set, equivalent to the Auction Reserve Price (ARP) in the UK ETS (£28 in 2026, increasing with inflation to reach £49.1 in 2045).
The carbon prices generated under the two ETS scenarios are shown below. The carbon prices are much more volatile in the capped ETS scenario, which is unintuitive. This is due to the behaviour of the MSR. As carbon prices are above our soft price cap early in the ETS scenarios, the MSR is constantly triggered to release, flooding the market with allowances and subsequently being triggered to withdraw allowances to keep the market reasonably tight. This shows that the price cap is designed to keep the scheme affordable, not necessarily stable (this is a wider remit of the MSR).
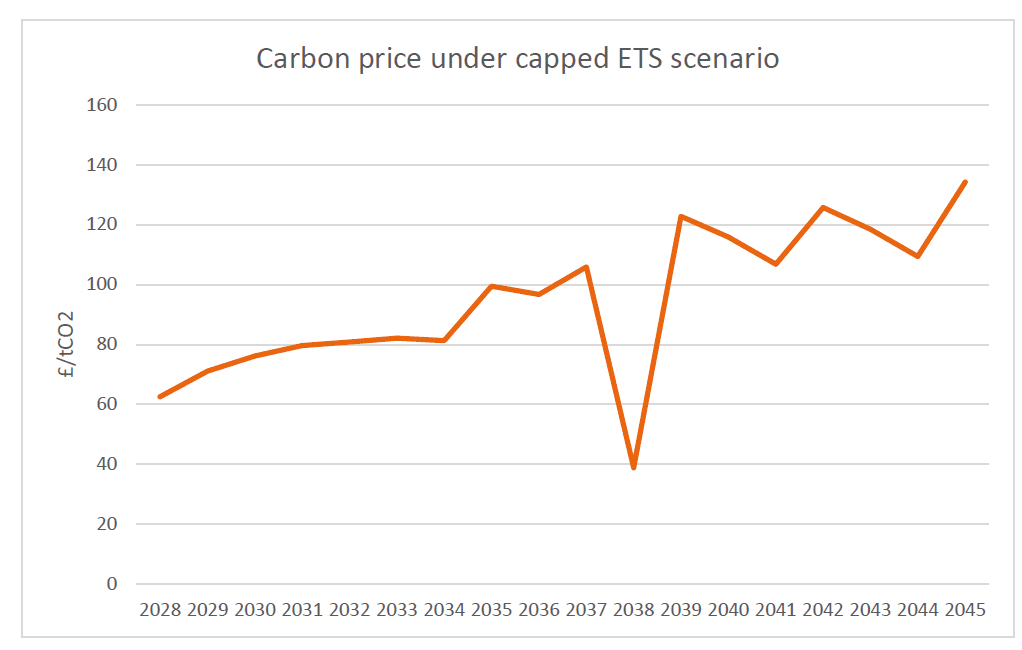
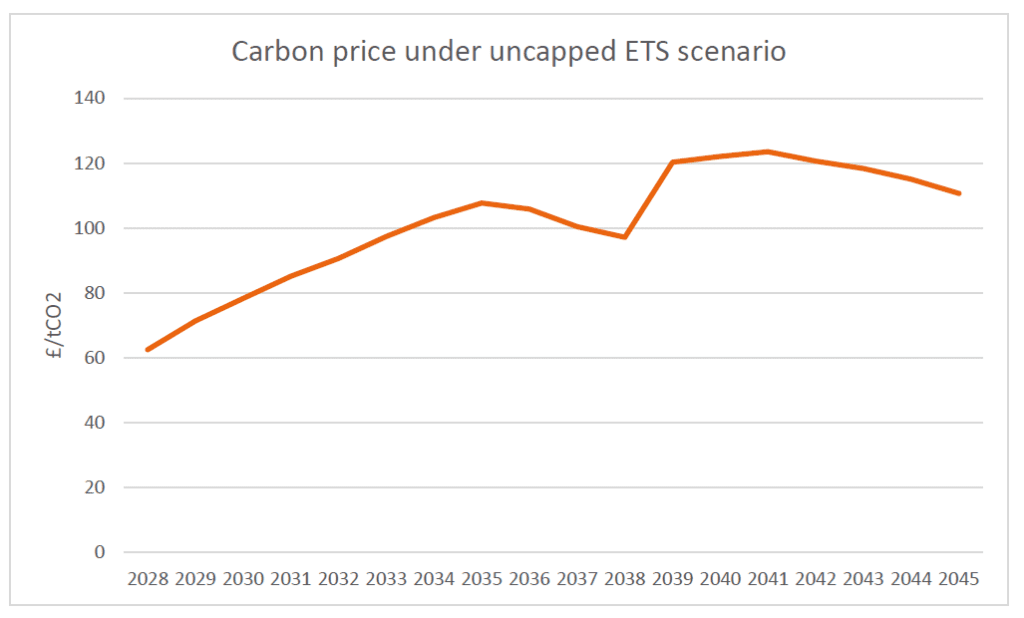
Detailed modelling assumptions
In addition to the assumptions presented in the main text, key assumptions used to implement the model in Excel are the following:
- Consumer-related assumptions: Consumers act as rational economic agents when taking investment decisions, with archetypes reflecting the average activity of consumers and subsectors and income deciles assumed to remain constant. Investments are constrained by “affordability factors”, artificially set ranging from 0.5 – 1.5 across income ranges to progressively constrain affordability across decreasing income deciles due to the absence of suitable data to construct these affordability factors. Affordability concerns are also reflected in the discount rates used for evaluation of the net present value (NPV) of alternative technologies, which range from 2-38% for domestic consumers also in line with income ranges. Behavioural factors influencing technology uptake are not modelled.
- Technology-related assumptions: Technologies were assumed to be available up to the limit of desired consumer investments, with S-curve deployments modelled based on the relative costs of fossil and clean technologies. Technologies were assumed to be taken up at the end of life of their predecessors (e.g. heat pumps replace gas boilers at the end of life of the gas boiler). Due to the scope of the modelling and analysis, second-hand markets for vehicles were not modelled and simplified cost curves were used for new technologies (not reflecting the range of possible technology models).
- Carbon pricing and policy assumptions: Electricity prices and consumption were assumed to not be covered by carbon pricing or emissions trading schemes, given that the existing UK ETS covers power generation, with carbon pricing modelled at an annual value. Banking or re-sale of allowances under ETS scenarios is not permitted. Revenue recycling effects were not modelled due to complexity, though are discussed in Section 4.5.2. Only CO2 emissions are priced, and non-CO2 emissions are not considered (as they were assumed to be negligible in the target sectors). Future changes in policy and regulatory support for low-carbon technologies were not modelled apart from a halt in the sale of new gas boilers from 2035, which may produce conservative estimates for technology rollout compared to other modelling results (e.g., the 7th Carbon Budget), and a gradual phase out of the £7,500 grant for heat pumps and other low-carbon domestic heat (which is assumed to fall by £500 p.a. from 2029. This is the end date of England and Wales’ current Boiler Upgrade Scheme).
The ETS scenarios are based on several distinct assumptions, outlined below:
- The TNAC in the first year of operation of the ETS is assumed to be equal to the allowance surplus (i.e., allowance cap minus emissions) as there is no MSR adjustment until the second year of operation.
- The price threshold increases with time, in contrast to the EU ETS2 design where it is set at a fixed value; this was introduced as the carbon price regularly exceeds the originally-designed price cap of £50/tCO2. Under this increase, the price trigger level reaches £140 in 2025.
- The MSR trigger rules are more stringent than those in the EU ETS2 (withdrawal of 18%-30% of allowances rather than 12%-24%, release only when TNAC is less than 15% of allowance cap rather than 20%).
- The market tightness parameter is calculated based on the assumption that a very loose market is one where TNAC is more than 80% of the allowance cap, and a very tight one is where TNAC is less than 10% of allowance cap.
Model limitations
The simplicity of the investment model is intentional, given the complexity of cross sector scenario modelling, which imposes a limit on how realistic the simulated effects of carbon pricing are. It is intended as a starting point to assess the order of magnitude of potential impact of a carbon pricing system which future studies can build on. This also applies to simulation of wider economic and market factors. For example, changes in future fossil fuel prices beyond the DESNZ fossil fuel price assumptions are not accounted for, including the effect of future supply-side shocks.
The assumptions outlined above also introduce several limitations. Most prominently, excluding the early retirement of conventional fossil technologies means that the uptake of new technologies modelled in this study may be relatively conservative. The complexity of ETS schemes also means that the carbon price trajectory in an implemented scheme may unfold quite differently than in the modelling. We do not model the effects of revenue recycling on technology uptake and the subsequent emissions abatement.
Second-order effects of accelerated uptake on technology capital costs are not included, and policy interactions between carbon pricing and other policies are not modelled due to the inherent complexity. Policy interventions that affect the cost of fuel and electricity for specific income deciles and consumer groups were not included, due to data challenges. Our simple model also does not account for non-price barriers and non-economic factors, such as availability of financing, energy literacy, the “hassle factor” and access to quality equipment and installers, which can be a substantial barrier for low-income groups.
It should be noted that our model does not include minimum acceptable fuel consumption limits, thus an increasing carbon price would cause consumption to decrease ad infinitum. This is a theoretical result due to the simple nature of our model. In practice, consumers are likely to change their investment behaviour if further reducing their fuel consumption becomes unsustainable for their quality of life.
Appendix B Full list of model data sources
The data sources used in the investment model are outlined in Table 6 and Table 7.
Sector | Variable(s) | Data source |
|---|---|---|
Transport (personal & commercial) | Capital costs and operating costs | |
Heating (domestic & commercial) | ||
Transport (personal & commercial) | Petrol prices | DESNZ Fossil fuel price assumptions 2024, Scenario B |
Heating (commercial) | Natural gas prices | DESNZ Fossil fuel price assumptions 2024, Scenario B |
Heating (domestic) | Natural gas prices | |
Heating (domestic & commercial), Transport (personal) | Electricity prices | |
Transport (commercial) | Electricity prices |
Sector | Variable(s) | Data source |
|---|---|---|
All | Population growth | |
All | GDP growth | |
Transport (personal & commercial) | Stock of domestic vehicles and commercial vehicles | |
Transport (commercial) | Commercial vehicle kms | |
Heating (domestic) | Number of dwellings and household income deciles | |
Heating (domestic) | Existing heating fuel type | |
Heating (domestic) | Average electricity & gas consumption by income decile | |
Heating (commercial) | Total consumption |
Archetype (income decile) | Income range |
|---|---|
I1 | Less than £15,000 |
I2 | £15,000 – £19,999 |
I3 | £20,000 – £29,999 |
I4 | £30,000 – £39,999 |
I5 | £40,000 – £49,999 |
I6 | £50,000 – £59,999 |
I7 | £60,000 – £69,999 |
I8 | £70,000 – £99,999 |
I9 | £100,000 – £149,999 |
I10 | £150,000 or more |
Appendix C: Detailed modelling results
Modelling results
Scenario | Carbon tax £25 | Carbon tax £75 | ETS with price cap | ETS without price cap |
|---|---|---|---|---|
2027 | 10 | 25 | – | – |
2028 | 15 | 50 | 62.38 | 62.38 |
2029 | 20 | 62.5 | 70.92 | 71.18 |
2030 | 25 | 75 | 76.32 | 78.54 |
2031 | 25 | 75 | 79.82 | 85.33 |
2032 | 25 | 75 | 80.32 | 90.07 |
2033 | 25 | 75 | 80.76 | 95.77 |
2034 | 25 | 75 | 79.16 | 100.32 |
2035 | 25 | 75 | 99.82 | 103.45 |
2036 | 25 | 75 | 96.81 | 100.61 |
2037 | 25 | 75 | 84.66 | 94.90 |
2038 | 25 | 75 | 38.76 | 91.84 |
2039 | 25 | 75 | 102.64 | 112.88 |
2040 | 25 | 75 | 99.47 | 114.44 |
2041 | 25 | 75 | 95.80 | 112.36 |
2042 | 25 | 75 | 116.12 | 109.07 |
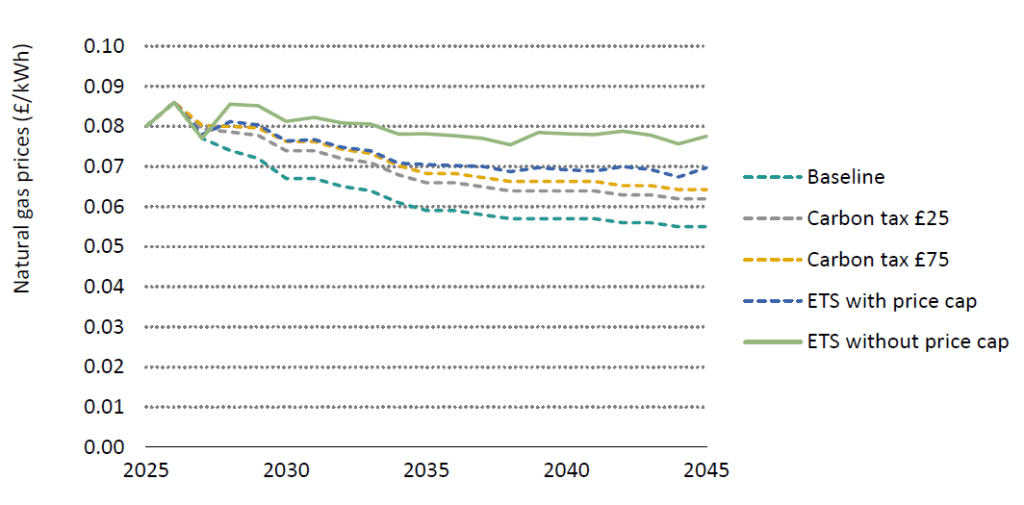
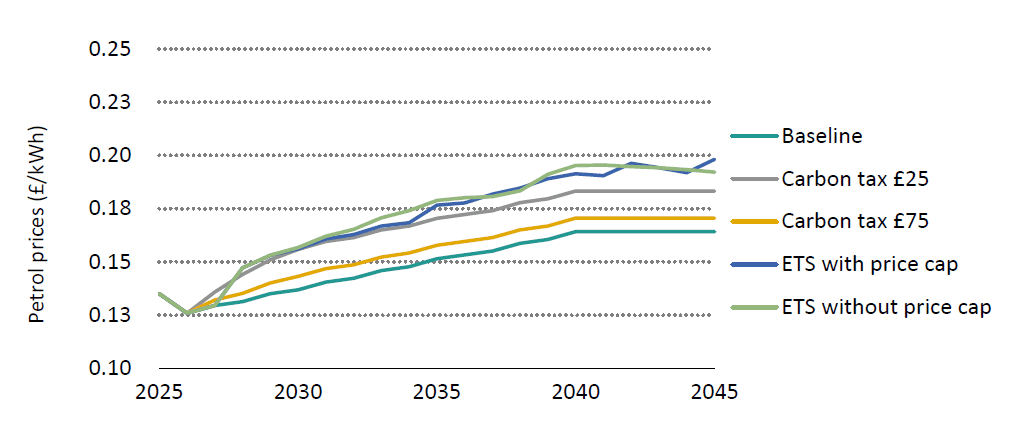
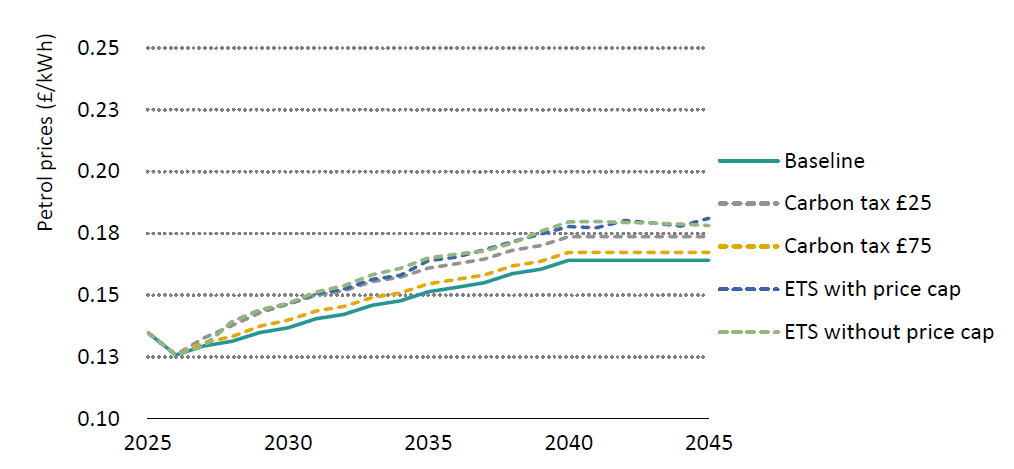
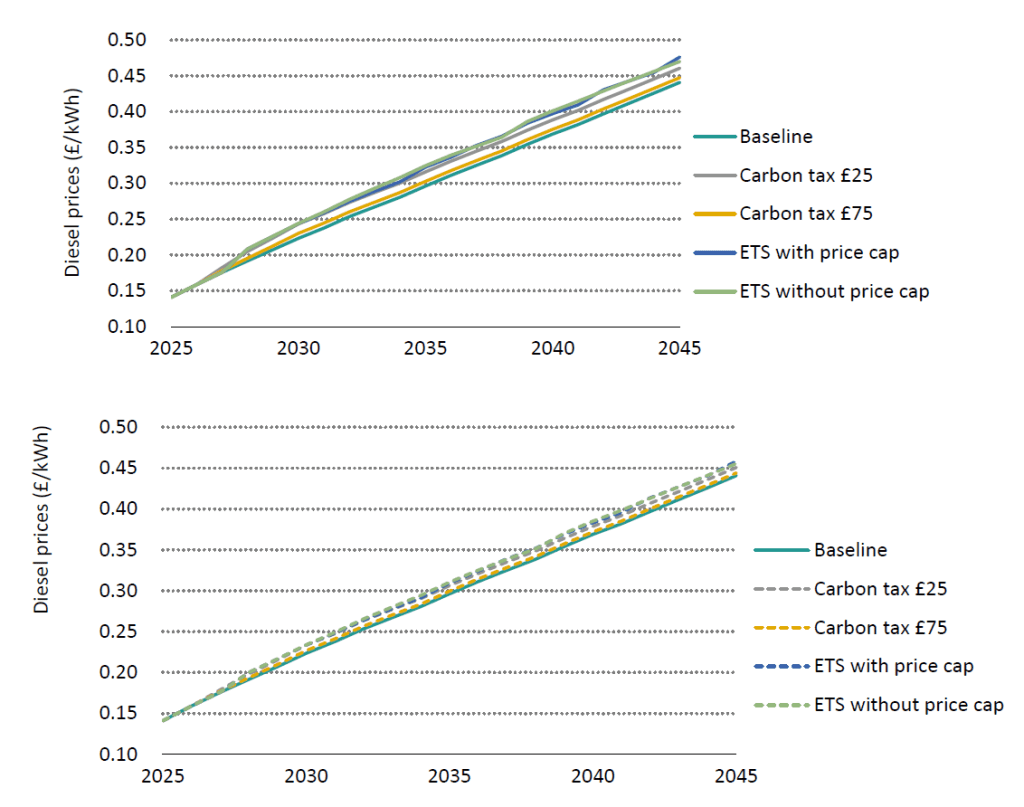
System and consumer costs
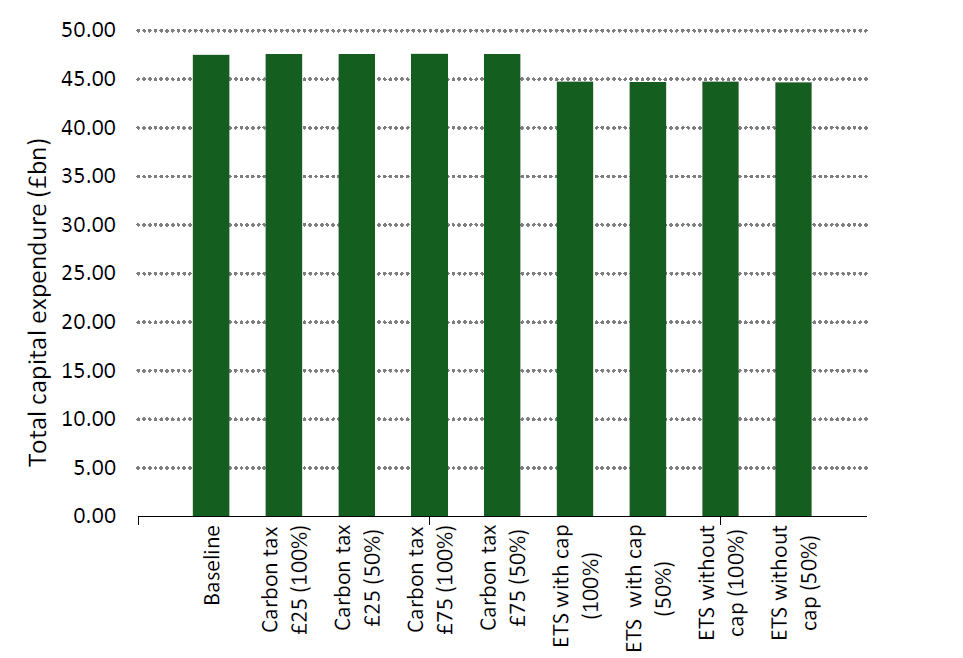
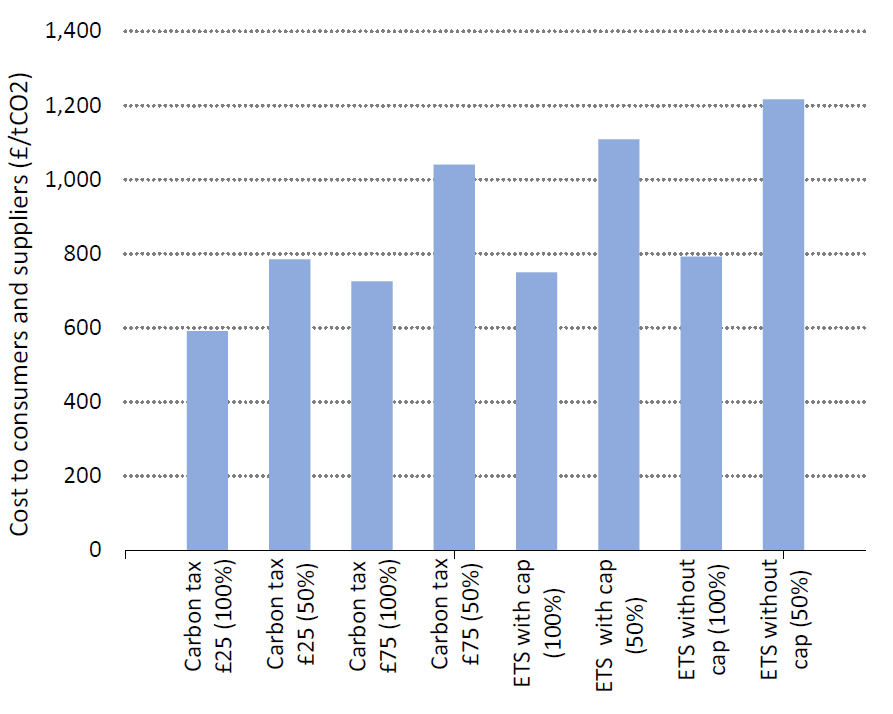
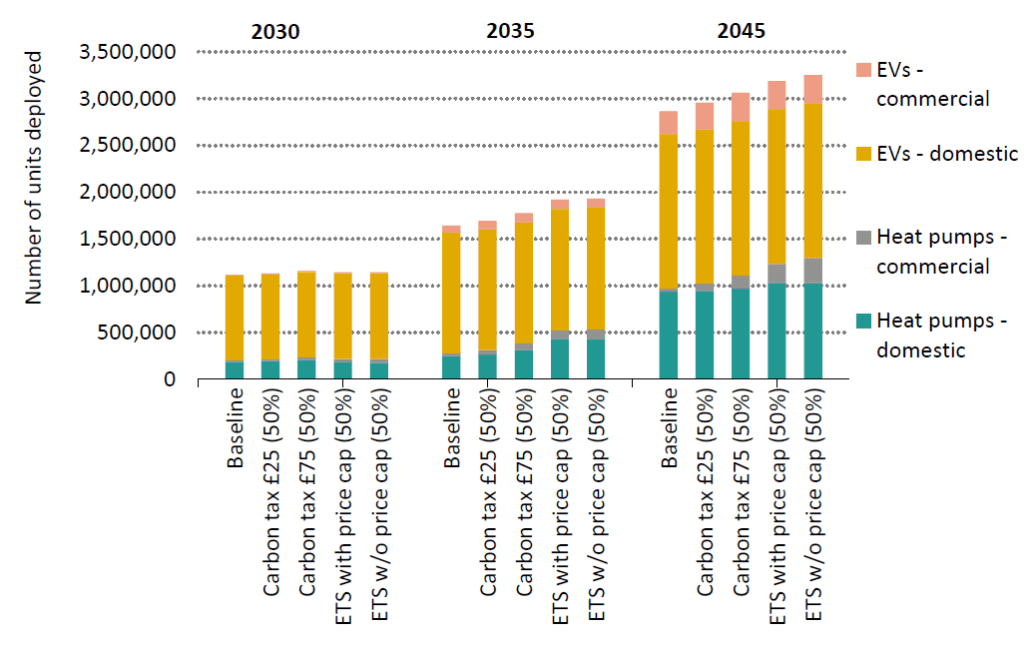
Social and distributional costs
Scenario | Sector | 2030 | 2035 | 2040 | 2045 | Yearly average |
|---|---|---|---|---|---|---|
Carbon tax £75 (100%) | Heating | 116.40 | 117.74 | 118.11 | 118.49 | 104.77 |
Carbon tax £75 (100%) | Transport | 76.83 | 75.27 | 74.05 | 74.05 | 67.09 |
Carbon tax £75 (50%) | Heating | 58.47 | 59.18 | 59.38 | 59.58 | 52.65 |
Carbon tax £75 (50%) | Transport | 38.68 | 37.88 | 37.24 | 37.24 | 33.75 |
Carbon tax £25 (100%) | Heating | 39.05 | 39.53 | 39.66 | 39.80 | 35.10 |
Carbon tax £25 (100%) | Transport | 25.85 | 25.31 | 24.88 | 24.88 | 22.51 |
Carbon tax £25 (50%) | Heating | 19.56 | 19.80 | 19.87 | 19.94 | 17.58 |
Carbon tax £25 (50%) | Transport | 12.96 | 12.68 | 12.46 | 12.46 | 11.28 |
ETS with cap (100%) | Heating | 123.63 | 55.99 | 65.07 | 75.61 | 64.04 |
ETS with cap (100%) | Transport | 81.58 | 35.84 | 40.81 | 47.26 | 41.17 |
ETS with cap (50%) | Heating | 62.12 | 28.07 | 32.64 | 37.95 | 32.89 |
ETS with cap (50%) | Transport | 41.09 | 17.97 | 20.47 | 23.72 | 21.18 |
ETS without cap (100%) | Heating | 72.48 | 79.59 | 58.45 | 70.83 | 60.44 |
ETS without cap (100%) | Transport | 50.65 | 53.93 | 38.89 | 46.97 | 41.02 |
ETS without cap (50%) | Heating | 40.44 | 44.07 | 32.64 | 39.46 | 33.61 |
ETS without cap (50%) | Transport | 26.77 | 28.21 | 20.47 | 24.67 | 21.54 |
Scenario | 2030 | 2035 | 2040 | 2045 | ||||
|---|---|---|---|---|---|---|---|---|
Lowest-income | Highest-income | Lowest-income | Highest-income | Lowest-income | Highest-income | Lowest-income | Highest-income | |
Carbon tax £75 (100%) | 1.4 | 0.2 | 1.5 | 0.2 | 1.5 | 0.2 | 1.5 | 0.2 |
Carbon tax £75 (50%) | 0.7 | 0.1 | 0.7 | 0.1 | 0.7 | 0.1 | 0.7 | 0.1 |
Carbon tax £25 (100%) | 0.5 | 0.1 | 0.5 | 0.1 | 0.5 | 0.1 | 0.5 | 0.1 |
Carbon tax £25 (50%) | 0.2 | 0.0 | 0.2 | 0.0 | 0.2 | 0.0 | 0.2 | 0.0 |
ETS with cap (100%) | 1.5 | 0.2 | 0.7 | 0.1 | 0.8 | 0.1 | 0.9 | 0.1 |
ETS with cap (50%) | 0.8 | 0.1 | 0.3 | 0.1 | 0.4 | 0.1 | 0.5 | 0.1 |
ETS without cap (100%) | 1.0 | 0.2 | 1.1 | 0.2 | 0.8 | 0.1 | 1.0 | 0.1 |
ETS without cap (50%) | 0.5 | 0.1 | 0.5 | 0.1 | 0.4 | 0.1 | 0.5 | 0.1 |
Scenario | 2030 | 2035 | 2040 | 2045 | ||||
|---|---|---|---|---|---|---|---|---|
Lowest-income | Highest-income | Lowest-income | Highest-income | Lowest-income | Highest-income | Lowest-income | Highest-income | |
Carbon tax £75 (100%) | 0.2 | 0.1 | 0.3 | 0.2 | 0.3 | 0.2 | 0.3 | 0.2 |
Carbon tax £75 (50%) | 0.1 | 0.1 | 0.1 | 0.1 | 0.1 | 0.1 | 0.1 | 0.1 |
Carbon tax £25 (100%) | 0.1 | 0.1 | 0.1 | 0.1 | 0.1 | 0.1 | 0.1 | 0.1 |
Carbon tax £25 (50%) | 0.0 | 0.0 | 0.0 | 0.0 | 0.0 | 0.0 | 0.0 | 0.0 |
ETS with cap (100%) | 0.3 | 0.2 | 0.1 | 0.1 | 0.1 | 0.1 | 0.2 | 0.1 |
ETS with cap (50%) | 0.2 | 0.1 | 0.1 | 0.0 | 0.1 | 0.0 | 0.1 | 0.1 |
ETS without cap (100%) | 0.2 | 0.1 | 0.2 | 0.1 | 0.1 | 0.1 | 0.2 | 0.1 |
ETS without cap (50%) | 0.1 | 0.1 | 0.1 | 0.1 | 0.1 | 0.0 | 0.1 | 0.1 |
Scenario | Average annual government revenue (million £) | Total government revenue (2027-2045) (billion £) |
|---|---|---|
Carbon Tax 75 (100%) | 527.79 | 10.03 |
Carbon Tax 75 (50%) | 545.45 | 10.36 |
Carbon Tax 25 (100%) | 183.61 | 3.49 |
Carbon Tax 25 (50%) | 185.95 | 3.53 |
ETS price cap (100%) | 333.51 | 6.34 |
ETS price cap (50%) | 350.78 | 6.66 |
ETS no cap (100%) | 333.09 | 6.33 |
ETS no cap (50%) | 339.52 | 6.45 |
Appendix D Information on carbon pricing schemes
Jurisdiction and instrument | Carbon price/fuel price | Cited impact | Source |
|---|---|---|---|
Global | $10/tCO2 increase in carbon tax rate | -1.3% (short-run economy-wide CO2 emissions per capita) -4.6% (long-run CO2 emissions per capita) | (Kohlscheen, Moessner and Takáts, 2021) |
$10/tCO2 increase in ETS allowance rate | -1.4% (short-run economy-wide CO2 emissions per capita) -5% (long-run economy-wide CO2 emissions per capita) | ||
€10/tCO2 increase in effective carbon rate Effective carbon rates measure how explicit carbon taxes, emissions trading systems (ETSs) and fuel excise taxes put a price on CO2 emissions from energy use. These are pricing instruments that either set an explicit price per unit of CO2 (e.g. tonnes) or that set a price on units of fuel, which is then proportional to resulting emissions. | -3.7% – -7.3% (average long-term economy-wide CO2 emissions reductions) | (Maria D’arcangelo et al., 2022) | |
British Columbia carbon tax | $30/tCO2 $0.078/l (additional fuel cost) | -12% (gasoline consumption) -5 – -15% (aggregate GHG emissions on targeted sectors) -7% – -10% (natural gas consumption) All reductions are for 2008-2011. | (Fairbrother and Rhodes, 2023) |
$10-$30/tCO2 (2008-2015) | -5% – -19% (transport CO2 emissions) (2008-2015) | (Pretis, 2022) | |
Swedish Direct Carbon Tax | €22-€134/tCO2 (1990-2005) | -11%/year (transport CO2 emissions) (1990-2005) | (Andersson, 2019) |
€22-€134/tCO2 (1990-2005) | -7.7%/capita/year (transport CO2 emissions) (1990-2005) | (Yu, 2024) | |
€122/tCO2 | -70% by 2030 compared to 2010 (domestic transport emissions) (anticipated) | (Ministry of Finance, 2023) | |
Increase in tax rate of 100% | -18% (consumption of refined petroleum products) relative to 2010 Also cites figures from other studies ranging from 11% to 21% for emissions reductions for a doubling of the carbon tax rate. | (Almström, Anderstig and Sundberg, 2024) | |
Norwegian Direct Carbon Tax | Increase in tax rate of 7.6% (gasoline) and 17% (heating oils) from baseline of $51/tCO2 and $19-22/tCO2 for heating oils | -4.2% consumption of gasoline -6.2% consumption of heating oils 0.4%-1.2% public transport use (The authors also note a counteracting effect from an increased uptake of air travel, which is exempt from Norway’s carbon tax) | (Bruvoll and Larsen, 2002) |
Increase in tax rate from NOK590 (~£43) in 2021 to NOK2000 (~£148) in 2030 | -3.5 Mt (transport GHG emissions, including shipping) by 2030 (anticipated) | (Norwegian Ministry of Climate and Environment, 2022) | |
German Emissions Trading System | Unclear | -10.2 Mt GHG emissions by 2030 (transport and heating sectors) (anticipated) | (Federal government of Germany, 2024) |
€30/tCO2 | -1.7%/year (2022-2023) (transport emissions, mostly driven by a reduction in demand for freight transport) -6.9%/year (2022-2023) (building heating emissions) | (Emissions Trading Authority at the German Environment Agency, 2025) | |
Austrian Emissions Trading System | €55/tCO2 | -4% (total CO2 emissions) within first five years | (Streicher, Kettner and Schratzenstaller, 2025) |
EU ETS2 | €48/tCO2 | Additional 10% reduction in GHG emissions by 2030 compared to 2005 | (European Commission, 2021) |
UK (hypothetical ETS2) | £40/tCO2 (low) £80/tCO2 (high) | -6.1% – -10.6% (economy-wide emissions if road transport fuels are priced) by 2040 -10% – -14.7% (economy-wide emissions if heating fuels are priced) by 2040 | (Sturge et al., 2024b) |
UK (hypothetical carbon tax on transport) | ~£0.4-£0.75 fuel duty per litre of gasoline (2017 prices) | -0.352 tCO2/capita per year | (Bretschger and Grieg, 2024) |
Scotland (hypothetical economy-wide carbon tax) | £50/tCO2 | -37% economy-wide CO2 emissions | (Allan et al., 2014) |
Jurisdiction and instrument | Carbon price | Increase in costs | Source |
|---|---|---|---|
British Columbia carbon tax | $170/tCO2 | 7.4% (transport and warehousing sector) | (Canadian Energy Centre, 2023) |
$10/tCO2 | $0.024/l (additional fuel cost) | (Fairbrother and Rhodes, 2023) | |
$30/tCO2 | $0.078/l (additional fuel cost) | ||
German ETS | €45/tonne | Minor increase in fossil fuel prices | (Federal government of Germany, 2024) |
€150/tCO2 | 2.1% of income. Burden on lower income groups is higher than on upper income groups. However, if a “climate dividend” of €422/person/year is paid, burden i(Bach et al., 2023)f income. | (Bach et al., 2023) | |
Austrian ETS | €55/tCO2 | -0.4% in real GDP -0.7% in employment Neutral effect on household income (in the fifth year after introduction) | (Streicher, Kettner and Schratzenstaller, 2025) |
EU ETS2 | €122/tCO2 | 33% (heating oil) 24% (natural gas) 22% (diesel) 18% (petrol) | (BloombergNEF, 2025) |
€48/tCO2 | 10%-28% (heating oil) 10%-33% (natural gas) 52%-100% (coal) 9%-14% (diesel) 7%-12% (petrol) Ranges are across EU Member States. | (European Commission, 2021) |
Revenue recycling mechanism | Advantages | Drawbacks and risks |
|---|---|---|
Population-wide lump sum payments, rebates, or dividends | Progressive (benefits lower-income more than higher-income groups) Can be diversified through “top-ups” for specific constituencies, similar to Scotland’s existing heating bill support system (Scottish Government, no date a) | May be challenged by low public awareness Risk of overestimating adequate rebate amounts Contrasting evidence on ability to neutralize distortionary effects Risk of interaction with pre-existing labour taxation |
Targeted financial support | Can be tailored to specific target groups, e.g., regional differentiation, means testing, support for small businesses | Challenging to determine target populations and appropriate compensation formula |
Reduction in other taxes (“double dividend”) | Can be tailored to specific costs (e.g., electricity bills) or taxes (e.g., labour taxes, income tax) | Some evidence of regressiveness, e.g. for sales tax exemptions and increase in income tax exemptions |
Targeted subsidies for clean technologies | Variety of financial transfer options (vouchers, grants, low-interest loans) |
|
Public investments | Can create enabling conditions for reducing fossil fuel consumption without forcing individual investments, e.g., public transport improvements | Effects are less visible and take time to alleviate immediate carbon cost impact |
How to cite this publication:
Miu, L., Umer, H., Hill, D., Sayers, J., Kulaga, D., Tyrer, D. Hawkes, A. and Hatton, L. (2026) ‘How can carbon pricing help achieve Scotland’s 2045 targets?’, ClimateXChange. https://doi.org/10.7488/era/7240
© The University of Edinburgh, 2026
Prepared by Logika Group and Imperial Consultants on behalf of ClimateXChange, The University of Edinburgh. All rights reserved.
While every effort is made to ensure the information in this report is accurate as at the date of the report, no legal responsibility is accepted for any errors, omissions or misleading statements. The views expressed represent those of the author(s), and do not necessarily represent those of the host institutions or funders.
This work was supported by the Rural and Environment Science and Analytical Services Division of the Scottish Government (CoE – CXC).
ClimateXChange
Edinburgh Climate Change Institute
High School Yards
Edinburgh EH1 1LZ
+44 (0) 131 651 4783
If you require the report in an alternative format such as a Word document, please contact info@climatexchange.org.uk or 0131 651 4783.
Income archetypes were based on the ten income ranges used in reporting of subnational residential gas and electricity consumption by Department for Energy Security and Net Zero (2025) Department for Energy Security and Net Zero (2025) (see Appendix B, Table 8). ↑