

ScotClimATE: A tool for understanding future extreme weather in Scotland
Research completed February 2026
DOI: https://doi.org/10.7488/era/6913
Executive summary
Project aims
The objective
Climate attribution research is the field of science looking at how climate change influences the intensity and likelihood of extreme weather events. It shows that those kinds of events are increasingly impacting people, places, infrastructure and services as global temperatures rise. To support forward-looking climate adaptation planning, decision-makers in Scotland require a new toolkit capable of rapidly translating attribution science into practical, future-proofed action (Grace et al., 2025).
The ScotClimATE online tool was developed to help Scotland’s public bodies plan for a world that is 2°C warmer than pre-industrial levels and to assess risks up to 4°C, in line with advice from the Climate Change Committee (CCC, 2021; Brown, 2025).
The ScotClimATE team identified a gap: there are no simple, easy ways to visualise future projections of extreme weather events in Scotland and how they may change as global temperatures rise.
The approach
Building on recommendations from Grace et al. (2025), this work translates methods from scientific literature and applies them through a new analysis of UK Climate Projections (UKCP18), an up‐to‐date and well‐tested ensemble of climate projections for the UK (Lowe et al., 2018). The tool includes an adjustment (bias correction), using observation-based data from HadUK‐Grid (Hollis et al., 2018).
The new analysis was built on two key components:
- a simple model for projecting Scotland’s annual average temperature based on global warming level (GWL)
- statistical models of the intensity and return periods, measures of the magnitude of extreme events and their frequency, using UKCP18 at different temperatures
The tool was developed in stages, with regular input from the Scottish Government Adaptation Team, alongside user feedback from the Public Sector Climate Adaptation Network (PSCAN).
Functionality and use of the delivered tool
ScotClimATE is designed to meet the needs of Scotland’s public bodies for strategic adaptation planning. It provides interactive visualisations of projected changes in extreme heat events, sustained heat over three days, extreme rainfall in a day, and extreme sustained rainfall over three days. It allows users to visualise how the intensity and return period of these extreme events change in UKCP18 data under different GWLs from +0°C 1850‐1900 average to +4°C. Results are projected onto an interactive map of Scotland, and users are provided a gauge of the spread of possible results based on UKCP18 data with confidence intervals.
Limitations of scope and methodology
Scope boundaries
The tool is designed for understanding infrequent, high-intensity events, typically expected only 1‐to‐10 times per century. It is not suited for assessing changes in usual weather, such as seasonal averages or possible high‐impact but low‐likelihood climatic changes (Arnell et al., 2025), not captured in the UKCP18 ensemble of 12 simulations. The tool does not provide projections for flooding. For this, users must use the latest information and guidance from SEPA. For events that are expected more often than once per year, or for assessing chronic changes, users should refer to the Local Authority Climate Service (Met Office, 2024a).
1.3.2 Data, model and analysis limitations
The tool does not provide projections for storminess, such as extreme wind and gust speeds, or storm counts due to the lack of available simulation data. It also does not provide extreme sub‐daily rainfall projections due to the required workload to build an analysis of observation radar data.
The tool uses UKCP18 simulation data as well as an adjustment (bias correction) using observed weather events (Met Office Hadley Centre, 2018c, 2019).
The ScotClimATE tool communicates uncertainty as confidence intervals based on the range of possible fits to the data.
The main findings
ScotClimATE fills a critical information gap in the adaptation toolkit
ScotClimATE addresses a specific gap, complementing existing tools – such as SEPA Flood Maps or the Local Authority Climate Service – by visualising low‐frequency, high‐impact extreme events. This helps complete the suite of resources needed for comprehensive climate scenario analysis.
Extreme heat and rainfall events to increase in intensity with a warming climate
The analysis shows that the hottest temperatures are projected to rise faster than average temperatures. It also shows that the most extreme one-day and three-day rainfall events in Scotland are likely to become more intense with rising global temperature.
User feedback validates the tool’s usefulness and usability
PSCAN users tested a prototype version of the ScotClimATE tool for extreme heat. 12 of the 13 testers who responded to the question found it to be ‘mostly useful’ or ‘very useful’ for helping them to plan for and assess changes in extreme heat at +2°C and +4°C, respectively. All testers who responded ‘agreed’ or ‘strongly agreed’ that the map was easy to use, and 13 out of 14 said the same about the slider function.
Additionally, PSCAN users provided a wealth of feedback into how they could use the tool for adaptation planning. These responses informed the development of the prototype tool into the delivered tool.
Future recommendations from the project
Tool deployment and governance
The ScotClimATE tool has been delivered to the Scottish Government for deployment as part of its materials to support adaptation planning and implementation in Scotland. To maximise its impact, public bodies should be encouraged to use ScotClimATE to better understand climate hazards. The tool’s capacity to help identify common hazards between regions can also be used to support collaboration between organisations.
Tool development
The tool provides a user‐tested framework for visualising the intensity‐return period relationship of simulated extreme events at different global warming levels. It can be expanded to include other climate hazards as suitable data becomes available. The methods used to produce ScotClimATE can also be applied to other UK regions covered by UKCP18.
A review should be conducted 12–24 months after launch to understand how the tool is being used and identify any needed improvements. This would provide practical insight into evolving user needs.
With the correct supporting materials, ScotClimATE could also be used as educational material to help people better understand present and future climate hazards in Scotland.
Terms and Abbreviations table
| CCC | Climate Change Committee |
| UKCCRA3 | Third Climate Change Risk Assessment |
| GWL | Global Warming Level. In ScotClimATE we define this as the global average near surface temperature difference during a period of analysis versus an estimate during a ‘pre-industrial` reference period from 1850 to 1900 (used by Morice et al., 2021; and IPCC, 2023). |
| SNAP3 | Third Scottish National Adaptation Plan (2024‐2029) |
| PSCAN | Public Sector Climate Adaptation Network |
| LACS | Local Authority Climate Service |
| GEV | Generalised Extreme Value distribution |
| shape, locationand scale(parameters of a GEV) | Parameters describing the relative distribution of the upper tailof a GEV, where the GEV is positioned on an intensity scale, andthe spread of the distribution on the intensity scale (see Auld et al., 2023; Coles, 2001a) |
| GEV withcovariate | Parameters describing the relative distribution of the upper tailof a GEV, where the GEV is positioned on an intensity scale, andthe spread of the distribution on the intensity scale (see Auld et al., 2023; Coles, 2001a) |
| The covariate | A parameter (e.g. a measure of a climate state) with which thedistribution of extreme events is observed to change. |
| bias correct | The use of results of observations to correct for unrealisticfeatures in model results (see Met Office Hadley Centre, 2021) |
| SEPA | Scottish Environment Protection Agency |
| UKCP18 |
UK Climate Projections |
| GCM | Global Climate Model |
| RCM | Regional Climate Model |
| CPM | Convective Permitting Model |
Introduction
Project overview
To support climate adaptation planning in Scotland, the ScotClimATE project provides accessible information on how climate change may alter the frequency and intensity of extreme heat and rainfall events in Scotland under different levels of global warming.
Policy context
The Climate Change Committee (CCC) is the UK and devolved governments’ independent expert advisor on climate change. In its 2021 advice for the third UK Climate Change Risk Assessment (UKCCRA3), the CCC outlined ten principles for good adaptation. One key principle was:
“Adapt to 2°C; assess the risks up to 4°C.” (CCC, 2021)
Building on this, the CCC’s 2025 advice stated that UK adaptation objectives,
“… should, at a minimum, prepare the country for the weather extremes that will be experienced if global warming levels reach 2°C above preindustrial levels by 2050. Planning for global warming levels reaching 2°C above preindustrial levels by 2050 should be a minimum level.
[…]
At the high end of possibilities, reaching 4°C above preindustrial levels by the end‐of‐century cannot yet be ruled out and should be considered as part of effective adaptation planning.” (Brown, 2025)
The +2°C GWL scenario represents a climate that is very likely within four decades under a high‐emissions scenario, and possible in a low‐emissions scenario (IPCC, 2023). The +4°C GWL scenario is plausible under high‐emissions scenarios by 2100 (IPCC, 2023).
Implementing the CCC’s advice requires accessible, decision‐useful data about climate hazards under different global warming levels. However, research by Grace et al. (2025) found the current climate data landscape to be a significant source of frustration for stakeholders in Scotland, with users in public bodies often finding it hard to obtain or interpret the data.
In Scotland, the statutory framework for adaptation planning is set by the Climate Change (Scotland) Act 2009 (2009). The Act requires Scottish Ministers to lay a national adaptation plan before Parliament every five years and places a duty on public bodies to help deliver the plan and report progress annually. The third Scottish National Adaptation Plan 2024‐2029 (SNAP3: Scottish Government, 2024) sets out Scotland’s current adaptation objectives alongside support for providers of public services to adapt to climate change and meet their statutory duties. This support includes updating the Public Bodies Climate Change Duties (PBCCD) statutory guidance, continued delivery of the Adaptation Scotland capacity‐building programme and development of a new tool on climate scenarios.
Project aims
The ScotClimATE project had a number of aims. The project deliverables included: the application of established analytical methods to a new analysis of extreme weather in Scotland; a tool to visualise that analysis; and this report that documents project deliverables and critical feedback from users of the tool. The key aims of the project are outlined below.
To be part of a climate adaptation planning toolkit for Scottish public bodies
The Scottish Government has identified the need for a toolkit to assist public bodies in adaptation planning for future climate hazards in Scotland. This need was initially identified by the ClimateXChange (CXC) report by Grace et al. (2025). This research also specified the necessary parameters of such a toolkit that could rapidly inform future‐proof climate adaptation planning.
To fill a critical information gap needed for adaptation planning
We (being the ScotClimATE research team throughout) have identified a key gap in the available information for adaptation planning in Scotland – readily available and easy to visualise projections of extreme weather events. Extreme weather events are categorised as individual unusually large intensities of hazardous weather (Coles, 2001a; Otto, 2017).
It is important that adaptation planning includes climate extremes (UKCCRA3; Catto et al., 2024). The intensity of extreme events at the same frequency may change at a different rate than average conditions.
To translate climate science for decision-making in public bodies
A key component of the ScotClimATE project has been the application of analytical methods and insights from scientific research literature to produce results that users can visualise with an online tool.
Insights from attribution studies (see Section 4) form the core of the underlying methodology that we have adapted to deliver ScotClimATE. We have built statistical models of extreme weather events in terms of their intensity‐return period relationship. Attribution studies provide robust insight into the impact of climate change on particular climate hazards: providing robust methods for quantifying and understanding how unusually hazardous observed events are in different climates. These methods provide a framework for projecting changes into possible future climates. In Section 4, we provide a background for how attribution methods can be applied to build a new understanding of extreme weather in changing climates. Explained in Section 8, we detail how we have applied some of these methods to understand extreme events in Scotland through their intensity‐return period relationship.
To deliver a user-friendly online visualisation tool based on key design criteria
As well as the new analysis in ScotClimATE, we have built a tool for providing useful results based on underlying data from the UK Climate Projection (UKCP18) set of modelled climate (Lowe et al., 2018). Users can visualise projections of extreme events under different climate scenarios that would otherwise require very particular expertise to produce. The tool achieves three design criteria informed by Grace et al. (2025):
- It provides useful quantification of hazards to inform climate adaptation. Namely, to prepare for +2°C warming, and assess up to +4°C warming (following UKCCRA3).
- It is tailored to meet the needs of public bodies.
- It is built to be easy to use by non‐scientists, with clear explanation.
To directly engage the target users and Scottish Government clients in the tool development
The target users of the ScotClimATE online tool are the Public Sector Adaptation Network (PSCAN). PSCAN is a space where representatives of more than sixty of Scotland’s public bodies convene and share learning and experience of adaptation in practice as well as receive training and support as part of the Adaptation Scotland Programme (Adaptation Scotland, 2025; Verture, 2025). In Section 9, we detail project interactions with PSCAN facilitated by Verture.
ScotClimATE has been built to provide projections of weather hazards only without providing information on the exposure or vulnerability of people or assets to that hazard. Grace et al. (2025) define a proportionate approach to climate scenarios analysis, where organisations develop their own understanding of what climate hazards threaten their service and assets.
The success of ScotClimATE in meeting each of these aims has been measured with feedback from PSCAN (Section 9), regular discussion with the Adaptation Team in the Scottish Government, and a reporting cycle with a steering group of experts in adaptation planning that has been coordinated by CXC.
Report structure
This report serves as a comprehensive overview of ScotClimATE. The first sections provide an overview of the scientific basis of ScotClimATE. In Section 4, we introduce leading theory on understanding extreme events that is applied in our analysis. In Section 5, we document available tools and datasets that offer insights for adaptation planning. Then, in Section 6, we introduce the delivered version of ScotClimATE. High‐level overviews of functional components of ScotClimATE are included in Section 7 on projecting from GWL to a climate state in Scotland, and in Section 8 on the statistical models of extreme events.
The last sections provide an overview of the production, use, and our suggestions for the future of ScotClimATE. In Section 9, we document the agile development cycle used to produce ScotClimATE. This includes results and syntheses of user feedback that have informed the development of the web tool interface and choice of hazards that can be visualised. To demonstrate possible use cases of the web tool, Section 10 presents a discussion of some results that can be produced using the statistical models behind ScotClimATE. Finally, our suggestions for future developments with ScotClimATE and conclusions from this work are documented in Section 11. Technical Appendices B, C and D are referenced in the body of this report.
Understanding changing extreme weather hazards
Scenario analysis based on GWL
When users analyse Global Warming Level (GWL) scenarios, they will build an understanding of changes in climate hazards with GWL. This understanding can be applied to adaptation planning, irrespective of the particular emissions pathway that leads to a different GWL. This intuitive approach lets users connect global climate change with changing climate hazards relevant to their service.
Grace et al. (2025) summarised the utility of identifying a small number GWLs in a scenario analysis:
- Fewer scenarios require less data gathering overhead.
- Each scenario can be considered in greater depth.
- Planning based on +2°C and +4°C challenges users’ current thinking to make resilient plans for possible future climates.
However, multiple scenarios would provide users the flexibility to understand the uncertainty due to different GWL projections (Grace et al., 2025).
Risk from extreme weather hazards
In line with Field et al. (2012) findings on the management of risks from extreme events in climate adaptation, Grace et al. (2025) define the need for understanding three components of risk when an organisation conducts a climate scenario analysis: hazard, exposure and vulnerability. Climate hazards are possible weather conditions and events that can cause damage and loss. Climate hazards have physical descriptions that are generic across analyses.
However, the amount of exposure of relevant people, systems and assets vary by organisation. Likewise, so does the level of vulnerability to the hazard of those exposed. This report and the resulting tool focus on an analysis of hazard that can provide useful information to inform climate scenario analyses.
Climate hazards are varied and complex. Recent years have seen a rapid development of new methods to understand extreme events in a changing climate. These developments have largely been driven by efforts in attribution: the quantification of changes in weather events due to human‐caused climate change (Otto, 2017; Thompson et al., 2025).
Probabilistic approaches are used to understand changes in the intensity and frequency of events (WWA, 2025). Further modelling efforts, such as storyline approaches are used to understand the extent to which the development, duration, and characteristics of particular events have changed with changes in climate (Shepherd, 2016).
Extreme events can be detected in the observed record (such as by Easterling et al., 2016). Catto et al. (2024) document ongoing efforts to build high‐resolution models of observed UK precipitation extremes. To produce ScotClimATE in the short development window available (3 months for the prototype version), we have used a probabilistic approach that is often used as part of attribution studies. To build projections, we have adapted the projection method of Auld et al. (2023). Probabilistic models for extreme events use appropriate statistical distributions to capture the relationship between frequency and intensity of extreme events. We fit Generalised Extreme Value (GEV) distributions to observed and projected events in Scotland.
Multiple hazard events can be far more destructive than single hazard events (Lee et al., 2024). However, our ability to fit probabilistic models to their frequency and intensity is heavily restricted by the individual nature of these events, small set of observations and the heavy workload required to identify or generate them using simulations. Therefore, in ScotClimATE we have only attempted to provide visualisations of single hazards.
Identified weather hazards
The CCC (2021) identified a number of risks to human and natural systems in the UK from a variety of different hazards. Additionally, Catto et al. (2024) document a number of published and un‐published resources for understanding an array of climate hazards that are under development as outputs of the UK Climate Resilience programme.
In building ScotClimATE we have considered a variety of different hazards (see Section 6 and 9). We determined our selection of hazards to include in the tool based on four factors:
- Whether a more suitable tool already exists for visualising the hazard (Section 5).
- How useful information on the hazard is to help in climate adaptation planning and decision‐making.
- The availability of data suitable to base a projection of the hazard.
- The difficulty of analysing and implementing the hazard – whether it was possible within the length of the project.
Extreme temperature was the most obvious hazard to include, and least difficult to implement in the proposed methodology due to these events’ large spatial scale and physical relationship to average temperatures (see Section 8).
This includes the hazards of extreme heat events and extreme cold events. The relationship between the intensity and the frequency of these events can be described with statistical models using extreme value theory (Auld et al., 2023; Coles, 2001a).
Projections of extreme heat are particularly useful due to the non‐linear increase in risk from increasingly high temperatures. Empirically, this has been described with J‐shaped curves of relative risk curves with temperature, where mortality risks from extreme heat increase more steeply beyond a certain temperature threshold (see Gasparrini et al., 2022; Masselot et al., 2023; Public Health Scotland, 2025). We apply our analysis throughout Scotland, but for the hazards considered there are often other analyses that can also provide useful insight. For example, the HOTdays analysis has delivered a characterisation of heatwave properties specific to major UK cities (Brown, 2020).
Extreme rainfall was considered the next least difficult hazard to implement due to the availability of observations and model data. Rainfall extremes can also be projected using extreme value theory (Gründemann et al., 2023). However, fluvial flooding extremes arising from rainfall require a more complex modelling of drainage basins. Projections of UK fluvial flooding and the required capacity of drainage systems have been developed by the FUTURE‐DRAINAGE project (Chan et al., 2023).
We identified that projections of the highest rainfall in one or three days was achievable during the ScotClimATE project. For this, we have been able to exploit daily rain‐gauge observations included in HadUK‐Grid (Hollis et al., 2018). To understand extreme rainfall at a higher temporal resolution, researchers can use weather radar data. There is weather radar coverage at least 5 km resolution over most of Scotland (Met Office, 2007). These data are available from Met Office (2003) in sub‐hourly gridded format processed by the Nimrod radar data system since late 2002, or processed with rain gauge measurements by the HYRAD system (UK Centre for Ecology and Hydrology, 2025). Processing and validating such data requires more time than was available in the ScotClimATE project, so visualisations of sub‐daily rainfall have not been included.
We also considered including the hazard from storm surge flooding. The weather that produces storm surges is not expected to significantly change with increasing GWL (Met Office Hadley Centre, 2018a), but mean sea levels will rise in time as a response to prolonged heating (Arias et al., 2021, box TS.4). We have identified a relatively low implementation difficulty for this hazard, but have not included it due to its dependence on time and global warming pathway, and because coastal flooding is already included in existing tools (see Figure 1).
While we have found that users need future storminess projections (Section 9), we currently lack validated model data to understand future storminess in Scotland. However, a detailed analysis may be accomplished in several years’ time with the emergence of new datasets. The ongoing CANARI (Climate Analysis, Attribution and Impacts) project will provide a large ensemble of high‐resolution storm tracks that can be sampled to understand changes in storminess and gusts (see CANARI, 2025).
Seasonal lack of rainfall is another hazard that can be projected with a moderate implementation difficulty. This hazard can be understood by calculating the seasonal standard precipitation index, which is the normalised anomaly versus a reference period. However, this hazard would not be analysed in the same framework of extreme value theory, and it was determined that users should usefully receive drought projections from Scottish Environment Protection Agency (SEPA) guidance.
Finally, we note that at present we will be unable to produce robust predictions for changes to weather related fire as there is no suitable model for predicting wildfire risk in Scotland due to its particular distribution of plant matter and topography (Naszarkowski et al., 2024). Instead, we advise users to consider that an increased probability of wild fire ignition is likely to co‐occur with drought extremes.
What attribution tells us about changes in extreme weather events
We have applied insights from attribution studies to provide the framework to understand changing extreme weather hazards with climate change in Scotland. The World Weather Attribution project (WWA, 2025) have developed rigorous methodologies for attribution of extreme weather events to human‐caused climate change, and the communication of this causal link. The process of attribution begins by identifying an extreme weather event. This can be triggered by the severity of impacts of the event; in the methodology provided by Philip et al. (2020), this is the number of recorded deaths.
In the probability framework for attribution, researchers first calculate the probabilities of an event as or more extreme as an identified event occurring: (a) in a year in the present climate, and (b) in a counterfactual climate without human induced warming (Otto, 2017; Philip et al., 2020). The probability ratio of (a) to (b) is used as a metric to quantify how climate change has altered the hazard of the identified event (Philip et al., 2020). When damage curves are identified to convert the intensity of extreme events into impacts, the probability ratio of weather hazard occurrence can be converted into a risk ratio of damage and impacts.
The probabilistic attribution approach provides insight into changes in the intensity and likelihood of an event. However, recent advances in attribution techniques allow researchers to test the impact of climate change given similar underlying weather patterns for an event (Thompson et al., 2025). These methods are providing new insights into both changes in duration of events and the drivers of these changes (Thompson et al., 2025). Future trends in extreme weather events are understood from the synthesis of many lines of evidence, from probabilistic attribution to comparisons with multi‐model ensembles, observational evidence and theoretical analysis (Otto et al., 2024).
ScotClimATE is built on an analysis of extreme events in UKCP18 projections with bias correction based on observations (Section 6). To do this, we have exploited the conceptual link from attribution of extreme events in the present day to projections of extreme events in possible future by extrapolation of the observed statistics of weather extremes (see Philip et al., 2020).
Previous analyses of extreme events in Scotland
There are a small number of previous analyses of the statistics of extreme weather events at high spatial‐resolution in Scotland. Undorf et al. (2020) provide a deep analysis of the 2018 summer heat in Scotland, exploiting data from observations as well as a variety of simulations. Higher likelihood of extreme heat was attributed to human‐induced warming, and there is an increased likelihood of heat exceeding that experienced in 2018 since then than before. Their work identified that extreme heat is an important concern for climate adaptation in Scotland (Undorf et al., 2020).
In the attribution and projection framework, analysis of extreme rainfall has been limited to particular events: the extreme rainfall that led to the 2020 fatal derailment near Carmont (Tett et al., 2025), and the 2021 cloudburst event over Edinburgh Castle (Tett et al., 2023). Simple physics suggests that the distribution of extreme rainfall events may shift to higher intensities in a warming climate. The mass of water that can be held by air increases by approximately 7% for a 1°C increase in temperature of the same mass of air. This fundamental physical equation is called the Clausius–Clapeyron relation. However, the scaling of extreme rainfall with warming climate has been found to depend on a number of factors determined by both location and changes in atmospheric circulation. There is a broad understanding that the distribution of extreme rainfall intensity can increase at rates faster than Clausius‐Clapyron at the shortest temporal scales (several hours), but at rates equivalent or less than Clausius‐Clapyron over longer (one day or longer) events (Fowler et al., 2021). These dynamics have been identified during the particular 2020 and 2021 events that have been studied (Tett et al., 2025, 2023).
The limited extent of published work on the links between climate change and extreme weather events in Scotland has resulted in few direct applications of this knowledge. In one rare example, O’Neill et al. (2022) have applied new understanding of changes in extreme rainfall to a climate change impact assessment for Edinburgh’s cultural heritage sites built on an assessment of impacts and changes in risk.
ScotClimATE has been designed for understanding changes in the relationship between intensity and return period for single weather hazards such as high heat or heavy rainfall. However, for many historical natural disasters, the impacts of weather events have been amplified due to the compounding of multiple weather hazards occurring within a single event (Lee et al., 2024). The National Centre for Resilience has identified a number of intersecting hazards that pose risk in Scotland (Simmonds et al., 2022).
Available tools and datasets
There are several tools available for a user to gather knowledge of climate hazards facing their service. Before using ScotClimATE, users should first consider what hazards they need to understand.
How to decide which tool to use
We suggest a workflow to help users build an understanding of climate hazards from an adaptation perspective.
- The user should build a familiarity with UK climate, weather, and terminology used to describe this. The latest State of the UK Climate report (Kendon et al., 2025) provides a description of the weather in 2024 within a discussion of changing UK climate.
- Based on their service, they should determine the particular hazards they need to consider.
- If the user is assessing flood risk from fluvial, coastal or surface water and small watercourses, they must refer to SEPA Climate Change Allowances Guidance (Scottish Environment Protection Agency, 2025a) and SEPA Flood Maps (Scottish Environment Protection Agency, 2025b).
- If the user is assessing heat or rainfall extremes they should use the Local Authority Climate Service (Met Office, 2024b) to understand chronic and seasonal changes, and ScotClimATE to understand rare extreme events.
The decision process for choosing which of these tools to use based on the type of hazard is shown in Figure 1. If a climate scenario analysis also includes impacts of coastal changes, users should access Dynamic Coast resources. The Dynamic Coast web maps service provides projections of future coastal erosion in Scotland (Rennie et al., 2021).
Datasets used in ScotClimATE
ScotClimATE is a tool for visualising the statistics of extreme weather events at different global warming levels in UKCP18, with some level of bias correction based on observations. To this end, the tool is built from several datasets listed in Table 1.
HadCRUT5 is a large number of time series, each of which is an estimate of global surface temperatures anomalies from 1850 to the present (Morice et al., 2021). We use this to define the GWL (see Section 7). UKCP18 is a set of climate projections with an ensemble of twelve 100‐year simulations identified by Grace et al. (2025) as the appropriate source of projected UK climate to inform adaptation planning. These simulations begin with a lower resolution Global Climate Model (GCM; Met Office Hadley Centre, 2018b). The output from the GCM are downscaled for the UK region with physics at smaller spatial scales using a Regional Climate Model (RCM; Met Office Hadley Centre, 2018c), and again at very high resolution with a Convection Permitting Model (CPM; Met Office Hadley Centre, 2019).
We analyse the GCM output to understand the global surface temperature in the simulations (see Sections 7 and 8). The RCM downscaling provides information on Scotland temperatures. The CPM downscaling introduces additional physics important in simulating the heaviest rainfall events, we use these data to build the extreme rainfall projections in ScotClimATE. However, due to the closeness to the domain boundary, the CPM output is not valid over the Shetland Islands (Met Office Hadley Centre, 2019). Users should note that ScotClimATE does not provide extreme rainfall projections there.
It is important to note that while the CPM is run at a higher spatial resolution than the RCM, this does not necessarily mean that the output is a more accurate model of real‐world weather (Lowe et al., 2018). By using the RCM data to model extreme heat – which are generally much larger spatial‐scale events than the most intense rainfall events – we avoid including potentially unrealistic dynamics which may result from the additional complexity of the CPM in our analysis.
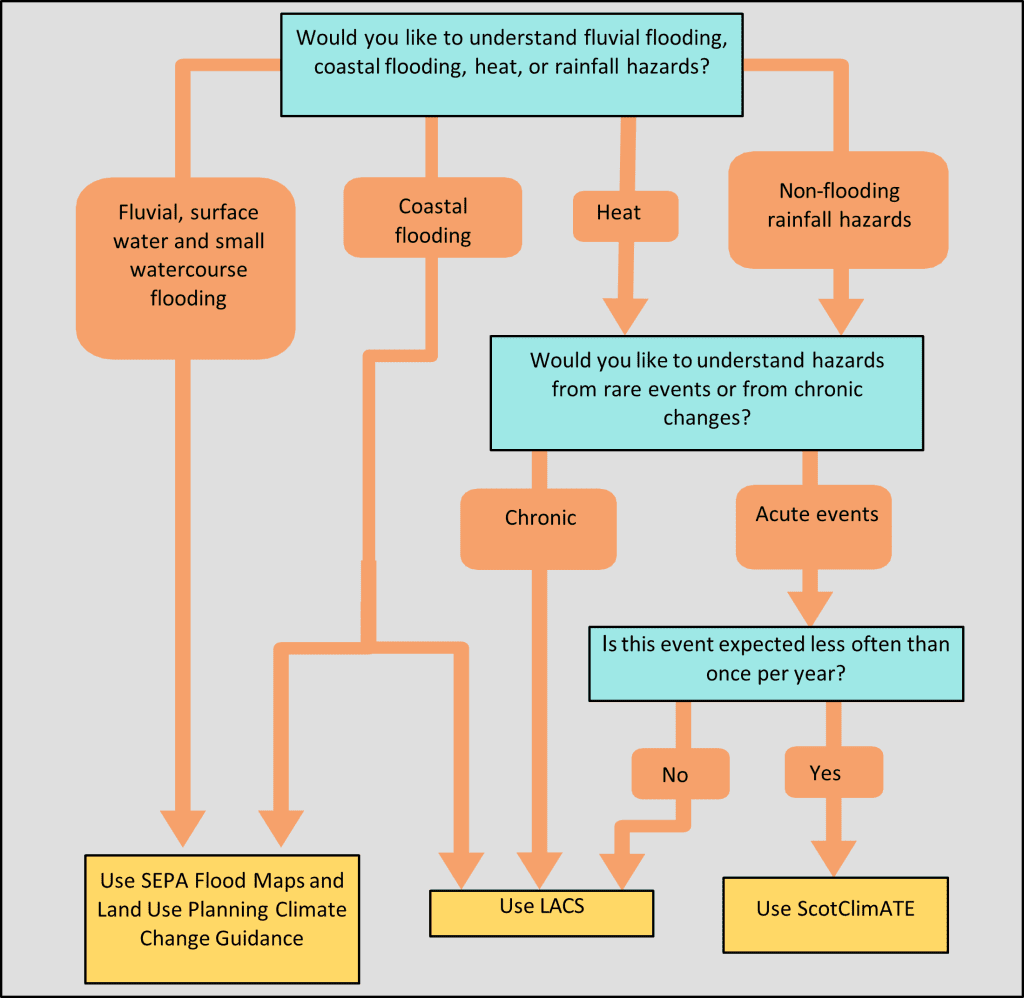
Figure 1: A diagram indicating which tool users can use to find projections for different hazards in Scotland.
| Dataset | Description | Reference |
|---|---|---|
| HadCRUT5 | Ensemble of 200 time series of estimated global near surface temperature anomalies versus the 1961 to 1990 reference period. | Morice et al. (2021) |
| UKCP18 GCM | Global Climate Model projections on a 60km grid. | Met Office Hadley Centre (2018b) |
| UKCP18 RCM | Regional Climate Model downscaling of GCM projections on a 12km grid. | Met Office Hadley Centre (2018c) |
| UKCP18 CPM | Local projections on a 5km grid re‐gridded from Convective Permitting Model downscaling of RCM projections on a 2.2km grid. | Met Office Hadley Centre (2019) |
| HadUK‐Grid | Gridded observation data over the UK land Surface. | Hollis et al. (2018) |
Table 1: Datasets underlying ScotClimATE. An overview process map is included in Appendix A for how data from these datasets are included in ScotClimATE.
The last dataset we use is HadUK‐Grid. This includes temperature and rain‐gauge measurements from UK weather stations interpolated onto a grid covering the UK land surface (Hollis et al., 2018). We use this observation-based dataset to provide the basis for some bias‐correction for ScotClimATE. However, there are a few limitations of these observations. There is limited weather‐station coverage, particularly in more sparsely populated areas of Scotland. Rain‐gauges are useful for sampling 24 hr accumulated rainfall at a single point: not all types of precipitation or precipitation in any place. In the UK, rain‐gauges are measured at 9am so these data do not capture identical diurnal effects in accumulated rainfall as would be experienced in periods defined by calendar days that start at midnight.
The delivered tool
ScotClimATE provides users with visualisations of analysed climate extremes using a web‐tool with a graphical interface. The analysis is built on existing datasets with the purpose of providing a framework for public sector users to quickly retrieve useful projections without the need for specialist scientific expertise.
The primary scientific outputs are local estimates of the relationship between return period and intensity of extreme heat and rainfall events in UKCP18 data. The return period is the reciprocal of the probability of exceeding an intensity threshold in a given year. For a very long simulation, the return period is the average number of years between an intensity threshold being exceeded. Alongside these estimates are uncertainty analyses communicated as confidence intervals of the fit to the available data. Users are able to visualise:
- the intensity of extreme heat or rainfall events at different return periods and GWL
- the return period of the extreme events of different intensities and at different GWL
- the change in intensity of the extreme events at the same return period between different GWLs
- and the change in return period of the extreme events at the same intensity between different GWLs
In Section 10, we provide examples of how users can interpret these results to understand extreme weather in Scotland. If users have a defined return period of hazard that their service is expected to withstand, then they can project a map of projected intensity of weather hazards at that return period. Alternatively, if users are aware of a particular threshold of hazard intensity that people or assets of their service are vulnerable to, then they can project the return period with which they can expect that threshold to be exceeded. Projecting changes in the intensity‐return period relationship of hazards could be especially useful where users wish to understand additional stresses of climate change on their current service design.
The components of ScotClimATE
ScotClimATE is built from four key components. These components work together to deliver visualisations of climate extremes through an interactive user interface.
- GWL scenarios are converted into a Scotland annual average temperature value (Section 7 and Appendix B).
- Statistical models are fitted to simulation data and observations (Section 8 and Appendix C). The simulation data is used to provide insights into the rarest extreme events, and how extreme events change with Scotland climate. Observation data is used to bias correct models fitted to simulation data.
- Using the online user interface, users can select hazards, select GWL scenarios and visualise results.
- The intensity and likelihood of extreme events at different GWLs are calculated based on the user selection. These values are returned to the user interface with confidence intervals calculated from the uncertainty accumulated at each fitting stage (Appendix D).
Purpose and caveats
ScotClimATE fulfils a very specific purpose – to support strategic decision-making in climate adaptation (Scottish Government, 2025). ScotClimATE provides information on how climate change may alter the frequency and intensity of extreme heat and rainfall events.
To this end, we have applied an analytical method to build statistical models of this relationship (Section 8). We have fit non‐stationary GEV distributions with covariate (such as in Auld et al., 2023; Coles, 2001b) to extreme events in UK Climate Projections (UKCP18) UKCP18 data is downscaled to different resolutions (see Section 5): we provide projections at the same resolution as the underlying data: on a 12km‐grid for RCM data for extreme heat and on a 5km‐grid for CPM data for extreme rainfall (see Figure 2 and Section 8). The CPM data is provided with a caveat that the downscaled data are not validated close to the UK‐region domain boundary (Kendon et al., 2019), as such ScotClimATE does not provide extreme rainfall projections for Shetland.
We apply a limited bias correction to the fits to UKCP18 using HadUK‐Grid observational data (Section 8.4). This correction adjusts the location parameter of the fitted GEV distribution to align frequent extremes in the recent climate with observations, while retaining the scale and shape parameters estimated from UKCP18 simulations. However, in this, we have assumed that it is appropriate to use observations to correct the relationship between the intensity and frequency of the more‐frequent extreme events in the observed climate, while we preserve the relationship of how much more intense the rarest extremes are compared to the more‐frequent extremes from simulations (Section 8). This means that projections of the highest intensity weather events expected every few years in the recent climate are corrected to look like recent observations. However, there is a key caveat that the difference in the projections of higher intensity of the rarest events, expected in tens of years or longer, is informed only with simulation data. As a result, the difference in projections of the most extreme and rare events versus frequent extremes in the present remains primarily informed by the structure of the climate model simulations rather than by observational constraints.
There are several reasons for this assumption. For annual heat and temperature maxima we have available 1200 years of simulation data (downscaled UKCP18 data are available in twelve one‐hundred year simulations), and less than one‐hundred years of observational data. Additionally, particularly at warmer climates than present, UKCP18 projections can produce rare extreme intensities during conditions that may be physically possible but have not yet been observed. In the case of extreme heat, this is likely to arise from land‐surface interactions such as drying.
At delivery, ScotClimATE is only built to visualise extreme heat and rainfall events. This limited selection of climate hazards is due to: constraints from the short turnaround time for the project; already available tools, such as SEPA Flood Maps and SEPA Climate Change Allowances Guidance for flooding and LACS for storm surge height; and due to the limitations of existing data and theory, such as the present lack of reliable predictions for future storm tracks (see Section 4).
To this end, and to avoid the confusion of multiple tools providing conflicting results for the same hazard, the choice of hazards included in ScotClimATE has been arrived at through consultations with PSCAN, Scottish Government Adaptation Team, and a steering group of experts organised by CXC. The online tool includes a disclaimer that users must agree to before accessing the tool. This disclaimer highlights that projections of climate hazards are not provided for specific domestic or commercial properties. When the hazard relates to flood risk, the SEPA Climate Change Allowances guidance and Flood Maps should be used.
Communicating confidence and uncertainty
Along with the central estimate of any statistic, we provide a gauge of the spread of possible results given the available data. To communicate this spread we adapt a calibrated language for communicating confidence intervals from IPCC (2005). These are listed in Table 2. However, we use a much more limited definition of level of confidence than the IPCC. As ScotClimATE is built to understand results in the underlying datasets (listed in Table 1), confidence in this context is only a calculation of the chance a fit represents the underlying data.
| Calibrated language | Quantile range | Meaning |
|---|---|---|
| Very high confidence | 5% to 95% | 9 in 10 possible fits lie in this range |
| High confidence | 10% to 90% | 8 in 10 possible fits lie in this range |
| Medium confidence | 25% to 75% | half of the possible fits lie in this range |
Table 2: Calibrated language used to communicate level of confidence of results. This is adapted from a table from IPCC (2005).
These confidence intervals reflect statistical uncertainty in the fitted model given the available data. A wide interval indicates that the result is weakly constrained. They do not represent the full range of possible climate futures, which would require consideration of additional models and scenarios.
The map interfaces
ScotClimATE visualises results with a coloured data layer over a zoomable and scrollable map. By clicking on individual grid cells, users can display the precise result and confidence intervals at that location (see Appendix D). The map interface highlights which cell the user is interrogating.
The map is displayed in the OSGB36 National Grid projection (explained in Ordnance Survey, 2025a). The National Grid projection has been chosen for several reasons:
- The underlying UKCP18 and HadUK‐Grid is distributed on this projection so we avoid introducing additional process uncertainties in re‐gridding.
- Maps on this projection are familiar to users who have used other Ordnance Survey map products.
- While the vertical axis does not correspond with North‐South, straight lines in this projection correspond very closely with straight lines on the ground.
- Distances between different points scale very closely within the Scotland domain, and displayed cells have almost exactly the same area as each other.
The last two points would not hold with a latitude‐longitude based projection, with distortion becoming worse further North. By providing data in same‐area cells, spatial averaging and visual comparison over areas – such as within Local Authorities – is intuitive. ScotClimATE provides a download function, where the downloaded comma‐separated values (.csv) or netCDF‐4 (.nc) files also contain the latitude‐longitude coordinates of the cell centres.
The underlying map uses Ordnance Survey data that represent geographic information at different zoom levels, including: settlement names, roads, hill‐shading and contours (available from Ordnance Survey, 2025b). Over this, users can choose to plot Local Authority Boundaries or NHS Boards. The data layer is coloured using colour‐scales selected for clarity and accessibility using ColorBrewer advice for cartography (see Harrower and Brewer, 2003). Users are able to adjust the opacity of the data layer to adjust the display of visualisations to their preference. Users may wish to use screen capturing software to save and share useful visualisations.
Hazard selection and slider interfaces
In the online tool, the control panel contains a number of sliders and information boxes. The information boxes provide descriptions of what the users are visualising based on the hazard selection and slider settings. Information boxes can be minimised, but the text is displayed by default and inline to facilitate accessibility where screen readers are used. The text of the descriptions is designed to equip the user with appropriate language for communicating what they are viewing in a way that is clear and concise, but still consistent with wider specialist literature in climate science.
At delivery, ScotClimATE can be used to visualise two extreme heat hazards and two extreme rainfall hazards. These are:
- Extreme heat: the highest maximum temperature.
- Sustained heat threshold for hot nights: the highest minimum temperature over three consecutive days.
- Extreme 1‐day rainfall: the most rainfall in one day.
- Extreme 3‐day rainfall: the most rainfall over three consecutive days.
After selecting a hazard, the user will choose a GWL. This varies from +0°C , being the 1850‐1900 reference period, to +4°C . It is important to note that users are selecting a global warming level, not a Scotland domain warming level. The projection of Scotland climate from GWL is discussed in Section 7. ScotClimATE does not allow users to visualise beyond a GWL of +4°C. This would be considering GWLs beyond those simulated in UKCP18. In this sense, we provide results from the statistical model only as interpolation within a range of simulated climates (see Philip et al., 2020).
When visualising results, the intensity of the hazards is the highest threshold expected to be exceeded in the return period. Users can choose to set intensity and visualise return period, or set return period and choose to visualise intensity. The process by which these hazards were selected for inclusion in ScotClimATE is discussed in Section 9.
Users can gain additional insights by comparing the change in the intensity‐return period relationship between different GWLs. When users select a visualisation of a change, they will have to also set a comparison GWL slider.
Return period sliders run from 10 to 100 years. Users may otherwise adjust an intensity slider which has a description and units that change with the choice of hazard, °C of temperature and millimetres of accumulated rainfall. The colour‐scale of the data layer changes with hazard selection.
Climate change in Scotland with global warming level
The UKCCRA3 advises adaptation planning based on defined GWLs (CCC, 2021). To capture how the intensity‐return period relationships of an extreme event vary with climate, ScotClimATE is built on non‐stationary GEV fits to the underlying data with a changing Scotland climate, measured as the year‐average temperature, as a covariate. However, due to global climate dynamics and local geography, the temperature of different regions change at a range of different rates with changing GWL. This section outlines the process we have designed to project a Scotland climate from a GWL. This is calculated as an anomaly from the 2000‐2020 reference climate with the change in Scotland climate with GWL following the sensitivity in UKCP18 simulations.
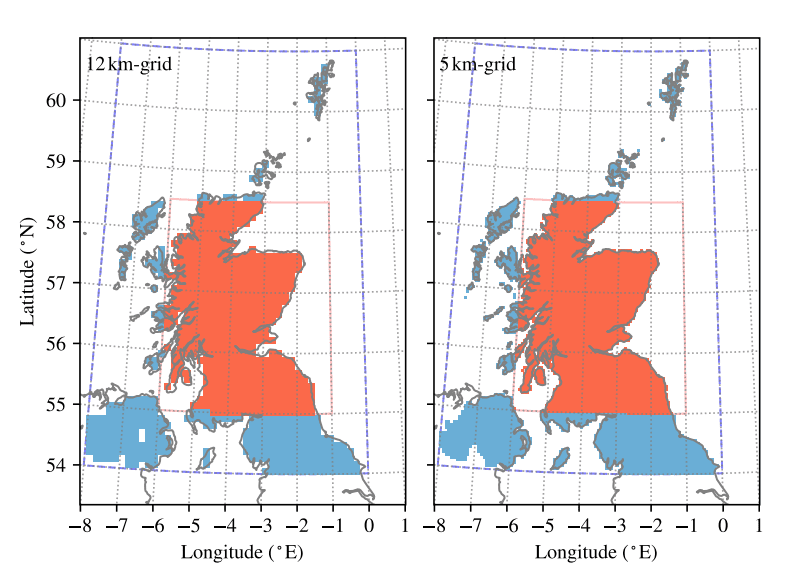
Figure 2: Scotland average temperature calculated from the shading in red. Left shows the 12km grid; right shows the 5km grid. (Cells where the models are fit (54°N to 61°N and −8°E to 0°E, blue and red shading), and the Scotland mainland land‐mask of Had‐Grid reporting cells (bound by 55°N to 58.5°N and −6°E to −1°E, red shading), projected onto the British National Grid).
Scotland year‐average temperature is an appropriate choice of covariate given the available data as, within the UKCP18 ensemble, there are large differences in average temperature at each simulation year. Our method uses information from the most intense weather events each year from all ensemble members, not a sample taken only from the hottest or wettest ensemble members.
Defining a global warming level
The GWL can be defined in various ways. We have used a commonly accepted and widely used definition, global average near surface temperature anomaly versus a pre‐industrial 1850‐1900 baseline (Morice et al., 2021). Many datasets are available for near‐surface, or 2 m above surface, air temperature.
We use HadCRUT5 data to estimate the GWL during a 2000‐2020 reference climate. HadCRUT5 provides a large ensemble of 200 estimates of the time series of global average temperature from 1850 versus a late twentieth century baseline. The largest spread between estimates is during the earlier part of the time series, where fewer weather observations are available, and more extrapolation is required. By randomly sampling from all possible 2000‐2020 GWLs from HadCRUT5 in our analysis, we are able to quantify this uncertainty in our analysis. The distribution of these estimates is shown in Appendix B.
Measuring climate change in Scotland
Operationally, there already exist indices for Scotland. For example, Jones and Lister (2004) have produced a Scotland temperature index based on a selection of weather station output, and Met Office (2019) define Scotland regional climatology using all land surface in Scotland.
However, to build ScotClimATE we have had to develop a particular definition of Scotland mainland average temperature to provide a relevant measure of Scotland climate that captures general changes with GWL. Plotted in Figure 2, we average over cells within mainland Scotland, bound by 55 to 58○N and −6 to −1○E. This selection excludes outlying islands and far‐western coastal areas where climate changes are likely to be heavily moderated by the slow‐changing northern Atlantic Ocean compared with inland and eastern areas. This simple definition can be applied to both UKCP18 and HadUK‐Grid data, and can be readily reproduced in other datasets.
To calculate the 2000‐2020 baseline climate, we use the annual average mainland Scotland climate. There is particular uncertainty in this calculation due to inter‐annual variability that the twenty year window is not long enough to account for. However, a much longer window would introduce other uncertainty, especially due to changing aerosol distributions over the late twentieth century. We apply a bootstrapping method – calculating averages of sets of randomly resampled 2000 to 2020 annual average temperatures with replacement – to find a distribution of possible baseline Scotland climate.
Finally, we estimate the sensitivity of Scotland temperature to GWL from UKCP18 annual average data. For this, we use the °C change in annual average Scotland mainland temperature in the RCM with the °C change in global average surface temperature in the GCM. This is shown in Appendix B (Figure 13) alongside a bootstrapping of 1000 estimates of this sensitivity for each ensemble member. To do this, we have assumed a linear sensitivity of Scotland temperature over the approximately 4°C change in GWL in each simulation. Inspection of the UKCP18 data shows no clear evidence of non-linearity over the simulated warming range, so a linear approximation is adopted. Other model results should also be analysed to build a deep understanding of how Scotland’s climate may change with global warming.
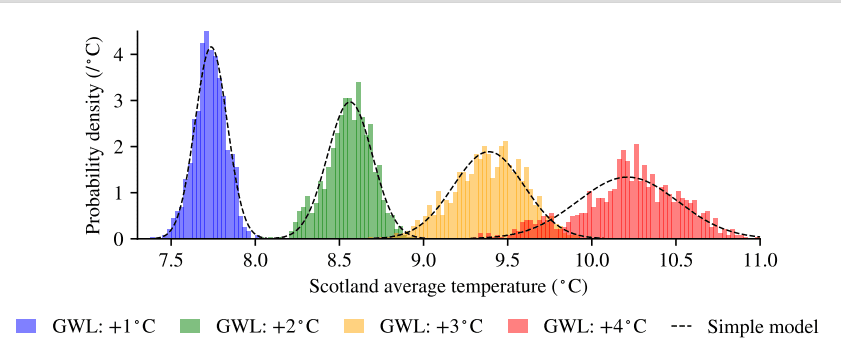
Figure 3: The histograms show 1000 estimates of projected Scotland average temperature distributions at four global warming levels (coloured bars). Distributions shift progressively to higher temperatures with increasing GWL. Dashed lines show a simple model fit closely matching the simulated distributions, expressed as probability density per °C.
A model for Scotland’s temperature
We consider changing Scotland temperature using the three components discussed above:
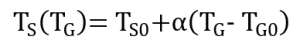
where TS(TG) is the projected Scotland average temperature at a GWL of TG, TS0 is the 2000‐2020 baseline Scotland temperature calculated from HadUK‐Grid, TG0 is the 2000‐2020 baseline GWL calculated from HadCRUT5, and α is the sensitivity of Scotland temperature to GWL calculated from UKCP18.
Without assuming underlying probability distributions of the values of TS0, α and TG0 we have randomly resampled the estimated values of these parameters to calculate 1000 bootstraps of possible values of TS at different GWLs. This is shown as histograms of different colours in Figure 3.
We have built a simple model to estimate TS(TG) with uncertainty. By assuming Gaussian distributions of possible values of TS0, α and TG0, we have calculated a mean fit and standard deviation of the parameter estimates (Table 3). Then, Equation 1 can be used to quickly find an estimate and uncertainty of TS(TG). These are included in Appendix B.
Probability distributions of this simple model are included in Figure 3. It effectively captures the underlying distributions of the bootstrapped estimates. As GWL is increased from the estimated GWL during the recent climate reference period (+1°C , Table 3), the uncertainty in Scotland’s climate quickly increases. Table 3 documents that the estimate of 0.83 ± 0.10°C increase in Scotland’s average temperature per °C increase in GWL is a major source of uncertainty in projecting future climate in Scotland.
| Parameter | Definition | Mean fit | Standard deviation | Source data |
|---|---|---|---|---|
| TS0 | Scotland average temperaturefrom 2000 to 2020 | 7.73○C | 0.09○C | HadUK‐Grid |
| α | Scotland average temperature change with GWL | 0.83 | 0.10 | UKCP18 GCM and RCM |
| TG0 | Global average temperaturechange for 2000 to 2020 versus 1850 to 1900 baseline | 1.00○C | 0.04○C | HadCRUT5 |
Table 3: Parameters used in projecting Scotland climate, TS, at different global warming levels. These parameters are used in Equation 1.Source data are described in Table 1.
Statistics of extreme events
Defining extreme events
We earlier categorised extreme events by their unusually large intensity (Coles, 2001a). However, it is obvious that this definition can be interpreted in a number of ways – and, for the purpose of understanding climate hazards, it is often useful to understand multiple definitions of extreme climate hazards.
Defining extreme events based on their frequency
Extreme events considered in ScotClimATE are categorised purely by how unusually intense they are. The statistical model is fit only to the set of single most intense events for each year. This annual maxima approach is used for consistency across hazards and ensemble members, and provides a stable basis for estimating return periods of rare events. The tool is used to visualise intensity thresholds of heat and rainfall that are expected to be exceeded once in ten or more years, or the return period of intensities that are only expected once every few years or longer.
To reiterate – the purpose of ScotClimATE is to provide users information on the most challenging weather for adaptation, and how this is projected to change with GWL. By using this method, we are able to directly analyse the intensity‐return period relationship of extreme events, and build statistical models that can project the behaviour of the rarest events that may have been seldom or never yet observed.
Defining extreme events based on clear quantifiable intensities
However, there are likely to be cases where scenario analysis requires users to consider other definitions of extreme hazards.
It is clear to communicate thresholds that are connected to our day to day understanding of potentially hazardous weather. For example, for extreme heat LACS (Met Office, 2024a) communicates:
- ‘Summer Days’ as passing a threshold of 25°C
- ‘Hot Summer Days’ as passing a threshold of 30°C
- ‘Extreme Summer Days’ as passing a threshold of 35°C
Defining extreme events based on their impacts
Alternately, as adaptation planning is built on an understanding of risk, which is a product of hazard, exposure and vulnerability (Field et al., 2012; Grace et al., 2025): it is clear that it is also important to understand extreme events based on their impact. High impact, high mortality, events may not necessarily be the most unusually intense events (Philip et al., 2020). Indeed, many of the highest impact events result from compounding hazards, where the individual hazards may not have exceptionally high intensity (Lee et al., 2024).
There may be empirical definitions of extreme weather based on identifying thresholds linked to impacts on human life. The clearest example is the risk linked to temperature hazards (for a UK analysis see Gasparrini et al., 2022). For example, Masselot et al. (2023) have calculated empirical relative risk relationships between high and low temperatures and excess deaths in European cities. The threshold for increased mortality from high‐heat can be lower than one might expect; Public Health Scotland (2025) have used mortality data to identify 18.2°C as a threshold for Scotland temperature above which there is significant increased risk of death.
The Generalised Extreme Value (GEV) distribution
The use of non‐stationary GEV with some appropriate selection of covariate that captures wider scale climate change has been established for climate attribution of extreme events (Philip et al., 2020). It has further been used to project how the distribution of extreme events changes with human induced forcing (such as by Auld et al., 2023).
The Generalised Extreme Value distribution (GEV) describes the distribution of the maximum values of a distribution in each of a series of independent blocks (Coles, 2001a). In ScotClimATE, the blocks are individual years, and the maxima are the most intense heat or rainfall events in each of those years. By selecting block maxima, we simplify the analysis versus selecting the peak values above a specified threshold: there is a clear relationship between the fitted distribution and the return period; we ensure that all extreme events are independent of each other; and we are able to easily include data equally from all UKCP18 ensemble members despite large temperature differences between ensemble members.
The process for this is:
- We extract extreme events from simulations and observations.
- We consider these with the modelled or observed annual average temperature in Scotland in the year when they occur.
- We fit an appropriate non‐stationary GEV distribution that captures how the statistics of the extreme events change with the annual average temperature in Scotland.
- We bias correct so that frequent present events look like observations, but projections at higher GWLs are informed by simulations.
- We test many possible resamples of the data to calculate confidence intervals for every result.
The non‐stationary GEV introduces changes in selected terms of a stationary GEV with a changing covariate (Coles, 2001b), such as changing climate. The stationary GEV is described with three parameters (see Coles, 2001a): the location describes position of its centre on an intensity scale; the scale describes the spread of the distribution on an intensity scale; and the shape describes the behaviour of the upper tail of high‐intensity events. In ScotClimATE: the location tells us about frequent extreme events that are expected to occur every few years; the scale tells us about the variability between years; and the shape tells us about how much more intense the rarest events are compared to the distribution of more-frequent events.
Depending on the value of the scale parameter, a GEV may have a defined upper limit or not. Auld et al. (2023) note that GEV distributions fit to extreme heat events generally have an upper limit, suggesting extremes above this limit are virtually impossible (Thompson et al. (2025) identify where this is not appropriate), whereas GEV distributions fit to extreme rainfall events generally do not. In ScotClimATE, we do not assume that an extreme intensity suggested as virtually impossible based on a GEV fit to UKCP18 data is in fact impossible – instead we communicate that it has an expected return time exceeding 200 years.
Extracting information from simulations
Introduced in Section 5, UKCP18 contains 1200 years of simulated UK weather in a wide range of possible climates. By identifying Scotland mainland annual average temperature as a covariate, we are able to use the full 1200 years data to fit a suitable statistical models to distributions of extreme events that change with climate. Included in Appendix C is the relationship between the parameters of the GEV distribution and the covariate to build a five parameter statistical model (c, loc0, loc1, scale0, scale1). In ScotClimATE, non‐stationary GEV distributions are fit for every land cell in a 12km grid for extreme heat (Met Office Hadley Centre, 2018c), and a 5km grid for extreme rainfall (Met Office Hadley Centre, 2019).
The twelve UKCP18 ensemble members produce a wide range of simulated climates for Scotland across the 1980‐2080 projection period, both in comparisons between members and within individual simulations. Between members, even at the same simulation years, there are a large range of annual mean temperatures. UKCP18 projections possess a cold bias for Scotland, with many simulated years colder on average than any observed years in HadUK‐Grid. However, the ensemble of results follow the same non‐stationary distributions of extreme events with Scotland climate – the physics being the same, but with different starting conditions between runs (Lowe et al., 2018).
As shown in Appendix C, the large number of UKCP18 simulation years and wide range of simulated Scotland climates allows us to capture both the behaviour of very rare extremes (based on the shape and scale0 parameters) and the change in the location and scale of the distribution with changing climate (based on the loc1 and scale1 parameters). The observational record alone would not have been useful for understanding possible future extreme hazards due the very small range of observed Scotland climates.
Bias correction and smoothing
ScotClimATE is designed to visualise the statistics of extreme events in UK climate projections (UKCP18 Lowe et al., 2018). However, these projections contain biases. We apply a limited bias correction such that in ScotClimATE the intensity‐return period relationship of common extreme events in the present climate resemble observed common extreme events in the present climate. To this end, in each cell the distribution is shifted such that the location at the present climate is that of the fit to HadUK‐Grid observation based data (the loc0 parameter from the fit to HadUK‐Grid is used). Notably, we find that after this observation based bias correction, extreme heat events are around 2°C more intense in the Scottish central belt than if the statistical model had been built on UKCP18 data alone.
In this bias correction, we have attempted to preserve as much information on the variability of the highest‐intensity events between years, and the distribution of the rarest extreme events relative to more-frequent events, from UKCP18. Particularly for the rarest, highest‐intensity, events UKCP18 may offer insight into physically possible – but not necessarily observed yet – conditions that lead to hazardous weather. For the purpose of climate adaptation it is useful to exploit such hazard projections from UKCP18 (Grace et al., 2025).
As well as bias correction, we have applied a spatial smoothing to the statistical model fit to extreme rainfall projections in the CPM. The smoothing is based on a convolution with a 2D Gaussian kernel with σ = 10km. This is useful due to the small spatial scale of the most extreme rainfall events, and some unphysical processes that can occur during the CPM simulation (Kendon et al., 2019). In particular, it allows ScotClimATE to use information from nearby cells to inform projections where extreme rainfall events have been modelled or observed, and to fill individual cells where anomalous data exist and the statistical model could not be appropriately fit.
It is worth noting that Met Office Hadley Centre (2021) suggest quantile mapping as a useful method for bias correction of UKCP18 data. In ScotClimATE we have opted not to use this method, particularly as the rare events we aim to capture may only be expected a few times in a century. Therefore, we might only require quantile mapping of the most extreme one in 5000 days of data – for which we have a very small set of observations. Quantile mapping would become a very expensive method where we are only concerned with the statistics of unusual weather.
The development process
ScotClimATE was developed with funding and project supervision from CXC, and close communication with the Scottish Government Adaptation Team and with Scottish Government analysts with software expertise. Scientific supervision was provided by Prof. Simon Tett, the Chair of Earth System Dynamics at University of Edinburgh; with external quality assurance of the scientific methods reviewed at an early stage by Prof. Stuart Galloway of the University of Strathclyde. The project proposal to develop ScotClimATE extended the working team to include time for Dr David de Klerk, a research software engineer at the University of Edinburgh, to translate the scientific analysis underpinning ScotClimATEinto an interactive and user‐friendly online tool. This time was included within the original proposal budget specification.
ScotClimATEhas been produced through an agile development process. This process was proposed in order to maximise the utility of the tool for the users given the very short project time: three months to prototype delivery, one month of prototype testing, and three more months to final delivery. The agile process proposed:
- building a prototype version of ScotClimATEfor visualising extreme heat
- gathering data from user testing of the prototype tool (user feedback contained in PSCAN User Survey 2025) and taking input from an expert steering group to inform further development
- agreeing immediate actions with the Scottish Government Adaptation Team and CXC to meet key milestones and to complete development
Extreme heat was proposed for the prototype tool as a climate hazard with a clear potential for impact (Masselot et al., 2023) and a clear physical relationship for change with increasing annual mean temperatures. Three further hazards, sustained heat threshold for hot nights, extreme one‐day rainfall and extreme three‐day rainfall, were included based on insights from PSCAN user feedback and input from the Scottish Government Adaptation Team.
User interaction and testing
As discussed in Section 3, PSCAN are the intended users of ScotClimATE. Project development began in July 2025, with a sketch of the proposed user interface delivered to CXC and Scottish Government Adaptation Team in the first project meeting. In August 2025, project development and progress on initial development were introduced to the expert steering group and PSCAN.
Insights following these early interactions were included in the prototype tool. In particular: a disclaimer page was added to ScotClimATE to outline the intended user purpose and to avoid misuse of the tool in property planning; uncertainty communication was simplified into calibrated language (Section 6); and data download options were added to allow users to further conduct their own offline analysis of projection data.
The prototype tool was delivered to Scottish Government Adaptation Team at the end of September 2025. In mid‐October 2025 user testing was conducted during the PSCAN bi‐annual meeting. Users were given a presentation overview of ScotClimATE and practical tutorial on how to use the prototype tool. Users were then able to test the prototype tool hosted online. An optional survey with corresponding participant information sheet was available for users to give feedback after testing. The survey was open for one week following the PSCAN bi‐annual meeting to allow users additional time for testing. Before the PSCAN bi‐annual meeting, the process including the tutorial, survey, and participant information sheet underwent ethical assessment and achieved approval from The University of Edinburgh School of GeoSciences Ethics Committee.
Feedback from user testing
Fifteen PSCAN users returned surveys and consent for information from their feedback to be used in publications. Users were asked to rate the usefulness of the prototype tool, their ability to understand certain content in the tool, and the usability of the tool’s features. Then, users were given long answer boxes to provide insight into additional features and hazards that would be useful to include, as well as any additional feedback to help in the development of ScotClimATE.
In its current form, how useful is the tool for helping you to plan for
and assess changes in extreme heat at +2°C and +4°C respectively?
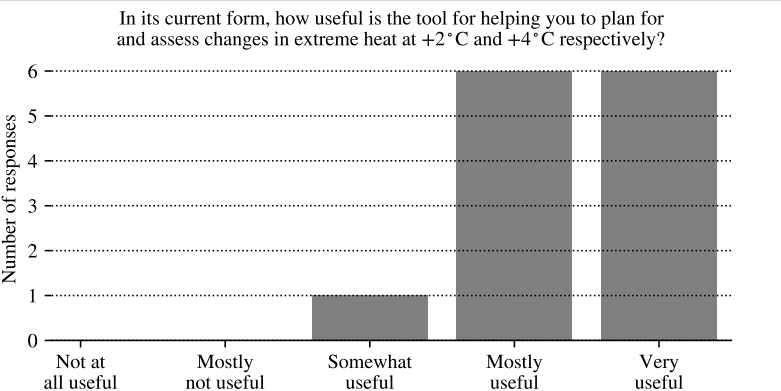
Figure 4: Bar chart showing perceived usefulness of the tool (PSCAN User Survey 2025). No respondents selected “not at all useful” or “mostly not useful.” One selected “somewhat useful,” while most rated it “mostly useful” or “very useful,” each with six responses.
PSCAN users provided extensive, helpful and insightful feedback that has been invaluable in the development of ScotClimATE. We understand that while the tool provides information on hazard, the users themselves are best placed to understand vulnerability and exposure to that hazard within their own service (Grace et al., 2025). We delivered a detailed synthesis of the user feedback to the Scottish Government Adaptation Team and to the steering group of experts.
Usefulness and use cases
Of 13 responses, 12 users found the prototype version of ScotClimATE either mostly or very useful in helping them to assess changes in extreme heat at +2°C and +4°C respectively (Figure 4). Users found it useful to both understand the return period of a given intensity of extreme heat and to project the intensity from a given return period.
Given the four different calculations available in the prototype tool, how might you use it?
“To determine how important it is for us to prepare for higher temperatures […]”
“[…] assess and rank current and future risks.”
“Go service‐by‐service in the local authority, identify critical temperatures & events with them and inform them how often those things are likely to occur. Compare return periods for risks across the country. Find other local authori‐ ties with similar climate risks.”
(relevant segments of responses from PSCAN User Survey 2025)
Users provided thoughtful insights for how an understanding of return period of particular extreme heats can help adaptation planning for their services. Users suggest that they can determine an importance for preparedness to different temperatures by quantifying the probability of experiencing defined heat thresholds each year (the reciprocal of the return period). Similarly, by building the projected hazard into a risk framework – such as with a damage function for their own service – users might build a ranking of present and future risks.
A strength of giving users access to visualisations of a whole Scotland analysis is that they are able to quickly see spatial distribution of how hazards present and develop. Even for users working within a particular Local Authority or NHS Board, they are able to identify other locations suitable for collaborative adaptation planning. This ability to identify where to share knowledge and insights may translate to a more collaborative approach to adaptation at the national scale. We provide a brief Scotland scale example of projecting return time from intensity in Section 10.1.
Given the four different calculations available in the prototype tool, how might you use it?
“Intensity: this can be used to consider potential impact of hot temperatures on specific areas, urban and rural and especially specific […] assets. […]”
“Would use this tool to assess which assets would be exposed to extreme events in different GWLs and return periods.”
“[…] To determine adaptation measures.”
(relevant segments of responses from PSCAN User Survey 2025)
Similarly, users can consider the frequency of risk that their service has to withstand. Users can use ScotClimATE to project the intensity of extreme events that is expected to be exceeded in particular return periods. By understanding particular temperature thresholds that the assets that they are responsible for are sensitive to, they can directly identify which assets are vulnerable in their climate scenario analysis.
Alternatively, for their own region, users can identify hazard thresholds they need to consider for different return periods that they are adapting to. This could accelerate users’ identification of adaptation measures they must take to prepare for increasing GWL. We provide a discussion of different hazard intensities at particular return periods and return times in Section 10.2.
Understanding and usability
Of 14 responses, 12 users agreed that they understood the purpose and caveats of the tool (Figure 5). However, one user identified that the disclaimer should inform users that the tool is for projecting meteorological hazards, not for providing information on other factors required to calculate risk such as vulnerability to hazards. Users expressed that further guidance on understanding vulnerability (beyond the scope of this project) would help them in adaptation planning for extreme hazards.
Fewer users agreed that they understood how uncertainty was communicated through the tool. Of 14 responses, only three users strongly agreed that they understood how uncertainty was communicated. Indeed, the tool itself provided very little information on how uncertainty was defined or communicated. One user communicated that they had a statistics background so found the presentation that contained a description of how confidence intervals were calculated easy follow. Communicating the processes of uncertainty calculation requires technical information that is likely unfamiliar to most of the tool’s users (we provide a description here in Appendix D).
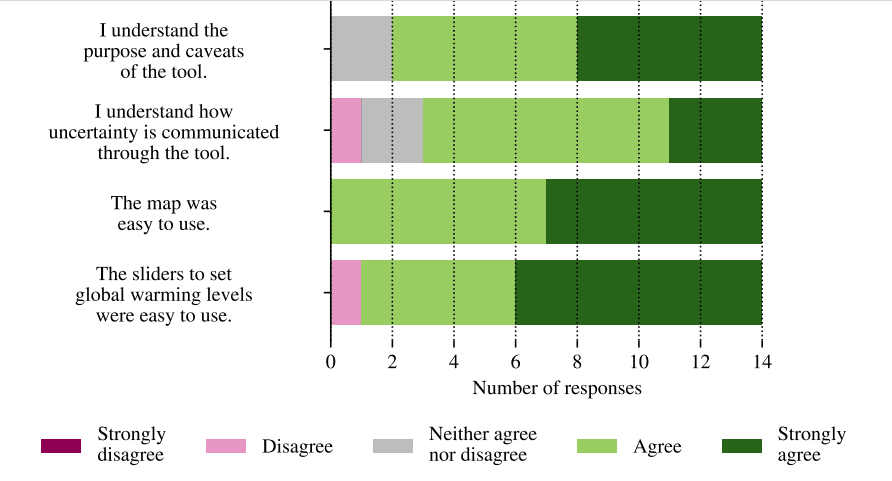
Figure 5: Horizontal stacked bar chart showing survey responses (0–14 respondents) to four statements about the tool. Most respondents agree or strongly agree that the tool is easy to use and that sliders are easy to use. More mixed responses are shown for understanding uncertainty and the tool’s purpose and caveats (PSCAN User Survey 2025).
In ScotClimATE, confidence intervals indicate the distribution of possible fits to results given that the tool is built only for visualising UKCP18 projections. In rigorous weather attribution studies it is important to undergo formal model validation and to use as many lines of evidence as possible (see Otto et al., 2024; Thompson et al., 2025). In designing ScotClimATE, we accept that UKCP18 currently provides the most applicable and well‐understood set of UK projections useful for adaptation purposes (Grace et al., 2025; Lowe et al., 2018). To these ends, narrow confidence intervals indicate where projections are well constrained within our methodology, whereas wide confidence intervals indicate poorly constrained projections. The projection from GWL to ScotClimATE is a major source of uncertainty in any projection (Section 8).
In all 14 responses, users agreed that the map was easy to use. Users suggested additional functionality for the map interface, including: postcode location search; the ability to add a ‘pin’ to a particular location to compile multiple hazards with similar functionality to the LACS “Generate Report” feature (Met Office, 2024a); and the ability to view other geographic information such as river basins and topography.
Similarly, there was high agreement that the slider to set GWL was easy to use. However, one user was not able to slide them. This could have been from computation limitations because the prototype version of the online tool had not been fully optimised for many users to access it, or because the user’s device or web browser did not allow that functionality. Users highlighted that while the description of GWL was useful, they wanted to understand how this relates to representative concentration pathways (RCPs) (described by van Vuuren et al., 2011). We have elaborated on the strength of analysing projected hazards based on ScotClimATE as a function of GWL in Sections 3, 7 and 8. Even between UKCP18 ensemble members there is a wide range of Scotland climates at the same years with the same RCP. Users can consult IPCC reporting on how GWL is projected to change with time in different Shared Socio‐economic Pathways (such as in IPCC, 2021, Figure SPM.8).
Many users provided helpful insights for how the language in the prototype tool needed to be revised to improve its usability. Users preferred clearer explanation for the parameters they were setting and less use of technical terminology.
Additional features
Following user testing, a second development cycle updated the prototype tool into the delivered version of ScotClimATE. Based on the user feedback, project team suggestions and Scottish Government Adaptation Team needs a prioritisation of the remaining work was agreed following the agile development process. Actions were prioritised and agreed.
The first priority was a language review with a focus on building clarity and user understanding. For example, based on user feedback, explanation for the return period of hazards was included in terms of the ‘1 in x year event’, and when projecting from the intensity of hazards the description of the slider and the information in the description boxes were designed to change to repeat the definition of the hazard. The interface in the control panel was also slightly re‐ordered to improve the usability based on user suggestions.
Next, three additional hazards for sustained heat and for rainfall were analysed and included in ScotClimATE (details of the selection process for these hazards are included in Section 9.4). Optimising the web tool, debugging and additional map functionality were also prioritised.
A number of user‐suggested features were rejected from inclusion. The ability for users to upload other datasets to analyse posed significant security concerns. Additionally, there would be significant software overheads in order to control and validate that users were uploading appropriate files and to build any system that would allow users to conduct their desired operations beyond the delivered scope of ScotClimATE. Similarly, we are unable to build the functionality to allow users to upload their own shapefile to define data downloads. Instead, ScotClimATE allows users to download netCDF4 data, which can be uploaded directly into certain geographic information system platforms such as ArcGIS (Esri, 2025).
Other functionality included deeper analysis of confidence intervals. This is likely not useful for the general user as confidence intervals in ScotClimATE are not based on a full assessment of multiple lines of evidence. However, the downloadable data from the tool includes a number of quantiles that can be used for a deeper analysis of the fitting uncertainty. For example, advanced users will be able to analyse the 95% confidence interval (such as in Section 10).
Some users suggested further scientific analysis that would assist adaptation planning in Scotland. Generally, these involved understanding compound hazards, such as drought followed by rainfall and interpreting results at higher resolution than the underlying data. Other suggestions included decoding the impact contribution from different factors, such as from urban heat islands. These suggestions provided useful insight into user needs but were beyond the scope of ScotClimATE so have not been included in the tool.
Additional hazards
Users suggested a wide variety of other hazards that could be included in the prototype tool. We have synthesised these into five categories: temperature hazards, rainfall hazards, lack of rainfall hazards, coastal hazards and other hazards. Within these categories, analyses of individual hazards were determined to be: doable within the current workflow; potentially possible with a different work flow; already provided by LACS; or not possible in this project/requiring new theory or data.
There was a methodological problem in the survey where users were asked to comment on ‘other climate hazards’ after testing a prototype for visualising extreme heat. This resulted in very few responses for more heat hazards. However, between the project team and the Scottish Government Adaptation Team, it was decided that 3‐day sustained heat threshold for hot nights was a useful hazard to include for its relation to health impacts, especially following Public Health Scotland (2025) publishing analysis of Scotland heat mortality data.
This hazard was analysed as block maxima in the same framework as extreme heat; sustained heat threshold can be defined as the annual maximum 3‐day minimum temperature. A related hazard in LACS is the annual count of nights warmer than 20°C . However, this threshold is generally inappropriate for understanding hot nights in Scotland where this threshold is generally not experienced even once per year. By analysing this hazard from an extreme value perspective, we are able to understand the most challenging rare events.
Users did not suggest hazards related to minimum temperatures. It is possible to conduct a similar analysis to extreme heat, but for a threshold of extreme lowest temperatures. LACS provides projections of annual minimum temperatures. Three users suggested it would be useful to visualise projections of heat at lower thresholds than are included in the tool, such as 25°C. This would be inappropriate to include as in many places these temperatures are expected multiple times per year already, so cannot be analysed as rare extreme events. As mentioned in Section 5, LACS already provides projections of the expected number of days exceeding 25, 30 and 35°C heat per year.
Ten users identified that 1‐day maximum precipitation should be included in ScotClimATE. As well as this, two users identified sustained precipitation. We agreed with the Scottish Government Adaptation Team that we would include 1‐day and 3‐day maximum precipitation. Both of these were suitable for extreme value analysis using the UKCP18 CPM data Met Office Hadley Centre (2019). Three users suggested changes in seasonal rainfall, which are already available in LACS and do not follow an extreme value distribution. Three users suggested including extreme flooding projections which are not provided in ScotClimATE. Users should instead use the SEPA Flood Maps tool and SEPA Climate Change Allowances Guidance to understand these.
Three users suggested lack of rainfall hazards. These could be understood in future analyses based on changes in standard precipitation indices for different lengths of drought. LACS currently provides summer and winter precipitation changes versus a 1981‐2000 baseline.
Three user responses related to changing sea level and extreme maximum storm surge height. Met Office Hadley Centre (2018a) provide guidance on how storm surge projections can be derived from UKCP18 data. Changes in storm surge height arise from changes in the mean sea level, which is projected to increase with time, and the distribution of storm surge anomalies around this mean level.
Other hazards related more directly to impacts, such as projected erosion rates, and changes to growing periods (counts of growing degree days per year are provided by LACS). Five users suggested the tool should include changes to maximum gust speeds. Making projections of future storminess remains a major challenge. In particular, this requires new understanding of changes in future North Atlantic storm counts and trajectories (Section 4).
How to use the tool
This section provides a brief tutorial for how to produce and interpret results in ScotClimATE. We provide examples of possible uses of the tool. Figures 6, 7, 8, 9 and 10 demonstrate a range of possible outputs from the tool. In each multi‐panel figure, the rows show projections at different GWLs, while the columns indicate the central estimate of the projection and the 95% confidence interval. The lower 2.5% quantile is the threshold below which lie the lower 1‐in‐40 results, while the upper 97.5% quantile is the threshold above which lie the upper 1‐in‐40 results. Each of these figures can be produced by downloading output data from the final version of ScotClimATE.
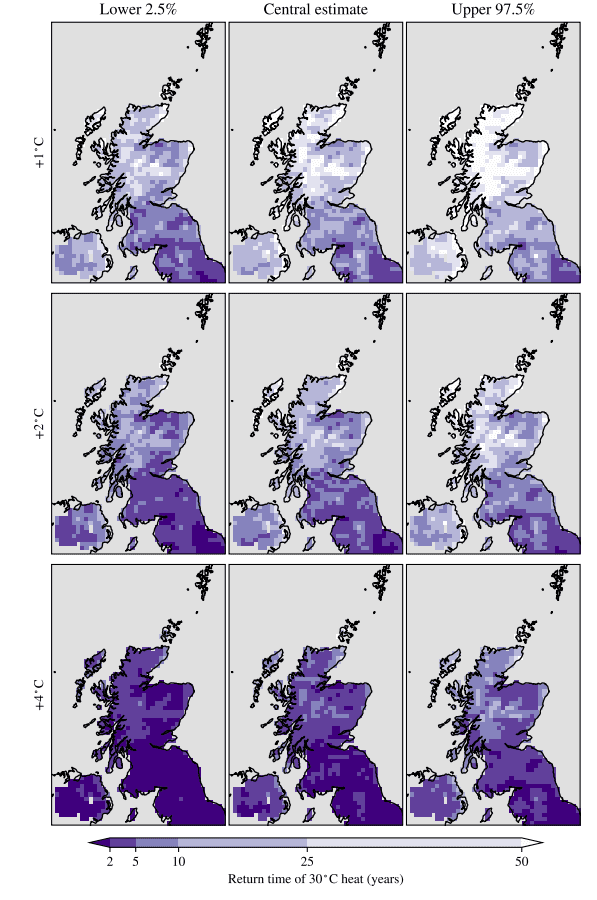
Figure 6: How often 30°C heat is expected to be exceeded at +1°C, +2°C and +4°C warming (rows). Columns show central estimates between a lower 2.5% and upper 97.5% confidence bounds of the results. Darker shading means shorter return times. The panels show that 30°C heat becomes much more frequent at GWL of +2 and again at +4°C warming than in the recent past.
![]()
![]()
![]()
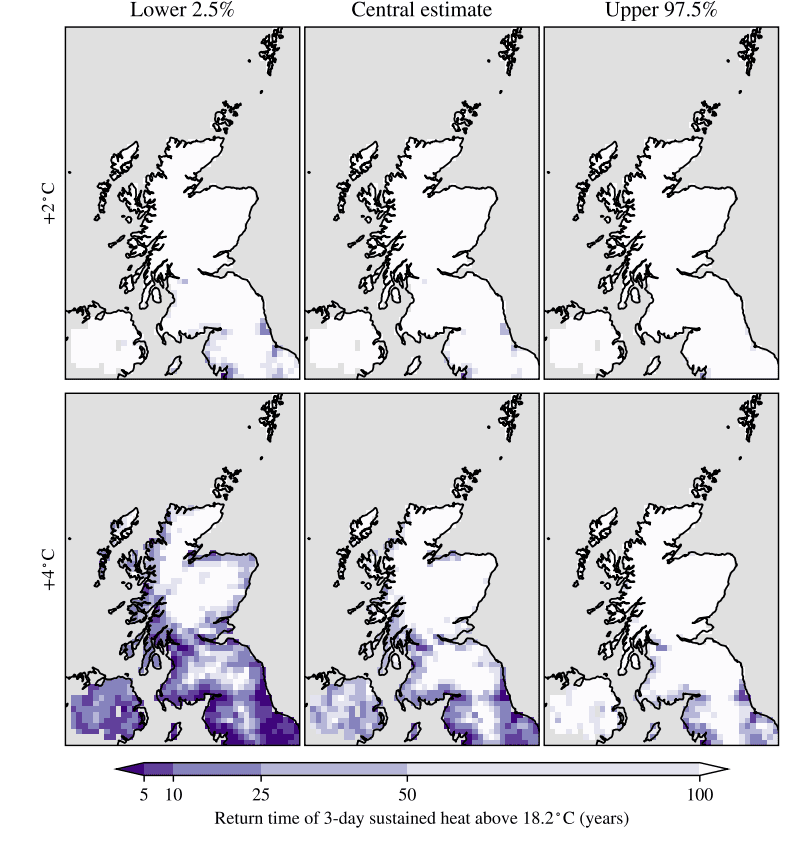
+2 C
+1 C
+4 C
Figure 7: The return time of sustained heat above a threshold of 18.2°C heat at GWL of +2 and +4°C in ScotClimATE (top row, bottom row). Columns show the central estimate, and lower and upper bounds of the 95% confidence interval (middle, left and right). This shows that 3-day sustained heat above 18.2°C is expected multiple times in 100 years in Southern and Western coastal regions at +4°C.
Figure 8: The hottest temperature threshold expected to be exceeded in 50 years at a GWL of +1°C in ScotClimATE. In the central belt, extreme heat between 31 and 35°C is expected. Columns show the central estimate, and lower and upper bounds of the 95% confidence interval (middle, left and right).
When we know a threshold that our service is sensitive to
When using ScotClimATE to help adaptation planning in the public sector, users can first consider the particular vulnerability of assets in their service to identify the thresholds of
hazards that those assets are sensitive to. Extreme events pose particular challenges for risks with non‐linear damage functions, or relative risks that increase rapidly beyond a particular weather intensity. An example of this would be the ‘J‐shaped’ heat mortality curves, where relative risk increases quickly for heat above a minimum mortality temperature (Gasparrini et al., 2022; Masselot et al., 2023; Public Health Scotland, 2025).
Supposing a user has identified a particular vulnerability at 30°C, they can produce a series of projections of the return period of that heat. This is shown in Figure 6. In the recent reference period, GWL of +1°C, this heat was expected for 1 in every 10 to 50 years in Central and North East Scotland, but much more frequently in the Tweed valley and along the Solway Firth where 30°C heat is expected in a comparable number of years as it is in northern England. This heat was expected in fewer than 1 in 50 years in the outlying islands of Shetland, Orkney and the Outer Hebrides.
At a GWL of +2°C, 30°C is expected every 2‐5 years around Glasgow. Projections like this are at the limit of the usefulness of ScotClimATE. Where a high temperature is expected this frequently it is more appropriate to use LACS to analyse the projected count of days at this temperature per year. At a GWL of +4○, many areas in central Scotland should expect to see at least one instance of 30°C heat most years. At this projection, 30°C heat is expected for more than 1 in every 25 years throughout mainland Highland.
Public Health Scotland (2025) has identified a significant impact on mortality of Scotland heat above a threshold of 18.2°C . Using ScotClimATE, we can interrogate where this heat threshold may be sustained over three days. At a GWL of +2°C this is unlikely anywhere, perhaps occurring only a handful of times in a century in Glasgow and in the Tyneside conurbation, England. However, this sustained heat is projected to be much more-frequent at a GWL of +4°C . Likely mediated by summer sea surface temperatures, this sustained heat becomes more likely around coastal regions at the higher GWL. In the central estimate, around Glasgow, this may occur during more than 1 in every 10 years.
When we have a defined frequency of a hazard that we need to be resilient to
ScotClimATE can be used for visualising the intensity of hazards expected with an identified frequency. The tool is most useful for understanding hazards that may occur a few times in a century. Figure 8 shows the hottest temperature expected to be exceeded only once in 50 years in the recent climate. These temperatures correspond with some of the hottest recorded temperatures in Scotland, such as during the July 2022 heatwave where heat exceeding 35°C was observed in the Scottish Borders (STV News, 2022; Met Office, 2026).
When we want to understand changes in hazards
The tool also allows users to visualise changes in extreme events. This is particularly useful when users want to understand the additional stress on a service from an extreme event due to global warming. This is shown for the 1‐in‐50 year threshold in Figure 9. At a GWL of +2°C this is 0 to 3°C higher than at +1°C. This projection suggests additional heat stress during rare extremes.
Then, at GWL of +4°C, the projected increase in this unusually high heat is 3 to 6○ across most of Scotland, with greater increases in eastern regions than in western regions. This is a substantial increase in hazardous temperature. This highlights an important message for climate adaptation in Scotland. While Scotland average temperature is expected to increase slower than the global average temperature (Section 7), the infrequent hottest days increase in temperature faster than the global average temperature.
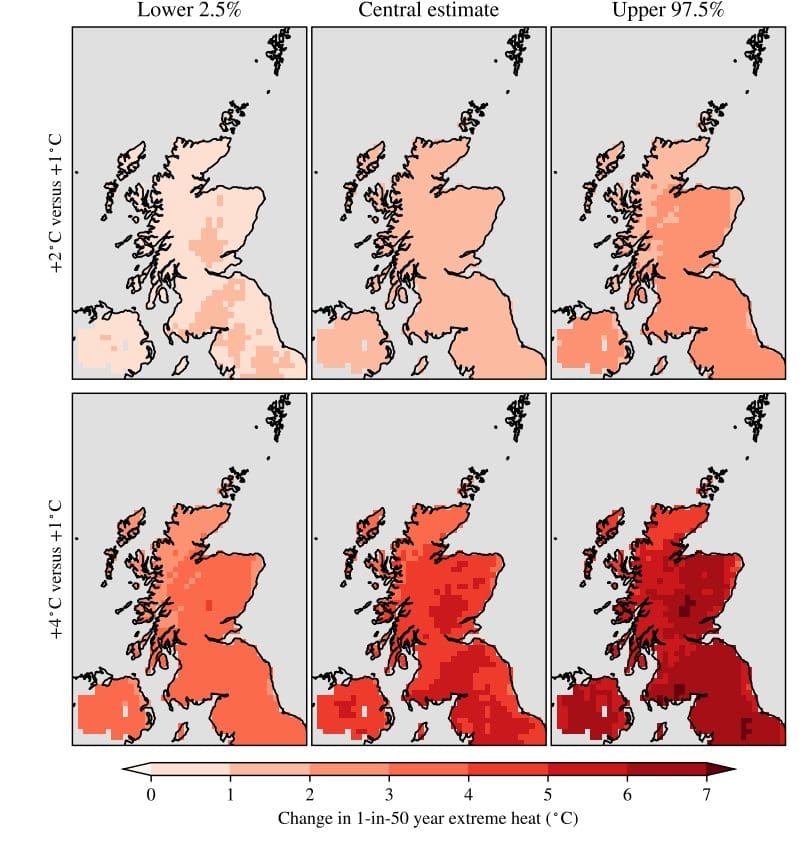
Figure 9: The change between different GWLs in the threshold of the hottest temperature expected to be exceeded in the 50-year return time in ScotClimATE. The top row shows the change at +2°C from +1°C and the bottom row shows the change at +4°C from +1°C. Columns show central estimates between a lower 2.5% and upper 97.5% confidence bounds of the results. ![]()
![]()
Figure 10 shows projected changes in the 1 in 100 year 3‐day sustained rainfall at GWLs of +2°C and +4°C versus the recent climate. Mostly, these increases are projected at around 3 to 5% per ○C change in GWL. In Aberdeenshire, some fits even project a decrease in extreme precipitation. However, the greatest increases in extreme sustained precipitation generally correspond with the wettest areas across western and elevated areas.
![]()
![]()
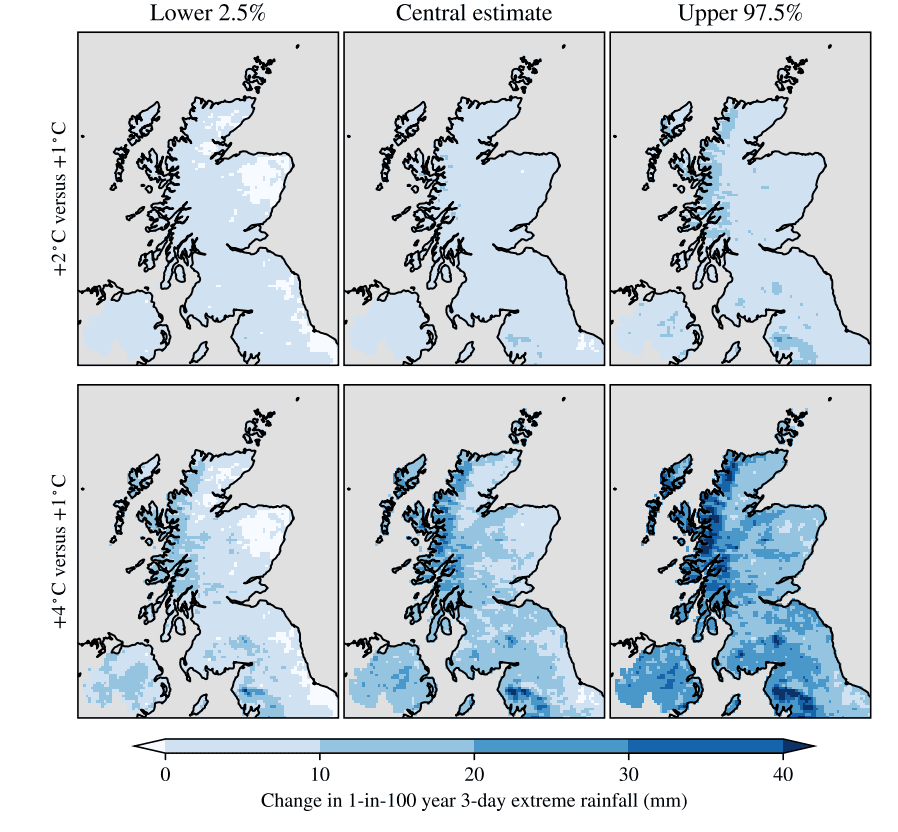
Figure 10: The change between different GWLs in the threshold of the most rainfall accumulated over three days in a 100 year return time in ScotClimATE. The top row shows the change at +2°C from +1°C and the bottom row shows the change at +4°C from +1°. Columns show the central estimate, and lower and upper bounds of the 95% confidence interval (middle, left and right). Note, the Shetland Islands lie too close to the edge of the UKCP18 CPM domain (Kendon et al., 2019).
Conclusions
Extreme weather events are challenging to adapt to. Our analysis shows that in Scotland, extreme heat and rainfall will become more hazardous in a warming world. For exposed people, services and assets, risks from these hazards will increase unless adaptation measures are taken to reduce their vulnerability.
ScotClimATE adds to a growing set of online tools that public bodies can use to inform climate scenario analysis for adaptation planning. They can use SEPA Flood Maps to visualise flooding projections, the Local Authority Climate Service to visualise chronic and frequent hazards, and ScotClimATE to visualise unusual extreme events. In building ScotClimATE, the team have provided insights into how Scotland’s average temperature will warm with different global warming levels, and how the hottest and wettest days are likely to change aligned with GWLs.
In October 2025, users responded that the prototype version of ScotClimATE was useful for assessing changes in extreme heat. They generally agreed that its features were understandable and easy to use. Since then, we have drawn on their user feedback, input from the Scottish Government Adaptation Group and from a steering group of experts to improve the usability of the final tool and include projections of additional hazards useful in adaptation planning.
Suggested future development of ScotClimATE
A review at 12 to 24 months after launch could help users gain the most value from the tool. The review should gather feedback on how users engage with the tool, what has worked well, and where they have faced challenges. By learning from both successes and difficulties, the Scottish Government could better understand public sector needs for climate adaptation guidance and identify practical improvements to ScotClimATE.
The project behind ScotClimATE has translated insights from scientific research into a tool that public bodies can use to understand extreme weather events. Section 9 explains how the tool helps users identify climate hazards that are shared across different areas of Scotland. This can encourage collaboration and knowledge sharing between organisations about how to manage climate hazards and risk.
ScotClimATE could be developed into an educational resource beyond the framework of climate scenario analysis. The interface and visualisations are designed to be accessible by non‐specialists, and the projections it provides are of wider public interest than the identified PSCAN user base.
An objective of SNAP3 is that Scotland should be ‘a global hub for adaptation research,’ (Scottish Government, 2024). To this end, the Scottish Government identifies the need for international collaboration and knowledge exchange for the success of its education and research institutions. The methodology behind the scientific analysis of ScotClimATE is ready to be applied to other UK and to international case studies. Similar tools for other UK regions can use the same datasets, but regional climate would need to be suitably defined for each region.
The knowledge gained from developing and testing the online tool with users provides a framework for communicating climate science in a user-centred way. By sharing knowledge of projected climate hazards and adaptation measures internationally, researchers and public bodies could further progress adaptation efforts and deepen understanding of the shared challenge posed by climate change.
Outstanding questions
As we have highlighted in this report, the analysis in ScotClimATE is built only on a small number of underlying datasets. A more robust analysis of extreme events in Scotland should be built on many lines of evidence, as is done in robust attribution studies such as Otto et al., 2024; Philip et al., 2020; and Thompson et al., 2025. ScotClimATE was developed to meet an immediate practical need with a short delivery timescale. As a result, the depth of analysis possible was limited.
This means that ScotClimATE does not account for some aspects of hazards that have been identified in other studies. For instance, a potential collapse of South to North heat transport in the North Atlantic Ocean with increasing global temperatures. This is considered a low‐probability but high‐impact risk for Scotland (CCC, 2021, IPCC, 2023). Less ocean heat transport to UK waters could lead to a cooling climate in Scotland (Jackson et al., 2015). However, based on the range of possible fits to UKCP18 projections, this is virtually impossible in ScotClimATE, where Scotland average temperature is assumed to warm at a rate of 0.83 ± 0.10°C per °C increase in GWL.
New research is needed to quantify and project the possible – albeit low‐probability – hazard of cooling in Scotland. It may also be possible to make better use of existing scientific practice and expertise in Scotland. For example, a communication tool that visualises ongoing monitoring of the circulation in the North Atlantic (for example, Fox et al., 2025) may provide insight into the development of this hazard.
The analysis behind ScotClimATE provides insight into the statistics of extreme weather in Scotland. Further research and improvements to the statistical method could narrow the range of projections the tool offers. However, variation in how much Scotland’s temperatures may warm is likely to remain a major source of uncertainty.
The online tool is designed for a very specific purpose, but the framework that has been developed for visualising results is generic enough to incorporate other hazards and datasets using the same approach. We do not recommend repeating the analysis of the hazards provided in ScotClimATE during the lifetime of UKCP18 as it would not be useful – even as more observation data become available. Instead, the tool could be expanded to include other hazards as appropriate data is released. This could include projections of extreme storminess when high resolution projections of storm tracks become available, such as from the ongoing CANARI project.
References
Adaptation Scotland (2025). Public sector. Adaptation Scotland page on public sector participation. URL: https ∶ //adaptation.scot/our − work/public − sector − climate − adaptation − network/.
Arias, P. A. et al. (2021). Technical Summary. Tech. rep. Cambridge, United Kingdom and New York, NY, USA: IPCC, pp. 33–144. DOI: 10.1017/9781009157896.002.
Arnell, N. W. et al. (2025). “High‐Impact Low Likelihood Climate Scenarios for Risk Assessment in the UK”. In: Earth’s Future 13.12. e2025EF006946 2025EF006946, e2025EF006946. DOI: https ∶ //doi.org/10.1029/2025EF006946. eprint: https ∶ //agupubs.onlinelibrary.wiley.com/doi/pdf/10.1029/2025EF006946. URL: https ∶ //agupubs.onlinelibrary.wiley.com/doi/abs/10.1029/2025EF006946.
Auld, G., G. C. Hegerl, and I. Papastathopoulos (2023). “Changes in the distribution of annual maximum temperatures in Europe”. In: Advances in Statistical Climatology, Meteorology and Oceanography 9.1, pp. 45–66. DOI: 10.5194/ascmo − 9 − 45 − 2023. URL: https ∶ //ascmo.copernicus.org/articles/9/45/2023/.
Brown, B. (Oct. 14, 2025). CCC letter to Minister Hardy – advice on the UK’s adaptation objectives. Letter. Letter from the Chair of the Adaptation Committee to the Parliamentary Under Secretary of State. URL: https ∶ //www.theccc.org.uk/publication/letter − ccc −letter − to − minister − hardy − advice − on − the − uks − adaptation − objectives/.
Brown, S. J. (2020). “Future changes in heatwave severity, duration and frequency due to climate change for the most populous cities”. In: Weather and Climate Extremes 30, p. 100278. ISSN: 22120947. DOI: https ∶ //doi.org/10.1016/j.wace.2020.100278. URL: https ∶ //www.sciencedirect.com/science/article/pii/S2212094720300608.
CANARI (Climate Analysis, Attribution and Impacts) (2025). Climate modelling. CANARI project modelling approach. URL: https ∶ //canari.ncasdata.org/overview/climate − modelling/ (visited on 01/05/2026).
Catto, J. et al. (2024). “Improved Understanding and Characterisation of Climate Hazards in the UK”. In: Quantifying Climate Risk and Building Resilience in the UK. Ed. by S. Dessai et al. Cham: Springer International Publishing, pp. 131–144. ISBN: 978‐3‐031‐39729‐5. DOI: 10.1007/978 − 3 − 031 − 39729 − 5_9. URL: https ∶ //doi.org/10.1007/978 − 3 − 031 − 39729 − 5_9.
CCC (2021). Independent Assessment of UK Climate Risk. Tech. rep. The Third UK Climate Change Risk Assessment. Climate Change Committee. URL: https ∶ //www.theccc.org.uk/publication/independent−assessment−of−uk−climate−risk/ (visited on 11/26/2025).
Chan, S. C. et al. (2023). “New extreme rainfall projections for improved climate resilience of urban drainage systems”. In: Climate Services 30, p. 100375. ISSN: 2405‐8807. DOI: https ∶ //doi.org/10.1016/j.cliser.2023.100375. URL: https ∶ //www.sciencedirect.com/science/article/pii/S2405880723000365.
Climate Change (Scotland) Act 2009 (2009). English. URL: https ∶ //www.legislation.gov.uk/asp/2009/12/part/4.
Coles, S. (2001a). “Classical Extreme Value Theory and Models”. In: An Introduction to Statistical Modeling of Extreme Values. London: Springer London, pp. 45–73. ISBN: 978‐1‐4471‐3675‐0. DOI: 10.1007/978 − 1 − 4471 − 3675 − 0_3. URL: https ∶ //doi.org/10.1007/978 − 1 − 4471 − 3675 − 0_3.
— (2001b). “Extremes of Non‐stationary Sequences”. In: An Introduction to Statistical Modeling of Extreme Values. London: Springer London, pp. 105–123. ISBN: 978‐1‐4471‐3675‐0. DOI: 10.1007/978 − 1 − 4471 − 3675 − 0_6. URL: https ∶ //doi.org/10.1007/978 − 1 − 4471 − 3675 − 0_6.
Easterling, D. R. et al. (2016). “Detection and attribution of climate extremes in the observed record”. In: Weather and Climate Extremes 11. Observed and Projected (Longer‐term)
Changes in Weather and Climate Extremes, pp. 17–27. ISSN: 2212‐0947. DOI: https ∶ //doi.org/10.1016/j.wace.2016.01.001. URL: https ∶ //www.sciencedirect.com/science/article/pii/S2212094716300020.
Esri (July 2025). How To: Work with NetCDF Files in ArcGIS Pro. Esri Support Knowledge Base Article. URL: https ∶ //support.esri.com/en − us/knowledge − base/working − with − netcdfs − in − arcgis − pro − basics − 000037232 (visited on 10/29/2025).
Field, C. et al. (2012). Managing the Risks of Extreme Events and Disasters to Advance Climate Change Adaptation. A Special Report of Working Groups I and II of the Intergovernmental Panel on Climate Change. Cambridge, UK and New York, NY, USA: Intergovernmental Panel on Climate Change, p. 582. URL: https ∶ //www.ipcc.ch/site/assets/uploads/2018/03/SREX_Full_Report − 1.pdf.
Fowler, H. J. et al. (Mar. 2021). “Towards advancing scientific knowledge of climate change impacts on short‐duration rainfall extremes”. In: Philosophical Transactions of the Royal Society A: Mathematical, Physical and Engineering Sciences 379.2195, p. 20190542. ISSN: 1364‐503X. DOI: 10.1098/rsta.2019.0542. eprint: https ∶ //royalsocietypublishing.org/rsta/article − pdf/doi/10.1098/rsta.2019.0542/1441415/rsta.2019.0542.pdf. URL: https ∶ //doi.org/10.1098/rsta.2019.0542.
Fox, A. D., N. J. Fraser, and S. A. Cunningham (2025). “Seasonality of meridional overturning in the subpolar North Atlantic: density flux as a metric for understanding the Atlantic meridional overturning circulation”. In: Ocean Science 21.4, pp. 1735–1760. DOI: 10.5194/os − 21 − 1735 − 2025. URL: https ∶ //os.copernicus.org/articles/21/1735/2025/.
Gasparrini, A. et al. (July 2022). “Small‐area assessment of temperature‐related mortality risks in England and Wales: a case time series analysis”. In: The Lancet Planetary Health 6.7, e557–e564. ISSN: 2542‐5196. DOI: 10.1016/S2542 − 5196(22)00138 − 3. URL: https ∶ //doi.org/10.1016/S2542 − 5196(22)00138 − 3.
Grace, E. et al. (2025). Using future climate scenarios to support today’s decision making. en.
DOI: 10.7488/ERA/5567. URL: https ∶ //era.ed.ac.uk/handle/1842/43019.
Gründemann, G. J. et al. (2023). “Extreme precipitation return levels for multiple durations on a global scale”. In: Journal of Hydrology 621, p. 129558. DOI: 10.1016/j.jhydrol.2023.129558. URL: https ∶ //doi.org/10.1016/j.jhydrol.2023.129558.
Harrower, M. and C. A. Brewer (2003). “ColorBrewer.org: An Online Tool for Selecting Colour Schemes for Maps”. In: The Cartographic Journal 40.1. Tool available at colorbrewer2.org, pp. 27–37. DOI: 10.1179/000870403235002042. eprint: https ∶//www.tandfonline.com/doi/pdf/10.1179/000870403235002042. URL: https ∶ //www.tandfonline.com/doi/abs/10.1179/000870403235002042.
Hollis, D. et al. (2018). HadUK‐Grid gridded and regional average climate observations for the UK. URL: https ∶ //catalogue.ceda.ac.uk/uuid/4dc8450d889a491ebb20e724debe2dfb/.
IPCC (2005). Uncertainty Guidance Note for the Fourth Assessment Report of the Intergovernmental Panel on Climate Change. Accessed:28/11/2025. Intergovernmental Panel on Climate Change. URL: https ∶ //www.ipcc.ch/site/assets/uploads/2018/02/ar4 − uncertaintyguidancenote − 1.pdf.
– (2021). Summary for Policymakers. In: Climate Change 2021: The Physical Science Basis. Contribution of Working Group I to the Sixth Assessment Report of the Intergovernmental Panel on Climate Change. Report. In this citation, the specific figure is SPM.8. Cambridge, United Kingdom and New York, NY, USA: Cambridge University Press, pp. 3–32. DOI: 10.1017/9781009157896.001.
– (2023). Climate Change 2023: Synthesis Report. Contribution of Working Groups I, II and III to the Sixth Assessment Report of the Intergovernmental Panel on Climate Change. Report. Geneva, Switzerland: Intergovernmental Panel on Climate Change, pp. 35–115. DOI: 10.59327/IPCC/AR6 − 9789291691647. URL: https ∶ //www.ipcc.ch/report/ar6/syr/downloads/report/IPCC_AR6_SYR_FullVolume.pdf (visited on 05/20/2024).
Jackson, L. C. et al. (Dec. 2015). “Global and European climate impacts of a slowdown of the AMOC in a high resolution GCM”. In: Climate Dynamics 45.11. Received: 11 November 2014; Accepted: 23 February 2015; Published online: 11 March 2015., pp. 3299–3316. ISSN: 1432‐0894. DOI: 10.1007/s00382 − 015 − 2540 − 2. URL: https ∶ //doi.org/10.1007/s00382 − 015 − 2540 − 2.
Jones, P. D. and D. Lister (2004). “The development of monthly temperature series for Scotland and Northern Ireland”. In: International Journal of Climatology 24.5, pp. 569–590. DOI: https ∶ //doi.org/10.1002/joc.1017. eprint: https ∶ //rmets.onlinelibrary.wiley.com/doi/pdf/10.1002/joc.1017. URL: https ∶ //rmets.onlinelibrary.wiley.com/doi/abs/10.1002/joc.1017.
Kendon, E. et al. (Sept. 2019). UKCP Convection‐permitting model projections: Science report. Internal reviewers: Mike Bush, Richard Jones, Cath Senior; External reviewers: Brian
Hoskins, Erik Kjellström, Christoph Schär, Bart Van den Hurk. Exeter, UK: Met Office. URL: https ∶ //www.metoffice.gov.uk/pub/data/weather/uk/ukcp18/science − reports/UKCP − Convection − permitting − model − projections.pdf.
Kendon, M. et al. (2025). “State of the UK Climate in 2024”. In: International Journal of Climatology 45.S1, e70010. DOI: https ∶ //doi.org/10.1002/joc.70010. eprint: https ∶ //rmets.onlinelibrary.wiley.com/doi/pdf/10.1002/joc.70010. URL: https ∶ //rmets.onlinelibrary.wiley.com/doi/abs/10.1002/joc.70010.
Lee, R. et al. (2024). “Reclassifying historical disasters: From single to multi‐hazards”. In: Science of The Total Environment 912, p. 169120. ISSN: 0048‐9697. DOI: https ∶ //doi.org/10.1016/j.scitotenv.2023.169120. URL: https ∶ //www.sciencedirect.com/science/article/pii/S0048969723077501.
Lowe, J. A. et al. (Nov. 2018). UKCP18 Science Overview Report. Report. Updated March 2019. Exeter, UK: Met Office. URL: https ∶//www.metoffice.gov.uk/pub/data/weather/uk/ukcp18/science − reports/UKCP18 – Overview − report.pdf.
Masselot, P. et al. (Apr. 2023). “Excess mortality attributed to heat and cold: a health impact assessment study in 854 cities in Europe”. In: The Lancet Planetary Health 7.4, e271–e281. ISSN: 2542‐5196. DOI: 10.1016/S2542 − 5196(23)00023 − 2. URL: https ∶ //doi.org/10.1016/S2542 − 5196(23)00023 − 2.
Met Office (2003). Met Office Rain Radar Data from the NIMROD System. Dataset. URL: https ∶ //catalogue.ceda.ac.uk/uuid/82adec1f896af6169112d09cc1174499/.
- (2007). Weather Radar. Fact Sheet 15. Met Office. URL: https ∶ //artefacts.ceda.ac.uk/badc_datadocs/nimrod/factsheet15.pdf.
- (2019). UK Climate Regions Map. This map shows the standard areas (general regions) used by the Met Office when generating climatologies. URL: https ∶ //www.metoffice.gov.uk/research/climate/maps−and−data/about/regions−map (visited on 12/01/2025).
- (2024a). Local Authority Climate Service. The Met Office’s climate service for Local Authorities in the UK. URL: https ∶ //climatedataportal.metoffice.gov.uk/pages/lacs (visited on 12/26/2025).
- (2024b). Met Office launches new Local Authority Climate Service. Press release. Author: Press Office. Met Office. URL: https ∶ //www.metoffice.gov.uk/about− us/news − and − media/media −centre/weather− and−climate−news/2024/met−office−launches−new−local−authority−climate−service (visited on 10/09/2024).
Met Office (2026). UK Climate Extremes. Accessed: 2024‐02‐05. Met Office. URL: https ∶ //www.metoffice.gov.uk/research/climate/maps − and − data/uk − climate − extremes (visited on 02/05/2026).
Met Office Hadley Centre (2018a). UKCP18 Factsheet: Sea level rise and storm surge. Factsheet. Part of the UK Climate Projections 2018 suite of materials. Met Office Hadley Centre. URL: https ∶ //www.metoffice.gov.uk/binaries/content/assets/metofficegovuk/pdf/research/ukcp/ukcp18−fact − sheet − sea − level − rise − and − storm − surge.pdf (visited on 06/01/2025).
- (2018b). UKCP18 Global Projections at 60km Resolution for 1900‐2100. URL: https ∶ //catalogue.ceda.ac.uk/uuid/97bc0c622a24489aa105f5b8a8efa3f0/.
- (2018c). UKCP18 Regional Projections on a 12km grid over the UK for 1980‐2080. URL: https ∶ //catalogue.ceda.ac.uk/uuid/589211abeb844070a95d061c8cc7f604/.
- (2019). UKCP Local Projections on a 5km grid over the UK for 1980‐2080. URL: https ∶ //catalogue.ceda.ac.uk/uuid/e304987739e04cdc960598fa5e4439d0/.
- (Mar. 2021). UKCP18 Guidance: How to Bias Correct. Technical Guidance v2.1. Exeter, United Kingdom: Met Office. URL: https ∶//www.metoffice.gov.uk/binaries/content/assets/metofficegovuk/pdf/research/ukcp/ukcp18− guidance − − − how − to − bias − correct.pdf (visited on 10/20/2025).
Morice, C. P. et al. (2021). “An Updated Assessment of Near‐Surface Temperature Change From 1850: The HadCRUT5 Data Set”. In: Journal of Geophysical Research: Atmospheres 126.3. e2019JD032361 2019JD032361, e2019JD032361. DOI: https ∶ //doi.org/10.1029/2019JD032361. eprint: https ∶ //agupubs.onlinelibrary.wiley.com/doi/pdf/10.1029/2019JD032361. URL: https ∶ //agupubs.onlinelibrary.wiley.com/doi/abs/10.1029/2019JD032361.
Naszarkowski, N. A. L. et al. (2024). “Factors affecting severity of wildfires in Scottish heathlands and blanket bogs”. In: Science of the Total Environment 931, p. 172746. DOI: 10.1016/j.scitotenv.2024.172746.
O’Neill, S., S. F. Tett, and K. Donovan (2022). “Extreme rainfall risk and climate change impact assessment for Edinburgh World Heritage sites”. In: Weather and Climate Extremes 38, p. 100514. ISSN: 2212‐0947. DOI: https ∶ //doi.org/10.1016/j.wace.2022.100514. URL: https ∶ //www.sciencedirect.com/science/article/pii/S2212094722000937.
Ordnance Survey (2025a). A Guide to Coordinate Systems in Great Britain. Ordnance Survey documentation on National Grid and OSGB36 Terrestrial Reference Frame. Ordnance Survey. URL: https ∶ //docs.os.uk/more−than−maps/deep−dive/a−guide−to−coordinate−systems−in−great− britain/ordnance − survey − coordinate − systems/national − grid − and − the − osgb36 − trf (visited on 11/28/2025).
- (Nov. 2025b). OS Maps API Documentation: Layers and Styles. Technical documentation for the Ordnance Survey Maps API. Ordnance Survey. URL: https ∶ //docs.os.uk/os − apis/accessing − os − apis/os − maps − api/layers − and − styles (visited on 12/01/2025).
Otto, F. E. L. et al. (2024). “Formally combining different lines of evidence in extreme‐event attribution”. In: Advances in Statistical Climatology, Meteorology and Oceanography 10.2, pp. 159–171. DOI: 10.5194/ascmo − 10 − 159 − 2024. URL: https ∶ //ascmo.copernicus.org/articles/10/159/2024/.
Otto, F. E. (2017). “Attribution of Weather and Climate Events”. In: Annual Review of Environment and Resources 42.Volume 42, 2017, pp. 627–646. ISSN: 1545‐2050. DOI: https ∶ //doi.org/10.1146/annurev − environ − 102016 − 060847. URL: https ∶ //www.annualreviews.org/content/journals/10.1146/annurev − environ − 102016 − 060847.
Philip, S. et al. (2020). “A protocol for probabilistic extreme event attribution analyses”. In: Advances in Statistical Climatology, Meteorology and Oceanography 6.2, pp. 177–203. DOI: 10.5194/ascmo − 6 − 177 − 2020. URL: https ∶ //ascmo.copernicus.org/articles/6/177/2020/.
PSCAN User Survey (Oct. 2025). Feedback on the prototype tool. Survey conducted 15‐21 October, 2025.
Public Health Scotland (2025). Heat impacts on health in Scotland: Deaths 2005‐2024. URL: https ∶ //publichealthscotland.scot/publications/heat − impacts − on − health − in − scotland/heat − impacts − on − health − in − scotland − 28 − october − 2025/.
Rennie, A. F. et al. (2021). Dynamic Coast: The National Overview. Report. Centre of Expertise for Waters (CREW). URL: https ∶ //www.crew.ac.uk/sites/www.crew.ac.uk/files/publication/CREW_DC2_SYNOPSIS_FINAL%2Blink_0.pdf SciPy Community (2011). scipy.stats.genextreme. SciPy v1.11.3 Documentation. URL: https ∶ //docs.scipy.org/doc/scipy/reference/generated/scipy.stats.genextreme.html (visited on 12/01/2025).
Scottish Environment Protection Agency (Feb. 25, 2025a). Climate Change Allowances for Flood Risk Assessment in Land Use Planning. Version 6. Issued date: 25 February 2025. This guidance sets out required allowances for climate change that must be used for flood risk assessment following the adoption of National Planning Framework 4. Scottish
Environment Protection Agency (SEPA). URL: https ∶ //www.sepa.org.uk/media/jjwpxuso/climate − change − allowances − guidance_v6.pdf.
- (2025b). SEPA Flood Maps. A tool for flood risk management planning to identify actions, to manage flood risk and develop plans to tackle flooding. SEPA. URL: https ∶ //beta.sepa.scot/flooding/flood − maps/.
Scottish Government (2024). Scottish National Adaptation Plan (2024‐2029). Government Report. URL: https ∶ //www.gov.scot/publications/scottish − national − adaptation − plan − 2024 − 2029 − 2/documents/.
Scottish Government (2025). Climate Change Adaptation. Scottish Government page on Adaptation to climate change. URL: https ∶//www.gov.scot/policies/climate − change/climate − change − adaptation/.
Shepherd, T. G. (Mar. 2016). “A Common Framework for Approaches to Extreme Event Attribution”. In: Current Climate Change Reports 2 (1), pp. 28–38. ISSN: 2198‐6061. DOI: 10.1007/s40641 − 016 − 0033 − y. URL: https ∶ //doi.org/10.1007/s40641 − 016 − 0033 − y.
Simmonds, R. et al. (2022). A review of interacting natural hazards and cascading impacts in Scotland. Research Report. Available at: https ∶ //eprints.gla.ac.uk/267515/. Publisher: National Centre for Resilience. National Centre for Resilience. URL: https ∶ //eprints.gla.ac.uk/267515/.
STV News (July 2022). Hottest day in Scotland officially recorded as temperatures reach 35.1C at Floors Castle. Online news article, author Calum Loudon. URL: https ∶ //news.stv.tv/scotland/hottest − day − in − scotland − officially − recorded − as − temperatures − reach − 35 − 1c − at − floors − castle (visited on 01/05/2026).
Tett, S. F. B., C. Long, and S. J. Brown (2025). “Attribution of extreme precipitation related to a fatal derailment near Carmont, Scotland”. In: Environmental Research: Climate. Extreme Weather and Climate Event Attribution 4.3. Open Access, p. 035010. DOI: 10.1088/2752 − 5295/adeeb7. URL: https ∶ //dx.doi.org/10.1088/2752 − 5295/adeeb7.
Tett, S. F. B. et al. (2023). “The Impact of an Extreme Cloud burst on Edinburgh Castle”. In: Bulletin of the American Meteorological Society 104.10, E1807 –E1816. DOI: 10.1175/BAMS − D − 22 − 0196.1. URL: https ∶ //journals.ametsoc.org/view/journals/bams/104/10/BAMS − D − 22 − 0196.1.xml.
Thompson, V., S. Ermis, and M. Athanase (2025). “The need for multi‐method extreme event attribution”. In: Weather n/a.n/a. Early release at time of access. DOI: https ∶ //doi.org/10.1002/wea.7779. eprint: https ∶ //rmets.onlinelibrary.wiley.com/doi/pdf/10.1002/wea.7779. URL: https ∶ //rmets.onlinelibrary.wiley.com/doi/abs/10.1002/wea.7779.
UK Centre for Ecology and Hydrology (2025). HYRAD: HYdrological Radar data processing toolkit. (Visited on 12/01/2025).
Undorf, S et al. (2020). “Learning from the 2018 heatwave in the context of climate change: are high temperature extremes important for adaptation in Scotland?” In: Environmental Research Letters 15.3. Open Access, p. 034051. DOI: 10.1088/1748 − 9326/ab6999. URL: https ∶ //dx.doi.org/10.1088/1748 − 9326/ab6999.
van Vuuren, D. P. et al. (2011). “The representative concentration pathways: an overview”. In: Climatic Change 109.1, p. 5. ISSN: 1573‐1480. DOI: 10.1007/s10584 − 011 − 0148 − z. URL: https ∶ //doi.org/10.1007/s10584 − 011 − 0148 − z.
Verture (2025). Adaptation Scotland. Verture page on Adaptation Scotland Programme. URL: https ∶ //verture.org.uk/project/adaptation − scotland/.
WWA (2025). World Weather Attribution. World Weather Attribution homepage. URL: https ∶ //www.worldweatherattribution.org/10 − years − of − rapidly − disentangling − drivers − of − extreme − weather − disasters/.
Appendices
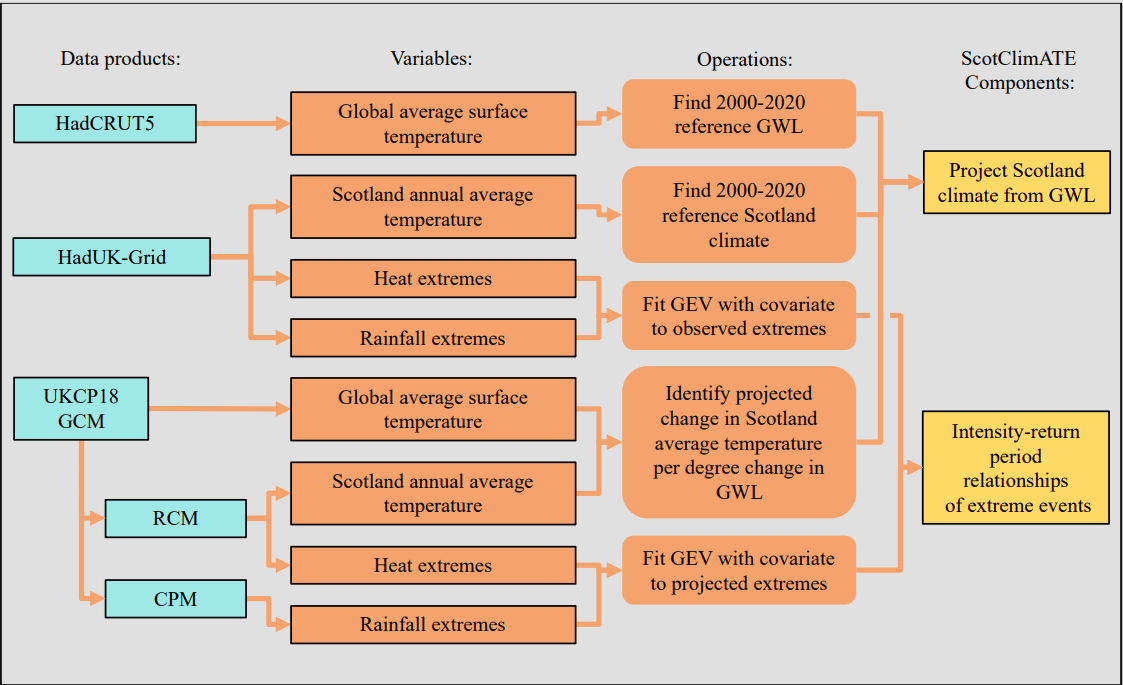
Figure 11: A diagram indicating which tool users can use to find projections for different hazards in Scotland.
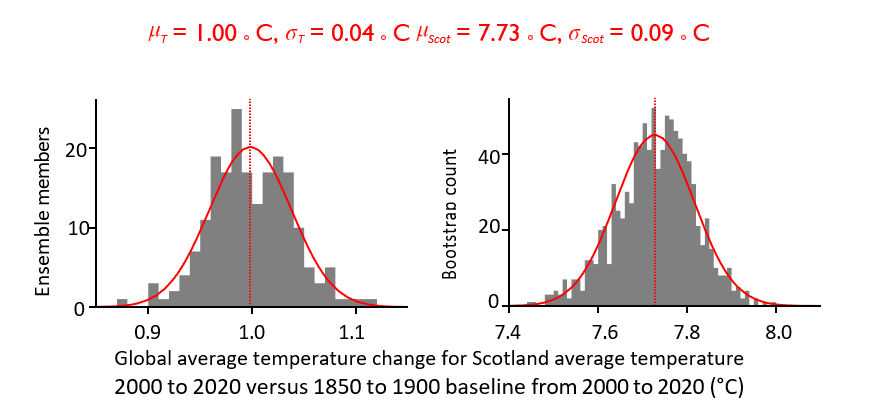
Figure 12 The histogram in the left panel compares the GWL in the 2000 to 2020 reference period with the pre‐industrial baseline. Plotted are the number of HadCRUT5 (Morice et al., 2021) ensemble members in each 0.01°C bins. The histogram in the right panel shows estimates of the Scotland average temperature in the 2000 to 2020 reference period from 12km HadUK‐Grid data (Hollis et al., 2018). Plotted are the number of bootstraps of average temperature resampled from annual averages over the reference period in 0.001○C bins. In each plot a normal distribution is fit to ensemble members (left) and bootstraps (right). The mean, µ, and standard deviation, σ, are reported for these fitted distributions.
Following Equation 1, the central estimate of Scotland mean temperature can be expressed as
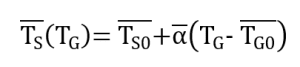
where TS0, α and TG0 are the mean values of the Gaussian distributions fit to the histograms of the three parameters in Figures 12 and 13(right). Additionally, the standard deviation of
the estimate of Scotland annual mean temperature at different GWL, σTS (TG), can be expressed with the standard deviation of each of the Gaussian fits to the histograms of
parameter estimates. The distribution of α being fit to the histogram of gradients of the bootstraps in Figure 13. The equation for the standard deviation of the probability distribution of estimate of TS is ∶
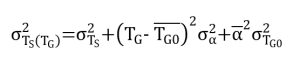
Values for the mean fit and standard deviation of each parameter are provided in Table 4.
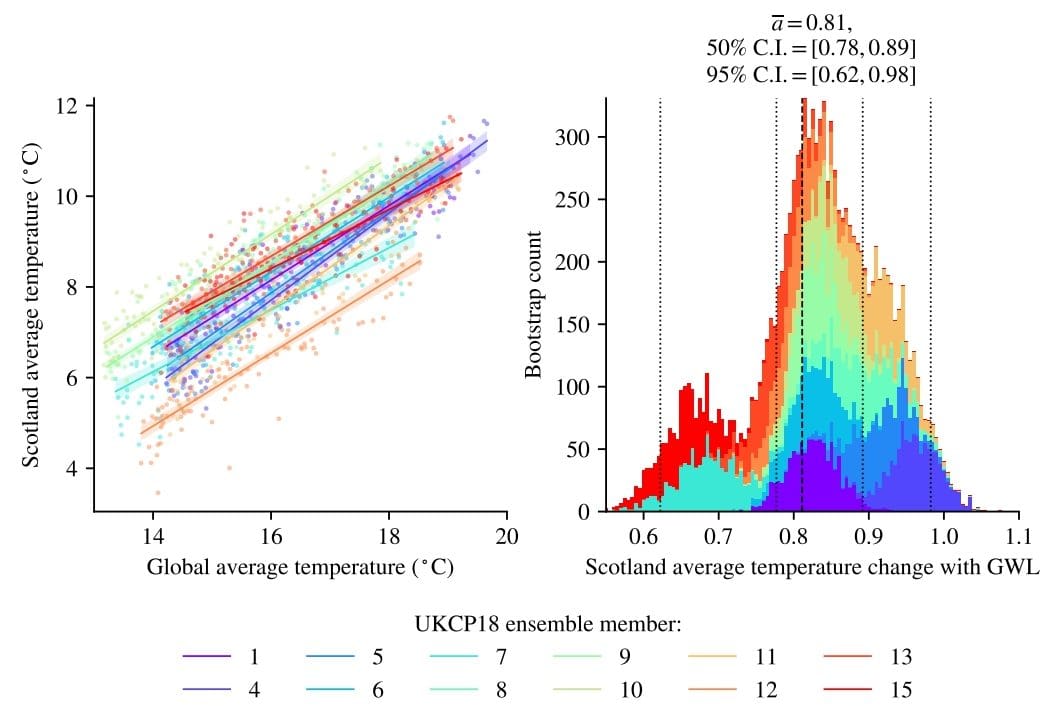
Figure 13: The left panel shows a scatter plot of the annual mean Scotland temperature in UKCP18 RCM ensemble members (Met Office Hadley Centre, 2018c) (colours) versus the respective global surface temperature in UKCP18 GCM simulations (Met Office Hadley Centre, 2018b). For each scatter, a linear best fit is made, with shading indicating the 95% confidence interval from 1000 bootstraps. The right panel shows a stacked histogram of the gradient of each bootstrap in the left panel; the coloured elements count the number of bootstrapped change in Scotland temperature per degree change in global temperature in 0.005°C bins.
Relationships between the location parameter and underlying climate are based on physical assumptions. For extreme heat, we have assumed that the hottest temperature each year changes linearly with Scotland average temperature,
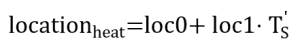
(4)
where T ′ is the Scotland mainland average temperature anomaly from approximate present day conditions, T ′ ≡ TS − 8○C. Extreme rainfall events are assumed to follow the Clausius‐Clapeyron relation, scaling exponentially with increased Scotland average temperature,
![]()
(5)
In both cases, the scale parameter must be positive and a standard practice is used with the scale parameter scaling exponentially with the covariate,
![]()
(6)
When fitting such statistical models, the parameters tend to not be independent – with bootstrapping, repeating the fitting procedure to random resamples with replacement of the data, we have quantified the correlation between the different parameters (not included in this report). As such, for each fit, the shape is stationary. In ScotClimATE, shape ≡ −c following the convention used in the SciPy stats module (SciPy Community, 2011). For each fit, the five parameters c, loc0, loc1, scale0, scale1 are found by maximising the likelihood of the distribution describing them.
Figure 14 provides examples of non‐stationary GEV distributions fit to extreme heat versus Scotland average temperature. The changing probability of extreme heat being exceeded at different Scotland average temperature values can be expressed as lines intersecting the scattered data. For 1200 years of UKCP18 data, we see that half of the points lie above the one in 2 year line, but about one‐hundredth of the points lie above the one in 100 year line. In the left panel are fewer than 100 years of observation data, so the one in 100 year line is understood as an extrapolation of the underlying distribution.
The fits in Figure 14 illustrate how the changing location and scale of extreme events can be found using the wide range of UKCP18 simulated climate compared with the narrow range of observed climate in Scotland.
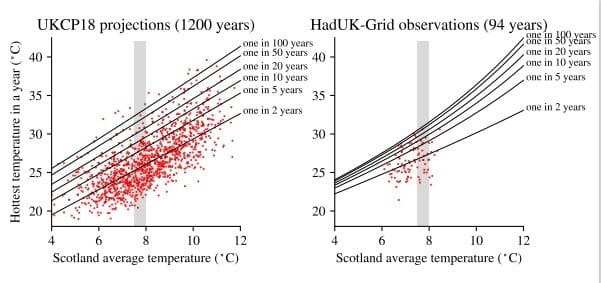
Figure 14: Examples of the central estimate of non‐stationary GEV fit to the hottest temperature each year in UKCP18 projections (left) and HadUK‐Grid data (right). Grey shading shows the range of Scotland climate identified for the 2000‐2020 reference period in Figure 3.
For any result in Scotland ClimATE there are ten parameters, two user set parameters and eight fitted parameters. Namely, the user sets a GWL and a return time or intensity threshold. There are three fitted parameters that map from GWL to Scotland average temperature and five that describe the statistical distribution of extreme events with changing Scotland climate.
We have used non‐parametric bootstrapping – resampling with replacement – to identify distributions of possible fits of the underlying data. The first three fitted parameters for
Scotland climate are independent of each other and carry their own uncertainty (Section 7). These closely follow Normal distributions (Figures 3 and 12).
The five parameters of the statistical distribution may have covariance with each other. This is described with a covariance matrix (Appendix C). Therefore, on top of the ten parameters,
the uncertainty is calculated using another three values of standard deviation and a 5×5 covariance matrix.
There are different methods for extracting confidence intervals from these. An analytical method can be implemented using the delta method. However, due to the short
development time of this project, and the adaptability where different components interface, we have calculated confidence intervals numerically.
One thousand random variates are generated for each set of the eight fitted parameters. Then, for each choice of user set parameters, there are one thousand possible results fit from all parameters. Confidence intervals correspond with the quantiles of those results ordered by value.
How to cite this publication:
Chaudhri, A.T, de Klerk, D, Tett, S (2026) ScotClimATE: a new Scotland Climate Analysis Tool for Extremes, ClimateXChange. DOI: 10.7488/era/6913
© The University of Edinburgh, 2026 Prepared by on behalf of ClimateXChange, The University of Edinburgh. All rights reserved. While every effort is made to ensure the information in this report is accurate, no legal responsibility is accepted for any errors, omissions or misleading statements. The views expressed represent those of the author(s), and do not necessarily represent those of the host institutions or funders.
This work was supported by the Rural and Environment Science and Analytical Services Division of the Scottish Government (CoE – CXC).
The authors would like to thank the steering group with representatives from the Scottish Government, SEPA, Scottish Water, The MetOffice, the Scottish Government Adaptation Team, and PSCAN for their feedback and support.
The authors would also like to thank Prof. Stuart Galloway at the University of Strathclyde and the Adaptation Team within the Scottish Government for their input and feedback on the development of this work. This work used JASMIN, the UK’s collaborative data analysis environment (https://www.jasmin.ac.uk), using computing resources provided to the project at no charge.
ClimateXChange
Edinburgh Climate Change Institute High School Yards
Edinburgh EH1 1LZ
+44 (0) 131 651 4783