

Increasing low-carbon energy in Scottish agriculture through a whole systems approach
DOI: http://dx.doi.org/10.7488/era/4409
Executive summary
Background
The Climate Change Plan update sets out targets to reduce emissions from the agriculture sector. Carbon dioxide emissions associated with stationary combustion sources and off-road machinery use in agriculture contribute significantly to agricultural emissions and have increased between 2020 and 2021. Fossil fuel use for agricultural machinery is estimated to contribute 5 to 10% of agricultural greenhouse gas (GHG) emissions in Scotland.
The impact of agriculture’s energy use can be difficult to account for, with emissions being captured within grouped sectors (electricity, gas and other) of the GHG inventory. This report examines the energy use and associated emissions baseline on farms and crofts in Scotland, and explores the potential for efficiency measures and new, low-carbon technologies to support energy emissions reductions in the longer term.
Key findings
- 82% of the emissions from agricultural energy use stem from other energy sources such as coal, liquefied petroleum gas (LPG) and oils, and 18% from electricity. This is based on the local authority greenhouse gas statistics where emissions are allocated to where the electricity is used, not where it is generated.
- The greatest source of emissions from other energy sources is the livestock sector; within this, beef has the greatest energy emissions due to the dominance of this sector in Scotland; dairy has the greatest intensity of emissions per kilogram of production.
- The first step in the decarbonisation journey is to look at opportunities to reduce energy use. There is great scope for energy efficiency measures to contribute to decarbonising agriculture. This can be achieved through optimising processes and introducing new technologies such as robotics and precision farming.
- Reducing other energy emissions by fossil switching to electricity will have a large positive impact. Replacing machinery with electric-powered equivalents will reduce cost and carbon emissions in the long term. Whilst electric replacements are not yet suitable for all farm operations where high power is needed, there are viable alternatives for smaller vehicles such as quad bikes, which are already being used across Scotland.
- The cost and carbon benefits of switching to electric-powered machinery may be optimised by combining this with on-farm renewable power generation.
- A good mix of low-carbon and renewable energy generation technologies is available across Scotland, which have generally high uptake and market readiness, and strong applicability to the agricultural sector.
- For most farmers, the introduction of renewable technologies is an incremental process. Each investment decision must provide a good business case. As farms build their renewable capacity, there is the potential to develop further into micro-grid or distribution network connections.
- Upgrades to energy distribution networks infrastructure could enable more farmers to export energy and accelerate decarbonisation beyond the farm.
Conclusions
The research identifies the wide variety of technologies available to meet the diversity of on-farm needs for energy efficiency, energy generation and energy use. These can all have a significant impact on reducing carbon emissions in the agricultural sector.
The cost of implementation is often an important factor for installing energy technologies. Many energy and process efficiency measures can be implemented on farm with low investment needs. However, the typically high upfront investment costs to install renewable energy generation on farm is frequently noted as a barrier for some farmers.
Another challenge is the limitations on the energy distribution networks. As a result, some businesses are not able to export energy back to the grid depending on their location and logistical constraints.
There are great opportunities to further decarbonise energy use and generation in the agricultural sector. In the correct enabling environment, farms can play a significant role in supporting Scotland’s net zero targets, just transition and circular economy aims.
Abbreviations table
|
ETs |
Electric tractors |
|
EVs |
Electric vehicles |
|
GHs |
Greenhouses |
|
REA |
Rapid Evidence Assessment |
|
PV |
Photovoltaic |
|
APV |
Agrophotovoltaics |
|
NAEI |
National Atmospheric Emissions Inventory |
|
BEV |
Battery electric vehicles |
|
GHG |
Greenhouse gas |
|
LPG |
Liquified petroleum gas |
|
AD |
Anaerobic Digestion |
|
SEG |
Smart Export Guarantee |
|
RHI |
Renewable Heat Incentive |
|
CHP |
Combined Heat and Power |
|
NRMM |
Non-road mobile machinery |
Introduction
There are great opportunities for agriculture to play a leading role in the just transition to a low carbon economy. From the implementation of low carbon technologies, application of alternative fuels, and use of energy efficiency measures, agricultural businesses will be able to benefit from decarbonisation through reduced energy use, more efficient processes and technologies, and on-site clean energy generation. Scottish agriculture could also function as an enabler of wider decarbonisation if surplus energy can be generated to meet off-site market demands.
The decarbonisation of energy use and a transition to low carbon energy generation within the agriculture sector is an essential consideration for Scotland to:
- Meet the 2030 interim 75% emissions reduction target, and the 2045 target for the country to reach net zero GHG emissions.
- Support Scottish Government’s commitment to creating a circular economy which supports GHG reductions from manufacturing and transportation and develops safeguards against potential future resource shortages.
- Support Scottish Government’s vision to become a global leader in sustainable and regenerative agriculture.
As detailed in the Climate Change Plan Update 2018-23[1], Scotland has an abundance of renewable resources. More than 87.8% of the electricity generated in Scotland during 2021 came from renewable and low carbon sources, and there is scope to go further. There are opportunities for the agricultural sector to both decarbonise its own activities and to also play a strategic role in decarbonising energy used across Scotland.
The Scottish Government is committed to ensuring a just transition to a low carbon, climate resilient economy, as outlined in the draft ‘Energy Strategy and Just Transition Plan’[2]. It is particularly vital now as the climatic changes signal the urgency with which we need to act, whilst at the same time the cost-of-living crisis is putting real pressure on government, householders and businesses. Scotland has already taken steps to support a just transition, including setting up the first Just Transition Commission (JTC) which made twenty-four recommendations in March 2021[3]. These were all accepted by the Scottish Government and include recommendations such as:
- establishing a just transition plan for Scotland’s land and agriculture, with clear milestones to 2045, supporting Scottish agriculture to deliver climate action; and
- committing to creating communities that embed low-carbon lifestyles.
The agriculture sector and land-based economy is highly vulnerable to climate changes[4],[5]: recent unpredictable weather, from the ‘beast from the east’ to 2022’s unusually dry conditions have all had a huge impact on productivity and farm incomes. Farmers and crofters have also been hard hit by price rises resulting from the war in Ukraine and the disruption to the labour market post-Brexit. Many producers in energy intensive sectors such as poultry and horticulture responded to this by pausing or reducing production rather than risk producing at a loss.
There are significant opportunities for agricultural businesses to benefit from low-carbon energy generation. The potential to reduce costs of generate revenue will vary from business to business; examples of potential benefits are:
- Introducing more efficient processes and technologies will reduce the overall energy requirements so saving money and reducing emissions.
- Replacing machinery and vehicles with electric equivalents may provide cost savings for the business in the long-term and significantly reduce agricultural emissions. Cost benefits are further optimised if the business can utilise their own energy generated from on-farm renewables.
- Installing renewable generation technologies means farms can become more self-sufficient and resilient to fluctuations in energy supply costs.
- New opportunities for a diversified income stream through the production of energy on-farm or through leasing land for renewable energy generation.
Aim
This report maps out the baseline for current energy used on farms and crofts in Scotland using National Atmospheric Emissions Inventory (NAEI) data and sets out the available evidence base and gaps. Secondly, the available literature of opportunities and barriers for low carbon energy production and use on Scottish farms is assessed, and any evidence gaps and topics of debate are documented. Finally, the study analyses the strengths, weaknesses, opportunities and barriers for specific technologies, and the various factors that enable or prevent current and future uptake.
Energy use baseline and generation sources
Estimation of emissions
This report has taken the approach to estimate the on-farm emissions from energy use based on local authority (LA) breakdowns. As part of the National Atmospheric Emissions Inventory (NAEI[6]), emissions of greenhouse gases (carbon dioxide, methane, nitrous oxide) are calculated at LA level on an end user basis[7].
Using this approach, estimates from energy use in agriculture for 2021 are shown in the table below (kt CO2 equivalent), taken from the LA statistics and aggregated to agricultural regions. Further details of energy use may be found in Appendix A of this report.
Table 1: Electricity, gas, and other fuel emissions estimates for 2021 shown in kt CO2e. This table covers everything from the inventory, including both rural and urban estimates. For our estimations covered in the following tables, we excluded urban areas to reduce anomalies in the data.
|
Agricultural Region |
Electricity |
Gas[8] |
‘Other’[9] |
Total |
|
Argyll and Bute |
12.79 |
0.31 |
37.67 |
50.77 |
|
Ayrshire |
13.40 |
20.55 |
83.18 |
117.13 |
|
Clyde Valley |
18.50 |
20.37 |
72.32 |
111.19 |
|
Dumfries and Galloway |
23.21 |
0.68 |
168.16 |
192.05 |
|
East Central |
8.83 |
1.00 |
32.67 |
42.50 |
|
Fife |
14.88 |
35.53 |
29.96 |
80.37 |
|
Grampian |
34.47 |
14.28 |
157.01 |
205.76 |
|
Highland |
26.40 |
3.77 |
99.75 |
129.92 |
|
Lothian |
11.94 |
9.97 |
33.82 |
55.73 |
|
Na h-Eileanan Siar |
3.11 |
0.00 |
10.45 |
13.56 |
|
Orkney |
4.63 |
0.00 |
37.04 |
41.67 |
|
Scottish Borders |
13.94 |
0.77 |
95.52 |
110.23 |
|
Shetland |
3.67 |
0.00 |
19.23 |
22.90 |
|
Tayside |
27.94 |
7.88 |
84.18 |
120.00 |
|
Total |
217.71 |
115.11 |
960.96 |
1293.78 |
As the data from the NAEI is not broken down by livestock or crop type, the Scottish agricultural census[10] (which provides the head count of livestock and hectares of crops at regional level[11]) has been combined with typical fuel consumption factors (detailed in section 9.1.1 of this report). This was used as a proxy to disaggregate and spatially resolve the above GHG energy emissions (Table 1) into crop and livestock type by region. This provides a breakdown of rural emission estimates for electricity, gas and ‘other’ (urban emissions were removed). ‘Other’ fuels include coal, liquefied petroleum gas (LPG) and oils for static and mobile machinery. These emissions are calculated on an end user basis. Emissions are allocated to where they are used, not where they are generated.
The energy emissions by agricultural region in the livestock and crop sectors are presented in the maps and tables below. A full methodology can be found in Appendix A. The table below shows a summary of energy use emissions across Scotland by sector. Their implied intensities have been calculated (CO2e emissions divided by headcount/hectare total) to facilitate meaningful comparisons.
Table 2a: Livestock sector- Total sectoral emissions from rural energy use (all fuels) by sector for Scotland shown in kt CO2e.
|
Rank |
Livestock Sector |
Scotland total energy use emissions (kt CO2e) |
Scotland 2021 Census Totals (head) |
Intensity (kg CO2e /head) |
|
1 |
Dairy |
205.64 |
517,988.00 |
397 |
|
2 |
Pig breeding |
15.02 |
64,772.00 |
231.89 |
|
3 |
Beef |
326.76 |
1,855,072.00 |
176.14 |
|
4 |
Sheep |
119.56 |
13,663,410.00 |
8.75 |
|
5 |
Poultry layers |
28.74 |
15,020,619.00 |
1.91 |
|
6 |
Poultry broilers |
3.98 |
11,963,706.00 |
0.33 |
|
n/a |
Pig other |
0 |
607,158.00 |
n/a |
|
n/a |
Other livestock |
0 |
131,813.00 |
n/a |
|
Total |
699.7 |
43,824,538.00 |
|
The livestock sector accounts for approximately 63% of the energy use emissions of agriculture in Scotland. Beef has the highest overall energy emissions when compared to all other sectors, emitting over 100 kt CO2e more than the dairy sector, which is the second largest CO2 emitting sector. This is largely due to the scale of beef production in Scotland. The table above is ranked by the emissions intensity; the greatest emissions per head (emissions intensity) is from dairy production, which is more than twice as energy intensive as beef. When looking at the data above it is important to note that energy is a significant cost to intensive poultry production, but due to the number of birds per shed it is not well represented in this intensity figure. However, it would be significant if we looked at energy intensity per hectare of production.
The table below shows some of the typical energy uses on livestock farms.
Table 2b: Typical energy uses in the livestock sector.
|
Sector |
Energy requirements |
|
Dairy |
Chillers, heating, lighting, small amount of warm/hot water. Some mobile (e.g., spreaders, HGVs needed for on-farm feed production). Some energy needs for robotic milking. |
|
Poultry (layers) |
Heating, cooling, and ventilation systems in housing. |
|
Poultry (broilers) |
Heating, cooling, and ventilation systems in housing. Broilers – high demand on day 1 – diminishing heat demand as birds grow, but ventilation demand increases. |
|
Pig |
Housed pigs- Intensive heat and lighting energy use. |
|
Sheep |
Small amount on mobile machinery, small amount of electricity or fuel for a generator for sheering machinery. Small amount heating and light for lambing and small amount of warm/hot water for washing. |
|
Beef |
Low demands, similar to sheep. Small amount on mobile machinery. Small amount heating/lighting for calving and for small amount of warm/hot water for washing |
Table 2c: Cropping/horticulture sector- Total sectoral emissions from rural energy use (all fuels) by sector for Scotland shown in kt CO2e.
|
Sector |
Scotland total energy use emissions (kt CO2e) |
Scotland 2021 Census Totals (hectare) |
Intensity (kg CO2e/hectare) |
|
Potatoes |
81.55 |
56,835.50 |
1,434.84 |
|
Wheat |
87.46 |
209,100.90 |
418.27 |
|
Barley (spring) |
192.59 |
497,774.50 |
386.9 |
|
Barley (winter) |
31.64 |
86,492.80 |
365.81 |
|
Peas and beans |
1.38 |
4,729.30 |
291.8 |
|
Oilseed and linseed |
18.61 |
66,682.60 |
279.08 |
|
Orchard and soft fruit |
0.31 |
4,630.30 |
66.95 |
|
Total |
413.54 |
926,245.90 |
|
Cropping and horticulture accounts for approximately 37% of the energy use emissions from agriculture in Scotland. Within the cropping and horticultural sectors, spring barley had the greatest emissions and produced more emissions from energy use than some livestock sectors, such as sheep, pigs, and poultry. However, emissions associated with the production of potatoes are shown to be the most intensive when area of production is taken into account. The table below covers the typical energy uses in cropping and horticultural sectors.
Table 2d: Typical energy uses in cropping/horticulture.
|
Sector |
Energy requirements |
|
Cereals |
Drying of harvested crops (typically required in Scotland). Cultivation power, drilling, harvest, transport (to storage on farm) |
|
Fresh peas |
Cultivation power, drilling, harvest, chilling (most peas in Scotland are fresh). |
|
Potatoes |
Cultivation power, sowing, harvest and storage, chiller, dark house. Depends on variety (seed potatoes). Some mobile machinery. |
|
Soft fruit |
Energy intensive for chilling, and for heating of soft fruit growing environment to extend growing season and displace carbon intensive imports. Some mobile machinery, depending on produce |
The maps below show the energy use emissions associated with livestock and crops across Scotland, indicating the areas with greater or fewer emissions from either sector.
Figure 1: Emissions (kt CO2e) associated with livestock (left) and crops (right) at regional level in Scotland.
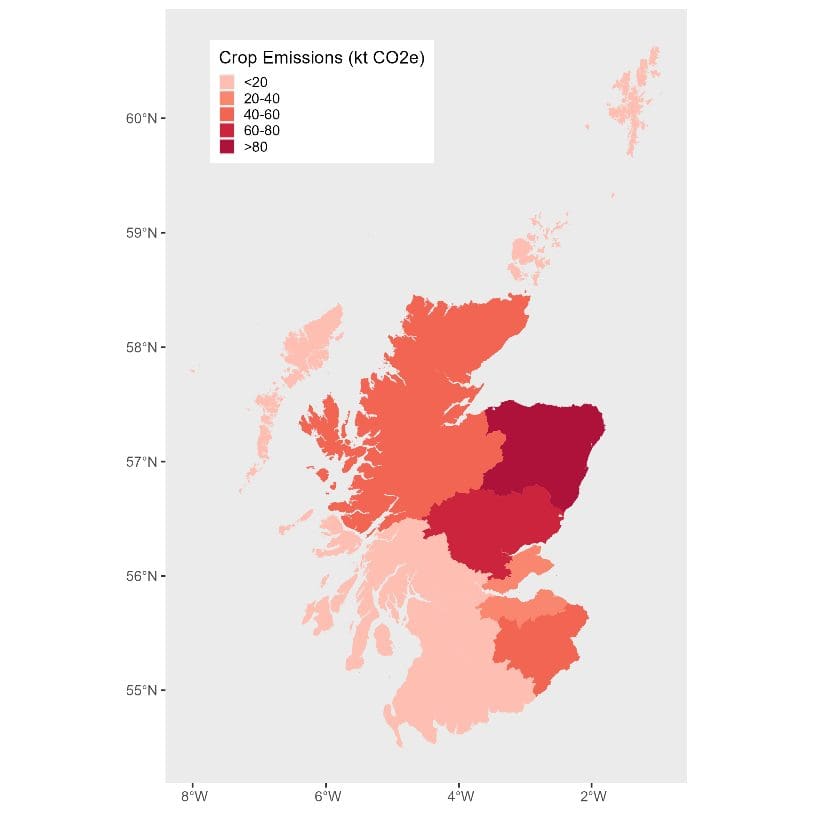
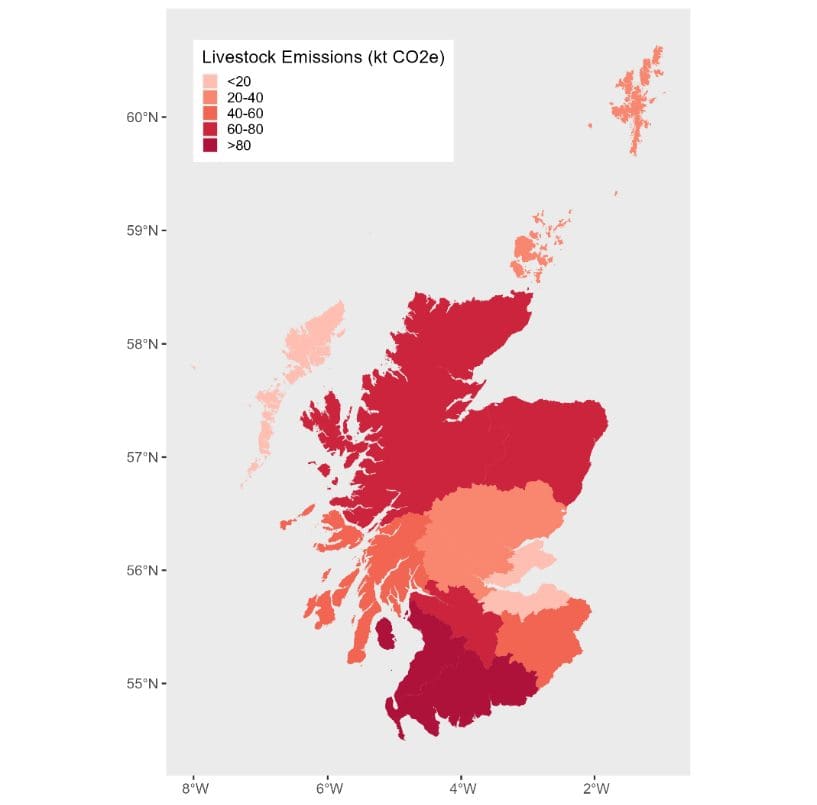
As can be seen from figure 1, the largest emitters of energy emissions associated with livestock are located in the southwest of Scotland (Dumfries & Galloway and Ayrshire); the same areas are low emitters of emissions associated with the growing of crops.
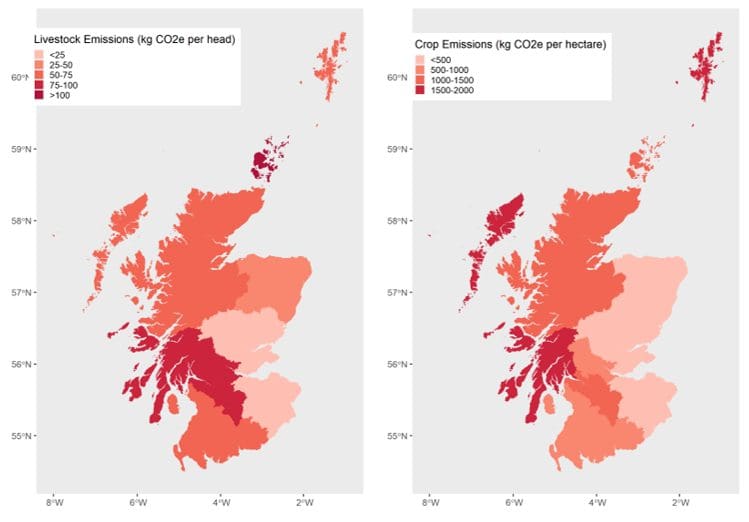
For energy emissions associated with crops, Eastern Scotland (Grampian) is the largest emitter. However, this area also has the highest number of hectares of crops in Scotland and it can be noted from figure 2 below that this area is one of the most efficient in terms of CO2e per hectare. The east of Scotland is generally more efficient for both crops and livestock than the western or northern parts of Scotland.
Conversely, Argyll, Orkney, Shetland, and the Outer Hebrides are areas of low crop related emissions but high intensity of CO2e per hectare, however this may be a reflection of low numbers of crops grown in those areas.
Figure 2: Relative emissions (kt CO2e) associated with livestock (left) and crops (right) at regional level in Scotland.
The table below (Table 3) shows the emissions by livestock and cropping sectors for each LA. Electricity emissions have come from the NAEI Local Authority GHG (LA GHG) data. Proxy data has been applied to the LA GHG emissions to split it into the different agricultural sectors. The table shows that for each region the emissions from other energy inputs (including coal, liquefied petroleum gas (LPG) and oils for static and mobile machinery) exceed those from electricity use.
Table 3: Energy use emissions by agricultural region, split out by sector type and fuel input type, in kt CO2eq.
|
Agriculture Region |
Energy Input |
Livestock Sector Energy Emissions (kt CO2e) |
Cropping Sector Energy Emissions (kt CO2e) |
Total emissions (kt CO2e) |
|---|---|---|---|---|
|
Argyll and Bute |
electricity |
11.68 |
1.06 |
12.74 |
|
Argyll and Bute |
other |
35.25 |
2.28 |
37.53 |
|
Ayrshire |
electricity |
12.31 |
0.99 |
13.3 |
|
Ayrshire |
other |
73.21 |
9.35 |
82.56 |
|
Clyde Valley |
electricity |
14.98 |
1.8 |
16.78 |
|
Clyde Valley |
other |
56.92 |
8.28 |
65.2 |
|
Dumfries and Galloway |
electricity |
20.96 |
1.38 |
22.34 |
|
Dumfries and Galloway |
other |
146.33 |
15.64 |
161.97 |
|
East Central |
electricity |
5.57 |
2.57 |
8.14 |
|
East Central |
other |
20.83 |
9.45 |
30.28 |
|
Fife |
electricity |
4.14 |
10.58 |
14.72 |
|
Fife |
other |
8.51 |
21.11 |
29.62 |
|
Grampian |
electricity |
11.26 |
20.65 |
31.91 |
|
Grampian |
other |
59.68 |
85.53 |
145.21 |
|
Highland |
electricity |
6.8 |
18.42 |
25.22 |
|
Highland |
other |
56.89 |
38.35 |
95.24 |
|
Lothian |
electricity |
2.9 |
6.69 |
9.59 |
|
Lothian |
other |
8.48 |
18.81 |
27.29 |
|
Na h-Eileanan Siar |
electricity |
1.46 |
1.59 |
3.05 |
|
Na h-Eileanan Siar |
other |
9.98 |
0.27 |
10.25 |
|
Orkney |
electricity |
2.58 |
1.94 |
4.52 |
|
Orkney |
other |
31.28 |
5.06 |
36.34 |
|
Scottish Borders |
electricity |
7.31 |
6.26 |
13.57 |
|
Scottish Borders |
other |
46.53 |
46.7 |
93.23 |
|
Shetland |
electricity |
3.28 |
0.42 |
3.7 |
|
Shetland |
other |
19.08 |
0.11 |
19.19 |
|
Tayside |
electricity |
3.2 |
21.66 |
24.86 |
|
Tayside |
other |
18.32 |
56.61 |
74.93 |
|
Total |
|
699.72 |
413.56 |
1,113.28 |
This report estimates total on-farm emissions from energy use to be 1.1 MtCO2e. However, energy emissions in the agriculture sector in Scotland as reported in the UK National Atmospheric Emissions Inventory (NAEI) were 0.91 MtCO2e in 2021. The vast majority of these emissions reported in this figure (0.91) relate purely to emissions associated with mobile machinery, such as tractors, harvesters and other on-farm vehicles. A smaller amount of these energy emissions are related to energy combusted by static machinery; for example, generators, grain dryers, chillers, or robot milkers.
Emissions from the NAEI are reported in a variety of different formats for different purposes each year. One of these is the end user format (used in this report) in which emissions from the production and processing of fuels, and the production of electricity, are reallocated to final consumers of the energy to reflect the total emissions relating to that energy use. This difference in reporting mainly affects emissions related to electricity generation from power stations and fuel processing in refineries. This is in contrast to the ‘by source’ or ‘by territory’ emission reporting (in e.g., the devolved administration (DA) inventories) in which emissions are attributed to the sector that emits them directly.
In the LA statistics, the end user estimates are calculated using postcode level gas and electricity meter readings, in conjunction with employment statistics in the calculation. There are various spatial distributions that may be aggregated to the LA level[12]. This subsequently provides a spatial estimate of electricity, gas and other fuel use in Scotland. Consequently, this will pick up non-farm energy use on farm buildings, such as holiday rentals, as well as all mobile machinery and static combustion elements. The purpose of this is to demonstrate the broader potential for low energy production on farms to reduce emissions from energy use. As a result, the estimation of baseline emissions using this approach as higher, at 1.1 MtCO2e, than those reported in the UK NAEI for Scotland.
In summary, the approach used in this report uses the LA dataset as its starting point, and the results will therefore differ from any other published data, such as the 0.91 MtCO2e figure, which uses a different/by source dataset (e.g., DA inventory) as it’s starting point.
Summary remarks based on the estimation of emissions
Table 3 indicates that efforts to reduce agricultural emissions would be most effective if targeted at processes that currently rely on other fuels. This may be through identifying opportunities to improve the efficiency of these operations or technologies that enable the electrification of processes that previously relied on fossil fuels. Decarbonisation will be further optimised if the electricity used is generated through renewables.
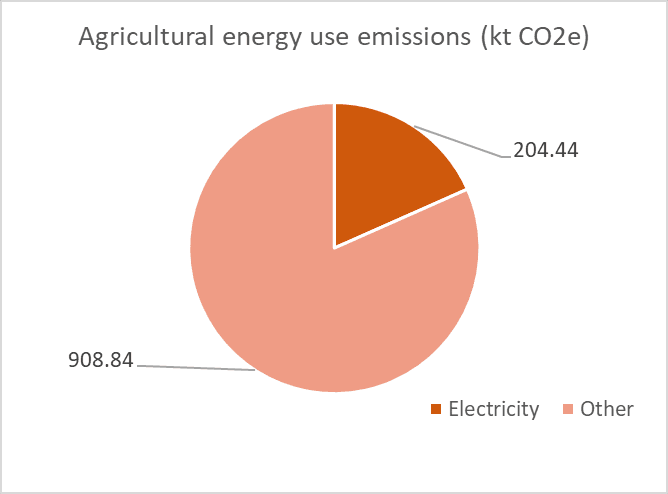
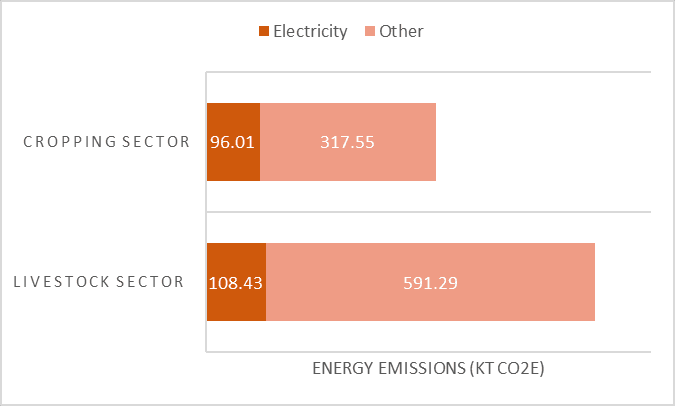
82% of the emissions from agricultural energy use stem from other energy sources (coal, liquefied petroleum gas (LPG) and oils), and 18% from electricity. From the data, it is evident that livestock ‘other energy’ emissions are a substantial contributor to the overall energy use emissions from agriculture in Scotland. Efforts to reduce this through efficiency measures or fuel switching will have a significant impact. This is illustrated in the figure below, which provides a snapshot of the sources of energy use emissions for the agricultural sector overall and split by cropping and livestock sectors in Scotland.
Figure 3: Sources of energy use emissions for agriculture overall and split by sectors.
Gaps in baseline estimate
The literature provided data on the typical energy consumption of various sectors; however, the dominant fuel (or mix of fuels) used within the ‘other’ energy consumption category is less well documented. For example, although the use of petroleum products is widespread in the poultry sector (particularly for heating), there is little data on the relative proportional use of these products. There is a need to gather more detailed information on the use of petroleum products for various agricultural practices to better understand these gaps in the future. Similarly, there is limited information on the use of individual electricity generators and their fuel consumption.
Most data found in the literature are from 2005, as more updated benchmarks containing the energy consumption breakdown required were not publicly available. However, it was found that mobile machinery benchmarks (as shown in Table 9.1.1) remained the same in the literature between 2005 and 2023, suggesting the non-mobile machinery 2005 statistics are still relevant and provide a reasonable basis for calculations.
While the literature provided specific data on the majority of sectors, some were not explicitly defined in terms of energy consumption. For example, the sectors of ‘oilseed and linseed’ and ‘peas and beans’ were included in a broader ‘other arable’ category that also contained sugar beet. Furthermore, the literature contained energy consumption values for sows is derived from energy inputs associated with maiden gilts, piglets, and boars. Therefore, no consumption values were attributed to non-breeding pigs as these were incorporated into the sow data.
Evidence base
A Rapid Evidence Assessment (REA) of peer-reviewed and grey literature was used to evaluate renewable energy technologies currently adopted in Scotland. The methodology can be found in Appendix 2. This evidence was supported by the expert knowledge of the project team. The review focused on identifying:
- Barriers and enablers of technology specific to the agricultural sector to reduce demand for fossil fuels and support the decarbonisation of on-site energy use.
- Opportunities and benefits for the agriculture sector to support the wider decarbonisation of energy production at a systems level through renewable energy production.
- Current potential for the agricultural sector to benefit from an emerging second-hand market for renewables and renewable components and opportunities for the farming community to participate in a circular economy, such as reusing and repurposing alternative energy components.
- Land use implications from low carbon energy production with a focus on farms (but with a consideration of wider landscape impacts), and the potential impact on agricultural production.
The following sections discuss information found in the REA, covering renewable energy technologies relevant to Scotland which are ‘areas of confident knowledge’, including a summary table of technology applications and details such as market uptake and cost; key evidence gaps highlighted from the REA; and areas under active debate.
Reducing the demand for fossil fuels and supporting the decarbonisation of on-site energy use
Energy efficiency
The first step in a decarbonisation journey is to look at opportunities to reduce energy use and support or enhance energy efficiency. There are many agricultural businesses in Scotland for whom this will provide opportunities for reducing energy use. Typically, implementing energy saving measures provides long-term cost savings and many can be low or no-cost to implement, though some will require a more significant investment. Energy consumption and opportunities to save energy vary considerably between businesses, depending on the operating farming system and the efficiency with which the system is managed.
Teagasc[13] report that energy costs in dairy farms vary from €15-45 per cow per year; this variance indicates the scale of opportunity for efficiencies. The Carbon Trust[14] note that key areas of energy consumption (and therefore areas in which efficiency measures will have most the impact) are lighting, heating, ventilation, air circulation, and refrigeration.
The following table provides an overview of energy efficiency technologies that can be deployed across a range of farm sectors in Scotland[15].
Table 6: Overview of potential energy efficiency measures
|
Mitigation option |
Technology |
GHG reduction |
|---|---|---|
|
Precision farming technology |
VRA N fertiliser for 500 ha farm, assuming a 200 HP, GPS compatible tractor is available on the farm |
Soil N2O, energy CO2, increased yield |
|
Precision farming technology |
Auto guidance for 500 ha farm, assuming 2 tractors (200 HP, GPS compatible) are available on the farm |
Soil N2O, energy CO2, increased yield |
|
Precision farming technology |
Controlled traffic system |
Soil N2O, energy CO2, increased yield |
|
Precision farming technology |
Basic system (auto-steering, yield monitor, VRA seeding) |
Soil N2O, energy CO2, increased yield |
|
Precision farming technology |
Site specific weed management for 500 ha farm |
Soil N2O, energy CO2, increased yield |
|
Precision farming technology |
Tractor control |
Soil N2O, energy CO2, increased yield |
|
Precision farming technology |
Variable rate seed drill |
Soil N2O, energy CO2, increased yield |
|
Precision farming technology |
Variable rate fertiliser spreader |
Soil N2O, energy CO2, increased yield |
|
Precision livestock farming |
EID readers and software |
All livestock emissions, yield |
|
Precision livestock farming |
Weigh crate (weighing and automatic sorting of sheep) |
All livestock emissions, yield |
|
Precision livestock farming |
Silent herdsman – cattle heat detection (collars, base station & PC with software) |
All livestock emissions, yield |
|
Precision livestock farming |
HeatWatch – cattle heat detection (patch, base station, software) |
All livestock emissions, yield |
|
Precision livestock farming |
Robotic milking in dairy cow (auto milking system with dynamic feeding related to milk yield; ID of animals with treatment) |
All livestock emissions, yield |
|
Precision livestock farming |
Virtual fence (battery powered receiver on collar, induction cable & transformer) |
All livestock emissions, yield |
|
Minimum tillage and no-till |
Direct drill to reduce the number of tractor journeys |
Energy CO2, increased yield |
|
Capital investment in fuel switching |
Electric quad bikes |
Energy CO2 |
|
Capital investment in fuel switching |
Electric lift trucks |
Energy CO2 |
|
Capital investment in fuel switching |
Euro 3 engines |
Energy CO2 |
|
Capital investment in fuel switching |
Solar panel pumps to transport water in grazing systems |
Energy CO2 |
|
Energy efficient heating and ventilation of livestock buildings |
Energy efficient fans and fan controllers |
Energy CO2 |
|
Energy efficient heating and ventilation of livestock buildings |
Biomass boiler (fuel switch) |
Energy CO2 |
|
Energy efficient heating and ventilation of livestock buildings |
Lagging pipes (hot and cold) |
Energy CO2 |
|
Energy efficient heating and ventilation of livestock buildings |
Other tech and building design |
Energy CO2 |
|
Energy efficient crop drying |
Biomass boiler |
Energy CO2 (grain stirrers might increase fuel use) |
|
Energy efficient crop drying |
Grain stirrer |
Energy CO2 (as above) |
|
Energy efficient crop drying |
Moisture sensors |
Energy CO2 (as above) |
|
Energy efficient milking and milk handling |
Heat recovery |
Energy CO2 |
|
Energy efficient milking and milk handling |
Variable speed milk pumps |
Energy CO2 |
|
Energy efficient milking and milk handling |
Lagging tanks |
Energy CO2 |
|
Energy efficient milking and milk handling |
Maintaining condensers and ensuring they are well located to avoid recirculating warm air |
Energy CO2 |
|
Low-emission livestock housing |
Littered system (gestating sows) (retrofit more expensive) |
Energy CO2 |
|
Low emission livestock housing |
Littered system (growers-finishers) (retrofit more expensive) |
Energy CO2 |
|
Low emission livestock housing |
Manure channel with sloped floor (weaners) (retrofit more expensive) |
Energy CO2 |
|
Low emission livestock housing |
Manure channel with sloped floor (growers-finishers) (retrofit more expensive) |
Energy CO2 |
|
Low emission livestock housing |
Other building design features |
Energy CO2 |
|
Efficient lighting systems |
Using timer switches |
Energy CO2 |
|
Efficient lighting systems |
Replacing halogen floodlights with sodium lights |
Energy CO2 |
|
Efficient lighting systems |
Optimising natural light in buildings and ensuring windows are kept clean to maximise impacts |
Energy CO2 |
Robotics
A number of the measures detailed above are automated or robotic. It is not yet considered achievable to have fully autonomous, robotic, energy-independent farms (Ghobadpour et al., 2022) but robotics are an important set of technologies that can support low-carbon agricultural production systems.
Robotics and Autonomous Systems (RAS) enable greater farming accuracy, lightweighting of machinery (which has a co-benefit of enabling positive environmental benefits) and, in comparison to humans, a longer work time, enabling great efficiency (Krishna, K.R., 2017). An EU foresight study predicted that around 50% of all European herds will be milked by robots by 2025 (Duckett et al., 2018). Robotic systems are also starting to perform other tasks around the farm, such as removing waste from animal cubicle pens, and carrying and moving feedstuffs. Other RAS already in use include GPS driven tractors and systems for autonomously monitoring livestock and collecting field data, which are all commercially viable and useful for efficient and productive livestock farming. These are just the start; there are considerably more robotic applications under development, although most agricultural RAS are currently far from commercialisation (Gorjian et al., 2021)
Despite the clear value of robotics, there is limited information in the literature discussing the ability for RAS to contribute to the decarbonisation of the agriculture sector in Scotland. A causation could be because the UK Agri-Food RAS community is still small and highly dispersed (Duckett et al., 2018).
Electric vehicles
Agricultural battery electric vehicles (BEVs) have the potential to provide numerous benefits such as emission reduction, low operating costs, on farm charging, and vehicle-to-grid technology creating a new source of income. In the long-term, it is likely that BEVs will be the preferred technology for replacing current diesel-powered internal combustion engine machinery; however, Baker et al. (2022) found that there is a lack of international progress in encouraging the uptake of low-emission machinery. Nevertheless, this means there is an opportunity for Scotland to set a standard in encouraging low-emission machinery.
The most common debate found in literature is whether battery powered agricultural vehicles are a practical solution in agriculture, with many stating that currently, electric vehicles (EV) are not suitable for use in agriculture (Baker et al., 2022). However, this comment is generally associated with larger EVs on farm, such as electric tractors. Electric quadbikes, all-terrain vehicles (ATVs) and 4x4s have been on the market for several years and are gaining popularity due to the low-cost of charging compared to conventional mobile machinery and quieter operation. Electric ATVs are a prime example of EVs that work well within the sheep and beef sectors in Scotland, where livestock are often located in the uplands and highlands.
The debate around the suitability of larger EVs (e.g., tractors or combine harvesters) in agriculture generally stems from the low energy density, heavy batteries and if they can take over from diesel powered vehicles with the nature of agricultural work. The energy density of lithium-ion batteries (circa 200Wh/kg is significantly lower than diesel (11.6kWh/kg)) (Pearson et al., 2022). An average tractor diesel engine requires a 400l energy reserve of fuel (9.8 kWh/l resulting in a total of 3,920 kWh or 1,670 kWh due to the 40-45% engine efficiency). The equivalent full electric variant utilising Lithium-Ion (Li-Ion) batteries (best values of the battery pack expected in 2025, midterm 0.2 to 0.25 kWh/kg), results in a total of 2,000 kWh due to the high battery efficiency, weighs 9-10 tonnes and takes 5,000 l in volume to do the same 8 hours of work[16]. Despite batteries being more energy efficient, this still leads to several concerns:
- Heavy batteries limit the range and usage of agricultural machinery and can increase soil compaction if the vehicle weight is not effectively distributed through vehicle design, leading to a range of environmental and productivity issues on farm.
- There is a debate surrounding the environmental impact of battery production, in particular the procurement of the rare materials and minerals required[17].
- Charge time is another concern under debate, with heavy, powerful machinery requiring significant time to charge. Although this can be overcome with powerful charging infrastructure, this comes at a cost. Farmers may also overcome this with reduced operation time or multiple charging sessions, both of which however do not make for an economically competitive case against the diesel counterpart (Baker et al., 2022).
Currently there is reluctancy to adopt EVs without incentives (such as grants, subsidies and market price) (Jones et al., 2020) and whilst there is evidence to support the suitability of EVs for small scale horticulture, indoor fruit growing, and grounds maintenance activities (supporting the main driver that smaller electric machines allow farmers to undertake activities indoors and close to the farm40), there is a current inability to support all farming activities (Baker, P., et al 2022). As a result, some believe the current constraints will result in large internal combustion engine vehicles remaining in use for many years to come (Duckett et al., 2018), while others believe low carbon fuels and/or hybrid systems incorporating a combustion engine and a battery may be one possible technological solution.
Although energy and process efficiency is a starting point to reduce energy use, the benefits to the business and to the environment may be further optimised if the business is also able to explore combining energy efficiency with renewable energy production. In the right setting and application, this can provide significant cost savings in the long-term and a reduction in GHG emissions.
Opportunities to support the wider decarbonisation of energy production
There are a range of renewable technologies relevant to Scotland that are already installed across the country in various agricultural settings. This section discusses those technologies and provides an overview of their applications in the agriculture sector. Tables 4 below provides an overview of different alternative energy generation and use technologies on farm, covering the following details: energy vector, sector coverage, market readiness, current installed capacity in Scotland, capital expenditure (CAPEX) and operating expenditure (OPEX) per annum (pa), quantified CO2 abatement potential (for individual installations, rather than the nation-wide abatement potential), and the public acceptability of installations based on survey data.
Where the table states ‘n/a’, there was no available data. The availability of this data shows that there is a need for further surveying of public opinion on the acceptability of anaerobic digestors, for example. Market readiness relates to how ready the technology is to enter the market; those that are already widely available are noted as ‘high’, and those that aren’t widely available are defined as ‘low’ (where information was available).
Table 4: Overview table of alternative energy generators providing a snapshot of information about some selected technologies.
|
Vector |
Sector suitability |
Market readiness |
Installed capacity |
CAPEX |
OPEX (pa) |
Abatement potential |
Acceptability | |
|---|---|---|---|---|---|---|---|---|
|
Wind turbine |
Elect. |
Arable, livestock |
High |
8.8 GW |
£7k for 1.5 kW |
~£100 per turbine |
6g CO2/kWh |
High[18] |
|
Solar PV panels |
Elect. |
Arable, livestock |
High |
410 MW |
£200k for 250 kW |
~£100 per panel |
41g CO2/kWh |
High[19] |
|
Anaerobic digestor |
Elect. |
Arable, livestock |
n/a |
89,332 MWh (e) |
£1.5m for 250 kW |
£110k for 250 kW |
n/a |
n/a |
|
Biogas |
Arable, livestock |
102,182 MWh (h) | ||||||
|
Hydroelectric dam |
Elect. |
Arable, livestock |
High |
1,666 MW |
£963k for 250 kW |
£25k for 250 kW |
24g CO2/kWh |
Variable[20] |
|
Heat pumps |
Heat |
Arable, livestock |
High |
390 GWh |
£15k for 16kW |
£0.03/kWh |
n/a |
High |
|
Biomass boiler |
Heat |
Arable, livestock |
High |
2.07 GW |
£20k |
£0.05/kWh |
n/a |
High |
Solar
Solar PV capacity increased rapidly in Scotland between 2010 (2MW) and 2016 (326MW) but the pace slowed thereafter, reaching a capacity of 522MW by March 2023[21]. Solar energy holds much potential as a renewable energy source for on-farm agricultural operations (Gorjian et al., 2021). In Scotland, solar energy has been utilised in a variety of ways, including the use of solar PV to power on-farm cold stores for potatoes and providing electrical supply to remote farm buildings (Muneer & Dowell, 2022).
Throughout the literature it is noted that solar is a popular renewable technology within the poultry industry (Sutherland et al., 2017). An example of this is a farm in eastern Scotland producing 215,000 Ross broilers, which uses solar energy to power the ventilation systems and move feed in their seven shed production system[22]. Further examples include the establishment of solar panels within fields typically used for pasture and silage production, such a set up allows for livestock to continue grazing within these fields[23].
In some instances, solar installations may occupy land better suited for agricultural production. A potential opportunity to combine low-carbon energy production and agricultural production simultaneously is agrophotovoltaics (APV), or agrovoltaic energy. APV systems consist of solar panels integrated within productive agricultural land. In arable applications of APVs, the APVs protect the crops against the sun’s heat and reduce evapotranspiration in the soil. In pastoral systems the APVs provide shade for livestock in hot weather. This option may be more suitable to warmer climates, but with a changing climate it is important to consider the range of climate smart agricultural adaptation measures that can be deployed on farms. Such systems are predicted to increase land values and productivity for producers by 35-73% (Rahman et al., 2022).
There is additional potential for the development of solar powered vehicle charging and electrical storage. Rooftop and ground-mounted solar chargers have been on the market for well over a decade[24]. Currently, charging points largely exist within private and public settings for electric vehicles. Over the next four years, the Scottish Government is providing £28 million for the manufacturing and deployment of zero emission, heavy duty vehicles[25]. A more niche market of ‘solar carports’ for on-farm vehicle charging is slowly developing in the UK. However, more research is required on its applicability for agricultural vehicles, particularly for energy storage and charging technology (Ghobadpour et al., 2022).
Wind
In Scotland, onshore wind forms the largest single technology provider of renewable energy. Significant advances in research and the development of wind energy have increased production over the last 20 years. In 2022, wind was responsible for generating a total output of 21,975 GWh, accounting for 62% of all renewable electricity generation in the country[26].
The introduction of renewable obligation certificates (ROCs) in 2002, led to an increase in the economic viability of wind energy generation for large-scale projects (more than 5MW) on farms (Sutherland et al., 2015). ROCs formed part of the domestic energy and climate change policy, implemented to encourage investment in renewable electricity generation. Feed-in-tariffs (FIT) were later introduced in 2010 by the UK government in favour of small to medium-scale projects (less than 5MW) with both ROCs and FIT guaranteeing electricity prices, thus further contributing to the uptake of wind turbines. However, the literature identifies that the reductions in feed-in-tariff payments (due to rapid uptake in recent years) led to much uncertainty amongst farmers wanting to invest in renewables (Sutherland et al., 2015). It is hoped that this has been negated by the introduction of both Contracts for Difference (CfDs) and the Smart Export Guarantee (SEG) scheme.
CfDs were implemented as the government’s main scheme for supporting large-scale, low carbon renewable generation. CfDs aim to incentivise developers to invest in renewable energy by protecting against volatile wholesale prices, whilst also protecting consumers against rising electricity prices[27]. The SEG scheme came into effect in January 2020. This is a government-initiated tariff for businesses and homes who have installed small-scale renewable or low carbon technology which enables them to receive payments from electricity suppliers for surplus electricity exported to the electricity distribution network[28].
Wind energy presents farmers with the opportunity to lease out land to energy producers on an annual basis or alternatively to produce energy and sell back to the electricity market any surplus energy that is not used directly on the farm (Albanito et al., 2022). Commercial wind farms can be found extensively throughout Scotland and work well in remote locations due to windy weather conditions. Large concentrations of turbines tend to be found towards northern latitudes and the uplands (Shepherd et al., 2021). Agricultural holdings characterised by large areas of crop and fallow land, mixed agricultural land, improved grassland, livestock grazing, and other areas of low agricultural value are well suited (Ge et al., 2017). The appropriate siting of wind farms is crucial. Care needs to be taken that wind turbines are not situated on pristine and deep peatlands. The disturbance during construction releasing large quantities of CO2 from peaty soils, negating the effect of reducing overall emissions[29].
Small-scale wind power offers numerous opportunities within off-grid use in agriculture. In more rural areas where electricity distribution network connectivity is lacking or too expensive, the use of small-scale (5 to 50kW) and stand-alone turbines have become increasingly important [30]. Small wind turbines can be used in a similar way to photovoltaics, for example:
- to charge on-farm batteries
- for the heating or pumping of water
- electric fencing for livestock
- lighting and
- functioning of small electronic systems[31].
Wind power remains a popular option for renewable energy production for both wider consumption and local use given its reliability, low maintenance costs and design lifetime. Throughout the literature there remains much debate over the competition for use of land in agriculture, both in terms of function (food versus fuel), as well as control (farmer versus corporation). This is discussed in greater detail in section 5.4. The use of pastoral land or marginal land negates the loss of crop area and reduces the risk of farm machinery damaging wind turbines. Furthermore, given that livestock are capable of grazing underneath these turbines, producers can continue to graze land with limited land area lost to turbines, substations, and access infrastructure (Shepherd et al., 2021).
The effectiveness of this technology ultimately depends on the average wind speed and the need for energy storage mechanisms (Ghobadpour et al., 2022).
Bioenergy
Bioenergy refers to use of organic material to produce electricity or heat or to make fuels. Bioenergy can come in various forms, including solid biomass, biogas or liquid biofuels. In the context of Scottish agriculture, many farms have adopted solid biomass boilers which burn virgin wood chips, pellets, or logs to heat poultry sheds, farm buildings or workshops, on-farm residential buildings, and greenhouses, and to dry grain, for example.
Alternatively, biogas (a mixture of methane and carbon dioxide) can be produced from agricultural residues such as animal manure, crops, and crop residues via anaerobic digestion (AD). The resulting biogas can be combusted in a boiler or in a CHP engine. According to the National Farmers Union (NFU), farms host over half of the Great Britain’s AD capacity[32].
Both solid biomass and AD have been supported by the Non-Domestic Renewable Heat Incentive (RHI) which was effective since 2011 but closed to new applicants in 2021. According to Non-Domestic RHI statistics[33] which represents installations across Great Britain, more than 30% of RHI capacity is in the agricultural sector (the sector with the greatest uptake of the scheme). Across the full duration of the scheme, solid biomass boilers account for 77% of all applications. However, in recent years the share of biomass boiler applications has reduced. In 2022, 58% of applications were solid biomass with heat pumps forming the second highest share at 39%.
The UK Government’s Green Gas Support Scheme (GGSS) launched in late 2021 to support AD sites who upgrade biogas to biomethane and inject this to the gas grid. Farmers can utilise this opportunity by selling their feedstocks to a biomethane plant. Some farms which are located on the gas grid may wish to inject biomethane directly into the grid themselves. An updated UK Biomass Strategy[34] was published in August 2023, which outlines a priority use framework for the best uses of sustainable bioenergy across the UK. Meanwhile, the Scottish Government planned to release a Bioenergy Action Plan in 2023[35] to take account of decisions that are devolved to the Scottish Government.
Projections of bioenergy demand across sectors in Scotland were carried out in 2022 by Ricardo on behalf of CXC[36]. In agriculture, the demand for bioenergy is expected to grow from 0.8 TWh in 2020 to 3.3 TWh by 2030 predominantly due to an increased demand for biomethane from AD. For modelling purposes however, the report assumes that by 2045 agricultural bioenergy demand will drop to zero since electricity generation via Bioenergy with Carbon Capture and Storage (BECCS) as a negative emissions technology is expected to dominate bioenergy demand in Scotland.
Heat Pumps (Air-Source and Ground-Source)
Heat pumps are an alternative low carbon heating solution relevant to agriculture in Scotland. Energy is extracted from the air, ground or water and delivered to a building as heat using electricity to run its components, primarily a compressor. Heat pumps are more efficient than combustion boilers or electric boilers. However, the efficiency can vary across the heating season and across different building use cases. In Scotland, the Heat in Buildings Strategy sets out a vision to improve heat in buildings and various actions being deployed in the building sector to reduce GHG emissions and support economic opportunities, as well as alleviate fuel poverty[37].
There is an absence of literature discussing the potential of heat pumps in the Scottish agricultural sector. However, it is well-documented from UK case studies that heat pumps can be used to serve agricultural processes. For example, a 6.2 MW Ground-Source Heat Pump (GSHP) was installed in 2021 near Berwick-upon-Tweed which performs simultaneous heating and cooling to dry and condition grain respectively[38]. Other use cases include chilling milk at dairy farms, chilling potatoes in cold stores and heating broiler sheds. In the latter, circulation pumps can remove excess heat from the sheds and return to the ground for future heat cycles. GSHPs make sense for farms due to land availability and once the plant has been installed pastureland can recover quickly. A common theme in literature indicates that heat pumps are most financially attractive where there is both a heating a cooling demand due to the heat recovery that exists between heating and cooling loads. Heat pumps offers carbon savings that are not possible via other technologies such as direct electrification since for one unit of electricity consumed by the heat pump, two to four units of heat are supplied[39]. While the case studies highlighted here focus mainly on GSHPs, air source heat pumps (ASHP) are also applicable in an agricultural context.
Hydropower
Hydropower, or hydroelectric power, generates electricity using large volumes of fresh water through the alteration of river watercourses and storage in reservoirs and lochs. It is the controlled release of water through turbines that converts flowing water into electrical energy (MacLeod et al., 2006). Part of this technology includes micro-hydropower systems. These are small to medium sized installations which make use of rivers and fast flowing streams. Installations such as these are more site-specific (from farm to farm or community to community) and can be prone to seasonal variation, for example flooding and drying (Sample et al., 2015).
Hydropower forms an important part of Scotland’s renewable energy supply. As of 2022, the total output was estimated to be 4,866 GWh, accounting for a total of 14% of all renewable energy output in Scotland, with further installations currently under consideration[40]. Existing hydropower sites in Scotland are categorised as either “run-of-river” (RoR) sites and require little to no water storage infrastructure, alternatively “impoundment” schemes involve the construction of large dams.
Hydropower is the second largest onshore renewable technology in terms of capacity and electricity energy generation despite the substantial growth and development of other technologies in recent years[41]. There is potential for new, large-scale hydro with a total of 19MW currently in the pipeline[42]. In terms of Scotland’s agriculture sector, there is further potential for the development of micro-hydropower installations. Micro-hydropower plants are dispersed throughout Scotland as part of on-farm renewable energy projects. Examples of this include: a 20kW hydro system installed in Dumfries and Galloway to power various farm buildings, one of three hydro schemes currently on the farm; and a 190kW system implemented on a 566.5-acre sheep (and fish) farm[43], [44].
Additional considerations for this technology include the effects of seasonal change as well as climate change and the potential increase in competition for future water resources. Increased demand for irrigation in agriculture during the dry summer months may result in reduced energy generation. Meanwhile, further intensification of the hydrological cycle due to climate change leads to a change in both size and seasonality of water flows (Sample et al., 2015).
Hydrogen
There is little literature discussing the role of hydrogen to decarbonise agriculture in Scotland. Scotland has committed to the ambition of at least 5GW installed renewable and low carbon hydrogen production capacity by 2030 and 25GW by 2045 via the Hydrogen Action Plan[45]. The Plan further denotes that hydrogen has a role to play in rural and island communities as well as in cities and industrial clusters. Hydrogen is most likely to be used in sectors where there are few other decarbonisation options; most notably in heavy duty transport or non-road mobile machinery (NRMM), as well as high temperature process industries. In agriculture, there will be vehicles that may benefit from either hydrogen combustion propulsion because they are too big to electrify (such as combine harvesters), or, hydrogen can be used with fuel cells and act as range extenders to provide an extra boost to EVs during times such as harvest.
Farms in Scotland that have on-site renewable power generation assets such as wind or solar that experience high levels of curtailment could be in a position to produce hydrogen on-site and either use the hydrogen on-site or export to a third party such as an HGV fleet. At present, there are no examples of this in Scotland, though the HydroGlen project is conducting a feasibility study into green hydrogen for transport applications in an agricultural setting[46].
Potential benefits from an emerging second-hand market in renewables
The literature review found little information on the current potential to benefit from an emerging second hand market in renewables and related components. It is evident that there is an existing second-hand market for refurnished/remanufactured wind turbines and parts for wind and solar in Scotland which provides an opportunity for farmers to uptake these technologies at a lower cost. The search found a number of commercial companies are acting in this area and can help with the entire process, from early project development and feasibility studies, through to installation, grid connection, commissioning, through to operation and maintenance. However, there may be limitations on the reach of these companies, it is informally reported that access to individuals with the skills to support maintenance can be a significant barrier for farmers in Scotland. The skills gap if addressed may also provide a local employment opportunity.
Land use implications for low carbon energy production
The REA identified several topics regarding land use where differing views are presented and subject to active debate.
Competing demands for land
In Scotland (and globally), there are concerns regarding competing demands for land in the name of food or energy security[47]. This discussion has gained traction in recent years. Namely, the energy and agricultural regimes compete for use of agricultural land, both functionally (food vs. fuel) and in terms of control (farmer vs. corporations). This debate is typically centred around bioenergy crop production, but also includes the installation of solar panels, large wind turbines, processing plants, or any large installation that may take agricultural land out of production.
Scotland has the potential for bioenergy to produce approximately 13 TWh per year[48], which could make a notable contribution to Scotland’s renewable energy needs and targets. Some (3 TWh per annum by 2045) of this contribution is assumed to come from short rotation coppice (SRC) energy crops, such as willow. While SRC energy crops may aid in meeting short‐term needs over the transition towards low carbon energy supply there is debate over whether using land for bioenergy demand is appropriate when the same land can be used for food production[49]. It should be noted that energy crops may not need to be grown on the most productive land. There is also a debate as to whether land that cannot be used for agriculture, such as severely degraded or and marginal lands may be more appropriate for solar PV farms, for example (Child et al., 2019).
Changing land uses from food production to fuel production in Scotland will have direct impacts on biodiversity, wildlife, and landscape connectivity – either positive or negative. It is important to have the appropriate bioenergy crops in the right place to support the protection of biodiversity and ecosystems and preventing unnecessary ecosystem damage[50]. The type of land use change will affect the severity and extent of impacts. Aside from these more visible impacts, there are impacts related to opportunity costs for the agricultural sector itself, and from ecosystem services and carbon sequestration. There are significant opportunity costs from taking agriculturally productive land out of production for the use of renewable energy installations or bioenergy crop production.
Competing demands for land extend beyond fuel production. While out of scope of this report, it is important to consider other demands for land in Scotland that will continue to impact both food and fuel production alike – simultaneously or individually. These may include:
- Housing and urban developments.
- Forestry areas to meet Scotland’s afforestation targets.
- Peatland areas protected for carbon sequestration potential and/or private upland areas under moorland management; and
- Protected areas and areas of outstanding natural beauty and heritage.
Farm location and electricity distribution network accessibility
A study exploring the possibilities for farmers in Wales to diversify into sustainable energy found that an isolated farm location poses a threat to the viability of a farm to generate income from renewables. In addition to this, niche farm locations, such as farms located in national parks or scenic areas, can be accompanied with planning restrictions and regulations which hinders the viability and accessibility of introducing renewable energy technology on farm as technological developments are less likely to be granted (McKenna et al., 2022). Electricity distribution network capacity and accessibility has the potential to limit the farmers ability to export to the network. This was reiterated by a respondent in the study who confirmed there was “stiff opposition to wind turbines and solar panels and the connection to the grid was insufficient” (Morris and Bowen 2020).
A study researching the status of the energy systems of Scottish islands found that across all islands there is a restriction to connecting additional renewable generation and a recognition that supply and demand of power is crucial. Due to the remote locations these islands are often at the end of the network, therefore considerable investment if required to increase export capacity. To manage this, the need for any additional energy supply, must be justified with evidence of additional demand. This reduces the feasibility of technology in the remote areas of Scotland including the islands.[51] However, the situation is improving, Shetland will have a new transmission connection live in 2024 and Orkney and the Western Isles have had their new connection approved.
In the ‘Renewable energy in Scotland Fourth Report of Session 2021-22’ report, the Head of System Planning, Scottish and Southern Electricity Networks noted: “until we get a certain level of certainty about projects going ahead, we are not able to make a robust investment case in the electricity distribution network”. Whereas, Chief Executive Officer, EDF Renewables commented that there should be better preparation for investment in the electricity distribution network: “More can be done to anticipate the investment needed to support renewable projects”. The seriousness of electricity distribution network accessibility was highlighted when the Scottish Affairs Committee called for OFGEM to consider the long-term impacts on net zero targets by completing a review of the grid in Scotland as a matter of urgency and to prioritise reinforcement of the grid where there is potential for a high renewable energy yield.[52]
In response to the recent changes in power generation and with an increasing number of more small-scale producers generating their own power, the Office of Gas and Electricity Markets (Ofgem) introduced the Access and Forward-Looking Charges Significant Code Review (Access SCR) in 2018.[53]
The Access SCR aims to promote the efficient and flexible use of the electricity network meeting both the users’ needs and allowing new, low carbon technologies to benefit consumers while also avoiding unnecessary high energy costs. The SCR primarily sets out how different parties access the grid network as well as the related costs involved.
In 2023 a final decision was published providing changes that reduce upfront costs for producers when connecting to the distribution network, strengthening existing protections for energy consumers while also enhancing the choice of “access rights” each customer has to the network. Such reforms will make future grid connections more accessible and feasible for energy generators, which includes farmers.
Tenure
Tenure directly impacts on the feasibility of introducing non-carbon technology on farm. It is an important factor in farm diversification as any restrictions set out in land/tenancy agreements will limit possibilities. In addition to this, long term investments are not deemed feasible for short term tenancies (Sutherland et al., 2016). Similarly, issues relating to crofting law and developments on crofting land poses as an accessibility issue for crofters. Statutory provisions can be complex and, in terms of developing renewable projects, more work may be required to comply with crofting legislation[54].
Land availability
Land availability will impact the viability of Scotland being able to decarbonise the agricultural sector. Renewable energy projects tend to require large amounts of space to sufficiently capture enough energy to be viable (Bergmann et al., 2006). Moreover, the viability of introducing technology on farm must consider land availability and suitability. Shepherd et al., 2021 found an initial 4.38M ha of land was available in Scotland for onshore wind turbine. This 4.38M ha refers to area which has been identified as well suited for development as it is already well provisioned with high voltage power infrastructure and, in general, encompasses Scotland’s existing turbine sites. However, when land suitability (e.g., ‘arable and horticulture’ and ‘rough grassland’) and soil types were considered the available area reduced from 4.38 million ha to 3.83 million ha.
Other barriers identified in the literature
Cost and investment
Whilst investing in renewable energy is well known to reduce operating costs on farm (Morris and Bowen 2020), the initial cost of the investment required for some technologies can be a barrier to uptake. This barrier extends to other forms of low carbon technology such as RAS (robotics & autonomous systems) as UK and Scottish studies, state that RAS is accompanied with high investment costs which are likely to be prohibitive to smaller farms (Herr et al., 2020 ; Reid and Wainwright., 2018).
Although renewable energy has been produced on farms for a long time, economics are still considered an issue (Spackman, P., 2016). Financial consideration must be given beyond the initial investment of technology, for example farmers may be subject to building, infrastructure, planning and consultancy costs as well as labour, maintenance, and other recurring costs. (MacLeod at al., 2016). Nonetheless, in a case study looking at a biomass grain dryer, a Scottish farmer stated, “We’re saving 6p/kWh, getting RHI payments amounting to almost £8,500 a year and expect a payback in two to three years.”[55] This positive financial outlook is reiterated by papers such as Rahman et al., 2022 who details, whilst still high, the cost of wind turbines are reducing as well as articles stating technology, such as solar panels, are continuing to fall in price in Scotland[56]. Nevertheless, costs remain an issue in terms of accessibility and viability as uptake of technology is negatively affected by high capital costs and/or lack of financial capital to cover long term investments and high financial risk (Acosta-Silva et al., 2019; Baker et al., 2022; Morris and Bowen., 2020).
Availability of cash to invest upfront is essential to establish new renewable and bioenergy projects. As the RHI ended in the spring of 2022, options to displace current energy costs are critical as without this, margins can be unattractive for investing. There is currently much uncertainty for farmers as withdrawal from the European Union, will mean a change in agricultural policy and support structures. This uncertainty may result in a reluctance to make investments at the current time, though equally there may be others who see renewable energy as a diversification opportunity giving longer term income benefits[57].
Public perception
Public perception towards the introduction of renewable energy on farm is a currently under debate. Some of the key drivers for introducing circular economy into the agri-food supply chain include environmental benefits (67%), policy and economy[58] (47%) and financial and economic benefits (43%) (Mehmood et al., 2021).
It is recognised throughout literature that introducing renewable energy on farm improves many aspects; the business’s carbon footprint, self-sufficiency, financial savings, sales of generated power and enhances socio technical values such as brand image (Jones et al., 2020; Spackman, 2014; Yousefzadeh et al., 2023) all of which drives a positive public opinion.
Many studies investigate the drivers and barriers influencing farmers’ adoption of renewable energy technologies. Studies found that younger farmers, and farmers that had progressed further in education had a more positive outlook on renewable energy and are therefore more likely to adopt these technologies (Ge et al., 2017). Nonetheless, some farmers have expressed a negative identity-based paradigm, considering the change of land use away from crop production to incorporate renewable energy e.g., solar panels to no longer being farming (Moore et al., 2022).
Public opinion varies and can negatively impact upon uptake of non-carbon technology on farm. Research shows that the most supported renewable energy source is solar, whilst, onshore wind farms are favoured by a smaller majority than most other forms of renewable energy.[59] Concerns regarding wind power largely focus on the visual impact on a landscape, production of ‘unwanted’ noise (Rahman et al., 2022) and environmental impact in terms of land use change and degradation of peatland for turbine and road access construction (Shepherd, A. et al., 2021). Moreover, in the 2010s, whilst there was an increase in planning permission applications to introduce wind turbines in Aberdeenshire, it was public concern that led to a high proportion of these turbine applications being rejected. (Sutherland et al., 2015).
Complex renewable technology such as technology related to biomass has been found to be associated with uncertainty, whereas negative public opinion relating to other technologies such as solar focused on cost and feasibility (Demski, 2011). On the positive side, research shows that those living in the Highlands and Islands and those living in closer proximity to renewable energy installations have a more favourable attitude towards these developments.
On farm renewable potential to meet energy needs
Within Scotland, there is great potential for farm businesses increase uptake of low carbon technologies. This section provides analyses of the strengths and weaknesses of these technologies, factors supporting or hindering uptake, and a discussion on how excess renewable energy production on farm can be marketed to other sectors in Scotland.
SWOT analysis of on farm energy generation
The SWOT analysis assessed the current potential for on-farm energy generation in Scotland, looking at strengths, weaknesses, opportunities, and threats (SWOT) to provide a simplified picture and more clarity of where action is needed. These technologies are applicable across different agricultural sectors and contexts, although some are more suited to specific sectoral needs and requirements. For example, hydrogen currently has explicit uses; being a nascent technology for farming, its current strengths are contained to levels of innovation and specific applicability within the sector. There are extended SWOT tables of individual technologies with further detail in Appendix C. The SWOT tables below are grouped according to the following categorisations:
- Solar PV, onshore wind, and hydropower are energy generation opportunities on farm, which support current and future energy demand, and provide alternative income streams;
- Electric vehicles (EVs) and heat pumps provide alternatives to fossil fuels via electrification;
- Hydrogen is a future fuel as it is a nascent technology for farming with specific applications; and
- Bioenergy covers multiple different solutions, from biomethane to wood chip; these all have specific land use implications.
The SWOT analysis shows the interactions between the technologies identified here. A weakness seen in most technologies was the high capital expenditure (CAPEX), despite many having low operating expenditure (OPEX). Farmers may struggle to pay for high initial investment costs without support, and the land use or landscape implications of certain technologies is often a dissuading factor. However, government support schemes provide an opportunity to promote uptake across the sector.
There was little evidence to show that specific technologies did not have a role, although hydropower has less potential to others due to its significant impact on land, rivers, and aquatic ecology as well as location requirements, so its application is very context specific.
There are numerous opportunities to expanding on existing technologies with novel applications, such as hydrogen powered vehicles, and hybrid wind-solar systems to enhance reliability.
Table 7: SWOT table covering the themes presented across solar PV, onshore wind, and hydropower generation technologies as alternative electricity sources. The strengths, weaknesses, opportunities, and threats are applicable to all technologies noted in the table heading, unless stated otherwise.
|
Strengths |
Weaknesses |
|
|
|
Opportunities |
Threats |
|
|
Table 8: SWOT table covering the themes presented across heat pump and electric vehicle (EV) technologies as alternative electricity users.
|
Strengths |
Weaknesses |
|
|
|
Opportunities |
Threats |
|
|
Table 9: Analysis of hydrogen energy generation and use in agriculture. The strengths, weaknesses, opportunities and threats are applicable to all technologies noted in the table heading, unless stated otherwise in the table.
|
Strengths |
Weaknesses |
|
|
|
Opportunities |
Threats |
|
|
Table 10: Analysis of bioenergy generation and use in agriculture.
|
Strengths |
Weaknesses |
|
Various types of bioenergy can be used to replace fossil fuels. Solid Biomass
AD/Biogas/Biomethane
Liquid biofuels e.g., biodiesel and bioethanol
|
Solid Biomass
AD/Biogas/Biomethane
Liquid biofuels e.g., biodiesel and bioethanol
|
|
Opportunities |
Threats |
|
Solid Biomass
AD/Biogas/Biomethane
|
|
PESTLE analysis of potential to decarbonise on farm energy use.
Renewable energy technologies are subject to a range of enabling and preventative factors. A political, economic, social, technical, legal and environmental (PESTLE) analysis was therefore undertaken to assess the potential to support on-farm renewable energy generation and the decarbonisation of agricultural energy use in Scotland. This assessment was produced following the SWOT analysis to incorporate the strengths and opportunities of each renewable energy technology (and more generally) identified in the SWOT.
Table 11: Political analysis of enabling and preventative factors for on-farm low-carbon energy generation and agricultural energy use decarbonisation
|
Enabling factors |
Preventative factors |
|---|---|
|
|
Table 12: Economic analysis of enabling and preventative factors for on-farm low-carbon energy generation and agricultural energy use decarbonisation
|
Enabling factors |
Preventative factors |
|
|
Table 13: Social analysis of enabling and preventative factors for on-farm low-carbon energy generation and agricultural energy use decarbonisation
|
Enabling factors |
Preventative factors |
|
|
Table 14: Technical analysis of enabling and preventative factors for on-farm low-carbon energy generation and agricultural energy use decarbonisation
|
Enabling factors |
Preventative factors |
|---|---|
|
|
Table 15: Legal analysis of enabling and preventative factors for on-farm low-carbon energy generation and agricultural energy use decarbonisation
|
Enabling factors |
Preventative factors |
|
|
Table 16: Environmental analysis of enabling and preventative factors for on-farm low-carbon energy generation and agricultural energy use decarbonisation
|
Enabling factors |
Preventative factors |
|---|---|
|
|
Analysis of wider decarbonisation for the energy system
While the decarbonisation of energy generation can reduce carbon dioxide emissions on farm, there is great potential for agriculture-based energy generation to support the decarbonisation of the wider energy system in Scotland. Farms which generate renewable energy can use it to meet their own energy needs, displace fossil fuels, and reduce their costs and carbon footprint. Adding energy storage and new technologies to use the energy they generate gives farmers more control over energy costs and essentially forms an on-farm energy system. These energy systems can provide wider benefits such as:
- Providing renewable energy to the electricity distribution network and reducing reliance on fossil fuels or on importing energy from elsewhere;
- Reducing the need for electricity distribution network upgrades by generating, storing and using energy at farm level as opposed to relying on the electricity distribution network to supply it. This is particularly important for high power demands such as rapid charging of EVs, HGVs or mobile machinery.
- Using these systems to meet some high-power energy demands such as EV charging for farm workers, suppliers or local communities. This would reduce the reliance on the electricity distribution network to meet these demands in rural areas and could reduce costs.
- In the future, it would be technically feasible for agriculture sites with suitable systems and access to host EV charging for use by third parties, possibly including future charging of HGVs.
The benefits are particularly pronounced in areas where the electricity network is either highly constrained or for farms not connected to the electricity distribution network, such as some islands or remote communities where community access to energy relies on microgrids. The agriculture sector is a large part of the local economy, so widespread on farm uptake of low carbon energy systems could have a significant effect.
Electricity and gas grid exports
Farms which generate, store, and consume energy may be able to import and store energy at times of low demand or export energy at times of high consumption. There will be limitations on the capacity of individual network connections, and the potential benefit to distribution networks will vary. However, sites which generate, store, and consume electricity could have a role in balancing distribution networks by providing flexibility. The nature of renewable energy means that production is not always consistent with demand, especially for those technologies that rely on natural resources such as wind and solar energy. Onshore wind is the largest single provider of renewable electricity in Scotland, and Scotland maintains the largest proportion of onshore turbines in the UK, with 8.8GW of onshore wind capacity that accounts for over 60% of the UK’s total onshore wind capacity as of 2021[64]. Wind production in Scotland on farms, particularly in areas of high altitude and latitude, provides excellent opportunities to deliver excess energy to the electricity distribution network whilst also meeting on farm energy needs.
Additionally, in the UK, the Smart Export Guarantee (SEG) enables an additional income stream for farmers, while supporting electricity distribution network decarbonisation. If a farm has a solar PV system and generates more power than is required onsite, the surplus will be put onto the electricity distribution network. Under the SEG, electricity suppliers offer payment for each unit of power that is exported to the electricity distribution network. It should be noted that some energy vectors are easier to sell to the gas and electricity distribution network operator; solar electricity is noted as being easier to produce and sell to the electricity distribution network compared to biomethane to the gas grid as additional technology is required to upgrade the biogas to biomethane which must meet stringent quality and calorific value requirements which are imposed by the gas distribution network operator (Rikkonen et al., 2019). Obton (2021) notes that an area of 100-acre covered in solar panels can generate 40 MW of electricity, which is enough to provide power to 10,000 UK households.
Further, newer fuels such as hydrogen have the potential to contribute to electricity distribution network exports and support national demand. Through electrolysis, green hydrogen can be produced during off-peak periods or times when there is excess renewable electricity, instead of curtailing it as it is commonly done. An important consideration is the network connection, some parts of the grid are constrained, depending on the location, and it can be more difficult to get a grid connection in these places. This is exacerbated by the rural nature of some farms in Scotland. There may be potential opportunity for farmers to support wider electricity distribution network decarbonisation through generating and supplying hydrogen to local authorities, or companies running fleets of fuel-cell vehicles; however, this may not be a widespread phenomenon and depends on individual farm’s willingness to enter into such agreements. With electricity distribution network connection presenting a significant barrier for so many in rural areas, there may be other opportunities to sell energy to a neighbouring site by installing a private wire between two properties. There are regulations which need to be strictly complied with and the viability of this depends upon the individual sites.
Electricity distribution networks remain a critical component to enable energy ambitions in Scotland to be delivered. This is an issue that is specifically restrictive for farmers, crofters, and landowners in their role in the energy transition[65]. Heat map data published by the Distribution Network Operators on distribution network capacity shows that there are many areas in Scotland which are at or near their capacity limits meaning that new renewable installations looking to export their surplus energy will likely need to wait until network upgrades take place [66]. This can be between £2,000 and £65,000 or more, depending on the number of connections and connection type and energy requirements[67]. This further reduced accessibility to the electricity distribution network and can be a preventative factor for farmers. The Scottish Affairs Committee stated that electricity distribution network connection requires urgent review and investment to ensure net-zero targets can be met through renewable energy generation[68].
Bioenergy production
Bioenergy technologies have the potential to supply a low-carbon source of energy to the agriculture sector and more widely. For example, anaerobic digestion (AD) systems which produce biogas could be important to smart sustainable rural energy infrastructure. Farms could provide feedstocks such as crop residues or slurry and local industry could supply food waste. The biogas could be used on farms, to generate electricity or heat, or it could be upgraded to biomethane for use in the gas network or for fuel for farm vehicles or HGVs. In turn, the AD digestate by-product can be used as a fertiliser in crop production, supporting the Scottish Government’s mission to support a circular economy (Blades et al., 2017). Benefits of biogas:
- Biogas can be used like natural gas to directly heat facilities on site and produce electricity via Combined Heat and Power (CHP). The electricity produced by CHP can be used on site or exported to the electricity distribution network (Auer et al., 2017). Alternatively, biogas can be further purified to biomethane and used to replace natural gas as a fuel for transportation vehicles.
- Power generation from bioresources is less reliant on climatic conditions than wind turbines and solar PV. Consequently, the export of electricity produced (from biogas CHP) could be of more benefit to the electricity network than other renewable sources of electricity by continuing to generate electricity at times when other renewables are not producing (Sutherland et al., 2015).
- In addition to harnessing the production of biogas generated from AD plants, or electricity from CHP, there are a stream of potential bioresources produced such as fertiliser, chemicals, gases, and bioplastics which may provide sustainable alternatives to petroleum-based products, both in the agricultural sector and beyond (Reynolds et al., 2022).
- Food processors, distilleries, and supermarkets can send their waste to AD plants as a feedstock and get recompensed in zero-carbon fuel to run HGVs. During the upgrading process from biogas to biomethane, it is possible to capture CO2 which can lead to the overall technology being deemed as a Negative Emission Technology (NET).
- Biomethane for AD plants and CHP has lots of potential for specific agriculture sectors, such as dairy farms by using manures, slurries and food wastes or by-products such as whey.
While there is significant potential, the financial investment and space required mean that AD and biogas production is not usually suitable for small-scale farms, and this is an important limitation to be aware. In addition, injecting biomethane into the gas network is highly regulated by the network operator and requires a legal agreement; specialist equipment as well as a site with a suitable location.
Conclusions
The research identifies a wide range of low-carbon technologies available for use on farm. We have identified the strengths and weaknesses of each, and explored their suitability to different situations. Overall, the report identifies the range of technologies available to meet the diversity of on-farm needs for energy use, generation and energy efficiency as a strength for the sector. However, high investment costs coupled with a lack of access to capital are barriers to the uptake of on-site generation using alternative technologies. Poor electricity distribution network access is a barrier to exporting energy generated on site. Regarding costs, the current economic environment is especially challenging for farmers. Many will hesitate to make large investments, whilst dealing with the additional costs to their business caused by the cost of living crisis, and the volatility in both input costs and output values caused by global issues such as the war in Ukraine. In addition to this there is some uncertainty over how future agricultural payments will be structured beyond 2027. The PESTLE table provides more detail of the enabling and preventative factors that can impact uptake of low-carbon technologies on farm.
The baseline mapping for current energy use on farms and crofts in Scotland from the National Atmospheric Emissions Inventory (NAEI) shows that energy, gas and other fuel use varies greatly across regions in Scotland, depending on the predominant agricultural sector. Livestock sector energy emissions are concentrated to the southwest and north, and arable sector energy emissions are largely from the northeast. Beef is the agricultural sector with the highest overall energy emissions, producing over 100kt CO2e more than the dairy sector (the second largest). Spring barley was the crop with the highest energy emissions in the arable sector, producing more energy related emissions than some livestock sectors.
The mapping of the baseline emissions indicated that targeting processes that currently rely on other fuels would be the most effective way to reduce agricultural emissions. This may be through identifying opportunities to improve the efficiency of these operations or technologies that enable the electrification of processes that previously relied on fossil fuels. Decarbonisation will be further optimised if the electricity used is generated through renewables.
Furthermore, it is evident from the data that livestock ‘other energy’ emissions are a substantial contributor to the overall energy use emissions from agriculture in Scotland. Efforts to reduce this through efficiency measures or fuel switching will have a significant impact.
There were various limitations to the baseline energy emissions mapping, including a lack of data on the predominant fuel type by sector, a lack of publicly available data on current energy consumption, and a lack of detailed data on disaggregated sectors. To overcome these constraints, more detailed and up-to-date data needs to be gathered. This report has not sought to quantify the GHG reduction potential of decarbonising energy use on farm.
It is evident that farm bioenergy production has the potential to supply Scotland with a low-carbon source of energy for use across the country; however, the land use change required has wider implications on the environment, biodiversity and economics at the farm level and is a topic of debate amongst farmers and the wider public.
Looking to the future, there is a major opportunity for low-carbon electricity and gas generated on farms to be exported to the grid to support grid decarbonisation. To achieve this, there are significant issues regarding electricity distribution network access which need to be overcome.
In the correct enabling environment, it is evident that farms can play a significant role in supporting Scotland’s Net Zero targets and just transition and circular economy aims.
References
Acosta-Silva, Y.D.J., Torres-Pacheco, I., Matsumoto, Y., Toledano-Ayala, M., Soto-Zarazúa, G.M., Zelaya-Ángel, O. and Méndez-López, A., 2019. Applications of solar and wind renewable energy in agriculture: A review. Science Progress, 102(2), pp.127-140.
Albanito, F., Roberts, S., Shepherd, A. and Hastings, A., 2022. Quantifying the land-based opportunity carbon costs of onshore wind farms. Journal of Cleaner Production, 363, p.132480.
Auer, A., Vande Burgt, N.H., Abram, F., Barry, G., Fenton, O., Markey, B.K., Nolan, S., Richards, K., Bolton, D., De Waal, T. and Gordon, S.V., 2017. Agricultural anaerobic digestion power plants in Ireland and Germany: Policy and practice. Journal of the Science of Food and Agriculture, 97(3), pp.719-723.
Baker, P., James, N., Myerscough, R. and Conquest, A., 2022. Decarbonisation of mobile agricultural machinery in Scotland – an evidence review.
Bergmann, A., Hanley, N. and Wright, R., 2006. Valuing the attributes of renewable energy investments. Energy policy, 34(9), pp.1004-1014.
Blades, L., Morgan, K., Douglas, R., Glover, S., De Rosa, M., Cromie, T. and Smyth, B., 2017. Circular biogas-based economy in a rural agricultural setting. Energy procedia, 123, pp.89-96.
Child, M., Ilonen, R., Vavilov, M., Kolehmainen, M. and Breyer, C., 2019. Scenarios for sustainable energy in Scotland. Wind Energy, 22(5), pp.666-684.
Demski, C., 2011. Public perceptions of renewable energy technologies: challenging the notion of widespread support (Doctoral dissertation, Cardiff University).
Duckett, T., Pearson, S., Blackmore, S., Grieve, B., Chen, W.H., Cielniak, G., Cleaversmith, J., Dai, J., Davis, S., Fox, C. and From, P., 2018. Agricultural robotics: the future of robotic agriculture. arXiv preprint arXiv:1806.06762.
Feliciano, D., Slee, B. and Smith, P., 2014. The potential uptake of domestic woodfuel heating systems and its contribution to tackling climate change: A case study from the North East Scotland. Renewable energy, 72, pp.344-353.
Ge, J., Sutherland, L.A., Polhill, J.G., Matthews, K., Miller, D. and Wardell-Johnson, D., 2017. Exploring factors affecting on-farm renewable energy adoption in Scotland using large-scale microdata. Energy Policy, 107, pp.548-560.
Ghobadpour, A., Monsalve, G., Cardenas, A. and Mousazadeh, H., 2022. Off-road electric vehicles and autonomous robots in agricultural sector: trends, challenges, and opportunities. Vehicles, 4(3), pp.843-864.
Gorjian, S., Ebadi, H., Trommsdorff, M., Sharon, H., Demant, M. and Schindele, S., 2021. The advent of modern solar-powered electric agricultural machinery: A solution for sustainable farm operations. Journal of cleaner production, 292, p.126030.
Herr, D., Godel, M., Perkins, R., Pate, L. and Hall, T., 2020. The economic impact of robotics & autonomous systems across UK sectors.
Jones, A., Begley, J., Berkeley, N., Jarvis, D. and Bos, E., 2020. Electric vehicles and rural business: Findings from the Warwickshire rural electric vehicle trial. Journal of Rural Studies, 79, pp.395-408.
Krishna, K.R., 2017. Push button agriculture: Robotics, drones, satellite-guided soil and crop management. CRC Press.
MacLeod, M., Moran, D. and Spencer, I., 2006. Counting the cost of water use in hydroelectric generation in Scotland. Energy policy, 34(15), pp.2048-2059.
MacLeod, M., Rees, B., Watson, C., Thomson, S., Boyd, I. and Bell, J., 2016. Review of options for reducing greenhouse gas emissions via cattle slurry management in Scotland.
McKenna, R., Mulalic, I., Soutar, I., Weinand, J.M., Price, J., Petrović, S. and Mainzer, K., 2022. Exploring trade-offs between landscape impact, land use and resource quality for onshore variable renewable energy: an application to Great Britain. Energy, 250, p.123754.
Mehmood, A., Ahmed, S., Viza, E., Bogush, A. and Ayyub, R.M., 2021. Drivers and barriers towards circular economy in agri‐food supply chain: a review. Business Strategy & Development, 4(4), pp.465-481.
Moore, S., Graff, H., Ouellet, C., Leslie, S. and Olweean, D., 2022. Can we have clean energy and grow our crops too? Solar siting on agricultural land in the United States. Energy Research & Social Science, 91, p.102731.
Morris, W. and Bowen, R., 2020. Renewable energy diversification: Considerations for farm business resilience. Journal of Rural Studies, 80, pp.380-390.
Muneer, T. and Dowell, R., 2022. Potential for renewable energy–assisted harvesting of potatoes in Scotland. International Journal of Low-Carbon Technologies, 17, pp.469-481.
Obton, 2021. Diversify your land and ear a fixed income with solar energy. Farmers Weekly. 20 December 2021.
Pearson, S., Camacho-Villa, T.C., Valluru, R., Gaju, O., Rai, M.C., Gould, I., Brewer, S. and Sklar, E., 2022. Robotics and Autonomous Systems for Net Zero Agriculture. Current Robotics Reports, 3(2), pp.57-64.
Rahman, M.M., Khan, I., Field, D.L., Techato, K. and Alameh, K., 2022. Powering agriculture: Present status, future potential, and challenges of renewable energy applications. Renewable Energy, 188, pp.731-749.
Reid, A. and Wainwright, W., 2018. Climate Change and Agriculture: How Can Scottish Agriculture Contribute to Climate Change Targets.
Reynolds, J., Kennedy, R., Ichapka, M., Agarwal, A., Oke, A., Cox, E., Edwards, C. and Njuguna, J., 2022. An evaluation of feedstocks for sustainable energy and circular economy practices in a small island community. Renewable and sustainable energy reviews, 161, p.112360.
Rikkonen, P., Tapio, P. and Rintamäki, H., 2019. Visions for small-scale renewable energy production on Finnish farms–A Delphi study on the opportunities for new business. Energy Policy, 129, pp.939-948.
Sample, J.E., Duncan, N., Ferguson, M. and Cooksley, S., 2015. Scotland׳ s hydropower: Current capacity, future potential and the possible impacts of climate change. Renewable and Sustainable Energy Reviews, 52, pp.111-122.
Shepherd, A. et al. (2021) ‘Scotland’s onshore wind energy generation, impact on natural capital & satisfying no-nuclear energy policy’, Energy Reports, 7, pp. 7106–7117. doi:10.1016/j.egyr.2021.10.063.
Spackman, P., 2014. Farm energy case study: Small-scale hydro, Dumfries. Farmers Weekly. 25 November 2014
Spackman, P., 2019. Where now for renewable energy on farms? Farmers Weekly. 20 June 2019.
Sutherland, L.A., Peter, S. and Zagata, L., 2015. Conceptualising multi-regime interactions: The role of the agriculture sector in renewable energy transitions. Research Policy, 44(8), pp.1543-1554.
Sutherland, L.A., Peter, S. and Zagata, L., 2015. On-farm renewable energy: a ‘classic case’ of technological transition. In Transition pathways towards sustainability in agriculture: case studies from Europe (pp. 127-141). Wallingford UK: CABI.
Sutherland, L.A., Toma, L., Barnes, A.P., Matthews, K.B. and Hopkins, J., 2016. Agri-environmental diversification: Linking environmental, forestry and renewable energy engagement on Scottish farms. Journal of rural studies, 47, pp.10-20.
Warwick, H.R.I. and Park, N.S., 2007. AC0401: Direct energy use in agriculture: opportunities for reducing fossil fuel inputs. University of Warwick, Warwick.
Yousefzadeh, M., Lenzen, M. and Tariq, M.A., 2023. Cooling and Power from Waste and Agriculture Residue as a Sustainable Strategy for Small Islands—A Case Study of Tonga. Sustainability, 15(1), p.537.
Appendix / Appendices
Appendix A: Methodology to task 1
To establish a baseline of fuel use on Scottish farms and crofts, a literature review was undertaken to provide the typical energy consumed by various agricultural processes. These factors (below) have been applied to the livestock counts and crop areas reported in the agricultural census. This provided an initial indication of fuel use by sector across the agricultural regions.
Fuel consumption factors used.
|
Sector |
Energy Input |
Energy Consumption Value |
Unit |
Reference |
|
Dairy |
Electricity |
910.0 |
kWh/cow |
Warwick HRI, 2007 |
|
Dairy |
Mobile Machinery (petroleum fuels) |
548.7 |
kWh/cow |
Baker et al, 2022 |
|
Beef |
Mobile Machinery |
453.1 |
kWh/cow |
Baker et al, 2022 |
|
Sheep |
Mobile Machinery |
18.9 |
kWh/ewe |
Baker et al, 2022 |
|
Poultry (Layers) |
Electricity |
10.3 |
kWh/bird |
Scot Gov, 2021[69] |
|
Poultry (Layers) |
Other Static |
1.7 |
kWh/bird |
Scot Gov, 2021 |
|
Poultry (Broilers) |
Electricity |
0.7 |
kWh/bird |
Warwick HRI, 2007 |
|
Poultry (Broilers) |
Other Static |
1.1 |
kWh/bird |
Warwick HRI, 2007 |
|
Pig (Female breeder) |
Electricity |
1,402.0 |
kWh/sow |
Warwick HRI, 2007 |
|
Pig (Female breeder) |
Other Static |
155.0 |
kWh/sow |
Warwick HRI, 2007 |
|
Cereals (wheat) |
Electricity |
621.0 |
kWh/ha |
Warwick HRI, 2007 |
|
Cereals (wheat) |
Other Static |
203.0 |
kWh/ha |
Warwick HRI, 2007 |
|
Cereals (wheat) |
Mobile Machinery |
1,078.0 |
kWh/ha |
Baker et al, 2022 |
|
Cereals (winter barley) |
Electricity |
449.0 |
kWh/ha |
Warwick HRI, 2007 |
|
Cereals (winter barley) |
Other Static |
146.0 |
kWh/ha |
Warwick HRI, 2007 |
|
Cereals (winter barley) |
Mobile Machinery |
942.0 |
kWh/ha |
Baker et al, 2022 |
|
Cereals (spring Barley) |
Electricity |
449.0 |
kWh/ha |
Warwick HRI, 2007 |
|
Cereals (spring Barley) |
Other Static |
146.0 |
kWh/ha |
Warwick HRI, 2007 |
|
Cereals (spring Barley) |
Mobile Machinery |
942.0 |
kWh/ha |
Baker et al, 2022 |
|
Oilseed and linseed |
Mobile Machinery |
1,074.0 |
kWh/ha |
Warwick HRI, 2007 |
|
Peas and beans for combining |
Mobile Machinery |
1,074.0 |
kWh/ha |
Warwick HRI, 2007 |
|
Orchard and soft fruit |
Mobile Machinery |
300.0 |
kWh/ha |
Baker et al, 2022 |
|
Potatoes |
Electricity |
4,208.0 |
kWh/ha |
Warwick HRI, 2007 |
|
Potatoes |
Other Static |
85.0 |
kWh/ha |
Warwick HRI, 2007 |
|
Potatoes |
Mobile Machinery |
3,230.0 |
kWh/ha |
Baker et al, 2022 |
The fuel use calculated was not used directly, but rather served as the basis to disaggregate the local authority greenhouse gas statistics[70] (aggregated to agricultural region) into the categories provided in the census (e.g., pigs, potatoes) as this level of detail is not available in the published local authority greenhouse gas data.
Before the sectoral breakdown could be applied, the GHG statistics were split into urban and rural aspects, with the sectoral split only applied to rural areas. This was necessary as within the NAEI and the LA GHG data, some emissions (including agricultural) are distributed based on employment totals. Full details of how employment statistics are used as to estimate fuel use can be found in DESNZ, 2023[71].
Using urban boundaries[72], it was possible to calculate the percentage of these emissions which occurred in a rural area and were therefore more likely to be related to actual agricultural practices. This removed the possibility of counting emissions that may be associated with e.g., a farm shop in a city centre.
Fuel consumption per sector within each agriculture region
The table below shows the fuel consumption used to disaggregate the local authority greenhouse gas rural energy use emissions.
|
Sector |
Agriculture Region |
Electricity (MWh/year) |
Gas (MWh/year) |
Mobile Machinery (MWh/year) |
Other Static (MWh/year) |
|---|---|---|---|---|---|
|
Barley spring |
Argyll and Bute |
659.36 |
0.00 |
1383.33 |
214.40 |
|
Barley spring |
Ayrshire |
2073.75 |
0.00 |
4350.72 |
674.32 |
|
Barley spring |
Clyde Valley |
2021.44 |
0.00 |
4240.98 |
657.31 |
|
Barley spring |
Dumfries and Galloway |
3339.84 |
0.00 |
7006.97 |
1086.01 |
|
Barley spring |
East Central |
2602.45 |
0.00 |
5459.93 |
846.23 |
|
Barley spring |
Fife |
7153.96 |
0.00 |
15008.98 |
2326.23 |
|
Barley spring |
Grampian |
48489.84 |
0.00 |
101731.48 |
15767.30 |
|
Barley spring |
Highland |
9991.19 |
0.00 |
20961.48 |
3248.81 |
|
Barley spring |
Lothian |
5381.58 |
0.00 |
11290.53 |
1749.91 |
|
Barley spring |
Na h-Eileanan Siar | ||||
|
Barley spring |
Orkney |
1682.72 |
0.00 |
3530.33 |
547.16 |
|
Barley spring |
Scotland |
111765.53 |
0.00 |
234483.58 |
36342.47 |
|
Barley spring |
Scottish Borders |
7339.22 |
0.00 |
15397.65 |
2386.47 |
|
Barley spring |
Shetland | ||||
|
Barley spring |
Tayside |
20999.86 |
0.00 |
44057.62 |
6828.46 |
|
Barley winter |
Argyll and Bute |
48.13 |
0.00 |
100.98 |
15.65 |
|
Barley winter |
Ayrshire |
511.10 |
0.00 |
1072.28 |
166.19 |
|
Barley winter |
Clyde Valley |
480.97 |
0.00 |
1009.07 |
156.40 |
|
Barley winter |
Dumfries and Galloway |
1508.73 |
0.00 |
3165.31 |
490.59 |
|
Barley winter |
East Central |
379.63 |
0.00 |
796.46 |
123.44 |
|
Barley winter |
Fife |
1574.33 |
0.00 |
3302.93 |
511.92 |
|
Barley winter |
Grampian |
7149.83 |
0.00 |
15000.31 |
2324.89 |
|
Barley winter |
Highland |
437.01 |
0.00 |
916.85 |
142.10 |
|
Barley winter |
Lothian |
1861.73 |
0.00 |
3905.91 |
605.37 |
|
Barley winter |
Na h-Eileanan Siar |
0.00 |
0.00 |
0.00 |
0.00 |
|
Barley winter |
Orkney |
13.02 |
0.00 |
27.32 |
4.23 |
|
Barley winter |
Scotland |
19417.59 |
0.00 |
40738.01 |
6313.96 |
|
Barley winter |
Scottish Borders |
2930.62 |
0.00 |
6148.43 |
952.94 |
|
Barley winter |
Shetland |
0.00 |
0.00 |
0.00 |
0.00 |
|
Barley winter |
Tayside |
2522.57 |
0.00 |
5292.34 |
820.26 |
|
Beef |
Argyll and Bute |
0.00 |
0.00 |
14160.28 |
0.00 |
|
Beef |
Ayrshire |
0.00 |
0.00 |
31764.12 |
0.00 |
|
Beef |
Clyde Valley |
0.00 |
0.00 |
27276.62 |
0.00 |
|
Beef |
Dumfries and Galloway |
0.00 |
0.00 |
75607.44 |
0.00 |
|
Beef |
East Central |
0.00 |
0.00 |
11258.18 |
0.00 |
|
Beef |
Fife |
0.00 |
0.00 |
13972.24 |
0.00 |
|
Beef |
Grampian |
0.00 |
0.00 |
107399.65 |
0.00 |
|
Beef |
Highland |
0.00 |
0.00 |
34304.65 |
0.00 |
|
Beef |
Lothian |
0.00 |
0.00 |
13264.96 |
0.00 |
|
Beef |
Na h-Eileanan Siar |
0.00 |
0.00 |
1732.20 |
0.00 |
|
Beef |
Orkney |
0.00 |
0.00 |
22196.01 |
0.00 |
|
Beef |
Scotland |
0.00 |
0.00 |
420266.56 |
0.00 |
|
Beef |
Scottish Borders |
0.00 |
0.00 |
37926.74 |
0.00 |
|
Beef |
Shetland |
0.00 |
0.00 |
1262.79 |
0.00 |
|
Beef |
Tayside |
0.00 |
0.00 |
28140.68 |
0.00 |
|
Dairy |
Argyll and Bute |
7790.51 |
0.00 |
4697.42 |
0.00 |
|
Dairy |
Ayrshire |
49305.62 |
0.00 |
29729.66 |
0.00 |
|
Dairy |
Clyde Valley |
25656.54 |
0.00 |
15470.05 |
0.00 |
|
Dairy |
Dumfries and Galloway |
112211.19 |
0.00 |
67659.65 |
0.00 |
|
Dairy |
East Central |
9025.38 |
0.00 |
5442.01 |
0.00 |
|
Dairy |
Fife |
5592.86 |
0.00 |
3372.31 |
0.00 |
|
Dairy |
Grampian |
6191.64 |
0.00 |
3733.35 |
0.00 |
|
Dairy |
Highland |
2851.03 |
0.00 |
1719.08 |
0.00 |
|
Dairy |
Lothian |
3103.10 |
0.00 |
1871.07 |
0.00 |
|
Dairy |
Na h-Eileanan Siar |
19.11 |
0.00 |
11.52 |
0.00 |
|
Dairy |
Orkney |
2334.15 |
0.00 |
1407.42 |
0.00 |
|
Dairy |
Scotland |
235684.54 |
0.00 |
142110.01 |
0.00 |
|
Dairy |
Scottish Borders |
7421.05 |
0.00 |
4474.65 |
0.00 |
|
Dairy |
Shetland |
353.99 |
0.00 |
213.44 |
0.00 |
|
Dairy |
Tayside |
3828.37 |
0.00 |
2308.38 |
0.00 |
|
Oilseed and linseed |
Argyll and Bute |
0.00 |
0.00 |
0.00 |
0.00 |
|
Oilseed and linseed |
Ayrshire | ||||
|
Oilseed and linseed |
Clyde Valley | ||||
|
Oilseed and linseed |
Dumfries and Galloway |
0.00 |
0.00 |
352.59 |
0.00 |
|
Oilseed and linseed |
East Central |
0.00 |
0.00 |
254.65 |
0.00 |
|
Oilseed and linseed |
Fife |
0.00 |
0.00 |
1790.68 |
0.00 |
|
Oilseed and linseed |
Grampian |
0.00 |
0.00 |
11622.18 |
0.00 |
|
Oilseed and linseed |
Highland |
0.00 |
0.00 |
1894.75 |
0.00 |
|
Oilseed and linseed |
Lothian |
0.00 |
0.00 |
4260.34 |
0.00 |
|
Oilseed and linseed |
Na h-Eileanan Siar | ||||
|
Oilseed and linseed |
Orkney |
0.00 |
0.00 |
0.00 |
0.00 |
|
Oilseed and linseed |
Scotland |
0.00 |
0.00 |
35850.76 |
0.00 |
|
Oilseed and linseed |
Scottish Borders |
0.00 |
0.00 |
7698.54 |
0.00 |
|
Oilseed and linseed |
Shetland |
0.00 |
0.00 |
0.00 |
0.00 |
|
Oilseed and linseed |
Tayside |
0.00 |
0.00 |
7892.61 |
0.00 |
|
Orchard and soft fruit |
Argyll and Bute | ||||
|
Orchard and soft fruit |
Ayrshire |
0.00 |
0.00 |
0.66 |
0.00 |
|
Orchard and soft fruit |
Clyde Valley |
0.00 |
0.00 |
8.49 |
0.00 |
|
Orchard and soft fruit |
Dumfries and Galloway |
0.00 |
0.00 |
4.65 |
0.00 |
|
Orchard and soft fruit |
East Central | ||||
|
Orchard and soft fruit |
Fife |
0.00 |
0.00 |
124.35 |
0.00 |
|
Orchard and soft fruit |
Grampian |
0.00 |
0.00 |
71.97 |
0.00 |
|
Orchard and soft fruit |
Highland |
0.00 |
0.00 |
24.63 |
0.00 |
|
Orchard and soft fruit |
Lothian |
0.00 |
0.00 |
6.18 |
0.00 |
|
Orchard and soft fruit |
Na h-Eileanan Siar |
0.00 |
0.00 |
1.80 |
0.00 |
|
Orchard and soft fruit |
Orkney | ||||
|
Orchard and soft fruit |
Scotland |
0.00 |
0.00 |
699.81 |
0.00 |
|
Orchard and soft fruit |
Scottish Borders | ||||
|
Orchard and soft fruit |
Shetland | ||||
|
Orchard and soft fruit |
Tayside |
0.00 |
0.00 |
446.55 |
0.00 |
|
Other livestock |
Argyll and Bute |
0.00 |
0.00 |
0.00 |
0.00 |
|
Other livestock |
Ayrshire |
0.00 |
0.00 |
0.00 |
0.00 |
|
Other livestock |
Clyde Valley |
0.00 |
0.00 |
0.00 |
0.00 |
|
Other livestock |
Dumfries and Galloway |
0.00 |
0.00 |
0.00 |
0.00 |
|
Other livestock |
East Central |
0.00 |
0.00 |
0.00 |
0.00 |
|
Other livestock |
Fife |
0.00 |
0.00 |
0.00 |
0.00 |
|
Other livestock |
Grampian |
0.00 |
0.00 |
0.00 |
0.00 |
|
Other livestock |
Highland |
0.00 |
0.00 |
0.00 |
0.00 |
|
Other livestock |
Lothian |
0.00 |
0.00 |
0.00 |
0.00 |
|
Other livestock |
Na h-Eileanan Siar |
0.00 |
0.00 |
0.00 |
0.00 |
|
Other livestock |
Orkney |
0.00 |
0.00 |
0.00 |
0.00 |
|
Other livestock |
Scotland |
0.00 |
0.00 |
0.00 |
0.00 |
|
Other livestock |
Scottish Borders |
0.00 |
0.00 |
0.00 |
0.00 |
|
Other livestock |
Shetland |
0.00 |
0.00 |
0.00 |
0.00 |
|
Other livestock |
Tayside |
0.00 |
0.00 |
0.00 |
0.00 |
|
Peas and beans |
Argyll and Bute |
0.00 |
0.00 |
0.00 |
0.00 |
|
Peas and beans |
Ayrshire |
0.00 |
0.00 |
99.13 |
0.00 |
|
Peas and beans |
Clyde Valley | ||||
|
Peas and beans |
Dumfries and Galloway |
0.00 |
0.00 |
180.54 |
0.00 |
|
Peas and beans |
East Central | ||||
|
Peas and beans |
Fife |
0.00 |
0.00 |
449.04 |
0.00 |
|
Peas and beans |
Grampian |
0.00 |
0.00 |
139.62 |
0.00 |
|
Peas and beans |
Highland |
0.00 |
0.00 |
52.63 |
0.00 |
|
Peas and beans |
Lothian |
0.00 |
0.00 |
495.76 |
0.00 |
|
Peas and beans |
Na h-Eileanan Siar | ||||
|
Peas and beans |
Orkney |
0.00 |
0.00 |
0.00 |
0.00 |
|
Peas and beans |
Scotland |
0.00 |
0.00 |
2569.65 |
0.00 |
|
Peas and beans |
Scottish Borders |
0.00 |
0.00 |
698.64 |
0.00 |
|
Peas and beans |
Shetland |
0.00 |
0.00 |
0.00 |
0.00 |
|
Peas and beans |
Tayside |
0.00 |
0.00 |
394.27 |
0.00 |
|
Pig breeding |
Argyll and Bute |
213.10 |
0.00 |
0.00 |
23.56 |
|
Pig breeding |
Ayrshire |
82.72 |
0.00 |
0.00 |
9.15 |
|
Pig breeding |
Clyde Valley | ||||
|
Pig breeding |
Dumfries and Galloway |
2516.59 |
0.00 |
0.00 |
278.23 |
|
Pig breeding |
East Central | ||||
|
Pig breeding |
Fife |
353.30 |
0.00 |
0.00 |
39.06 |
|
Pig breeding |
Grampian |
27857.74 |
0.00 |
0.00 |
3079.85 |
|
Pig breeding |
Highland |
1798.77 |
0.00 |
0.00 |
198.87 |
|
Pig breeding |
Lothian |
2168.89 |
0.00 |
0.00 |
239.79 |
|
Pig breeding |
Na h-Eileanan Siar |
54.68 |
0.00 |
0.00 |
6.05 |
|
Pig breeding |
Orkney |
26.64 |
0.00 |
0.00 |
2.95 |
|
Pig breeding |
Scotland |
45947.75 |
0.00 |
0.00 |
5079.82 |
|
Pig breeding |
Scottish Borders |
5952.89 |
0.00 |
0.00 |
658.13 |
|
Pig breeding |
Shetland |
14.02 |
0.00 |
0.00 |
1.55 |
|
Pig breeding |
Tayside |
3823.25 |
0.00 |
0.00 |
422.69 |
|
Pig other |
Argyll and Bute |
0.00 |
0.00 |
0.00 |
0.00 |
|
Pig other |
Ayrshire |
0.00 |
0.00 |
0.00 |
0.00 |
|
Pig other |
Clyde Valley | ||||
|
Pig other |
Dumfries and Galloway |
0.00 |
0.00 |
0.00 |
0.00 |
|
Pig other |
East Central | ||||
|
Pig other |
Fife |
0.00 |
0.00 |
0.00 |
0.00 |
|
Pig other |
Grampian |
0.00 |
0.00 |
0.00 |
0.00 |
|
Pig other |
Highland |
0.00 |
0.00 |
0.00 |
0.00 |
|
Pig other |
Lothian |
0.00 |
0.00 |
0.00 |
0.00 |
|
Pig other |
Na h-Eileanan Siar |
0.00 |
0.00 |
0.00 |
0.00 |
|
Pig other |
Orkney |
0.00 |
0.00 |
0.00 |
0.00 |
|
Pig other |
Scotland |
0.00 |
0.00 |
0.00 |
0.00 |
|
Pig other |
Scottish Borders |
0.00 |
0.00 |
0.00 |
0.00 |
|
Pig other |
Shetland |
0.00 |
0.00 |
0.00 |
0.00 |
|
Pig other |
Tayside |
0.00 |
0.00 |
0.00 |
0.00 |
|
Potatoes |
Argyll and Bute |
30.30 |
0.00 |
23.26 |
0.61 |
|
Potatoes |
Ayrshire |
1200.54 |
0.00 |
921.52 |
24.25 |
|
Potatoes |
Clyde Valley |
246.17 |
0.00 |
188.96 |
4.97 |
|
Potatoes |
Dumfries and Galloway |
1157.62 |
0.00 |
888.57 |
23.38 |
|
Potatoes |
East Central |
78.69 |
0.00 |
60.40 |
1.59 |
|
Potatoes |
Fife |
13502.63 |
0.00 |
10364.42 |
272.75 |
|
Potatoes |
Grampian |
23786.56 |
0.00 |
18258.22 |
480.48 |
|
Potatoes |
Highland |
6510.62 |
0.00 |
4997.46 |
131.51 |
|
Potatoes |
Lothian |
6583.42 |
0.00 |
5053.34 |
132.98 |
|
Potatoes |
Na h-Eileanan Siar |
151.49 |
0.00 |
116.28 |
3.06 |
|
Potatoes |
Orkney |
136.34 |
0.00 |
104.65 |
2.75 |
|
Potatoes |
Scotland |
119582.52 |
0.00 |
91789.82 |
2415.52 |
|
Potatoes |
Scottish Borders |
8788.83 |
0.00 |
6746.18 |
177.53 |
|
Potatoes |
Shetland |
52.18 |
0.00 |
40.05 |
1.05 |
|
Potatoes |
Tayside |
57355.88 |
0.00 |
44025.55 |
1158.57 |
|
Poultry broilers |
Argyll and Bute |
0.95 |
0.00 |
0.00 |
1.49 |
|
Poultry broilers |
Ayrshire |
18.27 |
0.00 |
0.00 |
28.70 |
|
Poultry broilers |
Clyde Valley |
3.70 |
0.00 |
0.00 |
5.81 |
|
Poultry broilers |
Dumfries and Galloway |
509.43 |
0.00 |
0.00 |
800.54 |
|
Poultry broilers |
East Central | ||||
|
Poultry broilers |
Fife |
445.45 |
0.00 |
0.00 |
699.99 |
|
Poultry broilers |
Grampian | ||||
|
Poultry broilers |
Highland |
3.96 |
0.00 |
0.00 |
6.23 |
|
Poultry broilers |
Lothian |
1284.94 |
0.00 |
0.00 |
2019.19 |
|
Poultry broilers |
Na h-Eileanan Siar |
0.81 |
0.00 |
0.00 |
1.27 |
|
Poultry broilers |
Orkney |
1.31 |
0.00 |
0.00 |
2.06 |
|
Poultry broilers |
Scotland |
4468.18 |
0.00 |
0.00 |
7021.42 |
|
Poultry broilers |
Scottish Borders |
374.54 |
0.00 |
0.00 |
588.56 |
|
Poultry broilers |
Shetland |
0.75 |
0.00 |
0.00 |
1.18 |
|
Poultry broilers |
Tayside |
1262.32 |
0.00 |
0.00 |
1983.64 |
|
Poultry layers |
Argyll and Bute |
143.07 |
0.00 |
0.00 |
23.61 |
|
Poultry layers |
Ayrshire |
8778.37 |
0.00 |
0.00 |
1448.86 |
|
Poultry layers |
Clyde Valley |
2094.53 |
0.00 |
0.00 |
345.70 |
|
Poultry layers |
Dumfries and Galloway |
8512.27 |
0.00 |
0.00 |
1404.94 |
|
Poultry layers |
East Central |
61.88 |
0.00 |
0.00 |
10.21 |
|
Poultry layers |
Fife |
5668.39 |
0.00 |
0.00 |
935.56 |
|
Poultry layers |
Grampian |
14855.56 |
0.00 |
0.00 |
2451.89 |
|
Poultry layers |
Highland |
2172.42 |
0.00 |
0.00 |
358.56 |
|
Poultry layers |
Lothian |
4027.62 |
0.00 |
0.00 |
664.75 |
|
Poultry layers |
Na h-Eileanan Siar |
64.57 |
0.00 |
0.00 |
10.66 |
|
Poultry layers |
Orkney |
70.79 |
0.00 |
0.00 |
11.68 |
|
Poultry layers |
Scotland |
77982.27 |
0.00 |
0.00 |
12870.86 |
|
Poultry layers |
Scottish Borders |
24985.85 |
0.00 |
0.00 |
4123.88 |
|
Poultry layers |
Shetland |
39.06 |
0.00 |
0.00 |
6.45 |
|
Poultry layers |
Tayside |
5255.73 |
0.00 |
0.00 |
867.45 |
|
Sheep |
Argyll and Bute |
0.00 |
0.00 |
8016.13 |
0.00 |
|
Sheep |
Ayrshire |
0.00 |
0.00 |
8527.85 |
0.00 |
|
Sheep |
Clyde Valley |
0.00 |
0.00 |
8230.80 |
0.00 |
|
Sheep |
Dumfries and Galloway |
0.00 |
0.00 |
19220.24 |
0.00 |
|
Sheep |
East Central |
0.00 |
0.00 |
5093.61 |
0.00 |
|
Sheep |
Fife |
0.00 |
0.00 |
1902.70 |
0.00 |
|
Sheep |
Grampian |
0.00 |
0.00 |
13517.22 |
0.00 |
|
Sheep |
Highland |
0.00 |
0.00 |
16220.40 |
0.00 |
|
Sheep |
Lothian |
0.00 |
0.00 |
4202.15 |
0.00 |
|
Sheep |
Na h-Eileanan Siar |
0.00 |
0.00 |
2707.37 |
0.00 |
|
Sheep |
Orkney |
0.00 |
0.00 |
2459.53 |
0.00 |
|
Sheep |
Scotland |
0.00 |
0.00 |
129119.22 |
0.00 |
|
Sheep |
Scottish Borders |
0.00 |
0.00 |
21376.03 |
0.00 |
|
Sheep |
Shetland |
0.00 |
0.00 |
5472.80 |
0.00 |
|
Sheep |
Tayside |
0.00 |
0.00 |
12172.39 |
0.00 |
|
Wheat |
Argyll and Bute | ||||
|
Wheat |
Ayrshire |
881.94 |
0.00 |
1530.98 |
288.30 |
|
Wheat |
Clyde Valley |
580.08 |
0.00 |
1006.96 |
189.62 |
|
Wheat |
Dumfries and Galloway |
2151.77 |
0.00 |
3735.27 |
703.40 |
|
Wheat |
East Central |
1137.36 |
0.00 |
1974.36 |
371.79 |
|
Wheat |
Fife |
8595.51 |
0.00 |
14921.03 |
2809.80 |
|
Wheat |
Grampian |
10266.12 |
0.00 |
17821.06 |
3355.91 |
|
Wheat |
Highland |
1563.93 |
0.00 |
2714.84 |
511.24 |
|
Wheat |
Lothian |
10611.21 |
0.00 |
18420.11 |
3468.72 |
|
Wheat |
Na h-Eileanan Siar | ||||
|
Wheat |
Orkney |
0.00 |
0.00 |
0.00 |
0.00 |
|
Wheat |
Scotland |
64938.47 |
0.00 |
112727.32 |
21227.87 |
|
Wheat |
Scottish Borders |
14151.04 |
0.00 |
24564.93 |
4625.86 |
|
Wheat |
Shetland |
0.00 |
0.00 |
0.00 |
0.00 |
|
Wheat |
Tayside |
14974.24 |
0.00 |
25993.92 |
4894.96 |
Local Authorities within each agriculture region
The agricultural census was reported at regional level. To match this, the local authority GHG statistics were aggregated to this level based on the table below.
|
Region |
Local Authority |
|---|---|
|
Argyll & Bute |
Argyll and Bute |
|
Ayrshire |
East Ayrshire |
|
North Ayrshire | |
|
South Ayrshire | |
|
Clyde Valley |
East Dunbartonshire |
|
East Renfrewshire | |
|
Glasgow City | |
|
Inverclyde | |
|
North Lanarkshire | |
|
Renfrewshire | |
|
South Lanarkshire | |
|
West Dunbartonshire | |
|
Dumfries and Galloway |
Dumfries and Galloway |
|
East Central |
Clackmannanshire |
|
Falkirk | |
|
Stirling | |
|
Fife |
Fife |
|
Grampian |
Aberdeen City |
|
Aberdeenshire | |
|
Moray | |
|
Highland |
Highland |
|
Lothian |
East Lothian |
|
Midlothian | |
|
West Lothian | |
|
City of Edinburgh | |
|
Na h-Eileanan Siar |
Na h-Eileanan Siar |
|
Orkney |
Orkney Islands |
|
Scottish Borders |
Scottish Borders |
|
Shetland |
Shetland Islands |
|
Tayside |
Angus |
|
Dundee City | |
|
Perth and Kinross |
Full Sectoral Breakdown
Emissions (kt CO2e) by sector, agriculture region and fuel input. Note that zero means either zero or trace energy input whereas a null value indicates that census data was suppressed to prevent disclosure of individual holdings.
|
Sector |
Agriculture Region |
Electricity |
Gas |
Mobile Machinery |
Other Static |
|---|---|---|---|---|---|
|
Barley spring |
Argyll and Bute |
0.95 |
0.00 |
1.81 |
0.28 |
|
Barley spring |
Ayrshire |
0.44 |
0.00 |
4.45 |
0.69 |
|
Barley spring |
Clyde Valley |
1.09 |
0.00 |
4.70 |
0.73 |
|
Barley spring |
Dumfries and Galloway |
0.57 |
0.00 |
6.22 |
0.96 |
|
Barley spring |
East Central |
1.60 |
0.00 |
5.22 |
0.81 |
|
Barley spring |
Fife |
2.45 |
0.00 |
6.11 |
0.95 |
|
Barley spring |
Grampian |
11.16 |
0.00 |
46.64 |
7.23 |
|
Barley spring |
Highland |
9.95 |
0.00 |
22.58 |
3.50 |
|
Barley spring |
Lothian |
1.47 |
0.00 |
4.30 |
0.67 |
|
Barley spring |
Na h-Eileanan Siar | ||||
|
Barley spring |
Orkney |
1.78 |
0.00 |
4.23 |
0.66 |
|
Barley spring |
Scottish Borders |
1.38 |
0.00 |
10.36 |
1.61 |
|
Barley spring |
Shetland | ||||
|
Barley spring |
Tayside |
4.75 |
0.00 |
17.59 |
2.73 |
|
Barley winter |
Argyll and Bute |
0.07 |
0.00 |
0.13 |
0.02 |
|
Barley winter |
Ayrshire |
0.11 |
0.00 |
1.10 |
0.17 |
|
Barley winter |
Clyde Valley |
0.26 |
0.00 |
1.12 |
0.17 |
|
Barley winter |
Dumfries and Galloway |
0.26 |
0.00 |
2.81 |
0.44 |
|
Barley winter |
East Central |
0.23 |
0.00 |
0.76 |
0.12 |
|
Barley winter |
Fife |
0.54 |
0.00 |
1.34 |
0.21 |
|
Barley winter |
Grampian |
1.65 |
0.00 |
6.88 |
1.07 |
|
Barley winter |
Highland |
0.44 |
0.00 |
0.99 |
0.15 |
|
Barley winter |
Lothian |
0.51 |
0.00 |
1.49 |
0.23 |
|
Barley winter |
Na h-Eileanan Siar |
0.00 |
0.00 |
0.00 |
0.00 |
|
Barley winter |
Orkney |
0.01 |
0.00 |
0.03 |
0.01 |
|
Barley winter |
Scottish Borders |
0.55 |
0.00 |
4.14 |
0.64 |
|
Barley winter |
Shetland |
0.00 |
0.00 |
0.00 |
0.00 |
|
Barley winter |
Tayside |
0.57 |
0.00 |
2.11 |
0.33 |
|
Beef |
Argyll and Bute |
0.00 |
0.00 |
18.54 |
0.00 |
|
Beef |
Ayrshire |
0.00 |
0.00 |
32.52 |
0.00 |
|
Beef |
Clyde Valley |
0.00 |
0.00 |
30.25 |
0.00 |
|
Beef |
Dumfries and Galloway |
0.00 |
0.00 |
67.06 |
0.00 |
|
Beef |
East Central |
0.00 |
0.00 |
10.75 |
0.00 |
|
Beef |
Fife |
0.00 |
0.00 |
5.69 |
0.00 |
|
Beef |
Grampian |
0.00 |
0.00 |
49.23 |
0.00 |
|
Beef |
Highland |
0.00 |
0.00 |
36.96 |
0.00 |
|
Beef |
Lothian |
0.00 |
0.00 |
5.05 |
0.00 |
|
Beef |
Na h-Eileanan Siar |
0.00 |
0.00 |
3.87 |
0.00 |
|
Beef |
Orkney |
0.00 |
0.00 |
26.63 |
0.00 |
|
Beef |
Scottish Borders |
0.00 |
0.00 |
25.52 |
0.00 |
|
Beef |
Shetland |
0.00 |
0.00 |
3.46 |
0.00 |
|
Beef |
Tayside |
0.00 |
0.00 |
11.23 |
0.00 |
|
Dairy |
Argyll and Bute |
11.17 |
0.00 |
6.15 |
0.00 |
|
Dairy |
Ayrshire |
10.43 |
0.00 |
30.44 |
0.00 |
|
Dairy |
Clyde Valley |
13.84 |
0.00 |
17.15 |
0.00 |
|
Dairy |
Dumfries and Galloway |
19.01 |
0.00 |
60.01 |
0.00 |
|
Dairy |
East Central |
5.53 |
0.00 |
5.20 |
0.00 |
|
Dairy |
Fife |
1.92 |
0.00 |
1.37 |
0.00 |
|
Dairy |
Grampian |
1.43 |
0.00 |
1.71 |
0.00 |
|
Dairy |
Highland |
2.84 |
0.00 |
1.85 |
0.00 |
|
Dairy |
Lothian |
0.85 |
0.00 |
0.71 |
0.00 |
|
Dairy |
Na h-Eileanan Siar |
0.20 |
0.00 |
0.03 |
0.00 |
|
Dairy |
Orkney |
2.47 |
0.00 |
1.69 |
0.00 |
|
Dairy |
Scottish Borders |
1.40 |
0.00 |
3.01 |
0.00 |
|
Dairy |
Shetland |
2.85 |
0.00 |
0.59 |
0.00 |
|
Dairy |
Tayside |
0.87 |
0.00 |
0.92 |
0.00 |
|
Oilseed and linseed |
Argyll and Bute |
0.00 |
0.00 |
0.00 |
0.00 |
|
Oilseed and linseed |
Ayrshire | ||||
|
Oilseed and linseed |
Clyde Valley | ||||
|
Oilseed and linseed |
Dumfries and Galloway |
0.00 |
0.00 |
0.31 |
0.00 |
|
Oilseed and linseed |
East Central |
0.00 |
0.00 |
0.24 |
0.00 |
|
Oilseed and linseed |
Fife |
0.00 |
0.00 |
0.73 |
0.00 |
|
Oilseed and linseed |
Grampian |
0.00 |
0.00 |
5.33 |
0.00 |
|
Oilseed and linseed |
Highland |
0.00 |
0.00 |
2.04 |
0.00 |
|
Oilseed and linseed |
Lothian |
0.00 |
0.00 |
1.62 |
0.00 |
|
Oilseed and linseed |
Na h-Eileanan Siar | ||||
|
Oilseed and linseed |
Orkney |
0.00 |
0.00 |
0.00 |
0.00 |
|
Oilseed and linseed |
Scottish Borders |
0.00 |
0.00 |
5.18 |
0.00 |
|
Oilseed and linseed |
Shetland |
0.00 |
0.00 |
0.00 |
0.00 |
|
Oilseed and linseed |
Tayside |
0.00 |
0.00 |
3.15 |
0.00 |
|
Orchard and soft fruit |
Argyll and Bute | ||||
|
Orchard and soft fruit |
Ayrshire |
0.00 |
0.00 |
0.00 |
0.00 |
|
Orchard and soft fruit |
Clyde Valley |
0.00 |
0.00 |
0.01 |
0.00 |
|
Orchard and soft fruit |
Dumfries and Galloway |
0.00 |
0.00 |
0.00 |
0.00 |
|
Orchard and soft fruit |
East Central | ||||
|
Orchard and soft fruit |
Fife |
0.00 |
0.00 |
0.05 |
0.00 |
|
Orchard and soft fruit |
Grampian |
0.00 |
0.00 |
0.03 |
0.00 |
|
Orchard and soft fruit |
Highland |
0.00 |
0.00 |
0.03 |
0.00 |
|
Orchard and soft fruit |
Lothian |
0.00 |
0.00 |
0.00 |
0.00 |
|
Orchard and soft fruit |
Na h-Eileanan Siar |
0.00 |
0.00 |
0.00 |
0.00 |
|
Orchard and soft fruit |
Orkney | ||||
|
Orchard and soft fruit |
Scottish Borders | ||||
|
Orchard and soft fruit |
Shetland | ||||
|
Orchard and soft fruit |
Tayside |
0.00 |
0.00 |
0.18 |
0.00 |
|
Other livestock |
Argyll and Bute |
0.00 |
0.00 |
0.00 |
0.00 |
|
Other livestock |
Ayrshire |
0.00 |
0.00 |
0.00 |
0.00 |
|
Other livestock |
Clyde Valley |
0.00 |
0.00 |
0.00 |
0.00 |
|
Other livestock |
Dumfries and Galloway |
0.00 |
0.00 |
0.00 |
0.00 |
|
Other livestock |
East Central |
0.00 |
0.00 |
0.00 |
0.00 |
|
Other livestock |
Fife |
0.00 |
0.00 |
0.00 |
0.00 |
|
Other livestock |
Grampian |
0.00 |
0.00 |
0.00 |
0.00 |
|
Other livestock |
Highland |
0.00 |
0.00 |
0.00 |
0.00 |
|
Other livestock |
Lothian |
0.00 |
0.00 |
0.00 |
0.00 |
|
Other livestock |
Na h-Eileanan Siar |
0.00 |
0.00 |
0.00 |
0.00 |
|
Other livestock |
Orkney |
0.00 |
0.00 |
0.00 |
0.00 |
|
Other livestock |
Scottish Borders |
0.00 |
0.00 |
0.00 |
0.00 |
|
Other livestock |
Shetland |
0.00 |
0.00 |
0.00 |
0.00 |
|
Other livestock |
Tayside |
0.00 |
0.00 |
0.00 |
0.00 |
|
Peas and beans |
Argyll and Bute |
0.00 |
0.00 |
0.00 |
0.00 |
|
Peas and beans |
Ayrshire |
0.00 |
0.00 |
0.10 |
0.00 |
|
Peas and beans |
Clyde Valley | ||||
|
Peas and beans |
Dumfries and Galloway |
0.00 |
0.00 |
0.16 |
0.00 |
|
Peas and beans |
East Central | ||||
|
Peas and beans |
Fife |
0.00 |
0.00 |
0.18 |
0.00 |
|
Peas and beans |
Grampian |
0.00 |
0.00 |
0.06 |
0.00 |
|
Peas and beans |
Highland |
0.00 |
0.00 |
0.06 |
0.00 |
|
Peas and beans |
Lothian |
0.00 |
0.00 |
0.19 |
0.00 |
|
Peas and beans |
Na h-Eileanan Siar | ||||
|
Peas and beans |
Orkney |
0.00 |
0.00 |
0.00 |
0.00 |
|
Peas and beans |
Scottish Borders |
0.00 |
0.00 |
0.47 |
0.00 |
|
Peas and beans |
Shetland |
0.00 |
0.00 |
0.00 |
0.00 |
|
Peas and beans |
Tayside |
0.00 |
0.00 |
0.16 |
0.00 |
|
Pig breeding |
Argyll and Bute |
0.31 |
0.00 |
0.00 |
0.03 |
|
Pig breeding |
Ayrshire |
0.02 |
0.00 |
0.00 |
0.01 |
|
Pig breeding |
Clyde Valley | ||||
|
Pig breeding |
Dumfries and Galloway |
0.43 |
0.00 |
0.00 |
0.25 |
|
Pig breeding |
East Central | ||||
|
Pig breeding |
Fife |
0.12 |
0.00 |
0.00 |
0.02 |
|
Pig breeding |
Grampian |
6.41 |
0.00 |
0.00 |
1.41 |
|
Pig breeding |
Highland |
1.79 |
0.00 |
0.00 |
0.21 |
|
Pig breeding |
Lothian |
0.59 |
0.00 |
0.00 |
0.09 |
|
Pig breeding |
Na h-Eileanan Siar |
0.57 |
0.00 |
0.00 |
0.01 |
|
Pig breeding |
Orkney |
0.03 |
0.00 |
0.00 |
0.00 |
|
Pig breeding |
Scottish Borders |
1.12 |
0.00 |
0.00 |
0.44 |
|
Pig breeding |
Shetland |
0.11 |
0.00 |
0.00 |
0.00 |
|
Pig breeding |
Tayside |
0.86 |
0.00 |
0.00 |
0.17 |
|
Pig other |
Argyll and Bute |
0.00 |
0.00 |
0.00 |
0.00 |
|
Pig other |
Ayrshire |
0.00 |
0.00 |
0.00 |
0.00 |
|
Pig other |
Clyde Valley | ||||
|
Pig other |
Dumfries and Galloway |
0.00 |
0.00 |
0.00 |
0.00 |
|
Pig other |
East Central | ||||
|
Pig other |
Fife |
0.00 |
0.00 |
0.00 |
0.00 |
|
Pig other |
Grampian |
0.00 |
0.00 |
0.00 |
0.00 |
|
Pig other |
Highland |
0.00 |
0.00 |
0.00 |
0.00 |
|
Pig other |
Lothian |
0.00 |
0.00 |
0.00 |
0.00 |
|
Pig other |
Na h-Eileanan Siar |
0.00 |
0.00 |
0.00 |
0.00 |
|
Pig other |
Orkney |
0.00 |
0.00 |
0.00 |
0.00 |
|
Pig other |
Scottish Borders |
0.00 |
0.00 |
0.00 |
0.00 |
|
Pig other |
Shetland |
0.00 |
0.00 |
0.00 |
0.00 |
|
Pig other |
Tayside |
0.00 |
0.00 |
0.00 |
0.00 |
|
Potatoes |
Argyll and Bute |
0.04 |
0.00 |
0.03 |
0.00 |
|
Potatoes |
Ayrshire |
0.25 |
0.00 |
0.94 |
0.02 |
|
Potatoes |
Clyde Valley |
0.13 |
0.00 |
0.21 |
0.01 |
|
Potatoes |
Dumfries and Galloway |
0.20 |
0.00 |
0.79 |
0.02 |
|
Potatoes |
East Central |
0.05 |
0.00 |
0.06 |
0.00 |
|
Potatoes |
Fife |
4.63 |
0.00 |
4.22 |
0.11 |
|
Potatoes |
Grampian |
5.48 |
0.00 |
8.37 |
0.22 |
|
Potatoes |
Highland |
6.48 |
0.00 |
5.38 |
0.14 |
|
Potatoes |
Lothian |
1.80 |
0.00 |
1.92 |
0.05 |
|
Potatoes |
Na h-Eileanan Siar |
1.59 |
0.00 |
0.26 |
0.01 |
|
Potatoes |
Orkney |
0.14 |
0.00 |
0.13 |
0.00 |
|
Potatoes |
Scottish Borders |
1.66 |
0.00 |
4.54 |
0.12 |
|
Potatoes |
Shetland |
0.42 |
0.00 |
0.11 |
0.00 |
|
Potatoes |
Tayside |
12.96 |
0.00 |
17.58 |
0.46 |
|
Poultry broilers |
Argyll and Bute |
0.00 |
0.00 |
0.00 |
0.00 |
|
Poultry broilers |
Ayrshire |
0.00 |
0.00 |
0.00 |
0.03 |
|
Poultry broilers |
Clyde Valley |
0.00 |
0.00 |
0.00 |
0.01 |
|
Poultry broilers |
Dumfries and Galloway |
0.09 |
0.00 |
0.00 |
0.71 |
|
Poultry broilers |
East Central | ||||
|
Poultry broilers |
Fife |
0.15 |
0.00 |
0.00 |
0.28 |
|
Poultry broilers |
Grampian | ||||
|
Poultry broilers |
Highland |
0.00 |
0.00 |
0.00 |
0.01 |
|
Poultry broilers |
Lothian |
0.35 |
0.00 |
0.00 |
0.77 |
|
Poultry broilers |
Na h-Eileanan Siar |
0.01 |
0.00 |
0.00 |
0.00 |
|
Poultry broilers |
Orkney |
0.00 |
0.00 |
0.00 |
0.00 |
|
Poultry broilers |
Scottish Borders |
0.07 |
0.00 |
0.00 |
0.40 |
|
Poultry broilers |
Shetland |
0.01 |
0.00 |
0.00 |
0.00 |
|
Poultry broilers |
Tayside |
0.29 |
0.00 |
0.00 |
0.79 |
|
Poultry layers |
Argyll and Bute |
0.21 |
0.00 |
0.00 |
0.03 |
|
Poultry layers |
Ayrshire |
1.86 |
0.00 |
0.00 |
1.48 |
|
Poultry layers |
Clyde Valley |
1.13 |
0.00 |
0.00 |
0.38 |
|
Poultry layers |
Dumfries and Galloway |
1.44 |
0.00 |
0.00 |
1.25 |
|
Poultry layers |
East Central |
0.04 |
0.00 |
0.00 |
0.01 |
|
Poultry layers |
Fife |
1.94 |
0.00 |
0.00 |
0.38 |
|
Poultry layers |
Grampian |
3.42 |
0.00 |
0.00 |
1.12 |
|
Poultry layers |
Highland |
2.16 |
0.00 |
0.00 |
0.39 |
|
Poultry layers |
Lothian |
1.10 |
0.00 |
0.00 |
0.25 |
|
Poultry layers |
Na h-Eileanan Siar |
0.68 |
0.00 |
0.00 |
0.02 |
|
Poultry layers |
Orkney |
0.07 |
0.00 |
0.00 |
0.01 |
|
Poultry layers |
Scottish Borders |
4.71 |
0.00 |
0.00 |
2.77 |
|
Poultry layers |
Shetland |
0.31 |
0.00 |
0.00 |
0.02 |
|
Poultry layers |
Tayside |
1.19 |
0.00 |
0.00 |
0.35 |
|
Sheep |
Argyll and Bute |
0.00 |
0.00 |
10.50 |
0.00 |
|
Sheep |
Ayrshire |
0.00 |
0.00 |
8.73 |
0.00 |
|
Sheep |
Clyde Valley |
0.00 |
0.00 |
9.13 |
0.00 |
|
Sheep |
Dumfries and Galloway |
0.00 |
0.00 |
17.05 |
0.00 |
|
Sheep |
East Central |
0.00 |
0.00 |
4.87 |
0.00 |
|
Sheep |
Fife |
0.00 |
0.00 |
0.77 |
0.00 |
|
Sheep |
Grampian |
0.00 |
0.00 |
6.20 |
0.00 |
|
Sheep |
Highland |
0.00 |
0.00 |
17.47 |
0.00 |
|
Sheep |
Lothian |
0.00 |
0.00 |
1.60 |
0.00 |
|
Sheep |
Na h-Eileanan Siar |
0.00 |
0.00 |
6.05 |
0.00 |
|
Sheep |
Orkney |
0.00 |
0.00 |
2.95 |
0.00 |
|
Sheep |
Scottish Borders |
0.00 |
0.00 |
14.38 |
0.00 |
|
Sheep |
Shetland |
0.00 |
0.00 |
15.01 |
0.00 |
|
Sheep |
Tayside |
0.00 |
0.00 |
4.86 |
0.00 |
|
Wheat |
Argyll and Bute | ||||
|
Wheat |
Ayrshire |
0.19 |
0.00 |
1.57 |
0.30 |
|
Wheat |
Clyde Valley |
0.31 |
0.00 |
1.12 |
0.21 |
|
Wheat |
Dumfries and Galloway |
0.36 |
0.00 |
3.31 |
0.62 |
|
Wheat |
East Central |
0.70 |
0.00 |
1.89 |
0.36 |
|
Wheat |
Fife |
2.95 |
0.00 |
6.07 |
1.14 |
|
Wheat |
Grampian |
2.36 |
0.00 |
8.17 |
1.54 |
|
Wheat |
Highland |
1.56 |
0.00 |
2.92 |
0.55 |
|
Wheat |
Lothian |
2.90 |
0.00 |
7.02 |
1.32 |
|
Wheat |
Na h-Eileanan Siar | ||||
|
Wheat |
Orkney |
0.00 |
0.00 |
0.00 |
0.00 |
|
Wheat |
Scottish Borders |
2.67 |
0.00 |
16.53 |
3.11 |
|
Wheat |
Shetland |
0.00 |
0.00 |
0.00 |
0.00 |
|
Wheat |
Tayside |
3.38 |
0.00 |
10.38 |
1.95 |
List of assumptions setting the scope
|
Aspect |
Scope |
Assumption |
|---|---|---|
|
Drying of grass for animal feed/silage |
Depends on context |
Out of scope, this would be covered under manufacturing. However, production for on-farm feed and post-harvest storage is in scope. |
|
Horses/livery |
Out of scope |
Not included in the agricultural inventory, so out of scope. |
|
Indoor or vertical farming |
Out of scope |
While energy intensive, it is very small scale in market. This will be scoped out. Especially as excluding urban areas for the dataset; some vertical farms will there for be missed. A future study could look at the specifics of decarbonising energy use by vertical farms/hydroponics. |
|
Manufacturing on site |
Out of scope |
E.g., ice cream or cheese processing on site at a dairy farm; vegetable processing (cut or prepared vegetables); meat processing. This and other similar activities will be covered under the manufacturing inventory. It should be noted that vegetable processing can be complicated to set boundaries with inventories. |
|
Organic farming |
Included but not separated |
This will be captured with the rest of the data, and it is a small proportion of all sectors. We will not disaggregate it out. A further study could look at the specifics of decarbonising energy use within organic farming. |
|
On site processing |
In scope |
Packing and processing of fresh vegetables. Some fruit/veg packaged in field during harvest/in packhouses/harvested and stored loose. This is in scope (when on site) as packaging and storing is part of the process. |
|
Onshore aquaculture/ hatcheries |
Out of scope |
Freshwater fish farms are out of scope as aquaculture does not come under agriculture. |
|
Transport of animals |
Out of scope (offsite) |
Once offsite, past the farm gate, this is out of scope. A small amount of fuel within the farm gate will cover transport onsite, however, this is generally likely to be low. Most onsite fuel use in mobile machinery comes from farm vehicles used in daily operations for management/herding/transport to wintering housing onsite. |
|
Urban areas |
Out of scope |
Agricultural practices only occur in rural areas, so data from urban areas are out of scope. |
Energy needs by sector.
Assumptions of energy requirements for each sector are detailed in the table below.
|
Sector |
Energy requirements |
|
Beef |
Low demands, similar to sheep. Small amount on mobile machinery. Small amount heating for calving and for small amount of warm/hot water for washing |
|
Cereals |
Drying, necessary requirement in Scotland. Cultivation power, drilling, harvest, transport (to storage on farm) |
|
Dairy |
Chillers, heating, lighting, small amount of warm/hot water. Some mobile (e.g., spreaders, HGVs needed for on-farm feed production). Some energy needs for robotic milking. |
|
Fresh peas |
Require chilling. Most peas in Scotland are fresh. |
|
Potatoes |
Power requirements and storage, chiller, dark house. Depends on variety (seed potatoes). Some mobile machinery. |
|
Poultry (layers) |
Layers – more steady demands – greater potential savings from improved control and heat recovery in heating, cooling, and ventilation systems. Intensive heat and energy, lighting. Housing. |
|
Poultry (broilers) |
Broilers – high demand on day 1 – rapidly diminishing heat demand as birds grow. Ventilation demand increases. Intensive heat and energy, lighting. Housing. |
|
Pig |
Intensive heat and energy, lighting. Housing. |
|
Sheep |
Small amount on mobile machinery, small amount of electricity or fuel for a generator for sheering machinery. Small amount heating for lambing and small amount of warm/hot water for washing. |
|
Soft fruit |
Energy intensive for chilling, and for heating of soft fruit growing environment to extend growing season and displace carbon intensive imports. Some mobile machinery, depending on produce |
Appendix B: Methodology to task 2
- The Rapid Evidence Assessment (REA) methodology used for this project aligns with NERC methodology[73] and comprised of the following steps.
- Define the search strategy protocol, identify key search words or terms, define inclusion/exclusion criteria. A list of key words, terms and search strings was created and reviewed by the project steering group to direct the REA review to the most relevant sources. This list was supported by Ricardo’s team of renewable energy technical experts and divided into seven relevant categories ‘Mobile demands’; ‘Stationary demands’; ‘Meeting demand’; ‘Generation technology’; ‘Agriculture related modifiers’; ‘Energy related modifiers’ and ‘General modifiers’ to ensure that all appropriate technologies and uses were identified which supported the focus the review. Any literature that is considered out of scope based on our list of assumptions was excluded from the search. We also excluded literature that is older than 10 years, unless it was from a credible source and was the only piece of evidence available (particularly for data).
- Searching for evidence and recording findings. Literature was searched using Google Scholar and Science Direct, utilising our accounts with Science Direct and Research Gate to access restricted pdfs where required. Grey literature, such as farming press and industry, providing examples of technologies being deployed, was searched using Google. For each individual search a unique search reference was assigned and the date, search string used, total number of results found, and the total number of relevant papers found were recorded. Examples of search strings include:
- “agriculture” “renewable energy” “Scotland”
- “agriculture” “renewable energy” “bioenergy”
- “agriculture” “circular economy” “Scotland”
- “non-carbon tech” “Scotland” “farming” “land-use”
All results were recorded in an excel spreadsheet with information extracted on the following:
- Country
- Sector
- Type of technology
- Benefits and barriers of the technology
- Cost of technology
- Opportunity for the technology to support wider decarbonisation of energy production
- Land use implications (including impact on agricultural production)
- Opportunity for the agricultural sector to benefit from the second-hand market for renewable/ participate in circular economy.
A RAG (red, amber, green) rating was assigned to each source, based on the following criteria:
|
Description |
Rating |
|
Quality | |
|
Peer reviewed journal, sound data sources and methodology |
Green |
|
Government funded research reports, sound data sources and methodology |
Green |
|
Research funded by NGOs (e.g., AHDB), sound data sources and methodology |
Amber |
|
Work is unreliable because of unreliable data sources, or limited sources, or because the method is not robust |
Red |
|
Information from websites, blogs etc., of unknown quality |
Red |
|
Relevance | |
|
Timeframe: within last 10 years |
Green |
|
Timeframe: within last 20 years |
Amber |
|
Timeframe: older than 20 years |
Red |
- Screening. Sources of evidence was then screened initially by title and then accepted papers were then screened again using the summary or abstract. Literature was screened for information on the following inclusion criteria:
- Non-carbon technology
- Benefits, enablers and barriers of non-carbon technology
- Opportunity for technology to support wider decarbonisation of energy production
- Potential and opportunity for the agricultural sector to benefit from the second-hand market and participate in circular economy
- Land use implications and the impact on agricultural production
- Extract and appraise the evidence. The screening provided an organised list of papers which enabled evidence to be extracted directly from the literature into the report. Literature extracted also guided the internal workshop and supported information included in the SWOT and PESTLE tables.
Appendix C: Overview and details on technologies associated with carbon dioxide reduction potential in the agricultural sector[74]
|
Mitigation option |
Technology |
GHG reduction method |
Co-effects |
Constraints |
CAPEX (£) |
OPEX (£) |
Cost effectiveness £ t CO2eq |
Abatement potential kt CO2eq |
|---|---|---|---|---|---|---|---|---|
|
Precision farming technology |
VRA N fertiliser for 500 ha farm, assuming a 200 HP, GPS compatible tractor is available on the farm |
Soil N2O, fuel CO2, increased yield |
Reduced pesticide use, phosphorous pollution and water use, reduced soil compaction |
Time consuming data collection and analysis; Incompatibilities between different PF technologies; Uncertainties regarding the expected performance of PF; More farmer involvement would be needed in the decision support systems |
17,250 |
200 |
-112 |
76 |
|
Auto guidance for 500 ha farm, assuming 2 tractors (200 HP, GPS compatible) are available on the farm |
30,000 |
1,500 | ||||||
|
Controlled traffic system |
30,000 |
1,500 | ||||||
|
Basic system (auto-steering, yield monitor, VRA seeding) |
40,000 |
n/a | ||||||
|
Basic system (auto-steering, yield monitor, VRA seeding) |
100,00 + 22/ha |
n/a | ||||||
|
Site specific weed management for 500 ha farm |
42,000 |
200 | ||||||
|
Tractor control |
10,500 |
n/a | ||||||
|
Variable rate seed drill |
34,000 |
n/a | ||||||
|
Variable rate fertiliser spreader |
19,500 |
n/a | ||||||
|
Precision livestock farming |
EID readers and software |
All livestock emissions, yield |
Emissions intensity of all livestock related pollution is reduced |
Lack of flexibility of the equipment; Fear of the technology; Lack of training; Amount of data generated |
500-2,300 |
n/a |
n/a |
n/a |
|
Weigh crate (weighing and automatic sorting of sheep) |
7,500-10,000 |
n/a | ||||||
|
Silent herdsman – cattle heat detection (collars, base station & PC with software) |
2,500 + 85 (animal to observe) |
n/a | ||||||
|
HeatWatch – cattle heat detection (patch, base station, software) |
2,800-3,500 + 3 (animal to observe) |
n/a | ||||||
|
Robotic milking in dairy cow (auto milking system with dynamic feeding related to milk yield; ID of animals with treatment) |
70-100k |
n/a | ||||||
|
Virtual fence (battery powered receiver on collar, induction cable & transformer) |
350 + 210/ animal |
n/a | ||||||
|
Minimum tillage and no-till |
Direct drill |
Energy CO2, uncertain soil C effect, increased yield (potential negative impact on soil N2O) |
Improved soil quality and soil biodiversity, (though potentially increased need for herbicides) |
Acquiring of new management skills; High perceived risk; Anticipated short term pest problems |
30-60k |
n/a |
n/a |
n/a |
|
Agroforestry |
Fertiliser and herbicide specialist distributer |
Soil and biomass C, soil N2O, energy CO2 |
Improved soil quality, biodiversity, reduced agrochemical use, buffering effect of tress on the heating and cooling of the land area and livestock |
Regarded as high-risk decision; Low allocations of grant support for establishment are available in the current scheme |
30k |
1k |
n/a |
n/a |
|
Telelifting equipment for manual pruning |
45k |
1k | ||||||
|
Fertiliser & sprayers for 4WD bikes |
12k |
500 | ||||||
|
Anaerobic digestion |
AD plant |
Manure CH4, Energy CO2 |
Reduced N leaching (though potentially increased competition for land) |
Continuity of supply of additional feedstocks; Land and crop availability for timely distribution of digestate; Risk of contamination from imported feedstock; Matching seasonal heat demands to CHP output; Availability of electricity and/or gas grid connections; Planning difficulties |
1.5m for 250 kW 3.9m for 1 Mwe |
110 for 250 kW 250k for 1 MW (excluding crop production costs and income from electricity and heat) |
Cattle manure & maize: 131 Pig & poultry manure & maize: -20 Maize only: -43 |
Cattle manure & maize: 131 Pig & poultry manure & maize: -20 Maize only: -43 |
|
Capital investment in fuel efficiency |
Electric quad bikes |
Energy CO2 |
Reduced air pollution from fuel use |
Development of hydrogen production facilities at farm level and associated supply chain |
10k |
n/a |
n/a |
n/a |
|
Electric lift trucks |
20k |
n/a | ||||||
|
Euro 3 engines |
n/a |
n/a | ||||||
|
Energy efficient heating and ventilation of livestock buildings |
Energy efficient fans and fan controllers |
Energy CO2 |
Reduced air pollution from fuel use |
Suitability of technologies to some buildings; Long term contracts for maintenance of some technologies; Uncertain continuity of government support policies; Support for renewables can negate the potential financial benefits |
From 1k |
n/a | ||
|
Biomass boiler |
20k |
0.05/kWh | ||||||
|
Other tech and building design |
n/a |
n/a | ||||||
|
Energy efficient crop drying |
Biomass boiler |
Energy CO2 (grain stirrers might increase fuel use) |
Reduced air pollution from fuel use |
Long lifetime of existing grain dryers |
20k |
0.05/kWh | ||
|
Grain stirrer |
15-20k |
n/a | ||||||
|
Moisture sensors |
2-20k |
216-540 | ||||||
|
Energy efficient milking and milk handling |
Heat recovery |
Energy CO2 |
Reduced air pollution from fuel use |
Need for the consideration of the system as a whole to improve efficiency of all parts together; Support for renewables can negate the potential financial benefits |
>3.5k |
n/a | ||
|
Variable speed milk pumps |
2k |
n/a | ||||||
|
Low emission livestock housing |
Littered system (gestating sows) (retrofit more expensive) |
Energy CO2 |
Reduced NH3 emissions from housing |
n/a |
£47.67 – £55.41 (pig place)-1, new build |
n/a |
n/a |
n/a |
|
Littered system (growers-finishers) (retrofit more expensive) |
£25.72 (pig place)-1, new build |
n/a | ||||||
|
Manure channel with sloped floor (weaners) (retrofit more expensive) |
£0-0.23 (pig place)-1, new build |
n/a | ||||||
|
Manure channel with sloped floor (growers-finishers) (retrofit more expensive) |
£0.73 (pig place)-1, new build |
n/a |
Appendix D: Extended SWOT tables
Solar PV
|
Strengths |
Weaknesses |
|
|
|
Opportunities |
Threats |
|
|
Onshore wind
|
Strengths |
Weaknesses |
|
|
|
Opportunities |
Threats |
|
|
Hydrogen
|
Strengths |
Weaknesses |
|
|
|
Opportunities |
Threats |
|
|
Bioenergy
|
Strengths |
Weaknesses |
|
Various types of bioenergy can be used to replace fossil fuels. Solid Biomass
AD/Biogas/Biomethane
Liquid biofuels e.g., biodiesel and bioethanol
|
Solid Biomass
AD/Biogas/Biomethane
Liquid biofuels e.g., biodiesel and bioethanol
|
|
Opportunities |
Threats |
|
If combined with carbon capture and storage, bioenergy can be deemed as carbon negative. Solid Biomass
AD/Biogas/Biomethane
|
|
Hydropower
|
Strengths |
Weaknesses |
|
|
|
Opportunities |
Threats |
|
|
Heat pumps
|
Strengths |
Weaknesses |
|
|
|
Opportunities |
Threats |
|
|
Electric vehicles (EV) and Electrification
|
Strengths |
Weaknesses |
|
|
|
Opportunities |
Threats |
|
|
Appendix E: Extended PESTLE table
|
Enabling factors |
Preventative factors | |
|---|---|---|
|
Political |
|
|
|
Economic |
|
|
|
Social |
|
|
|
Technical |
|
|
|
Legal |
|
|
|
Environmental |
|
|
If you require the report in an alternative format such as a Word document, please contact info@climatexchange.org.uk or 0131 651 4783.
© The University of Edinburgh
Prepared by Ricardo Energy & Environment on behalf of ClimateXChange, The University of Edinburgh. All rights reserved.
While every effort is made to ensure the information in this report is accurate, no legal responsibility is accepted for any errors, omissions, or misleading statements. The views expressed represent those of the author(s), and do not necessarily represent those of the host institutions or funders.
info@climatexchange.org.uk
+44(0)131 651 4783
@climatexchange_
www.climatexchange.org.uk
Update to the Climate Change Plan – Background Information and Key Issues | Scottish Parliament ↑
Draft Energy Strategy and Just Transition Plan (www.gov.scot) ↑
Just Transition Commission: A National Mission for a fairer, greener Scotland – gov.scot (www.gov.scot) ↑
How Does Climate Change Affect Agriculture? | Heifer International ↑
Climate change and agriculture – POST (parliament.uk) ↑
https://www.gov.uk/government/statistics/uk-local-authority-and-regional-greenhouse-gas-emissions-national-statistics-2005-to-2020 ↑
Gas from supply network ↑
‘Other’ fuels are aggregated in the NAEI publication and include coal, liquefied petroleum gas (LPG) and oils for static and mobile machinery. ↑
https://www.gov.scot/publications/results-scottish-agricultural-census-june-2021/documents/ ↑
Local authority to region lookup in Appendix A, section 9.1.2 ↑
https://assets.publishing.service.gov.uk/media/64a68222c531eb000c64ff3e/employment-based-energy-consumption-local-authority-mapping-2021.pdf ↑
Dairy Farm Energy – Teagasc | Agriculture and Food Development Authority ↑
Agriculture-Energy-Efficiency.pdf (windows.net) ↑
Ten Week Report (climatexchange.org.uk) ↑
CEMA_decarbonising_agriculture_27-04-22.pdf (cema-agri.org) ↑
Decarbonisation of mobile agricultural machinery in Scotland – an evidence review (climatexchange.org.uk) ↑
DESNZ PAT Summer 2023 Energy infrastructure and energy sources (publishing.service.gov.uk) ↑
Public has positive views of solar farms, finds government survey • Solar Energy UK ↑
The public’s perception of run-of-the-river hydropower across Europe – ScienceDirect ↑
Scottish Energy Statistics Hub ↑
Solar ticks the boxes for Scottish producer – Farmers Weekly ↑
Huge solar park planned for Scottish farmland – Farmers Weekly ↑
National Farmers Union, 2017. Electric tractors by 2020? Available at: A review of advanced vehicle technology in the agricultural sector ↑
Transport Scotland: £28 million for zero emission heavy duty vehicles ↑
Scottish Energy Statistics Hub ↑
Contracts for Difference (CfD) ↑
Scottish Power: Smart Export Guarantee ↑
Fielding and Matthews (2014) Review of implications of land use change on climate change mitigation and adaptation, ClimateXChange. Available at: https://www.climatexchange.org.uk/media/1471/review_of_the_climate_implications_of_land_use_change_.pdf ↑
Small Scale Renewables – Farming for a Better Climate ↑
The Renewable Energy Centre – Wind Power ↑
RHI0015 – Evidence on Renewable Heat Incentive in Great Britain (parliament.uk) ↑
RHI monthly deployment data: March 2023 (Quarterly edition) – GOV.UK (www.gov.uk) ↑
Biomass Strategy 2023 – GOV.UK (www.gov.uk) ↑
Bioenergy – Renewable and low carbon energy – gov.scot (www.gov.scot) ↑
climatexchange.org.uk/media/5276/cxc-comparing-scottish-bioenergy-supply-and-demand-in-the-context-of-net-zero-targets-february-2022.pdf ↑
Heat in Buildings Strategy – achieving net zero emissions in Scotland’s buildings – gov.scot (www.gov.scot) ↑
Heat pump installation installed to dry 30,000 tonnes of grain – Calibrate Energy Engineering ↑
Assuming that the UK grid electricity emissions factor is used for GHG reporting purposes. However, if the NAEI Point of Use electricity emissions factor is used for GHG reporting purposes the saving between heat pumps and direct electrification would be identical due to zero carbon emissions being attributed to electricity consumption in Scotland. ↑
Statistics: Energy consumption by sector – Scottish Renewables ↑
Scottish Energy Statistics Hub ↑
Scottish Energy Statistics Hub – Pipeline renewable capacity by planning stage ↑
Farm energy case study: Small-scale hydro, Dumfries – Farmers Weekly ↑
Hydro power scheme offers farming potential – Farmers Weekly ↑
Supporting documents – Hydrogen action plan – gov.scot (www.gov.scot) ↑
HydroGlen: transforming Glensaugh farm into a renewable powerhouse | The James Hutton Institute ↑
Land use: Policies for a Net Zero UK – Climate Change Committee (theccc.org.uk) ↑
Comparing Scottish bioenergy supply and demand in the context of Net-Zero targets (climatexchange.org.uk) ↑
Perennial energy crops and their potential in Scotland: evidence review (climatexchange.org.uk) ↑
Bioenergy Crops Better For Biodiversity Than Food-Based Agriculture | University of Southampton ↑
Small Islands Energy System Overview (hie.co.uk) ↑
Renewable energy in Scotland (parliament.uk) ↑
DG Connection Guides (dcode.org.uk) ↑
Renewables and Crofting: A Perspective on the Challenges for Developers from WJM ↑
Biomass burner offers farmer big grain dryer savings – Farmers Weekly (fwi.co.uk) ↑
Solar Panels in Scotland 2023 | Costs, Grants & Benefits (theecoexperts.co.uk) ↑
Renewable Energy Towards Net Zero – Sustainability Factsheet (bankofscotland.co.uk) ↑
Includes laws and regulations regarding product recycling and economic growth or any government initiative to stipulate Circular Economy drivers. ↑
How the UK public feels about renewable energy (climatexchange.org.uk) ↑
Net Zero Hydrogen Fund strands 1 and 2: Round 2 open to applications – GOV.UK (www.gov.uk) ↑
Hydrogen action plan: draft – gov.scot (www.gov.scot) ↑
HydroGlen: transforming Glensaugh farm into a renewable powerhouse | The James Hutton Institute ↑
Renewable Transport Fuel Obligation – GOV.UK (www.gov.uk) ↑
Wind energy in Scotland: current position and future plans – SPICe Spotlight | Solas air SPICe (spice-spotlight.scot) ↑
Poor Grid Connection and Planning Permission Restrictions Hampering De (nfus.org.uk) ↑
https://www.spenergynetworks.co.uk/pages/dg_spd_heat_maps_terms.aspx ↑
Grid connection charges in Scotland ‘must be reviewed as matter of urgency’ – Business Insider ↑
https://www.gov.scot/publications/results-scottish-agricultural-census-june-2021/pages/3/ ↑
https://www.gov.uk/government/collections/uk-local-authority-and-regional-greenhouse-gas-emissions-national-statistics ↑
https://assets.publishing.service.gov.uk/government/uploads/system/uploads/attachment_data/file/1166210/employment-based-energy-consumption-local-authority-mapping-2021.pdfhttps://assets.publishing.service.gov.uk/government/uploads/system/uploads/attachment_data/file/1166210/employment-based-energy-consumption-local-authority-mapping-2021.pdf ↑
https://www.gov.scot/publications/scottish-government-urban-rural-classification-2020/ ↑
https://nora.nerc.ac.uk/id/eprint/512448/1/N512448CR.pdf ↑
Ten Week Report (climatexchange.org.uk) ↑
Net Zero Hydrogen Fund strands 1 and 2: Round 2 open to applications – GOV.UK (www.gov.uk) ↑
Hydrogen action plan: draft – gov.scot (www.gov.scot) ↑
HydroGlen: transforming Glensaugh farm into a renewable powerhouse | The James Hutton Institute ↑
Renewable Transport Fuel Obligation – GOV.UK (www.gov.uk) ↑
Land use – getting the best from our land: strategy 2021 to 2026 – gov.scot (www.gov.scot) ↑