

Electricity system security of supply in Scotland
DOI: http://dx.doi.org/10.7488/era/3737
Executive Summary
Overview
Scotland’s electricity system is undergoing a transformation with rapid increases in installed wind and solar electricity generating capacity. This is coupled with the phase out of nuclear and unabated gas power stations.
This will impact on Scotland’s electricity system security of supply, which has historically relied on large, centralised fossil fuel power plants. These can ramp power production to meet demand, in addition to grid network connection to the rest of Great Britain. Here ‘security of supply’ refers to the ability of the system to reliably and continuously provide a sufficient amount of electricity to meet the demands of consumers.
In this report, we explore issues around security of supply in Scotland’s electricity system in the transition to net zero by 2045. We examine international examples of national and regional electricity systems transitioning to net zero and review the potential impact of electricity market reform. We use scenario modelling to quantify security of supply and import/export metrics for the expected technology pathway in Scotland.
The future security of supply of Scotland is subjected to stress tests, including disconnection of offshore wind farms; low variable renewable power output; unavailable gas power generation in Scotland; unavailable interconnectors; battery storage failures; and an unavailable connection to the rest of GB. The report also looks at the security of supply of a self-sufficient Scotland, with no interconnection to Europe or the rest of Great Britain, in addition to a low capacity and high demand scenario to further test Scotland’s future electricity system.
Key findings
- Examples of national and regional electricity systems operating with high proportions, in excess of 100%, of renewable electricity are typically dominated by hydropower and pumped hydro storage reservoirs. These are dispatchable and offer high levels of security of supply.
- Scotland and Denmark are leading examples of national electricity systems integrating large shares of variable renewable energy sources, but rely on imports with neighbouring countries.
- Potential changes to electricity market arrangements such as splitting the wholesale market, locational pricing and an enhanced capacity market could have impacts on future investment in renewables and flexibility technologies in Scotland.
- Under the System Transformation scenario there will be a reduction in traditional firm generation capacities in Scotland. This includes no nuclear and reduced gas power plant generation when changing to carbon capture and storage technology. However, these losses will be offset by vast increases in wind and solar installed capacity, as well as increasing low-carbon firm generation capacity in the form of biomass, hydrogen and abated gas power plants.
- Security of supply metrics for Scotland in the System Transformation scenario for the years up to 2045 were found to be within the current GB reliability standards and comparable to current levels. Security of supply in Scotland improves in the transition towards net zero by 2045 due to large increases in generation capacity and storage.
- Peak demand in Scotland is expected to rise from around 5000 MW in 2021 to around 9000 MW by 2045 but is exceeded by generation, even when considering expected availability in real time. While the generation capacity in Scotland may seem excessive in the context of security of supply in this scenario, it is utilised to decarbonise and provide security of supply to GB as a whole.
- Scotland will continue to be a net electricity exporter to the rest of GB and net exports will increase from current levels. There will be an increase in the level of import from the rest of GB due to increased demand, coupled with increased reliance on variable wind power generation, which leads to more imports during low wind periods.
- Testing of the future Scottish electricity system, assuming low installed capacity for thermal power plants, low B6 boundary expansion and high future peak demand, shows lower security of supply in 2030 than the GB reliability standard.
- In 2025 and 2030 disconnection with the rest of GB has the highest impact of all of the stress tests conducted, followed by unavailable interconnectors and gas supply issues. This implies that there is a high reliance on imports from and exports to the rest of GB in maintaining the capacity adequacy in Scotland. However, its significance is negligible from 2035, when there is a large increase in offshore wind capacity and additional capacity of battery storage, pumped hydro, hydrogen power plant and biomass.
- A self-sufficient Scotland with no connection to the rest of GB and no interconnector capacity would violate the GB reliability standard in the years 2025 and 2030, mainly due to periods of low wind and renewables output without sufficient dispatchable supply capacity. However, by 2035 the security of supply metrics are within historical values and improve further in the following years. We find 250 MW and 1000 MW of additional equivalent firm capacity would be needed in 2025 and 2030 to meet minimum reliability standards and historically typical standards respectively. This would be the equivalent of an additional 1,553 MW to 6,211 MW installed capacity of offshore wind.
Glossary
|
Black Start |
The procedure used to restore power in the event of a total or partial shutdown of the national electricity transmission system. |
|
CT (Community Transformation Scenario) |
A scenario from the FES that achieves the 2050 decarbonisation target in a decentralised energy landscape. |
|
De-rated Generation Capacity |
The amount of power that can be produced by a generation source after a reduction factor is applied to the installed capacity to reflect what is expected to be available in real time. |
|
Equivalent Firm Capacity (EFC) |
An assessment of the entire wind and solar PV fleet’s contribution to capacity adequacy, representing how much of 100% available conventional plant could theoretically replace the entire wind fleet and leave security of supply unchanged. |
|
FES (Future Energy Scenarios) |
A set of energy system scenarios for the UK, covering the period from now to 2050, developed in conjunction with the energy industry, to frame discussions and perform stress tests. They form the starting point for all transmission network and investment planning and are used to identify future operability challenges and potential solutions. |
|
Load Factor (or Capacity Factor) |
The amount of electricity generated by a plant or technology type across the year, expressed as a percentage of maximum possible generation. Load factors are calculated by dividing the total electricity output across the year by the maximum possible generation for each plant or technology type. |
|
Loss of Load Expectation (LOLE) |
The expected number of hours in a year when demand exceeds available generation before any emergency actions are taken. LOLE is calculated after all system warnings and System Operator (SO) balancing contracts have been exhausted. It is important to note that a certain level of loss of load does not necessarily result in blackouts, as actions can be taken without significant impacts on consumers. The UK Government’s Reliability Standard requires an LOLE of no more than 3 hours per year. |
|
Peak Demand |
The highest level of electricity demand in a fiscal year, which typically occurs around 5:30pm on a weekday between November and February. |
|
Security of Supply (SoS) |
A general term used to describe the maintenance of required energy flows to consumers at all times. Specific criteria are used across different fuels, and SoS can cover network resilience as well as adequacy more generally. |
|
ST (System Transformation Scenario) |
A scenario from the FES where the target of reaching net zero is achieved by a moderate level of societal change and a low-moderate level of decarbonisation. |
|
Variable Generation |
Types of generation that can only produce electricity when their primary energy source is available and driven by weather. For example, wind turbines can only generate when the wind is blowing. |
Introduction
Background and aims
Scotland is committed to net zero greenhouse gas emissions by 2045 through the Climate Change (Emissions Reduction Targets) (Scotland) Act 2019 [1]. This means net zero emissions across all sectors of the economy, including from the energy system. In the power sector, traditional thermal generation, such as nuclear power and gas power plants are being retired and there are ambitions for realising 8-11 GW offshore wind capacity by 2030 [2]. Under some net zero scenarios this could increase to more than 35 GW by 2045 in Scotland [3]. Additionally, under National Grid’s ‘Leading the Way’ scenario in Scotland solar PV rises from 0.5 GW in 2021 to 6 GW in 2045, and onshore wind rises from 9 GW in 2021 to 27 GW in 2045.
This raises the importance of security of supply in Scotland with an electrical system that has high levels of weather-dependent wind and solar energy. The transition to net zero brings new challenges to Scotland’s electricity system security of supply:
- Torness nuclear power plant is due to close before the end of this decade resulting in the loss of the baseload output from this electricity generator.
- Peterhead gas power station may close as an unabated gas power plant and be replaced by a gas power plant fitted with carbon capture and storage technology. It is uncertain whether new carbon capture power plants can be operated flexibly or will be required to produce electricity round-the-clock.
- Increased reliance on intermittent renewable energy sources causing greater disparity between generation and demand on hourly, daily, monthly, and seasonal timescales.
- Increased need for electrical network expansion and reinforcement to transport renewable electricity to high demand areas.
The emissions reduction pathway shown in the 2020 climate change plan update [4] accordingly sets out a vision for net zero emissions from the electricity sector by 2029.
- Investigate international examples of national electricity systems operating/moving towards reliance on renewables.
- Review expected/planned policy or regulatory developments, such as locational pricing, which could impact the future system.
- Assess technology developments needed in Scotland to ensure a secure and reliable supply of low and zero carbon electricity to 2045.
- Assess the likely impacts on transfers of electricity from/to Scotland and the rest of GB, in a Scottish electricity system powered almost entirely by intermittent renewables.
- Calculate additional volume and type of generation that would be required for Scotland to have an entirely self-sufficient system (also including black start capability).
Security of supply
Security of supply in electrical power systems is the ability to match supply and demand with high probability, both under normal and unexpected conditions. This includes the coldest periods when peak demand often occurs; during outages of large power plants or interconnectors; and dark, windless periods when there is low renewable generation.
Challenges for future security of supply
Meeting the peaks in electrical demand is key in determining security of supply. If this demand can be met with high probability, then it is likely that all other periods with lower demand can also met. However, in systems where a high proportion of generation is from variable renewable sources then there will also be periods when high generation coincides with lower demand, which can lead to excess generation. Periods of excess generation is not the focus of this report but it is recognised that this can also provide challenges in an electrical system, such as costs of constraints, and that these periods require reliance on flexibility technologies such as storage and interconnection.
Peak electrical demand is expected to grow in the UK[1] from around 60 GW seen for the past decade to 100 – 115 GW in 2050 [Figure 1]. These rises are strongly driven by electrification of heat and transport.
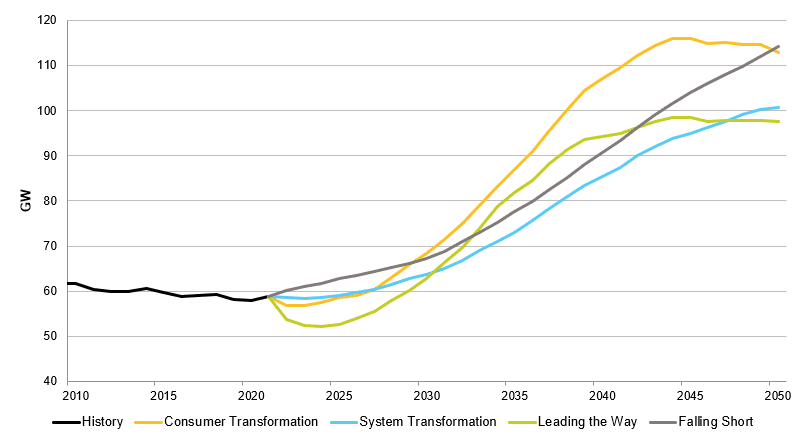
Figure 1 Peak demand during average cold spell increasing according to Future Energy Scenarios
In the future, it is expected that there will be increasing flows of power between Scotland and the rest of GB. The extensive wind resources, both onshore and offshore in Scotland, offer high and consistent wind speeds which makes Scotland an attractive place to build wind farms. However, electricity demand is far greater in England than in Scotland. In 2021 peak electricity demand was around 11 times higher across the rest of GB (55 GW) compared with Scotland (5 GW). National Grid’s ‘System Transformation’ scenario from the Future Energy Scenarios (FES) predicts broadly similar levels of installed wind capacity by 2050 (onshore and offshore) in the rest of GB (around 71 GW) and in Scotland (around 59 GW) [3]. This will lead to more reliance on the electrical network for transmitting the necessary electricity to ensure security of supply on both sides of the Scotland/England power system boundary.
Security of supply in the UK in National Grid’s Winter Outlook
Peak electricity demand often occurs during cold weather, and National Grid publish a winter outlook on security of supply every year. The report provides analyses of forecasted weather, expected power plant issues, and estimated import and export capabilities of interconnectors to Europe. The impacts on probability of the UK electricity system to be able to reliably meet electricity demand are also assessed. For more information on the 2022/23 winter outlook see Appendix 12.1.
Under normal conditions the electrical power system at present meets security of supply thresholds, but wider geopolitical issues have shown that it is vital to consider ‘unlikely’ stress events to the system. The winter outlook gives the current view on security of supply in the short-term but given that it takes years to build electrical power infrastructure it is important to consider how security of supply will evolve in the future.
The transition to net zero is informed by creating scenarios for the expansion of capacities of generation, demand, flexible technologies such as batteries and pumped hydro, and electrical networks.
Issues around operability
Black starts are the process for recovering the entire power grid following a highly unlikely[2] complete shutdown. However, not all generators have black-start capability. Conventionally, it is provided by a limited number of large coal, gas, and diesel generators. Following a highly unlikely event of a total or partial shutdown of the national electricity transmission network, black start plants can start independently, by using on-site equipment and fuel. They are independent of wider system input or specific weather conditions and can set up a skeleton network. Gradually different components can be reconnected to re-establish normal operation.
Wind turbines were previously viewed as unsuitable for black start due to dependence on external electricity before they can begin generating power. However, some of the latest designs are capable of self-starting. For example, in 2020, the 69 MW Dersalloch wind farm provided a black-start function through alternative control of power electronics using a virtual synchronous machine approach to restart part of the Scotland grid [5]. Battery storage, which has seen fast growth in UK, can also contribute to a black start. National Grid has committed to consider the provision of black start from non‑traditional generation technologies to facilitate the restoration of the future GB power system [6].
Aspects of security of supply also include the sufficient provision of ancillary services to stabilise power system operation. Ancillary services are not within the scope of our work, but a short commentary can be found in Appendix 12.2.
Scotland’s electricity system
Scotland’s electricity system operates as a part of the wider GB power system meaning electricity supply and demand must be always equal across the whole of GB. Generators anywhere in the GB power system can sell electricity to any demand, regardless of distances, through bilateral agreements and power exchange markets. It is then the responsibility of the energy system operator, National Grid ESO, to redispatch generation and demand to ensure that the physical electrical network can cope with the trades.
In the north of Scotland, the transmission and distribution network are operated and owned by Scottish & Southern Electricity Networks (SSEN). In the south of Scotland the transmission and distribution network are operated and owned by Scottish Power Transmission (SPT) and Scottish Power Energy Networks (SPEN) respectively. These transmission networks interface with the transmission network operated by National Grid Electricity Transmission which covers England and Wales, see Figure 2.
The boundary between Scotland and the rest of GB will be subject to future increased power transfer requirements due to additional onshore and offshore wind generation locating in Scotland. When there is low generation output in Scotland there may be power flowing from the rest of GB to Scotland to meet demand. However, these flows will be low compared to the flow from Scotland to the south so there is unlikely to be further requirements for network extension to support this on top of those for flows from Scotland. According to National Grids ETYS21 [7] there is currently a total of 6,100 MW transfer capability between Scotland and the rest of GB[3].
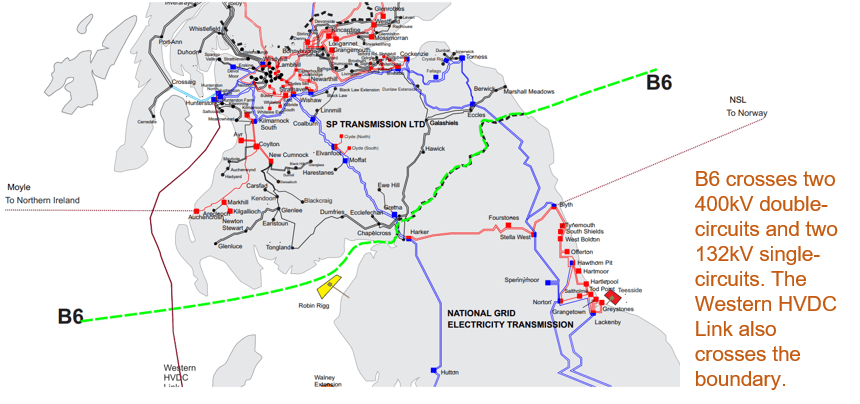
Figure 2 Network infrastructure in 2022 across the B6 boundary [7]
Table 1 outlines the installed firm generation and the corresponding de-rated capacity in Scotland for the year 2021. Firm generation is defined here as generation types which can generate when required, and independently of external factors such as weather conditions. We also account for “de-rated” capacities where aspects such as outage rates are incorporated. Table 1 shows the de-rated firm generation and interconnector capacity in Scotland in 2021 was 8,489 MW while peak demand was 4,890 MW. Peak demand as a percentage of total firm de-rated capacity in Scotland was therefore 58%, meaning that there was secure installed firm capacity which is likely to meet demand in 2021. Therefore, the current generation mix in Scotland’s electricity system provides sufficient security of supply.
In the next sections, we will investigate scenarios for what the future electricity system in Scotland will look like and undertake more detailed analysis into how security of supply may evolve.
Table 1 Total and de-rated firm generation and interconnector capacity (MW) in Scotland in 2021 (see Appendix 12.13 for de-rating factors)
|
Total (MW) |
De-rated (MW) | |
|
1,750[4] |
1,302 | |
|
Hydro |
1,779 |
1,621 |
|
Gas |
1,238 |
1,130 |
|
Pumped hydro |
740 |
704 |
|
Interconnector |
160[5] |
80[6] |
|
England and Wales grid connection |
6,100 |
3,0506 |
|
Biomass |
208 |
183 |
|
Sum of generation and interconnector firm capacity |
11,975 |
8,070 |
|
Peak demand in Scotland |
4,890 | |
|
Peak demand as percentage of sum of firm generation and interconnector capacity in Scotland |
41% |
61% |
|
System margin (Total rated or de-rated minus peak demand) |
7,085 |
3,180 |
100% renewable electricity systems
Renewable electricity generation technologies can be split into two categories related to the challenges of accommodating them into power grid [8] [9]:
- Variable Renewable Energy (VRE): dependent on short-term weather conditions, and typically use invertors to interface to the grid, for example, wind and solar; and
- Non-VRE technologies: dispatchable generation using synchronous generators including hydro with reservoir, biomass, geothermal, and concentrating solar power with thermal storage.
For VRE, additional flexible technologies such as dispatchable generation and energy storage are required to compensate intermittency. For non-VRE generation, the timing and volume of production can be adjusted to follow demands and market developments.
In this work, a 100% renewable electricity system is defined as: a system that operates exclusively on renewable energy sources, such as wind, solar, hydro, geothermal, and bioenergy. It does not rely on non-renewable sources such as fossil fuels, nuclear energy, or other non-sustainable sources of energy. The renewable sources can be instantaneous outputs from renewable generation, discharged energy stored previously from renewable electricity, or even imported renewable electricity from connections with neighbouring systems. 100% renewable electricity system is technically achievable, and this section explores countries and regions where they exist. However, there are exponentially increasing costs to reach 100% [10] [11] [12].
Several national electricity systems in the world already operate with, or close to, 100% renewable electricity. Details can be found in Appendix 12.3. Further detail on national electricity systems with high shares of VRE generation (operating with less than 100% renewable energy) can be found in Appendix 12.4. Details of regional electricity systems operating with near to 100% renewable electricity can be found in Appendix 12.5.
Table 2 summarises key features in countries and regions with high share of renewables in power production. For countries already operating with (or very close to) 100% renewable electricity supply, the share of VRE is actually very low. For countries and regions with a high share of VRE generation, despite future 100% renewable electricity targets, fossil fuel dispatchable generation is still playing a major role to provide flexibility – either from gas and coal plants within its system or imported through connections.
Table 2 Comparison between counties and regions with high share of renewable power production (2020 data, see Appendices 12.3 – 12.5)
|
Country or region |
Overall share of renewables in power production |
Share of VRE |
Main source of flexibility |
Main renewable type |
Total renewable generation exceeding annual electrical demand? |
|
Iceland |
100% |
None |
Hydropower plants with dams and reservoirs; |
Hydro (76%) |
No |
|
Paraguay |
99% |
<1% |
Hydropower plants with dams and reservoirs |
Hydro (99%) |
No |
|
Norway |
98% |
6.4% |
Hydropower plants with dams and reservoirs |
Hydro (92%) |
Over 109% in 2022 |
|
Denmark |
84% |
60% |
Coal, gas power plants and dispatchable CHP |
Wind |
No |
|
Ireland |
43% |
37.2% |
Gas power plant (51%) |
Wind |
No |
|
UK |
43% |
28% |
Gas power plant (36%) |
Wind |
No |
|
Germany |
44% |
37.5% |
Gas (12%) and coal (24%) power plant |
Wind solar PV (10%) |
No |
|
Orkney |
100% |
100% |
Interconnection with UK mainland |
Wind |
Over 130% |
|
Mecklenburg-Vorpommern in Germany |
87% |
87% |
Coal power plant and connection to neighbouring states |
Wind |
Over 170% |
|
Scotland |
57.0% |
82% |
Gas power plants, hydro and import/ export from the rest of UK (exports 20.3 TWh, imports 1.5 TWh in 2022) |
Wind |
No – 85% in 2021 (98% in 2020) Mild weather affecting generation |
Renewable electricity in Scotland
In 2020, the generation of renewable electricity in Scotland was equivalent to 97.4% of its gross electricity consumption. However, as shown in Figure 3, fossil fuel generation accounted for 15.6% and nuclear for 16.9% of the total electricity consumption in Scotland.

Figure 3 Proportion of electricity consumption by fuel in Scotland 2022 [13]
Scotland also exchanges large quantities of electricity with England, Wales, and Northern Ireland, mainly exporting rather than importing. To achieve a reliable and resilient 100% renewable electricity system in Scotland will require a set of low-carbon solutions to fill the increasing gap of flexibility requirement when more renewables are set to connect but fossil fuel and nuclear generation are phased out.
Changes to electricity markets
The transition to a net zero energy system requires large-scale building of new power infrastructure. For example, upgraded and new transmission lines to meet increasing power demands; large onshore and offshore wind farms in remote areas; dispatchable power plants running on Hydrogen or fitted with carbon capture and storage (CCS) technology; and flexible technologies which can respond at different timescales to increasingly variability such as pumped hydro storage.
The need for reform is exemplified by curtailment costs in the UK doubling in just one year, from £145 million in 2019 to £282 million 2020 [14]. Well-designed electricity markets should efficiently incentivise capacity investment as well as dispatch of generation and network assets to facilitate the net zero transition.
Significant reforms of electricity markets in the UK are required to enable the transition to a net zero energy system at low cost while ensuring security of supply. Potential changes to electricity market arrangements were outlined in a consultation document on potential reforms published by BEIS in July 2022, ‘Review of electricity market arrangements’, referred to as REMA [15]. The aim of REMA is to establish the electricity market reform necessary for a fully decarbonised electricity system by 2035, which supports the transition to an economy-wide net zero energy system by 2050. The reforms are intended to form the final critical step towards supporting the net zero transition.
The main approaches outlined in REMA are reforming to a net zero wholesale market; markets suited to the roll out of mass low-carbon power; incentivising investment in flexibility technologies such as by introducing locational pricing; ensuring capacity adequacy; and reforming ancillary services which enable operability. There is significant debate around the advantages and disadvantages of these potential reform measures. These approaches and potential impacts on the Scottish electricity system are outlined below. More background information on these reforms can be found in Appendix 12.6.
Technology development in Scotland to 2045
Scotland pathway using FES22
We use National Grid’s FES [3] as the baseline for technology development in Scotland to 2045. Based on FES pathways, we extracted and scrutinised data specifically for Scotland. FES is external to the Scottish Government and takes a UK-wide approach and may not necessarily be consistent with Scotland’s annual emission targets. However, it has a high level of detail including a regional breakdown which means that Scotland specific data can be extracted. We modelled metrics that provide a measure of security of supply and investigate this with an extended set of stress tests applied.
Four scenarios are presented in FES with three pathways meeting net zero targets and one pathway that falls short (see Appendix 12.7). This report uses the System Transformation scenario as the baseline for installed firm generation capacity, installed VRE generation capacity, peak demand, installed storage capacity, network connection to England and Wales and interconnectors to Northern Ireland and Norway. The System Transmission scenario was chosen because it represents a middle-ground in terms of the expansion of technologies compared to the Leading the Way and Falling Short scenarios. It is recognised that the System Transformation scenario is not aligned with Scottish Government policy with a high usage of hydrogen for heating. The following modifications were made to the System Transformation scenario:
- Offshore wind installed capacity by 2030 was changed from 7,000MW to 9,500 MW in line with Scottish Government targets.
- Interconnector capacity was extended from solely the 500 MW Moyle interconnector to this plus 700 MW interconnection to Norway (1200 MW overall) from 2035 which is in line with the Consumer Transformation scenario.
We used the PyPSA-GB model of the electrical power system for modelling FES data and for calculating power flow, see [16] and Appendix 12.9 for more details. Data is included for the years 2021, 2030, 2035, 2040, and 2045.
Installed firm generation
Figure 4 shows the installed firm generation capacity in Scotland for the System Transformation scenario.
- The last remaining nuclear power station in Scotland, Torness, closes in 2028.
- The existing Peterhead Combined Cycle Gas Turbine (CCGT) power plant is assumed to close in 2026 and open as Peterhead 2 with reduced capacity (1,200 MW CCGT to 910 MW CCGT + CCS) in 2027. The CCS Gas generation capacity is then doubled between 2040 and 2045 to 1,800 MW.
- Hydrogen powered generation capacity is also added with 690 MW by 2040 and 1,924 MW by 2045.
- Hydro power plants see moderate increases out to 2045.
- Significant increases in biomass generation capacity to around 1,900 MW in 2045.


Figure 4 Installed firm generation capacity (GW) in Scotland under the System Transformation scenario
Installed variable renewable generation
 Figure 5 shows the installed VRE generation capacity in Scotland for the System Transformation scenario.
Figure 5 Installed VRE generation capacity (GW) in Scotland under the System Transformation scenario. Offshore wind in 2030 has been changed to 9.5 GW to reflect Scottish Government ambitions of 8-11 GW
- Solar Photovoltaics capacity consistently grows from 462 MW in 2021 to almost 4,000 MW in 2045.
- Wind offshore is projected to grow from 1,700 MW in 2021 to 33,900 MW in 2045. The Scottish Government ambitions for 8,000-11,000 MW of offshore wind capacity by 2030 is not met in the System Transformation scenario. We modified the scenario to meet this target by inserting an installed capacity of 9,500 MW for offshore wind by 2030, in order to test the system under the conditions that this target is achieved.
- Wind onshore is projected to grow from 8,900 MW in 2021 to 23,900 MW in 2045.
Installed storage capacity

Figure 6 Installed storage capacity in Scotland under the System Transformation scenario.
- Pumped storage hydroelectric installed capacity forms the majority of installed storage capacity in Scotland in 2021. It is projected to rise to above 2,000 MW by 2040. There are several potential pumped storage projects in the pipeline: Coire Glas 1,500 MW [17], Red John 450 MW [18], and Corrievarkie 600 MW [19].
- Battery storage is projected to increase substantially from 124 MW in 2021 to 1,800 MW in 2030, followed by more modest growth to 2,100 MW by 2045.
- Compressed air energy storage (CAES) and liquid air energy storage (LAES) are also projected to have increasing capacity from 0.9 MW of CAES and 1.4 MW of LAES in 2021 to 1,100 MW of CAES and 553 MW of LAES in 2045.
The timescale of usage of these electrical storage types is constrained by the time it takes for each technology to fully discharge at full power. Batteries in FES are assumed to be suited to intra-day charging/discharging cycles. Pumped storage, CAES, and LAES are assumed to be capable of charging or discharging at maximum output for a longer period of time. These storage types are suited to system balancing on seconds, hours, and days timescales but these, bar pumped storage, are unlikely to be used for long-duration storage where balancing is required on weeks and months timescales due to a prolonged period of low VRE output. The FES scenarios mainly rely on hydrogen as a storage medium for these longer timescales.
Peak demand
Figure 7 shows the projected peak electricity demand in Scotland under the System Transformation scenario. There is a steady increase in peak demand from 4,600 MW[7] in 2021 to 8,700 MW in 2045.

Figure 7 Peak electrical demand during GB-wide average cold spell in Scotland under the System Transformation scenario.
The System Transformation scenario assumes that most heating is met by Hydrogen[8] (see Appendix 12.8), which results in a lower peak demand than in Consumer Transformation (heating is primarily electrified). The Consumer Transformation peak electricity demand for Scotland in 2045 is 11,300 MW due to most heating being met by electrification through heat pumps. This peak is 2,600 MW higher than the System Transformation assumption.
The peak demand shown here does not include electrical demand from electrolysers producing hydrogen. FES analysis assumes that electrolysers can be turned off during peak demand, and therefore, do not need to be included in calculations for security of supply metrics. However, our analysis does include this demand for power flow analysis and import and export calculations.
Transfer capability and interconnectors
The only interconnector from Scotland to outside GB is currently the Moyle interconnector to Northern Ireland. The Moyle interconnector was limited in transfer capability to 160 MW in 2021, but from 2022 has increased to its full capacity of 500 MW. We used the Consumer Transformation projections for interconnection expansion which includes a 700 MW connection to Norway by 2035 in addition to the 500 MW Moyle interconnector. This modification was made to ensure the baseline includes a higher interconnection for Scotland, and then a stress test on the unavailability of interconnectors could explore the impact on security of supply of no connection with Northern Ireland and Norway.
Transfer capability across the B6 boundary is projected to increase about four-fold from 6,100 MW in 2021 to 24,700 MW in 2040 for the System Transformation scenario. This increase is to enable power flow from the increased wind generation in Scotland to the rest of GB. Power flow to Scotland will be lower than from Scotland, so does not affect the transfer capability requirements. This scenario projection is substantially higher than increases in the Network Options Assessment (NOA) due to higher projections for installed capacity of renewable generation in Scotland. National Grid’s Electricity Ten Year Statement [7] includes more details on the future boundary transfer capability requirements for the B6 boundary which connects Scotland’s transmission network to the rest of GB.
Measuring security of supply
This report focuses on capacity adequacy as a measure of security of supply, which ensures that we always have enough energy to meet our needs. National Grid ESO publish capacity adequacy analysis for the GB system, often in its winter outlooks and FES reports. Given the scope of this work, a similar standard approach is used, with a focus on the Scotland system. The interaction with the rest of the GB system is modelled as flow across the boundaries.
The GB standard for generation adequacy uses the Loss of Load Expectation (LOLE) as the indicator of supply reliability, complemented by other relevant risk metrics which are detailed in Appendix 12.10. LOLE is defined as the expected number of hours over a period in which supply resources are insufficient to meet demand. It provides a measure of security of supply over a statistically long-term period, such as a year. The current reliability standard for LOLE in GB is set to no more than three hours in a year.
De-rated system margin is used as a proxy for risk of loss of supply. It is more useful as a measure of security of supply than installed capacity, as it accounts for the probability of a forced outage.
Security of supply metrics for System Transformation
De-rated system margin
An overview of the forecasted de-rated margin for Scottish system in the System Transformation scenario is shown in Figure 8. While peak demand sees steady growth, it is exceeded by the increase in available firm capacity (including the equivalent firm capacity of VRE) that can serve peak demand with high probability.

Figure 8 of de-rated supply capacity, peak demand and supply margin of Scotland for System Transformation from 2025 – 2045
The de-rated system margin increases from 2,200 MW in 2025 up to 12,200 MW in 2045. The capacity of wind shown in Figure 8 are de-rated using equivalent firm capacity factors (ranging between 13-17% in recent NG reports [20] [21] [22]). This represents the wind generators contribution to security of supply at stress events. Due to the significant amount of onshore and offshore wind added into the system, from 2035 onwards the de-rated wind capacity alone is higher than the peak demand. This ensures a very high level of de-rated system margin.
The GB supply margin under System Transformation can be found in Appendix 12.11.
Loss of load expectation

Figure 9 LOLE results for System Transformation in Scotland from 2021 – 2045
In line with the high de-rated system margin the calculated LOLE of Scotland’s electrical system stays at a very low level for the System Transformation scenario in all modelled years. The lower the LOLE number, the lower the risk of insufficient generation to meet demand. From our results, the LOLE increases marginally from 0.020 hours per year in 2025 to 0.023 in 2030. The increase is due to the anticipated closure of nuclear power stations over the 5-year period. This is still significantly below the 3 hours currently allowed in the GB reliability standard. The rise in LOLE between 2025 and 2030 could be higher but the addition of 7,870 MW wind capacity during this period helps to mitigate the effects of phasing out nuclear generation.
LOLE values from 2035 onwards are less than 0.0001, and so low that statistically the loss of load can be considered highly unlikely. This very low LOLE from 2035 is attributed to the significant influx of new electricity generation of various types in the Scottish system in the System Transformation scenario, e.g., Scotland’s wind capacity is projected to increase by over 25,000 MW, reaching 49,400 MW in 2035[9], the largest increase over a 5-year period in the scenario. Even with an Equivalent Firm Capacity (EPC) factor of 16.1%, wind energy alone is enough to provide reliable generation equivalent to 8,400 MW, enough to meet Scotland’s peak demand of 6,000 MW in 2035. The addition of biomass, Hydrogen, and pumped storage capacity from 1,223 MW in 2035 to 4,648 MW in 2040 significantly increases the dispatchable electricity sources in Scotland. This also exceeds the Scottish demand growth (1,500 MW) during that period, further enhancing supply security.
In practice, the actual target LOLE for the GB system operator has been less than 3 hours. The LOLE reported in National Grid’s Winter Outlook in 2021 and 2022 was 0.3 and 0.2 hrs/year for the GB system. The Scottish electrical system is modelled to have a lower LOLE than the GB system. In 2021 the Scottish LOLE was modelled as 0.108 hrs/year and this is expected to further decrease in the future.
Power dispatch
Power dispatch is the cost-optimised mechanism by which power needs and demands are balanced. Power dispatch modelling can be used to illustrate security of supply by demonstrating how generation and storage are being used to meet demand. Power dispatch modelling outputs are for the same 2-day peak period in 2045[10]. Interconnectors are included in the power flow calculation but excluded from modelled output figures to provide focus on the role of generators and storage.
Figure 10 shows the power dispatch of the Scottish electricity system for generation, storage, and export at the B6 boundary (where Scotland connects with the rest of GB) for the System Transformation scenario. Offshore and onshore wind power dominate generation, and there are large power export flows across the B6 boundary to the rest of GB. Storage technologies and biomass are dispatched, while exports continue to the rest of GB, during this high demand period. The equivalent power dispatch at the same peak period for GB[11] can be found in Appendix 12.11.

Figure 10 Power dispatch of Scotland for System Transformation in 2045 over 2-day peak period.
Imports and exports
Scotland supports the overall GB system with net exports of power across the B6 boundary. Figure 11 and Figure 12 show the monthly import (from rest of GB to Scotland) and exports (from Scotland to rest of GB) across the B6 boundary. Outputs were obtained by running the model with historical data for 2021 and the System Transformation scenario for 2045. Scotland is a net exporter to the rest of GB and exports will increase in future[12]. There will also be an increase in the level of import from the rest of GB to Scotland which could be due to increased demand coupled with increased reliance on intermittent power generation. The level of import and export have a seasonal pattern, with higher imports in the summer and higher exports in the winter. This is due to higher wind generation and demand in winter than in summer which results in more opportunities to export to the rest of GB.

Figure 11 B6 monthly import in 2021 and 2045 under the System Transformation scenario

Figure 12 B6 monthly export in 2021 and 2045 under the System Transformation scenario
Stress testing Scotland’s security of supply
Our modelling has shown that Scotland’s electricity system has a low probability of being unable to meet demand in the modelled years. However, the assumptions are based on a particular set of conditions and do not account for the full range of possible situations. Stress tests were used to test the security of supply of the Scottish electricity system beyond the original scenario conditions (Figure 13).
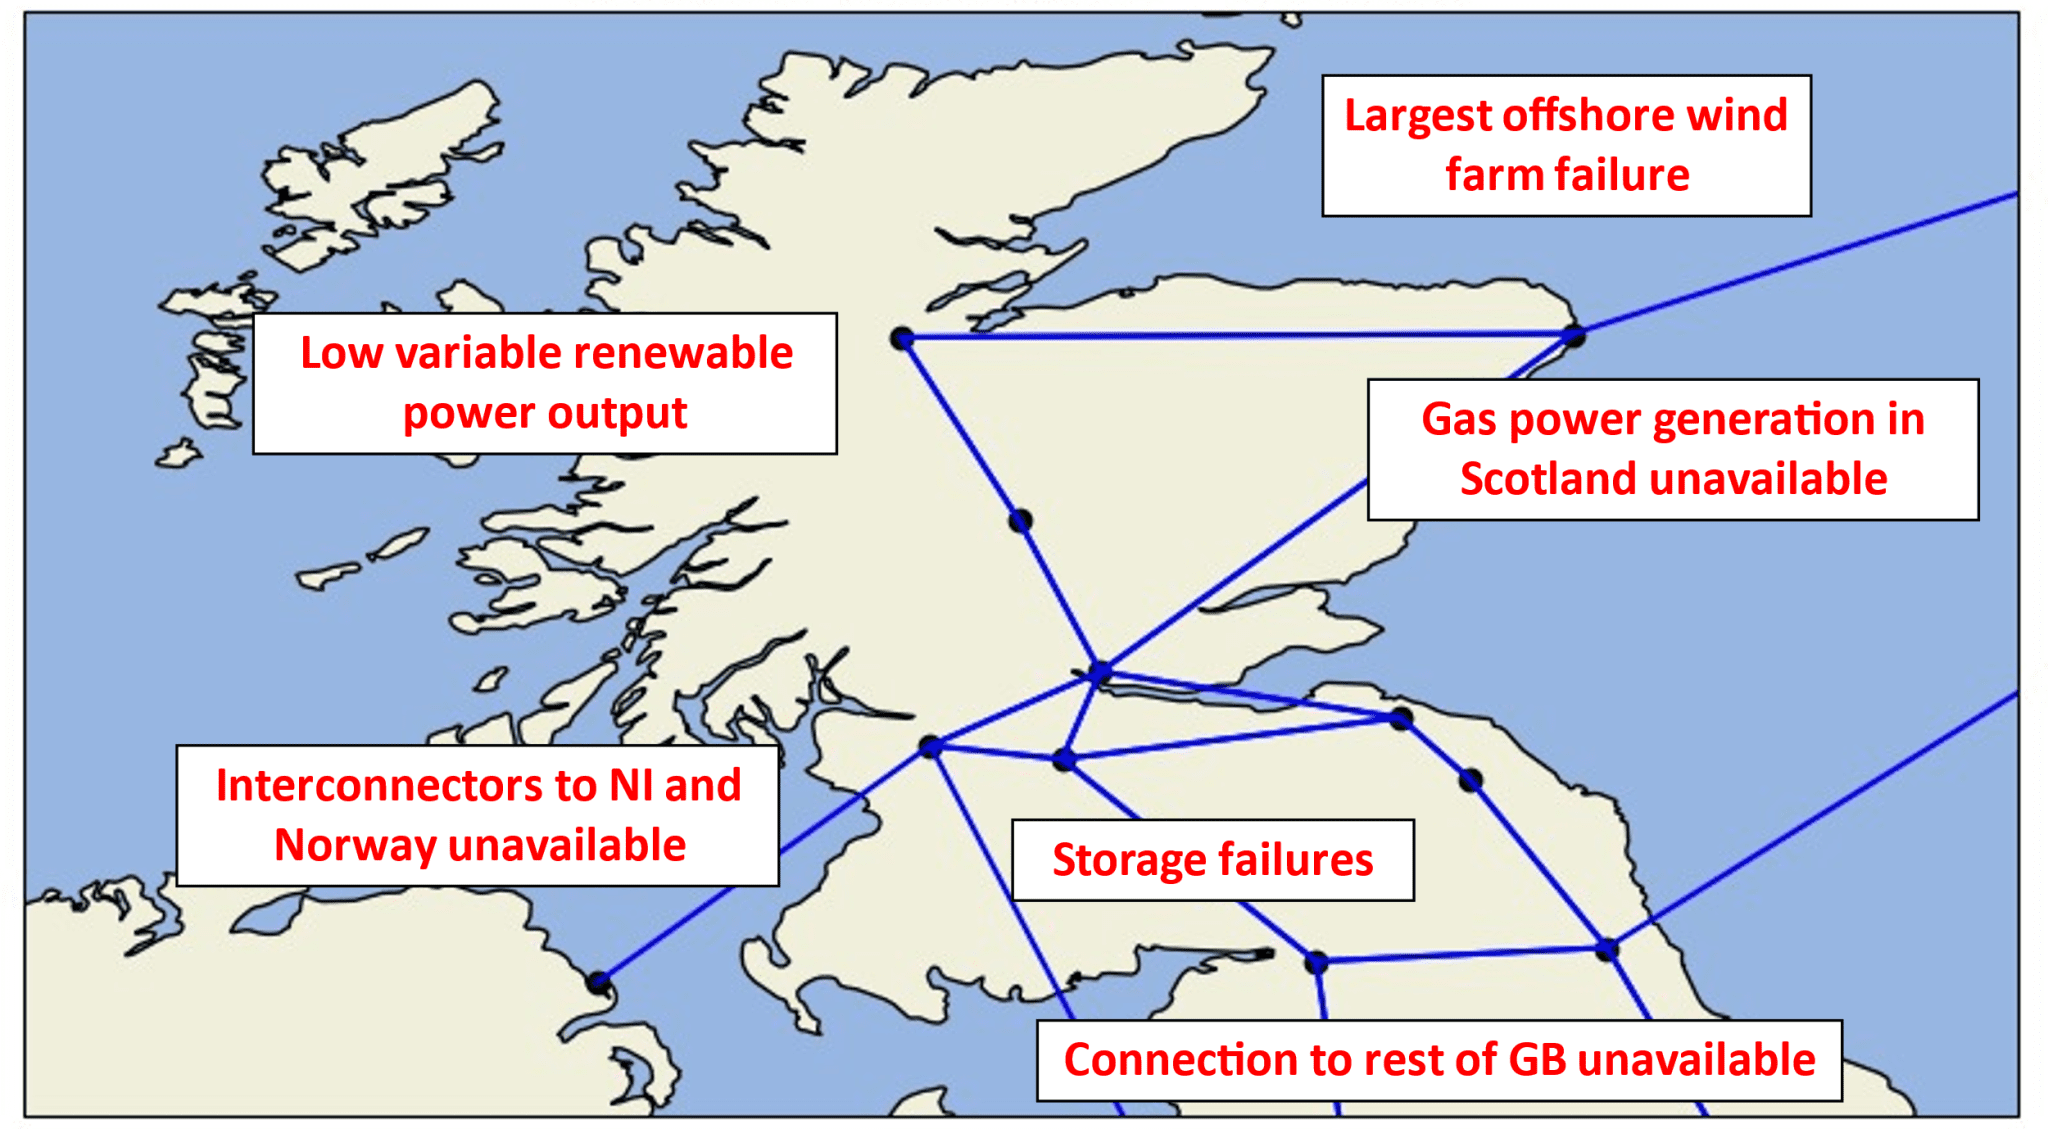
Figure 13 Network map of Scotland and stress tests scenarios
These are summarised relative to the System Transformation scenario base case in Table 3.
Table 3 Summary of assumptions used in stress testing scenarios
|
Scenario |
Description |
|
Base case |
The System Transformation scenario. |
|
Offshore wind farm failures |
Removes the contribution from offshore wind farms in Scotland with a worst-case assumption of 21,000 MW loss. |
|
Low VRES power output |
The contribution of VRE generators (onshore and offshore wind, PV, and hydro) in Scotland is limited to 20% of their potential outputs. |
|
Gas power generation in Scotland unavailable |
The generation capacity of CCGT, including CCS, in Scotland are set to zero. |
|
Interconnectors to NI and Norway unavailable |
Interconnector failure including both Scottish links to Norway and Northern Ireland. |
|
Storage failures |
The installed capacity of batteries in Scotland are set to zero. |
|
Connection to rest of GB unavailable |
The connection of Scotland to rest of GB across the B6 boundary is unavailable. |
We investigate the power flow for each of the stress tests and the security of supply metrics up to 2045. We also analyse the impact on imports and exports from/to Scotland. All stress tests are applied for 3 days either side of peak demand. All the stress events are applied to the base case independently, and are assumed to last the whole week in which the peak demand occurs.
Security of supply for the stress tests
Full outputs from stress tests can be found in Appendix 12.12. Figure 14 summarises the LOLE for all the stress test cases. During peak demand periods, the impact of unavailability of supply are higher than other times of the year. The LOLE for all stress tests is within the three hours/year reliability standard, and are below the modelled 2021 Scottish LOLE of 0.108 hrs/year, except for B6 failure in 2025 and 2030 and interconnector failure in 2030. The system from 2035 onwards is very secure with a low LOLE.
In 2025 and 2030 the stress test of disconnection with the rest of GB has the highest impact on the security of supply as measured by LOLE, followed by unavailable interconnectors and gas supply issues. This implies that the reliance of import from the rest of GB in maintaining the capacity adequacy in Scotland is more than the other supply types. However, its significance becomes negligible from 2035 due to a large increase in offshore wind capacity in the Scottish system and additional capacity from battery storage, pumped hydro, Hydrogen power plant, and biomass in subsequent years.

(a)
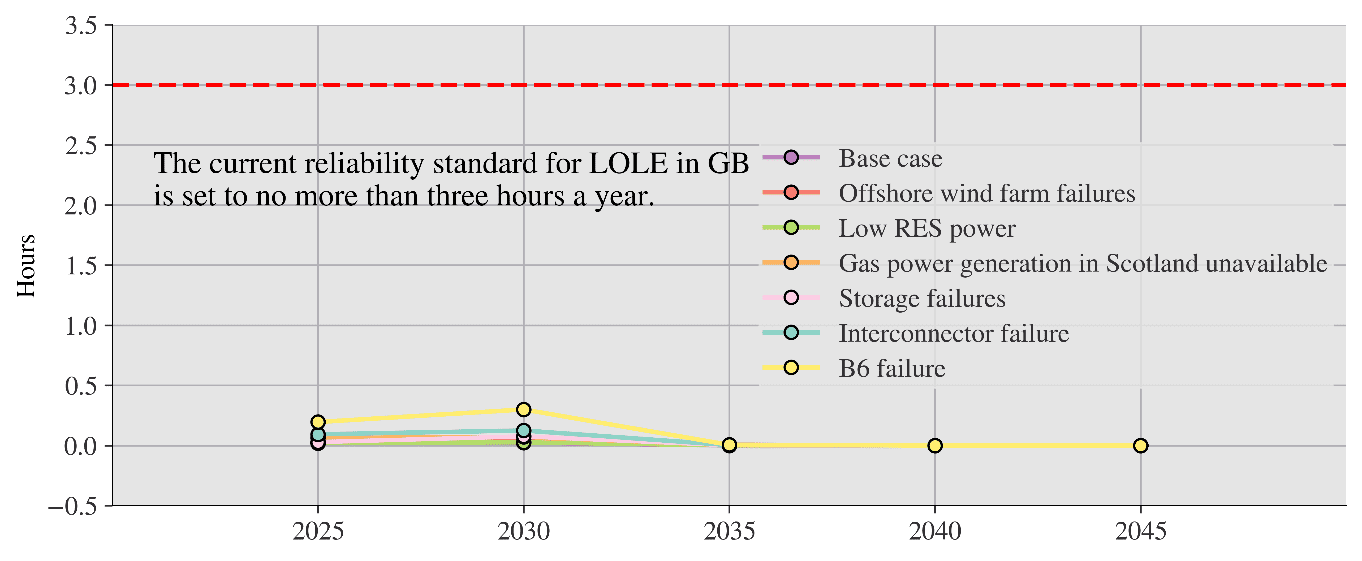
(b)
Figure 14 (a) LOLE for Scotland in the stress test cases (2025–2045); (b) GB 3h/yr limit added for comparison
Import and export for the stress tests
The stress tests have impacts on the imports and exports across the B6 boundary between Scotland and the rest of GB. Countries in Europe increasingly exchange power with each other, particularly to share cheap abundant electricity, as has been the case historically with France exporting nuclear power to central Europe and Denmark exporting wind power to Norway who can store this in their large pumped hydro schemes. Scotland shares an electricity market with the rest of GB but imports and exports are a useful measure of the dependence on the power exchange across the B6 boundary.
Figure 15 shows for each stress test the total import and export across the B6 boundary over the 6-day period the stress tests are applied, including the peak GB demand period in the middle of the 6 days. The base case in 2045 sees increases in imports due to closure of Torness nuclear power plant and reduced capacity of Peterhead.

Figure 15 Import and export for the stress tests across the B6 boundary
The stress tests for offshore wind farm failures, gas power generation in Scotland unavailability, battery failures, and interconnector issues result in increased imports into Scotland. The low VRES output stress test sees Scotland become a net importer over the 6-day period modelled. The following findings are identified:
- Offshore wind farm failures reduce total wind generation over the period resulting in higher imports and lower exports.
- The low VRES period reduces total wind generation by a greater degree than the offshore wind farm failure meaning that there are more imports than exports.
- Gas supply issues reduce the capability of Scotland to provide firm generation over the 6-day period, resulting in more periods where imports from the rest of GB are required, typically when there is low wind generation. This has minimal impact on imports and exports during the modelled period.
- Battery failure decreases the ability of the system to store excess renewable power generation to be utilised later during low VRES periods. This has minimal impact on imports and exports during the modelled period.
- Interconnector issues reduces exports of excess wind generation to Norway or Northern Ireland, at the same time as reducing imports from these countries to meet demand when there are higher electricity prices in Scotland. The result is slightly increased imports, and increased exports which are exported to the rest of GB rather than to Norway or NI.
Overall, the low VRES output period has the largest impact on imports and exports from/to Scotland, followed by the offshore wind farm failures. This highlights the importance of wind power generation in the future Scotland electricity system. Interconnectors to NI and Norway have the next biggest impact, but this will likely be more impactful under other FES scenarios which see larger increases in interconnector capacity. The battery failure and gas supply issues have minimal impact on the imports and exports in the modelled period.
Self-sufficient Scotland
In this section we assess the impacts of Scotland having an entirely self-sufficient future electrical system. We modified our original model (Table 3) to consider Scotland as an isolated electrical network in the self-sufficient base case. All interconnections to Northern Ireland and Norway and all transmission links to the rest of GB across B6 were removed. After calculating the LOLE in this new base case, we conducted a stress test. We also stress test with low VRES power[13] and examine the additional capacity required to reduce LOLE to the 3-hour GB reliability standard.

Figure 16 LOLE of self-sufficient Scotland system in base case, low renewable output stress case and with additional firm capacities
The changes in level of capacity adequacy for a self-sufficient Scotland is given in Figure 16. Violation of the 3 hours GB standard occurs in the base case in the years 2025 and 2030, but the LOLE is less than 0.18 hours in 2035 and decreases in the following years. Figure 16 also shows the additional firm capacity needed to reduce the LOLE in 2030 to within the minimum required 3 hours, and to a more conservative range, for example, the 0.3 hours reported in the 2022 Winter Outlook[14].
To achieve LOLE of 3 or 0.3 hours an additional 250 MW or 1000 MW equivalent firm capacity is needed respectively. Several alternative supply types can each provide an equivalent (de-rated) 250 MW of additional firm capacity:
- 274 MW installed capacity of CCGT with CSS.
- 380 MW battery storage 3 hours storage duration of 1140 MWh.
- 1,553 MW of installed capacity of offshore wind.
For 1000 MW additional firm capacity:
- 1,095 MW installed capacity of CCGT with CCS.
- 1,510 MW battery storage with 3 hours storage duration of 4,530 MWh.
- 6,211 MW of installed capacity of offshore wind.
The increase in offshore wind capacity in the base case is much higher than the additional installed capacity of wind required above. Therefore, as shown in Figure 17, the LOLE in 2035 is well within the acceptable range.
In a self-sufficient Scotland the share of wind in the total supply mix becomes more significant. Under the low VRES power output stress test, the LOLE increases to 6.8 hours in 2025 and 5.6 in 2030 but decreases to 0.32 hours in 2035 and reduces further in 2040 and 2045. The low LOLE in 2035 is due to a 25,000 MW increase in installed wind capacity from 2030.
Even after scaling down to 20% of VRES potential power output, there is still enough contribution from wind generation to serve the peak demand. Increases in biomass, hydrogen, and pumped storage capacity in 2040 and 2050 make non-variable supply alone sufficient to meet peak demand, further reducing the LOLE in the later years under the low VRES stress case. With 400 MW additional firm capacity can bring the LOLE to within 3 hours in 2025 and 2030. This is 150 MW more than is needed in the self-sufficient base case.
Black start capability
Removing interconnections and links to England may result in the loss of access to generators that are capable of providing black start. However, it does not necessarily imply that the black start capacity in Scotland is insufficient. The System Transformation scenario projects a significant increase in the capacity of hydro, battery storage, and pump-hydro storage in Scotland, which offer good black start capabilities. These sources have a combined capacity of 4,368 MW in 2030, which will increase to 6,023 MW in 2045, accounting for more than half of peak demand. Whether these assets are sufficient for black start depends on conducting simulations or tests of the system under various scenarios. It is also crucial to regularly review and update the black start procedures to ensure that they remain effective and relevant.
Low capacity and high demand scenario
We further tested the system, modifying the base case (System Transformation) scenario by removing future thermal power plants (i.e., hydrogen, gas and biomass CCS); using the more conservative ETYS21 [7] assumptions on B6 boundary expansion; and increasing peak demand to those in the Consumer Transformation Scenario. Table 4 shows the resulting modifications to the base case (see Appendix 12.18 for full dataset). We then show results for the de-rated system margin, LOLE, stress tests, and imports and exports.
Table 4 Modifications to System Transformation Base Case for the low capacity and high demand scenario
(Base Case capacities in brackets)
|
Installed capacity (MW) |
2021 |
2030 |
2035 |
2040 |
2045 |
|
Gas (including CCS) |
1,238 |
0 (969) |
0 (969) |
0 (910) |
0 (1,810) |
|
Biomass |
208 |
251 |
230 |
230 (1,946) |
230 (1,894) |
|
Hydrogen |
0 |
0 (43) |
0 (43) |
0 (690) |
0 (1,924) |
|
B6 connection |
6,100 |
11,500 (17,604) |
16,900 (22,238) |
16,900 (24,662) |
16,900 (24,662) |
|
Peak demand in Scotland |
4,600 |
5,900 (5,200) |
8,000 (6,000) |
10,200 (7,500) |
11,300 (8,700) |
De-rated system margin
In the low capacity and high demand scenario, the de-rated system margin increases from 1,400 MW in 2025 to 4,500 MW in 2045, with a decrease in 2030 due to the assumed closure of all gas and nuclear generation in Scotland between 2025 and 2030. In the base case scenario, the gas CCS generation would have provided an additional de-rated capacity of approximately 1,600 MW in 2045.
The de-rated margin as a percentage of peak demand under the low capacity and high demand scenario between 2025 and 2045 is on average 32%. This is lower than the average 90% under the original base case scenario.

Figure 17 Installed firm generation capacity (GW) in Scotland under the low capacity and high demand scenario.
Loss of load expectation

Figure 18 LOLE results for low capacity and high demand scenario in Scotland from 2021 – 2045. GB Reliability standard 3hrs/y
The LOLE of the low capacity and high demand scenario, as illustrated in Figure 18, is considerably higher than the base case scenario (Figure 9) in all future years.
The year 2030 shows a significant increase in LOLE due to the closure of all gas and nuclear power stations, resulting in a LOLE of 6.3 hours/year which is higher than the GB reliability standard of 3 hours/year. Potential options for addressing this include keeping gas generation running for additional years while waiting for further renewable generation deployment or incentivising the development of additional storage and renewable generation before 2030.
By 2035 the subsequent strong growth of renewable generation capacity brings the LOLE back below the GB reliability standard. This is particularly due to an additional offshore capacity of approximately 17,300 MW from 2030 to 2035. As wind generation and storage capacity continue to increase, LOLE drops further from 2 hours in 2035 to 1.2 hours in 2045.
The lowest LOLE in the low capacity and high demand scenario is 1.2 hours/year in 2045, while in the original base case scenario, it is 0.0001 hours/year. This difference can be attributed to the exclusion of natural gas, hydrogen, and biomass, as well as higher demand. LOLE after 2030 in the low capacity and high demand scenario is relatively high compared to historical Scottish LOLE, such as 0.108 hrs/year in 2021. While this shows an increased risk of interruption to supply, it does not necessarily imply that such a shortage event will occur as it is still below the GB reliability standard.
Security of supply for the stress tests

Figure 19 LOLE for Scotland in the stress test cases under the low capacity and high demand scenario (2025–2045). GB Reliability standard 3hrs/y. LOLE 0.108 hrs/y of 2021 Scottish system
Except for the year of 2030 and the case of B6 failure in 2030-2045, all stress tests are within the GB reliability standard of three hours per year, but still greatly exceed the historical Scottish and GB LOLE in 2021, as presented in Figure 19. The disconnection from the rest of the GB stress test as illustrated using the ‘B6 Failure’ case has the most significant impact on the security of supply as measured by LOLE, far more than other test cases. LOLE of the other stress test cases are not significantly different from each other, with the offshore wind farm failure test highest, followed by unavailable interconnectors. This suggests that maintaining capacity adequacy in Scotland is highly dependent on imports from the rest of GB in this scenario.
The role of the B6 connecting Scotland to the rest of GB is more significant for security of supply in the low capacity and high demand scenario compared to the base case (System Transformation) scenario. The import capacity capability to Scotland across the B6 boundary is the main supply source after the renewable generation capacity in Scotland. In contrast, in the base case scenario, there is considerable capacity of CCS gas, biomass, and hydrogen generation, along with the B6 import capability, which can contribute to the security of supply.
Imports and exports
Imports (from rest of GB to Scotland) are higher and exports (from Scotland to rest of GB) are lower for the low capacity and high demand scenario compared to the base case scenario. This trend is consistent to 2045, which is shown in Figure 20 for imports and Figure 21 for exports. Over the year both scenarios have net exports of power across the B6 boundary. These results are due to the decreased generation and B6 boundary transfer capacity, and further highlight the greater importance of the B6 boundary in the low capacity and high demand scenario for security of supply.
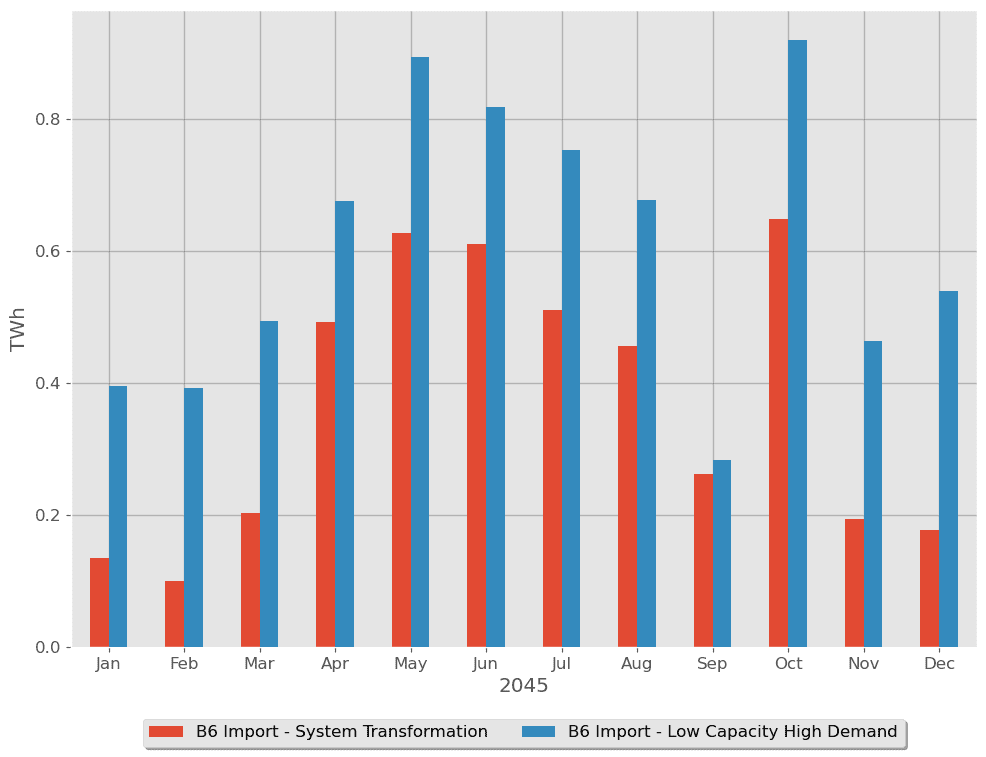
Figure 20 B6 monthly import in 2045 under the base case and low capacity and high demand scenario
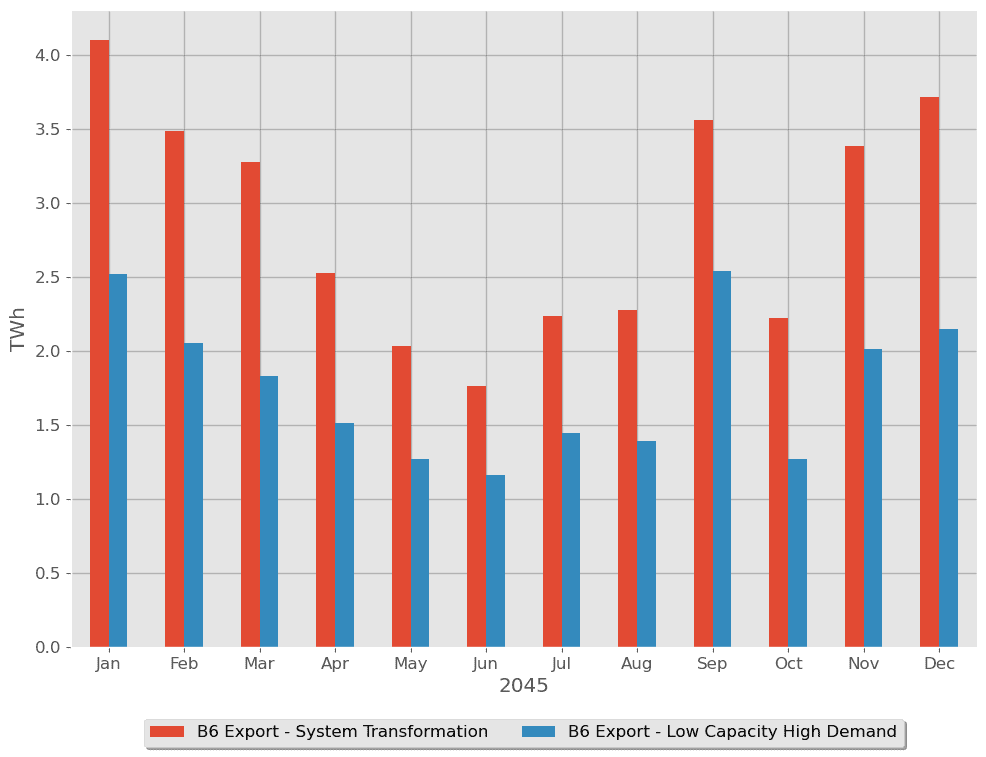 Figure 21 B6 monthly export in 2045 under the base case and low capacity and high demand scenario
Figure 22 shows the import and exports for the stress tests for the low capacity and high demand scenario. There is a reduced level of exports in these stress periods compared to the System Transformation base case, due to the lower generation capacity from hydrogen, gas CCS, and biomass. The greater reliance on VRES and the B6 boundary is highlighted by the high levels of import required for the low RES output stress test.
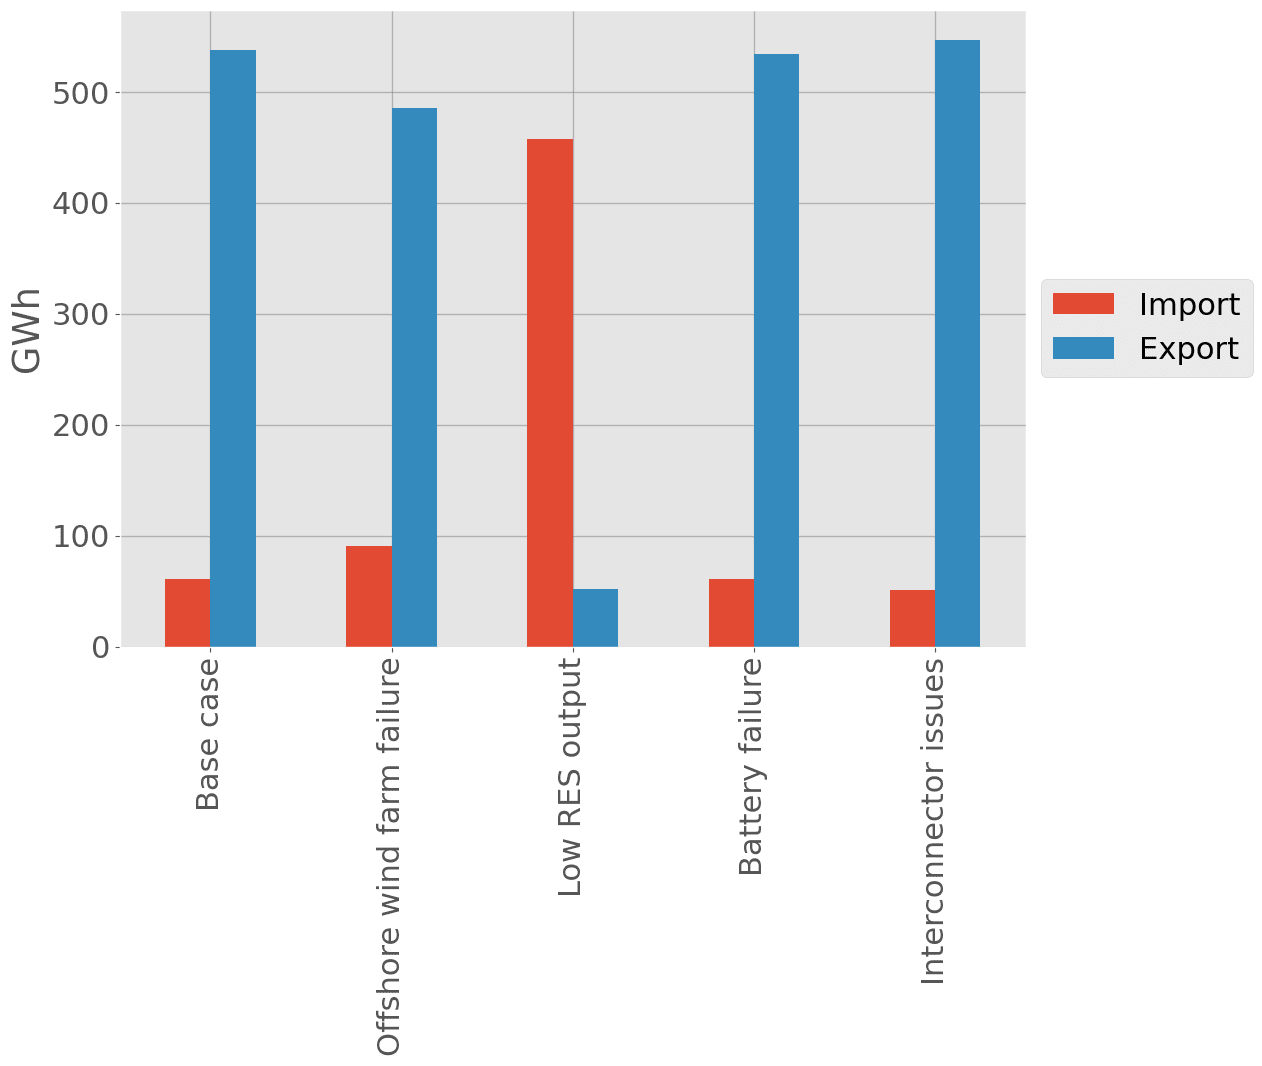
Figure 22 Import and exports in 2045 for 6-day period for stress tests in low capacity and high demand scenario
Conclusions
Lessons learned from national and regional electricity systems operating with close to 100% renewable energy sources:
- Several national and regional electricity systems operate at, or close to, 100% renewable electricity. However, these countries typically rely on dispatchable (non-VRE) renewable sources such as hydropower and storage reservoirs to generate and store electricity. These dispatchable renewable resources are only available at the required scale in a few countries. In Scotland, the most available renewable resource is wind, which is a variable source of energy.
- There are fewer examples of national electricity systems that operate with a high proportion of variable wind and solar energy shares. Denmark has the highest overall share of renewable electricity at 84%, with a high proportion from variable renewable sources and wind at 60% of total electricity production.
- Scotland has high wind generation, which makes up around 49% of total electricity generation, and relies on imports and exports with the rest of GB. It is most closely comparable to Denmark, which also makes extensive use of connection to neighbouring countries.
Changes to electricity market arrangements:
- Current GB electricity market arrangements are not suited to the net zero transition and potential reforms have been set out, which can enable a fully decarbonised electricity system by 2035. It is too early in the process to see a path for which reforms will be implemented and specify the impact they will have on security of supply.
- Splitting the wholesale market could improve the long-term sustainability of investing in renewable power in Scotland. However, it is possible that other reform proposals can provide the benefits outlined, and there could be a lack of additionality.
- Locational pricing might have the impact of depressing prices received by generators in Scotland as locational prices could be higher in England than in Scotland. Wind farms may require additional subsidy to be built in Scotland under locational pricing.
- A potential enhanced capacity market should take account of the issues specific to Scotland, while the Scottish Government should be an important stakeholder in strategic reserve decisions.
Technology pathway to net zero in Scotland in 2045:
- We have analysed the technology pathway according to the System Transformation scenario out to 2045 for Scotland. We found that security of supply metrics for Scotland in this scenario is well within the current GB reliability standards and comparable to current levels.
- There will be a reduction in traditional firm generation capacities (no nuclear and CCGT power plant generation capacity reduced when changing to CCS technology). However, these losses are offset by vast increases in wind and solar installed capacity, which can still provide security of supply, as well as increasing low-carbon firm generation capacity in the form of biomass, hydrogen and CCGT, with CCS power plants closer to 2045. Security of supply is further enhanced by the installation of battery, pumped hydro, liquid air and compressed air energy storage.
- Peak demand in Scotland is expected to rise to around 9,000 MW by 2045 but the de-rated system margin still increases from 2,200 MW in 2025 up to 12,200 MW in 2045, which shows there is sufficient firm generation. This was further verified by power dispatch simulation.
- The future Scottish electricity system has security of supply under the System Transformation scenario, but this cannot be directly assumed for the rest of GB supply and demand will likely continue to be balanced at GB-level by National Grid as the energy system operator. Therefore, while the generation capacity in Scotland may seem excessive in the context of security of supply, it will be utilised to decarbonise the rest of GB’s electrical system.
- We have further tested the future Scottish electricity system by modifying the System Transformation scenario: removing future thermal power plants; using more conservative B6 boundary expansion assumptions; and increasing peak demand. In this low capacity and high demand scenario security of supply in 2030 is worse (LOLE of 6.3 hours/year) than the GB reliability standard (LOLE of 3 hours/year).
- Beyond 2030 security of supply increases in the low capacity and high demand scenario but is relatively high compared to historical Scottish security of supply.
- Except for the year of 2030 and B6 failure in 2030-2045, all stress tests are within the GB reliability standard of three hours per year, but still greatly exceed the historical Scottish and GB security of supply in 2021.
Imports and exports between Scotland and the rest of GB:
- The System Transformation scenario requires a four-fold increase in transfer capability between Scotland and the rest of GB, from 6,100 MW in 2021 to 24,700 MW in 2045.
- Scotland will continue to be a net exporter to the rest of GB, and both total and net exports will increase. There are periods when Scotland will import only because it is economic to do so, rather than due to lack of local supply. There will be an increase in the level of import from the rest of GB due to increased demand coupled with the increased reliance on wind power generation.
- A period of low wind and solar generation has the largest impact on imports and exports from/to Scotland, followed by offshore wind farm failures. This highlights the importance of wind power generation in the future Scotland electricity system.
- Problems with interconnectors to Northern Ireland and Norway have the next biggest impact, but this will likely be more impactful if we see larger increases in interconnector capacity. Battery failure and gas supply issues have minimal impact on the imports and exports in the modelled period.
- Imports from rest of GB to Scotland are higher and exports from Scotland to rest of GB are lower for the low capacity and high demand scenario than for the System Transformation scenario. High levels of import are required for the low RES output stress test, illustrating the greater reliance on VRES and the B6 boundary in this scenario.
A self-sufficient Scotland:
- A self-sufficient Scotland with no connection to the rest of GB and no interconnector capacity to Northern Ireland or Norway was found to violate the 3 hours GB reliability standard in the years 2025 and 2030. However, by 2035 the reliability is within historical values and decreases in the following years.
- We find 250 MW and 1000 MW of additional equivalent firm capacity is needed in 2025 and 2030 to meet the reliability standard of 3 hours or recent values of 0.3 hours respectively. This can be achieved with the addition of 1,553 MW (to meet 3 hours) and 6,211 MW (to meet 0.3 hour) of installed capacity of offshore wind.
- The projected system beyond 2040 can meet reliability standards even after scaling down wind and solar generation to 20% of its potential output around the peak demand period. 400 MW additional equivalent firm capacity can bring the reliability standard to within 3 hours in 2025 and 2030, which is only 150 MW more than is needed in the self-sufficient System Transformation base case.
References
|
[1] |
Scottish Parliament, “Climate Change (Scotland) Act,” 2009 (Amended 2019). [Online]. Available: https://www.legislation.gov.uk/asp/2009/12. [Accessed February 2023]. |
|
[2] |
“Offshore wind policy statement,” 2020. [Online]. Available: https://www.gov.scot/publications/offshore-wind-policy-statement/. |
|
[3] |
National Grid ESO, “Future Energy Scenarios (FES 2022),” 2022. [Online]. Available: https://www.nationalgrideso.com/future-energy/future-energy-scenarios. |
|
[4] |
“Climate Change Plan update 2020,” [Online]. Available: https://www.gov.scot/publications/securing-green-recovery-path-net-zero-update-climate-change-plan-20182032/. |
|
[5] |
“ScottishPower completes black start project using 69-MW wind farm,” 2020. [Online]. Available: https://renewablesnow.com/news/scottishpower-completes-black-start-project-using-69-mw-wind-farm-719904/. |
|
[6] |
National Grid ESO, “Black Start from Non‑Traditional Generation Technologies,” [Online]. Available: https://www.nationalgrideso.com/document/148201/download. |
|
[7] |
National Grid ESO, “Electricity Ten Year Statement,” 2021. [Online]. Available: https://www.nationalgrideso.com/research-publications/etys. |
|
[8] |
P. Denholm and D. J. Arent, “The challenges of achieving a 100% renewable electricity system in the United States,” Joule, vol. 5, no. 6, 2021. |
|
[9] |
B. Kroposki and B. Johnson, “Achieving a 100% Renewable Grid: Operating Electric Power Systems with Extremely High Levels of Variable Renewable Energy,” IEEE Power and Energy Magazine, vol. 15, no. 2, pp. 61-73, 2017. |
|
[10] |
T. Mai, P. Denholm, P. Brown and W. Cole, “Getting to 100%: Six strategies for the challenging last 10%,” Joule, vol. 9, p. 6, 2022. |
|
[11] |
W. Zappa, M. Junginger and M. van den Broek, “Is a 100% renewable European power system feasible by 2050?,” Applied Energy, no. 233-234, 2019. |
|
[12] |
D. Bogdanov, J. Farfan and K. Sadovskaia, “Radical transformation pathway towards sustainable electricity via evolutionary steps,” Nature Communications, 2019. |
|
[13] |
“Energy Statistics for Scotland Q1 2021 Figures,” [Online]. Available: https://www.gov.scot/binaries/content/documents/govscot/publications/statistics/2018/10/quarterly-energy-statistics-bulletins/documents/energy-statistics-summary—june-2021/energy-statistics-summary—june-2021/govscot%3Adocument/Scotland%2BEnergy%2BStat. |
|
[14] |
“Q4 2020: Record Wind Output And Curtailment,” [Online]. Available: https://reports.electricinsights.co.uk/q4-2020/record-wind-output-and-curtailment/#:~:text=3.8%20TWh%20of%20electricity%20was,power%20every%20home%20in%20Wales.&text=Between%202015%20and%202019%2C%20curtailment,around%20%C2%A310%20per%20household.. |
|
[15] |
BEIS, “Review of electricity market arrangements,” [Online]. Available: https://www.gov.uk/government/consultations/review-of-electricity-market-arrangements. |
|
[16] |
“ PyPSA-GB:: An open source model of the GB power system for simulating future energy scenarios,” 2022. [Online]. Available: https://pypsa-gb.netlify.app/. |
|
[17] |
Coire Glas, “The Case for Pumped Hydro Storage,” [Online]. Available: https://www.coireglas.com/. |
|
[18] |
“Red John Pumped Storage Hydro Scheme,” [Online]. Available: https://www.redjohnpsh.co.uk/. |
|
[19] |
“Corrievarkie Pump Storage Hydro Scheme,” [Online]. Available: http://www.corrievarkiepsh.co.uk/. |
|
[20] |
National Grid ESO, “De-rating Factor Methodology for Renewables Participation in the Capacity Market,” 2019. [Online]. Available: https://www.emrdeliverybody.com/Prequalification/EMR%20DB%20Consultation%20response%20-%20De-rating%20Factor%20Methodology%20for%20Renewables%20Participation%20in%20the%20CM.pdf. |
|
[21] |
National Grid ESO, “ Electricity Capacity Report 2021,” [Online]. Available: https://www.emrdeliverybody.com/Capacity%20Markets%20Document%20Library/Electricity%20Capacity%20Report%202021.pdf. |
|
[22] |
National Grid ESO, “Winter Outlook 2022/23,” [Online]. Available: https://www.nationalgrideso.com/research-publications/winter-outlook. |
|
[23] |
International Energy Agency (IEA), “IEA Global energy review 2021,” [Online]. Available: https://www.iea.org/reports/global-energy-review-2021. |
|
[24] |
IRENA, “Renewable energy statistics 2021,” [Online]. Available: https://www.irena.org/publications/2021/Aug/Renewable-energy-statistics-2021. |
|
[25] |
Royal Norwegian Ministry of Petroleum and Energy, “Security of electricity supply,” 2019. [Online]. Available: https://energifaktanorge.no/en/norsk-energiforsyning/forsyningssikkerhet/#operational-security. |
|
[26] |
eurostat, “Production of electricity by source 2020 in the EU,” [Online]. Available: https://ec.europa.eu/eurostat/cache/infographs/energy/bloc-3b.html?lang=en. |
|
[27] |
Danish Energy Agency, “Development and Role of Flexibility in the Danish Power System,” 2022. [Online]. Available: https://ens.dk/sites/ens.dk/files/Globalcooperation/development_and_role_of_flexibility_in_the_danish_power_system.pdf. |
|
[28] |
“ReFLEX Orkney,” [Online]. Available: https://www.reflexorkney.co.uk/. |
|
[29] |
“’Postcode Pricing’ threatens GB renewable energy growth,” [Online]. Available: https://www.scottishrenewables.com/news/1049-postcode-pricing-threatens-gb-renewable-energy-growth. |
|
[30] |
National Grid ESO, “New ESO report finds electricity market reform critical for delivery of future system that is affordable, secure and clean,” [Online]. Available: https://www.nationalgrideso.com/news/new-eso-report-finds-electricity-market-reform-critical-delivery-future-system-affordable. |
|
[31] |
Energy System Catapult, “Locational energy pricing in the GB power market,” [Online]. Available: https://es.catapult.org.uk/report/locational-energy-pricing-in-the-gb-power-market/. |
|
[32] |
Climate Change Committee, “Delivering a reliable decarbonised power system,” CCC, 2023. |
|
[33] |
National Grid, “Regional insights from the Future Energy Scenarios,” 2022. [Online]. Available: https://www.nationalgrideso.com/document/266366/download. [Accessed February 2023]. |
|
[34] |
Scottish Government, “Hydrogen Action Plan,” 2022. [Online]. Available: https://www.gov.scot/publications/hydrogen-action-plan/. [Accessed February 2023]. |
|
[35] |
R. Billinton and R. N. Allan, “Reliability Evaluation of Power Systems,” [Online]. Available: https://link.springer.com/book/10.1007/978-1-4899-1860-4. |
|
[36] |
“Scottish energy statistics hub,” [Online]. Available: https://www.gov.scot/publications/scottish-energy-statistics-hub-index/. |
|
[37] |
“Orkney Islands Use Renewables to Generate 103% of Power Needs,” [Online]. Available: https://www.engineering.com/story/orkney-islands-use-renewables-to-generate-103-of-power-needs. |
|
[38] |
Open Energy Modelling Initiative, 2022. [Online]. Available: https://openmod-initiative.org/. |
|
[39] |
National Grid ESO, “Electricity Ten Year Statement (ETYS) 2022 Appendix B Supplementary Technical Data,” 2022. [Online]. Available: https://www.nationalgrideso.com/document/275586/download. |
|
[40] |
Department for Energy Security and Net Zero, “National statistics – Energy Trends: UK renewables,” 2022. [Online]. Available: https://www.gov.uk/government/statistics/energy-trends-section-6-renewables. |
Appendices
2022/23 Winter Outlook
The 2022/23 winter outlook was developed amid unprecedented volatility in energy markets and concerns around shortfalls in gas supply. Additional scenarios were added to explore the potential impact of reductions in available electrical capacity from gas power plants and import capability through interconnectors. The National Grid report found that under the base case that there will be adequate security of supply with a de-rated margin of 3,700 MW (6.3%) in GB system which is in line with recent years (see Figure 23).
Two additional scenarios were presented in the 2022/23 winter outlook: 1) no electrical imports from continental Europe (Ireland and Norway interconnectors remained available); and 2) in addition to this, 10GW of CCGT being unavailable. Scenario 2 led to security of supply concerns and as a result 2GW of coal power plants and a 2GW novel demand flexibility service were brought into contingency planning.

Figure 23 De-rated margins from National Grid’s recent Winter Outlooks showing the figures for the Winter Outlook 22/23 are in line with historical margins
Ancillary services and system operability
Ancillary services are essential for ensuring the stability and reliability of power system operations, as they maintain frequency and voltage within acceptable ranges and prevent disruptions and blackouts. Unlike fossil-fuel generators, wind turbines and PV panels don’t provide the same level of inertia required to stabilise the system frequency changes following a loss of generation or demand. Ancillary services are not within the scope of the report but are important in understanding the impact of the changing electricity mix on power system operability. To compensate for the lack of inertia in renewable energy sources, modern wind turbines can be equipped with power electronics and control systems that provide synthetic or virtual inertia to the grid. Energy storage systems and other advanced grid technologies can also help balance the system and maintain stability.
National electricity systems with near 100% renewable
Several national electricity systems in the world already operate with, or close to, 100% renewable electricity. For example, Iceland generates all its electricity from either geothermal or hydropower. Other countries with high share of renewable generation include Paraguay (99%), Norway (98%), Uruguay (95%), and Costa Rica (93%) [23] [24]. Despite these impressive levels of renewable generation, there is still some non-renewable electricity generation in each of these countries. In Paraguay, small-scale industrial power plants using sources such as oil, natural gas, and coal contribute to the non-renewable part. In Norway, thermal power plants are the primary source of non-renewable electricity. Both Uruguay and Costa Rica rely on oil-fuelled power plants to support renewables.
The common feature of these countries is that generation from hydropower plants and storage reservoirs dominates the renewable supply. In Norway, many hydropower plants have storage reservoirs. With reservoirs, hydropower production can be adjusted within the constraints set by the watercourse itself. Therefore, they have flexibility which makes it possible to follow the variation of demands, even during periods when there is little rainfall or river inflow.
Blåsjø, Norway’s largest reservoir, has a capacity of 7.8 TWh[15], which is equivalent to three years’ normal river inflow, and can store water for a long period to meet high electricity demand during the heating season in winter or support electricity supply in a dry year [25]. In addition, other hydropower plants with small reservoirs offer short-term flexibility, and can be operated to provide both baseload and peak load due to their ability to be shut down and started up at short notice. Overall, these reservoir storages help to smooth out production over days, weeks, months or between years.
Reservoirs also make it possible to manage output to maximise income through both export and import power to or from neighbouring countries when there is a price difference. Electricity is exchanged with Sweden, Denmark, and Finland through an integrated market called Nord Pool, which is in turn connected to the wider European market through interconnectors to the UK, Netherlands, Germany, the Baltic states, Poland, and Russia
More than 75% of Norway’s renewable generation is dispatchable [26], which ensures the electricity system operates with high levels of reliability and security.
Electricity systems with very high VRE share
The leading national electricity systems with high shares of wind generation (VRE) are Denmark (56% of total electricity production from wind in 2020), Uruguay (40%), Lithuania (36%), Ireland (35%), the UK (24%), Portugal and Germany (both around 23%). For solar energy, the top countries are Honduras (12.9%), Australia (10.7%) and Germany (9.7%) [23] [24] [26].
Countries which rely on VRE have lower overall shares of renewable electricity than countries that benefit from abundant hydropower resources. Of the countries with high VRE share, Denmark has the highest overall share of non-fossil fuel generation at 84%, including 20% from biofuel electricity which is mainly produced in CHPs, and 4% from Solar PV. Since biofuel CHP can be dispatchable, it provides valuable flexibility in helping the operation of the Danish system with over 50% VRE.
The Danish Energy Agency has summarized the successful measures it has implemented to increase the share of variable renewable energy (VRE) while maintaining high security of supply over the past two decades. During this time, various technical and institutional solutions were introduced, as shown Figure 24:
- 2000-2009 (VRE shares <20%): Limited investments in flexibility were made, but the supply was met through more flexible operation of existing thermal power plants and better utilization of interconnectors. Flexible thermal power plants, interconnectors, and forecasting and scheduling systems were the primary sources of flexibility.
- 2010-2015 (VRE shares 20-44%): As the VRE share grew, larger investments in flexibility were made. Solutions included complete turbine bypass, electric boilers, heat pumps, and joining the Nordic power exchange for cross-border trading. The ability for VRE to self-balance was improved through the European cross-border intraday market.
- 2016-2020 (VRE shares 44-50%) and beyond: The focus shifted towards demand-side flexibility and increased sector coupling. Aggregators were introduced to encourage active consumer participation in balancing the system, and the market remained the main driver of flexibility.
The importance of different categories of power system flexibility in Figure 24 has varied over time for integrating renewables in Denmark. The generation side was the main source of flexibility until 2020, but these measures alone will not be able to accommodate the increasing amounts of VRE economically or technically. To continuously develop towards a 100% renewable Danish power system by 2030, Denmark sees increased sector coupling and demand-side flexibility as key providers of new flexibility measures in the future [27]. The focus of sector coupling has also changed from power and heating generation to using surplus electricity and decarbonizing difficult to electrify sectors.
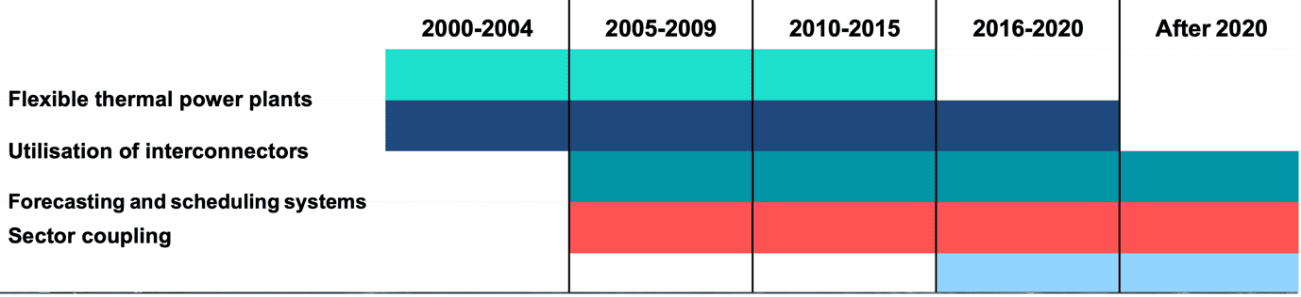
Figure 24 Flexibility measures being implemented in different periods in Denmark power system. Note this indicates where new efforts are being focussed – e.g., interconnectors are still widely used after 2020
Regional electricity systems with near 100% renewable
In some countries, annual renewable energy production from certain regions is already reaching or exceeding local demand, e.g., Mecklenburg-Vorpommern, Schleswig-Hostein in Germany, Orkney in Scotland, and Samsø in Denmark.
The challenge Orkney faces is an interesting example of a regional electricity system with more than 100% VRE. Despite the excessive locally generated green energy (more than 130% over its local annual electricity demand), there are still periods when the wind speed is low, and Orkney needs to import electricity from the UK mainland. To find a non-fossil fuel based solution to tackle the issue of intermittency, a recent smart grid demonstration project – ReFLEX (Responsive Flexibility) Orkney [28] – has set the aim of fully decarbonising Orkney by 2030 through deploying smart controlled battery systems and electric vehicles, and enhancing demand response by interlinking electricity, heat and transport assets.
Background on proposals in REMA
Current arrangements
Under current electricity market arrangements electricity is traded through bilateral long-term contracts, and short-term power exchange marketplaces. Generators sell electricity to end-users often through energy retailers. Generators and suppliers then declare how much electricity they are expecting to generate or use to NG ESO. Based on these declarations a national electricity price is formed which informs power exchange markets on the prices to sell electricity in the short-term. This national price formation is often what is referred to as the wholesale price.
Generators and end-users are free to trade anywhere across Great Britain. For example, a wind farm in the north of Scotland can sell its generated electricity to an industrial end-user in London as easily as it can sell to supply the houses in a nearby town. However, these trades do not account for spatial considerations such as limits in the transmission network. Generators and demands must inform National Grid of their actions on a half-hour basis, where the balancing mechanism is used to ensure balance between supply and end-users. The balancing mechanism may ask generators to increase or reduce, and/or end-users to reduce, in return for additional payments. National Grid also procure additional services in ancillary markets to ensure safe and reliable operation of the grid. There are increasing costs to use the balancing mechanism as the proportion of renewables increases (Figure 25). This is a driving factor in the need for new market arrangements.

Figure 25 Left hand graph shows rising costs of curtailment of wind farms. Right hand graph shows points which represent the years from 2010 to 2020 relating to wind generation and annual cost, in addition to lines which plot out the cost of curtailment per MWh of wind energy produced. The points are rising through the years from £1/MWh to above £4/MWh showing that the cost of each MWh of curtailment is increasing.
Splitting the wholesale market
A proposal gaining traction is splitting of the wholesale market. The idea is to decouple low marginal cost renewable power from high marginal cost dispatchable power, e.g., by splitting the market based on technology type into separate markets for variable and firm power. This avoids the wholesale market price primarily being set by gas prices. It could also help stabilise prices in future when there is a greater proportion of renewable power, and prices would otherwise swing between high prices set by gas generation and low prices set by high renewable output.
Potential advantages:
- Encourage investment in renewable power by helping alleviate issues of price volatility and price cannibalisation[16].
- Incentivise flexibility as more demands would look to buy from the lower cost, but less available, ‘variable’ market. Additionally, flexible technologies like batteries could benefit from access to both markets and shifting demand for price difference opportunities.
- Reduce need for long-term government support, e.g., through contracts for difference (discussed later).
Potential disadvantages:
- Uncertain implementation as this type of market has not been adopted by any major power market, and many variants have been suggested.
- Competition with other reform proposals as most of the benefits can likely be delivered through other ways.
- Lack of protection for end-users to the complexity and increased cost of not engaging with both markets.
- Lower liquidity (volumes which can be traded) in each individual market resulting in reduced competition between technologies.
Splitting the wholesale market could improve the long-term sustainability of investing in renewable power in Scotland. There would be a long-term market in which profits can be made, with more stable prices, and a reduced reliance on government support. However, it is possible that other reform proposals can provide the benefits outlined, and there could be a lack of additionality.
The wholesale market price is currently set by the last generator to turn on to meet demand. This is determined by the free market nature of the GB electricity market where bilateral trades can be made between any generator and demand, or through short-term power exchange markets. The flexibility of the current power system is primarily through flexing gas-fired power plants which means that these are the last generator to meet demand. Therefore, the wholesale electricity price is usually tied to gas prices.
As the proportion of electricity generation from wind and solar sources increases, there have been increasing concerns around the lack of effect of the high proportion of low-marginal cost renewable power on electricity prices. This non-effect on prices is a consequence of the liberalized electricity market. This has led to calls for reform on the wholesale market to better suit the net zero transition and to provide investment and operational signals to support the roll-out of mass renewable power. The current gas crisis with huge increases in the prices of gas has exacerbated this issue, increasing the voices supporting reform.
An alternative to the wholesale price formation is to move to pay-as-bid pricing where generators would receive what they bid, rather than the highest bid. This could decouple gas prices and electricity prices. However, it is likely that generators will bid higher than marginal cost to close the gap to the highest bid, resulting in a market price just below the price of electricity produced by gas power plants. Market intervention by limiting bids could mitigate this, but it is unclear how this could be implemented in practice.
Locational pricing
Locational pricing sets prices at a more granular spatial level than current national pricing. In nodal pricing there are prices at each location in the transmission network; and in zonal pricing the network is split into zones, each with a price, where it is assumed there are negligible network constraints. In both structures the prices incorporate the physical constraints of the network and includes both the cost of the energy and the cost of delivering it.
Potential benefits of locational pricing:
- Reduce whole system costs by incorporating network costs, such as the balancing mechanism, into wholesale costs.
- Nodal system would resolve network congestion inherently and remove the additional costs of the balancing mechanism. Zonal pricing would still likely require a balancing mechanism but could substantially lower costs.
- Strong signal for investing in technologies in the locations which can reduce whole system costs.
- More efficient network investment, as greater integration of network constraints in the electricity markets.
Potential disadvantages:
- Mismatch between where the greatest renewable energy sources are and where the congestion issues are for the network. For example, offshore wind offers greater capacity factors but is physically on the edge of the network.
- Potential for increased payments to existing CfD contracts as these generators are likely already existing in areas where the locational price will be lower than national price.
- Benefits of locational pricing can be greater for fossil fuel power plants (for issues such as ramp up rates and start-up costs), but with the net zero transition these benefits will be diminished.
- Greater consumer exposure based on location.
- Low liquidity in zones or nodes.
- Greater infrastructure requirements to manage the more complex system.
- For zonal pricing there is uncertainty in defining zonal areas and actual returns.
Scottish Renewables has spoken out against location pricing with a central argument being the difference in planning systems across the UK with different stakeholders holding varying interests [29]. They argue for reform of the TNUoS, the current network charge, which is locational based, as an alternative.
There would be a large impact on the Scottish power system with reform to locational pricing. Scotland has substantial wind resource with a large proportion of onshore wind farms and with large capacities of offshore wind in the pipeline. Locational pricing might have the impact of depressing prices received by these generators as locational pricing could be higher in England than in Scotland. This is because the main network congestion is currently delivering renewable generation from Scotland to England.
The motivation of locational pricing is to encourage generators and flexibility operators to take account of the real physical constraints in the network. This can result in investing and operating in areas which have higher value to the whole system and should provide higher rewards for generation and flexibility technologies. This can lead to more efficient location of new resources and efficient expansion of the network. Generators are provided with an incentive to locate to areas of high demand to access higher electricity prices. It also incentivises increased demand in areas which high renewable resources, but lower existing demands (and therefore prices). Since new and recent renewable generation often use contracts for difference this needs to be accounted for in any locational pricing design. Nodal pricing has recently been advocated by the National Grid [30] and the Energy Systems Catapult [31].
There is also interest in extending the granularity to local markets at the distribution level where there is responsibility for a distribution network operator to balance a local market. These local markets would interface with the existing national wholesale market.
Contracts for difference
Contracts for Difference (CfD) is the primary mechanism currently used by the UK government to support deployment of mass low-carbon power. A CfD contract guarantees a ‘strike price’ for generation. When market prices are below the strike price generator income is topped up and when market prices are above the strike price generators must pay back into the scheme. The scheme has seen the cost of renewables drop, by providing long-term certainty which reduces the cost of capital, as well as attracting investors. Strike prices are set through competitive auctions via pots for different technologies with set levels of government support.
Reform of CfDs is being considered since a greater proportion of total generation could end up being CfD supported in the transition to a net zero energy system. This raises issues around the lack of incentives to operate flexibly, locate in areas which help the network, and in competition with other generation technologies. Potential reforms are centred around increasing market exposure, such as a strike range, as opposed to a single price, to increase market exposure, and topping up payments based on comparison to wholesale prices over a week rather the current method of comparing prices in each half-hour pricing period.
Revenue cap and floor
Revenue cap and floor contracts would guarantee generators a minimum revenue over a contracted period. Their application to generators is inspired by contracts offered to 11,000 MW of interconnectors. An advantage is guarantees to investors of minimum revenue levels which helps minimise risk. Generators then have the freedom to participate in all the different electricity markets and attempt to maximise revenue. A cap is also implemented which if revenue exceeds, then the difference is paid back to the government.
Flexibility
Flexibility in the current electricity system comes from dispatchable fossil fuel power stations which can respond to demand changes and variable output from renewable power sources. In the net zero transition there will be a need to increase low carbon flexibility technologies. This includes renewable generation which can respond in different timeframes; and storage including batteries and long duration storage (see CCC report for more details [32]). Compressed air energy storage, Hydrogen, interconnectors offering firm low carbon power from countries like France (nuclear) and Norway (hydro), and demand-side flexibility such as electric vehicles and heat pumps could all have a role.
The UK government currently envisions that flexibility should be incentivised through pricing signals in the wholesale and balancing markets. There have been proposals to ensure these signals better reflect the need of the whole energy system, and therefore ensure flexibility is built in the right locations:
- Revenue cap and floor (similar as for low-carbon generation described earlier) so that flexibility technologies can participate in the full range of markets, but with the safety net of a minimum revenue which can strengthen investor confidence and interest.
- Supplier obligation where suppliers are required to achieve a set target for procuring flexibility.
- Reforming the capacity market to encourage technologies with different flexible characteristics (e.g., response time, duration of response, and location).
Capacity adequacy
It is of vital importance that market arrangements enable secure investment in the required capacity to ensure that electricity supply and demand are matched, and the ‘lights do not go out’. This is most difficult to achieve in extreme cases, such as during demand peaks (often a winter peak) and, very importantly in future, during long periods of low wind. These periods are currently primarily met through fossil fuel power plants such as gas CCGTs. However, many of these power plants are set to retire in the transition to net zero. Additionally, low marginal cost renewable power will displace high marginal cost fossil fuel power plants in the wholesale markets reducing revenues for these firm sources of electricity.
Proposed reforms for capacity adequacy are:
- Enhanced capacity market: Currently, the capacity market is the mechanism for topping up revenues for generators who can provide capacity adequacy. However, the majority of support has gone towards fossil fuel generators, highlighting the need for mechanisms which support low-carbon firm capacity. An enhanced capacity market would target low-carbon technologies which can provide flexibility and support capacity adequacy. Essentially, the capacity market would become more targeted and selective. This could be done through separate auctions or multiple clearing prices, with a careful balance of avoiding target setting which can supress competition.
- Strategic reserve: In this proposal a central authority auctions for reserve capacity on top of the capacity which is built through other markets. This would essentially act as a backstop to ensure security of supply without further intervention in existing markets.
- Operability: A number of proposals for reform around operability have been put forward. Capacity adequacy is an issue related to ensuring that extreme cases which the market does not account for does not result in system failure. Operability is how these assets then perform to ensure power grid stability. These involve evolving the existing suite of ancillary markets to increase the level of low-carbon technologies.
The issue of capacity adequacy is important for the Scottish electricity system, particularly as Torness nuclear power plant is due to close, and the gas CCGT at Peterhead needs to change to carbon capture and storage technology to be compatible with the net zero future. A potential enhanced capacity market should take account of the issues specific to Scotland and this has been highlighted as location is a characteristic which has been described as important to consider.
Contracts for difference
The CfD looks set to continue as the primary support mechanism for the roll out of mass low-carbon power [15]. This means that renewables in the Scottish energy system will continue to receive long-term contracts to provide stable income. It has also been suggested that older renewable generators, previously supported through ROCs or independently, could be offered a CfD contract.
Revenue cap and floor
Revenue cap and floor contracts could accelerate the roll out of wind power in the Scottish electricity system, while also incentivising flexibility such as batteries. This option could help improve the security of supply for Scotland, but it is not clear if this option would perform better than CfDs.
Flexibility
In Scotland there is likely to be an increased need for flexibility given the increasingly high penetrations of VRE generation. Therefore, it is important that changes to electricity markets incentivise situating flexibility technologies in Scotland. Current markets are not suited to delivering the flexibility required and while there are options being explored, it is not clear that the proposed reforms will deliver the required levels of flexibility in Scotland.
Future Energy Scenarios
The FES is widely recognized as a comprehensive and authoritative source of information and analysis on the future of GB electricity system. The data released as part of FES22 includes regionalised breakdowns of generation capacity, storage capacity, and demand for each grid supply point[17] and transmission network area. National Grid use a combined bottom-up and top-down modelling approach[18], and a series of stakeholder engagements to determine the regional data [33]. The four scenarios in FES are:
- Leading the Way is the fastest credible decarbonisation pathway of the four scenarios and includes significant lifestyle change and a mixture of Hydrogen and electrification for heating.
- Consumer Transformation has a lower speed of decarbonisation than leading the way but includes high societal change with consumers willing to significantly change behaviour. This scenario assumes electrified heating, high energy efficiency, and demand side flexibility.
- System Transformation has the same speed of decarbonisation as Consumer Transformation but with fewer changes in consumer behaviour and higher reliance on system-level development. This scenario assumes Hydrogen for heating, lower energy efficiency, and supply side flexibility.
- Falling Short is the slowest credible decarbonisation pathway and the only scenario which falls short of net zero by 2050. It assumes minimal behaviour change and decarbonisation in only power and transport, not in heat.
Heat demand and Hydrogen in FES
The System Transformation scenario assumes that most heating is met by Hydrogen, which results in a lower peak demand than in Consumer Transformation (heating is primarily electrified) and Leading the Way (mixed approach to heating). It should be noted that this perspective is not consistent with the Scottish Government’s Hydrogen Action Plan [34], which states that Hydrogen is intended to support a portion of domestic heating systems while also having potential for various alternative market opportunities.
Despite this difference, both plans share similar levels of ambition in promoting Hydrogen production capacity and usage. The Hydrogen Action Plan for Scotland projects a renewable Hydrogen production capacity of 5 GW by 2030 and 25 GW by 2045 within Scotland, which is comparable to the projections in the System Transformation plan (6 GW by 2030 and 69 GW by 2045 for the entire UK). Hydrogen produced by electrolysers are assumed in FES to not operate during the peak demand period. This assumes large-scale infrastructure including Hydrogen storage is connected to a distribution network which can deliver Hydrogen to end users.
PyPSA-GB details
PyPSA-GB[19] has been developed to simulate the GB power system in high spatial and temporal resolution for both historical and future years [16]. The data included in the model has been sourced from openly available datasets found online. Code for PyPSA-GB is written in Python and Jupyter Notebooks are used to showcase data, functionality, and analysis.
For the historical years, 2010-2020 inclusive, PyPSA-GB includes data on generators, marginal prices, demand, renewable power, and storage. Simulating historical years can provide insight into the operation of the GB power system, e.g., dispatch of thermal power plants and curtailed renewable generation. It is also useful in order to compare to historical data and build confidence in the model.
For future years, PyPSA-GB includes data to simulate future years based on National Grid’s FES2021 and FES2022 for all four scenarios which go up to 2050. Steady Progression represents business as usual with low level of both societal change and speed of decarbonisation and is the only scenario which fails to meet the net zero target. Leading the Way represents the highest speed of decarbonisation coupled with a high level of societal change. Consumer Transformation and System Transformation represent the same speed of decarbonisation, but Consumer Transformation requires higher level of societal change than System Transformation.
The power dispatch functionality utilises the open-source PyPSA (Python for Power Systems Analysis) to perform network-constrained linear optimal power flow calculations. PyPSA can calculate linear optimal power flow by least-cost optimisation of power plant and storage dispatch within network constraints, using the linear network equations, over several snapshots. In this study, models and data in PyPSA have been used: meshed multiply-connected AC and DC networks, with controllable converters between AC and DC networks; standard types for lines; conventional dispatchable generators; generators with time-varying power availability, such as wind and solar generators; storage units with efficiency losses; simple hydroelectricity with inflow and spillage. In this work simulations were carried out in hourly timesteps over a year.
Security of supply metric calculations
Listed below are the formulae for calculating loss-of-load expectation (LOLE), loss-of-load probability (LOLP) and de-rated system margin:
where the LOLP for a particular period is defined as the probability that available generation is unable to meet demand:
where Xt is the available generation and Dt is the system demand, both of which are random variables. A typical example for T and t is a time horizon of one year with periods of one hour.
The de-rated capacity margin measures the amount of excess supply above peak demand. De-rating means that the supply is adjusted to take account of the availability of plant, specific to each type of generation technology. The technology-specific de-rate factors are given in Table 5 and Table 6 [22] in Appendix 12.13.
De-rated system margin is used as a proxy for risk of loss of supply. It is calculated as the difference between the peak demand and the de-rated supply capacity. The de-rated supply capacity is calculated by scaling down installed capacity by the expected availability at peak demand, and by converting variable generation capacity using an equivalent firm capacity (EFC) factor. The EFC is a measure of the capacity adequacy contribution provided by wind and solar. It refers to the amount of power that a wind or solar farm can consistently deliver over time, which is useful to translate the variable output into an equivalent amount of firm capacity in the calculation of security of supply. EFC can be much lower than capacity factor, as the capacity factor reflects the average output of a wind farm, while the EFC reflects the reliability and consistency of that output. For example, the latest winter outlook, 16.1% is used as the EFC factor for wind generation.
GB supply under System Transformation
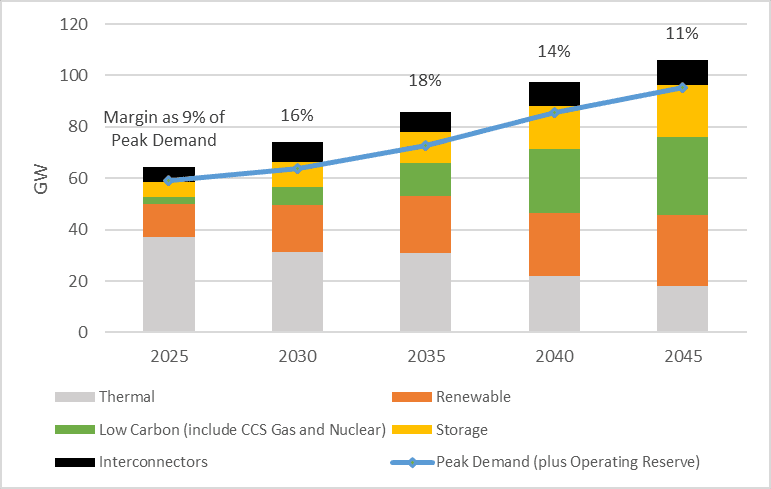
Figure 26 Plot of de-rated supply capacity, peak demand and supply margin of GB for System Transformation from 2025 – 2045
Figure 26 shows de-rated capacity and system margin results for the entire GB system, which includes the Scottish electricity system. The overall system margins of GB also vary in the future, peaking at 18% by 2035 after a rapid increase in generation capacity from 2025, and then falling back to 11% by 2045 when the rising demand catches up. It is evident from these results that the GB system margin is substantially less than that of the Scottish system alone. While the generation capacity in Scotland may seem excessive in the context of security of supply for only Scotland, it will be utilised to decarbonise and provide security of supply to the rest of GB.
Figure 27 shows power dispatch for all of GB for the System Transformation scenario and includes time of peak GB demand. The majority of generation is from variable renewable energy sources (VRES) – solar photovoltaics, wind offshore, and wind onshore – while nuclear slowly increases to the peak demand period. Firm generation – a combination of Hydrogen, CCS gas, hydro, and biomass and storage (pumped storage hydroelectric, batteries, compressed air, and liquid air) – are dispatched around the peak demand and at times of low VRES generation. It is notable that the period of highest use of firm generation and storage is at a period of low VRES and high demand which happens after the peak GB demand.

Figure 27 Power dispatch of whole of GB for System Transformation in 2045 over 2-day period, excluding interconnectors to Europe.
Security of supply stress tests
Base case
The base case shows the power dispatch for the System Transformation scenario over a 6-day period from 5 December to 10 December, and can be used as a comparison to the stress test power flow figures.

Figure 28: Power dispatch modelled over the 6-day period for base case.
Offshore wind farm failures
In security planning, the ability of an electrical power system to handle failure of its largest generator is tested. Historically this has been a large, centralised fossil fuel power plant. However, in 2045, the largest single generator in Scotland will be from the network of offshore wind farms.

Figure 29 Power dispatch modelled over the 6-day period the stress event of the failure of offshore wind farms.
Figure 29 is the power dispatch modelled over the 6-day stress event of the failure of offshore wind farms[20]. The power dispatch shows use of hydrogen power plants which were not dispatched in the base case. It is notable that CCS gas is not dispatched. The reason hydrogen is dispatched first is due to modelling assumptions with the marginal cost of hydrogen being lower than CCS gas. Despite the dispatch of hydrogen there is still export to the rest of GB. The effect of the failure of offshore wind farms is increased use of hydrogen generation, storage discharging, and imports from the rest of GB.
Low VRES power output
Scotland will be increasingly reliant on VRE in the form of wind power. This stress test analyses how the electricity system copes with a prolonged period of low VRES power output.

Figure 30 Power dispatch modelled over the 6-day period the stress event of low-VRES power output. Not lower scale on GW y-axis than other power flow figures
Figure 30 is the power dispatch modelled over the 6-day period the stress event of low-VRES power output during the peak demand period. There are substantially more periods of import to make up for the reduction in renewable power generation in Scotland, while hydrogen and biomass power plants are at full output, aided by dispatch of all storage types (pumped storage, battery, compressed air, and liquid air). As with the offshore wind farm failure, there are still exports to the rest of GB, however this does result in periods when Scotland is a net importer of electricity.
Gas power generation in Scotland unavailable

Figure 31 Power dispatch modelled over the 6-day period for the stress event of unavailable gas power generation.
Figure 31 shows power dispatch modelled over the 6-day period for the stress event of gas power generation not being available in Scotland. This has a much smaller impact on power dispatch compared to the wind power issues of the previous two stress tests, even with the dispatchability of the CCS gas. This is because the CCS gas is 1,800 MW in 2045 compared to the 21,000 MW wind farm failure in the first stress test.
Interconnectors to NI and Norway unavailable

Figure 32 Power dispatch modelled over the 6-day period the stress event of interconnector to Norway and Northern Ireland being unavailable.
Figure 32 shows the power dispatch for the stress event where both the interconnectors to Norway and Northern Ireland are unavailable. This results in some wind generation being reduced, or curtailed, as there is less capacity to export.
Connection to rest of GB unavailable
There will be more reliance on the connection between Scotland and the rest of GB in the future to accommodate increases in power flow. Increased imports to Scotland will be required to meet demand when there is low wind generation, and exports to the rest of GB will increase due to large installed capacities of wind generation in Scotland and to decarbonise demands in the rest of GB.

Figure 33 Power dispatch modelled over the 6-day period the stress event of no connection between Scotland the rest of GB
Figure 33 shows the power dispatch modelled over the 6-day period for the event of no connection at all between Scotland and the rest of GB. This results in power dispatch which is almost entirely reliant on wind generation coupled with charging and discharging of pumped storage plus other storage types. Wind generation over this period is enough to meet the demand of Scotland, however, there is no ability to export to the rest of GB which means that lots of potential wind generation is curtailed.
Storage failures
Flexibility in the electricity system will increasingly come from storage, as opposed to the dispatchability of traditional fossil fuel power plants. While large, centralised fossil fuel power plants offer a single source of failure, storage technology such as batteries, pumped hydro, compressed air energy storage, and liquid air energy storage will likely be distributed through the electrical network in a larger number of individual units. Therefore, storage will likely offer a higher degree of reliability, but this may be offset by uncertainty around the state of charge, i.e., how much electricity can be discharged from the storage unit.

Figure 34 Power dispatch modelled over the 6-day period the stress event of no battery storage in Scotland.
Figure 34 shows the power dispatch modelled for the stress event of no battery storage in Scotland. This has minimal impact compared to the base case but does decrease the utilisation of wind generation resulting in less import and export. The pumped hydro appears suited to making up for the loss of battery storage.
Security of supply data requirements
Probabilistic data is required to calculate the LOLE, LOLP, and de-rated system margin. An important input is the probability that each generator will be available at any time. This is characterised by the rate at which a unit is likely to experience forced outages, and will vary between generators depending on the technology, age and operating regime. With the outage rate (or given as availability factor = 1 – outage rate), the probability distribution for available supply capacity can be constructed using the Capacity Outage Probability Table method developed by Billinton and Allan [35].
The approach taken in this report is to use generation data from the FES22 scenario for technology capacities, and to use expected availability factors assumed in the latest 2022 National Grid’s Winter Outlook [22] and National Grid’s ESO Electricity Capacity Report [21]. This data of outage rate per type is summarised in Table 5. The de-rating factor applied for duration-limited storage (i.e. battery), is directly linked to the duration, as shown in Table 6. For instance, a storage system with a power rating of 100MW and a duration of 3 hours (equivalent to an energy capacity of 300MWh) would have a de-rating factor of 66.18%. The aggregate cumulative distribution function (cdf) for available generation, using 2030 in the System Transformation scenario as an example, are displayed in Figure 35.
Table 5 Generation de-rate factors and outage rate used in this study
|
Generation Type |
Outage rate |
De-rate factor |
|
CCGT |
0.06 |
0.913 |
|
Nuclear |
0.1 |
0.744 |
|
OCGT |
0.07 |
0.952 |
|
Biomass |
0.06 |
0.88 |
|
Hydro |
0.08 |
0.911 |
|
Wind |
– |
0.161 (EFC)[21] |
|
Pumped storage |
0.03 |
0.952 |
|
Hydrogen |
As CCGT |
As CCGT |
Table 6 De-rate factors for duration limited storage
|
Duration (hours) |
De-rate factor |
|
0.5 |
12.38% |
|
1.0 |
24.77% |
|
1.5 |
36.97% |
|
2.0 |
48.62% |
|
2.5 |
58.78% |
|
3.0 |
66.18% |
|
3.5 |
70.98% |
|
4.0 |
73.76% |
|
4.5 |
75.79% |
|
5.0 |
94.64% |
|
5.5+ |

Figure 35: Cumulative distribution function (CDF) for available generation in 2030 ST scenario. For illustrative purposes, an indictive peak demand of 10 GW is shown as a vertical line, and probability for not meeting the level of demand is 0.25. For peak demand around 5.5 GW, which is what is forecasted in Scotland, the probability for not meeting the level of demand would be statistically zero based on the CDF curve.
Data for Scotland under Leading the Way
|
“Firm” Generation Capacity (MW) in Scotland in FES22 |
2021 |
2030 |
2035 |
2040 |
2045 |
|
Nuclear |
1,750 |
0 |
0 |
0 |
0 |
|
Hydro |
1,779 |
1,835 |
1,857 |
1,880 |
1,911 |
|
Gas |
1,238 |
920 |
910 |
910 |
910 |
|
Pumped hydro |
740 |
2,696 |
3,296 |
3,896 |
3,896 |
|
Interconnector |
160 |
1,900 |
2,600 |
2,600 |
2,600 |
|
England and Wales connection (derated by 50%) |
3,050 |
10,709 |
14,841 |
15,110 |
15,110 |
|
Biomass |
208 |
238 |
196 |
84 |
39 |
|
Hydrogen |
0 |
9 |
688 |
693 |
713 |
|
Total firm capacity |
8,925 |
18,307 |
24,388 |
25,173 |
25,179 |
|
“Non-Firm” Generation Capacity (MW) in Scotland in FES22 |
2021 |
2030 |
2035 |
2040 |
2045 |
|
Wind offshore |
1,663 |
13,426 |
31,251 |
34,701 |
34,701 |
|
Wind onshore |
8,929 |
22,741 |
24,799 |
26,129 |
27,219 |
|
PV |
462 |
2,034 |
3,530 |
4,833 |
6,337 |
|
Marine |
41 |
55 |
62 |
200 |
199 |
|
Storage Capacity (MW) in Scotland in FES22 |
2021 |
2030 |
2035 |
2040 |
2045 |
|
Batteries |
124 |
3,201 |
3,435 |
3,792 |
3,792 |
|
Domestic batteries |
2 |
61 |
141 |
254 |
404 |
|
Pumped hydro |
740 |
2,696 |
3,296 |
3,896 |
3,896 |
|
Peak demand FES22 (MW) |
2021 |
2030 |
2035 |
2040 |
2045 |
|
GB projection |
58,800 |
62,700 |
81,800 |
94,200 |
98,400 |
|
Scotland (FES22 regional breakdown) |
4,890 |
5,660 |
7,470 |
8,910 |
9,680 |
|
Total firm capacity in Scotland |
8,925 |
18,307 |
24,388 |
25,173 |
25,179 |
|
Peak demand as percentage of total firm capacity in Scotland |
52% |
31% |
31% |
35% |
38% |
Data for Scotland under System Transformation
|
“Firm” Generation Capacity (MW) in Scotland in FES22 |
2021 |
2030 |
2035 |
2040 |
2045 |
|
Nuclear |
1,750 |
0 |
0 |
0 |
0 |
|
Hydro |
1,779 |
1,857 |
1,857 |
1,880 |
1,902 |
|
Gas |
1,238 |
969 |
969 |
910 |
1,810 |
|
Pumped hydro |
740 |
740 |
950 |
2,010 |
2,010 |
|
Interconnector |
160 |
500 |
500 |
500 |
500 |
|
England and Wales connection (derated by 50%) |
3,050 |
8,802 |
11,119 |
12,331 |
12,331 |
|
Biomass |
208 |
251 |
230 |
1,946 |
1,894 |
|
Hydrogen |
0 |
43 |
43 |
690 |
1,924 |
|
Total firm capacity |
8,925 |
13,162 |
15,668 |
20,267 |
22,371 |
|
“Non-Firm” Generation Capacity (MW) in Scotland in FES22 |
2021 |
2030 |
2035 |
2040 |
2045 |
|
Wind offshore |
1,663 |
5,136 |
27,031 |
31,401 |
33,901 |
|
Wind onshore |
8,929 |
18,978 |
22,453 |
23,325 |
23,891 |
|
PV |
462 |
1,400 |
2,269 |
3,010 |
3,947 |
|
Marine |
41 |
67 |
157 |
182 |
265 |
|
Storage Capacity (MW) in Scotland in FES22 |
2021 |
2030 |
2035 |
2040 |
2045 |
|
Batteries |
124 |
1,771 |
1,936 |
1,985 |
2,111 |
|
Domestic batteries |
2 |
17 |
36 |
61 |
93 |
|
Pumped hydro |
740 |
740 |
950 |
2,012 |
2,012 |
|
Peak demand FES22 (MW) |
2021 |
2030 |
2035 |
2040 |
2045 |
|
GB |
58,800 |
63,800 |
73,000 |
85,500 |
95,000 |
|
Scotland (FES22 regional breakdown) |
4,600 |
5,200 |
6,000 |
7,500 |
8,700 |
|
Total firm capacity in Scotland |
8,925 |
13,162 |
15,668 |
20,267 |
22,371 |
|
Peak demand as percentage of total firm capacity in Scotland |
52% |
40% |
38% |
37% |
39% |
Data for Scotland under Consumer Transformation
|
“Firm” Generation Capacity (MW) in Scotland in FES22 |
2021 |
2030 |
2035 |
2040 |
2045 |
|
Nuclear |
1,750 |
0 |
0 |
0 |
0 |
|
Hydro |
1,779 |
1,921 |
1,997 |
2,066 |
2,124 |
|
Gas |
1,238 |
967 |
959 |
910 |
910 |
|
Pumped hydro |
740 |
950 |
2,696 |
2,696 |
2,696 |
|
Interconnector |
160 |
500 |
1,200 |
1,200 |
1,200 |
|
England and Wales connection (derated by 50%) |
3,050 |
9,211 |
13,570 |
13,957 |
13,957 |
|
Biomass |
208 |
238 |
1,414 |
3,782 |
3,691 |
|
Hydrogen |
0 |
0 |
7 |
19.7 |
2,435 |
|
Total firm capacity |
8,925 |
13,787 |
21,843 |
24,631 |
27,013 |
|
“Non-Firm” Generation Capacity (MW) in Scotland in FES22 |
2021 |
2030 |
2035 |
2040 |
2045 |
|
Wind offshore |
1,663 |
7,686 |
30,951 |
36,001 |
36,501 |
|
Wind onshore |
8,929 |
21,192 |
23,603 |
26,094 |
27,372 |
|
PV |
462 |
1,880 |
3,099 |
4,139 |
5,338 |
|
Marine |
41 |
138 |
145 |
169 |
168 |
|
Storage Capacity (MW) in Scotland in FES22 |
2021 |
2030 |
2035 |
2040 |
2045 |
|
Batteries |
124 |
2,371 |
2,766 |
3,050 |
3,143 |
|
Domestic batteries |
2 |
53 |
121 |
219 |
347 |
|
Pumped hydro |
740 |
950 |
2,696 |
2,696 |
2,696 |
|
Peak demand FES22 (MW) |
2021 |
2030 |
2035 |
2040 |
2045 |
|
GB |
58,800 |
68,400 |
86,900 |
107,100 |
116,000 |
|
Scotland (FES22 regional breakdown) |
4,600 |
5,900 |
8,000 |
10,200 |
11,300 |
|
Total firm capacity in Scotland |
8,925 |
13,787 |
21,843 |
24,631 |
27,013 |
|
Peak demand as percentage of total firm capacity in Scotland |
52% |
43% |
37% |
41% |
42% |
Data for Scotland under Falling Short
|
“Firm” Generation Capacity (MW) in Scotland in FES22 |
2021 |
2030 |
2035 |
2040 |
2045 |
|
Nuclear |
1,750 |
0 |
0 |
0 |
0 |
|
Hydro |
1,779 |
1,807 |
1,811 |
1,815 |
1,819 |
|
Gas |
1,238 |
1,259 |
989 |
2,779 |
3,679 |
|
Pumped hydro |
740 |
740 |
740 |
1,400 |
1,400 |
|
Interconnector |
160 |
500 |
500 |
500 |
500 |
|
England and Wales connection (derated by 50%) |
3,050 |
7,688 |
8,735 |
8,977 |
8,977 |
|
Biomass |
208 |
271 |
271 |
271 |
271 |
|
Hydrogen |
0 |
0 |
0 |
0 |
0 |
|
Total firm capacity |
8,925 |
12,265 |
13,046 |
15,742 |
16,646 |
|
“Non-Firm” Generation Capacity (MW) in Scotland in FES22 |
2021 |
2030 |
2035 |
2040 |
2045 |
|
Wind offshore |
1,663 |
5,066 |
9,256 |
22,911 |
25,831 |
|
Wind onshore |
8,929 |
16,385 |
19,807 |
21,324 |
21,561 |
|
PV |
462 |
1,006 |
1,584 |
1,970 |
2,469 |
|
Marine |
41 |
48 |
53 |
53 |
53 |
|
Storage Capacity (MW) in Scotland in FES22 |
2021 |
2030 |
2035 |
2040 |
2045 |
|
Batteries |
124 |
1,474 |
1,886 |
1,941 |
1,971 |
|
Domestic batteries |
2 |
12 |
22 |
34 |
49 |
|
Pumped hydro |
740 |
740 |
740 |
1,400 |
1,400 |
|
Peak demand FES22 (MW) |
2021 |
2030 |
2035 |
2040 |
2045 |
|
GB |
58,800 |
67,300 |
77,600 |
90,700 |
104,000 |
|
Scotland (FES22 regional breakdown) |
4,600 |
5,300 |
6,400 |
7,800 |
9,200 |
|
Total firm capacity in Scotland |
8,925 |
12,265 |
13,046 |
15,742 |
16,646 |
|
Peak demand as percentage of total firm capacity in Scotland |
52% |
43% |
49% |
50% |
55% |
Data for a low capacity and high demand scenario
This data is specific to Scotland. Highlighted orange indicates modification to the System Transformation scenario. B6 connection is based on National Grid’s ETYS21 [7]. Peak demand is based on the Consumer Transformation scenario which has the highest peak demand of the four FES scenarios.
|
Generation, Interconnection, and Storage Capacity (MW) in Scotland in “Low Cap, High Dem Scenario” |
2021 |
2030 |
2035 |
2040 |
2045 |
|
(De-rated capacity below rated capacity) | |||||
|
Nuclear |
1,750 |
0 |
0 |
0 |
0 |
|
1,302 | |||||
|
Hydro |
1,779 |
1,857 |
1,857 |
1,880 |
1,902 |
|
1,601 |
1,692 |
1,692 |
1,713 |
1,733 | |
|
Gas |
1,238 |
0 |
0 |
0 |
0 |
|
1,130 | |||||
|
Pumped hydro |
740 |
740 |
950 |
2,010 |
2,010 |
|
704 |
704 |
904 |
1,914 |
1,914 | |
|
Interconnector |
160 |
500 |
500 |
500 |
500 |
|
B6 connection |
6,100 |
11,500 |
16,900 |
16,900 |
16,900 |
|
3,050 |
5,750 |
8,450 |
8,450 |
8,450 | |
|
Biomass |
208 |
251 |
230 |
230 |
230 |
|
183 |
221 |
202 |
202 |
202 | |
|
Hydrogen |
0 |
0 |
0 |
0 |
0 |
|
Wind offshore
|
1,663 |
5,136 |
27,031 |
31,401 |
33,901 |
|
268 |
827 |
4,352 |
5,056 |
5,458 | |
|
Wind onshore
|
8,929 |
18,978 |
22,453 |
23,325 |
23,891 |
|
1,438 |
3,055 |
3,615 |
3,755 |
3,846 | |
|
PV |
462 |
1,400 |
2,269 |
3,010 |
3,947 |
|
0 |
0 |
0 |
0 |
0 | |
|
Marine |
41 |
67 |
157 |
182 |
265 |
|
0 |
0 |
0 |
0 |
0 |
|
Sum of firm generation and interconnector capacity |
11,975 |
14,848 |
20,437 |
21,520 |
21,542 |
|
8,130 |
8,867 |
11,748 |
12,779 |
12,799 | |
|
Sum of firm and VRES generation and interconnector capacity |
23,070 |
40,429 |
72,347 |
79,438 |
83,546 |
|
9,836 |
12,749 |
19,715 |
21,590 |
22,103 | |
|
Peak demand in Scotland |
4,600 |
5,900 |
8,000 |
10,200 |
11,300 |
|
Peak demand as percentage of sum of firm generation and interconnector capacity in Scotland |
38.4% |
39.7% |
39.1% |
47.4% |
52.5% |
|
56.6% |
66.5% |
68.1% |
79.8% |
88.3% | |
|
Peak demand as percentage of sum of firm and VRES generation and interconnector capacity in Scotland |
19.9% |
14.6% |
11.1% |
12.8% |
13.5% |
|
46.8% |
46.3% |
40.6% |
47.2% |
51.1% | |
|
System margin without VRES (Total rated or de-rated minus peak demand) |
7,375 |
8,948 |
12,437 |
11,320 |
10,242 |
|
3,530 |
2,967 |
3,748 |
2,579 |
1,499 | |
|
System margin with VRES (Total rated or de-rated minus peak demand) |
18,470 |
34,529 |
64,347 |
69,238 |
72,246 |
|
5,236 |
6,849 |
11,715 |
11,390 |
10,803 |
|
Batteries |
124 |
1,771 |
1,936 |
1,985 |
2,111 |
© Published by University of Edinburgh, 2023 on behalf of ClimateXChange. All rights reserved.
While every effort is made to ensure the information in this report is accurate, no legal responsibility is accepted for any errors, omissions or misleading statements. The views expressed represent those of the author(s), and do not necessarily represent those of the host institutions or funders.
-
This report focusses on the Scottish electrical system but it sometimes refers to GB or UK statistics. ↑
-
To date, there has never been a complete blackout of the power grid in the UK ↑
-
In theory the transfer capability is 7200 MW (2770 MW + 2210 MW + 2200 MW). However, National Grid applies a thermal constraint that limits this to approximately 6100 MW ( [39]). ↑
-
1,290MW from Torness, and 460MW from last reduced output reactor to operate at Hunterston which fully shut down in Jan 2022. ↑
-
Moyle interconnector was limited to 160MW in 2021, but up to full transfer capability of 500MW by 2022. ↑
-
National Grid does not have a method for de-rating capacities of network internal to GB, and while this will be examined in more detail later. For this table we have assumed a de-rating factor of 50% to reflect that it will not always be available dependent on demand and generation in the rest of GB. ↑
-
This peak of 4,600 MW is less than the 5,000 MW figure reported on the Scottish Energy Statistics Hub [36] due to the method of mapping grid supply point to demand zone in PyPSA-GB. This results in a small proportion of demand in Scotland being modelled as part of England. ↑
-
System Transformation FES scenario percentage breakdown of heating in homes in GB by technology in 2050 is: 35% from hydrogen boilers, 22% from hybrid hydrogen/heat pump systems, 16% from district heating, 12% from air source heat pumps, 7% from air source heat pump and biofuel/direct electric hybrids, 3% from ground source heat pumps, 2% from biofuels, and 2% from direct electric. ↑
-
The total increased wind capacity from 2012-2022 in the UK is approximately 20,000MW [40]. This report acknowledges the challenges of achieving such significant capacity growth within a short timeframe. However, the FES scenario has been chosen as it was developed by the ESO and is applicable nationwide in Great Britain. ↑
-
Peak demand for GB and Scotland occurs at the same time in the model. ↑
-
Note that dispatch charts are shown on different scales to allow a more detailed visualisation of the situation in Scotland. ↑
-
In 2021 net exports are 13.7 TWh and in 2045 net exports are 30.4 TWh. In 2021 imports are 0.5 TWh and exports are 14.2 TWh, in 2045 imports are 4.3 TWh and exports are 34.7 TWh. ↑
-
Same stress test as previous section where the contribution of VRE generators (onshore and offshore wind, PV, and hydro) in Scotland is limited to 20% of their potential outputs. ↑
-
An iterative process is used. The same self-sufficient Scottish system is simulated with additional 50MW firm capacity each time, until the targeted LOLE is reached. ↑
-
Cruachan Reservoir is capable of holding 7 GWh. Blåsjø has more than 1000x Cruachan’s storage capacity. ↑
-
Price cannibalisation is when low marginal cost renewables may lower electricity prices to the extent that generators do not make a return on investment. ↑
-
Grid supply points are where the distribution network connects to the transmission network. ↑
-
Top-down approaches use high-level aggregated data/models while bottom-up approaches use more detailed data/models for individual components which can then be aggregated together. ↑
-
The figure also shows that hydrogen and biomass power plants have low load factors, i.e., they generate a small amount of electricity relative to their capacity. Financing of these types of generation will require revenues through non-energy markets such as capacity markets. These plants are unlikely to be sustained by selling electricity, unless peak periods in the future have very high prices. ↑
-
National Grid’s winter outlook reports have consistently applied the same de-rate factor in the capacity adequacy calculation for both onshore and offshore wind farms, as evidenced in all of the recent years’ reports. ↑