Scotland’s transition to a net zero economy presents a significant investment opportunity for renewable energy, green infrastructure and other sectors. Implementation of a net zero transition is complex and urgent. The scale of capital investment requires further significant mobilisation of private finance, alongside government investment. This report comes in response to a key recommendation of the Scottish Taskforce for Green and Sustainable Financial Services to produce an evidence-based report, mapping Scotland’s green finance landscape.
This report begins by examining available data on Scottish investment activity since 2020 in green infrastructure and renewable energy, with a minimum value of £10 million. The report then explores future investor appetite among finance institutions located or active in Scotland. It then examines green financial service provision from Scottish public/private initiatives and banks and funding institutions. It concludes by examining analytical methodologies that may further identify Scottish sustainable finance opportunities and gaps, as well as challenges in capturing future investment. The analysis adopts a mixed-methods approach, using commercial datasets and desk-based research alongside a limited number of targeted stakeholder interviews. The findings should be interpreted as indicative, as the start of a conversation on sustainable financing, rather than exhaustive.
Key findings and lessons learned
Key findings on Scotland’s sustainable finance landscape are:
Approximately £9.5 billion has been deployed in green infrastructure and sustainable energy in Scotland since 2020; with the total annual investment increasing from £500 million in 2021 to £1.8 billion in 2023 and over £5 billion in 2025. This excludes Mergers and Acquisitions and deals under £10 million. This investment activity involved a broad mix of investors, including energy companies, commercial banks, infrastructure funds, institutional investors and public financial institutions.
While investment activity has grown steadily since 2020 it remains concentrated in a relatively narrow set of mature sectors. For deals partly and fully located in Scotland, electricity transmission had the largest share of total investment (32%), followed by renewable energy (25%), and battery storage (21%). The largest investment sectors included renewable wind energy, electricity transmission and battery storage. These sectors benefit from more established technologies, clearer revenue models and strong policy support. Investment in emerging sectors such as industrial decarbonisation, low-carbon heat & transport and nature-based solutions appears more limited with some evidence suggesting higher risk perception and uncertainty of regulatory support and revenue models.
Financial Services firms are undertaking a range of activities in this space, with key activities including capital allocation, portfolio management, advisory work and climate analytics.
Financing structures appear to be dominated by debt financing, with 56% of the transactions analysed by the research financed by debt, bonds represented 35%. Equity transactions were relatively low, at 9%.
Theevidence suggests there are strong levels of further investor appetite for green investment in Scotland. Several asset managers, banks and corporate investors have announced plans for further Scottish investment, particularly in renewables, grid infrastructure and storage. Investment decisions tend to be made at a UK or global level rather than targeting Scotland.
Public financial institutions play important roles across the financing lifecycle, providing patient capital and crowding in private investment. Institutions such as Innovate UK and the British Business Bank support early-stage, higher-risk innovation, while those such as the Scottish National Investment Bank and the National Wealth Fund support businesses as they mature through the crucial scale-up phase in providing patient capital and drawing in private capital.
Initiatives such as the Global Ethical Finance Initiative and Transition Finance Scotland convene industry and public sector actors. Industry bodies and institutions (e.g. Scottish Financial Enterprise, Scottish Renewables and Scottish Futures Trust) support project development, market coordination and the identification of investment opportunities. Together, these stakeholders form an ecosystem that can support scaling of green investment in Scotland.
Lessons learned
The findings point to several key lessons for unlocking and mobilising greater flows of private capital in Scotland’s green sectors. Many of these challenges are structural, relate to ongoing challenges such as grid capacity, and the deployment of new types of financing. They include:
Enhancing revenue certainty and policy clarity to reduce perceived investment risk, particularly in low-carbon heat and transport, nature-based solutions, and industrial decarbonisation. These areas are structurally challenging, and will require collaboration from across industry, academia, and government to address.
Address infrastructure bottlenecks, particularly grid capacity, and improve the efficiency of permitting processes, as critical enablers of greater renewable energy investment. This is also a challenge which cuts across sectors, industry and government.
More effectively target the use of blended finance and risk-sharing mechanisms to support early-stage and innovative projects where private finance still needs to be unlocked, including in sectors such as industrial decarbonisation, heat, transport and nature-based solutions.
Explore mechanisms to attract and mobilise more risk capital into emerging green sectors, including venture capital and growth equity, to support innovation and the scaling of new technologies.
Next steps
The analysis presented in this report provides an initial evidence base and highlights areas where further research would support policy development. Further work could therefore build on this analysis to provide a more comprehensive review of Scotland’s green finance opportunities and constraints.
Potential next steps could include:
Assessing Scotland’s green investment needs from a wider perspective, including sectors not covered in the current analysis, to include more detailed assessment of the scale of investment required to meet policy goals versus expected investment trajectories. This could help identify potential gaps between observed investment activity and sectoral investment needs to reach the net zero target.
Undertaking a broader assessment of the factors influencing investor decision-making, including both barriers and drivers of investment, drawing on a broader range of stakeholders.
Conducting a high-level assessment of emerging sectors such as hydrogen, carbon capture and storage, and nature-based solutions, including their investment readiness, project pipeline and key constraints to capital deployment.
Exploring whether the current mix of financial products sufficiently supports businesses and projects across different stages of development. This would be particularly relevant for innovative or emerging sectors that may require financing between early-stage public support and conventional debt finance.
Assessing where Scotland’s financial services ecosystem needs to develop further specified sustainable finance expertise to support future growth in green investment and identify opportunities for targeted skills development where gaps exist.
Exploring approaches to diversify investment risk across green investment opportunities, helping to address challenges associated with project scale, concentration of capital and the limited ability of investors to diversify risks when investing in Scotland.
Glossary / Abbreviations table
BESS
Battery energy storage systems
CCC
Climate Change Committee
CCGT
Combined-cycle gas turbines
CfD
Contract for Difference
CPI
Climate Policy Initiative
EV
Electric vehicle
ESG
Environment, social, and governance
ETF
Exchange-traded fund
FDI
Foreign direct investment
FCGFI
Flow Country Green Finance Initiative
KPI
Key performance indicator
LSEG
London Stock Exchange Group
M&A
Mergers and acquisitions
PuFin
Public financial institution
TCFD
Task Force on Climate-related Financial Disclosures
TRBC
Refinitiv Business Classification
RQ
Research question
NOA
Network Options Assessment
NESO
National Grid Electricity System Operator
NWF
National Wealth Fund
OECD
Organisation for Economic Co-operation and Development
R&D
Research and Development
SNIB
Scottish National Investment Bank
SNIFFER
Scotland and Northern Forum for Environmental Research
SMEs
Small and medium-sized enterprises
SPV
Special-purpose vehicle
S&P
Standard & Poor’s
UNCTAD
UN Conference on Trade and Development
Introduction
Policy and strategic context
Private sector investment is crucial in the transition to net zero as well as addressing biodiversity loss and broader environmental pollution in Scotland. It requires the greening of key economic sectors alongside the development of new green industries. With an ambitious target of reaching net zero emissions by 2045 (Climate Change (Emissions Reduction Targets) (Scotland) Act 2019, 2019), Scotland offers strong investment opportunities in its transition to a more sustainable economy. Its draft Climate Change Plan 2026-2040 envisions that decarbonisation contributions from the transport, energy supply, business and industrial processes sectors will be particularly important (Scottish Government, 2025b).
The transition is already making a significant contribution to the Scottish economy. One economic model estimates that 105,000 jobs and £10.2 billion in economic value are currently supported in sectors such as energy, manufacturing, engineering and professional services (CBI Economics, 2026).
Reaching net zero requires further substantial, sustained and targeted investment. The Climate Change Committee (CCC) predicts that the cost for Scotland alone will be £145 billion between 2020-2050, equating to a £5.6 billion investment need per year between 2026-2040 (Scottish Government, 2025a). The Scottish Fiscal Commission estimates that around £41 billion of total investment is expected to come from public sources (Scottish Fiscal Commission, 2024). With public sector finances under sustained pressure, private sector investment is pivotal to achieving the transition. The Climate Change Committee estimates that 65-90% of the UK net zero financing required between 2025 and 2050 will need to come from the private sector (Climate Change Committee, 2025).
Following the success of the United Nations Climate Change Conference (COP 26) in Glasgow, in 2021, the Scottish Government announced an industry-led taskforce to develop an action plan to capitalise on the opportunities of financing the global shift to net zero. This resulted in the Scottish Taskforce for Green and Sustainable Financial Services (“the Taskforce”), which was convened by the Global Ethical Finance Initiative (GEFI) with funding from the Scottish Government. The Taskforce aimed to strengthen coordination within Scotland’s sustainable finance sector and position the country as a leading global hub for green and sustainable finance (GEFI, 2024b).
Scotland has well-established strengths in financial services and increasingly in sustainable finance (The Investment Association, 2024). Its financial ecosystem comprises global institutions, international companies alongside small, locally based companies (GEFI, 2024a). In the 2022/23 PwC Green Jobs Barometer, Scotland had the highest proportion of green financial job openings (PwC UK, 2023; Scottish Financial Enterprise, n.d.; Scottish Financial News, 2025).
Scottish Financial Enterprise aims to build on these strengths and to double assets under management in Scotland’s financial services sector, to £1 trillion by 2030 (Scottish Financial Enterprise, n.d.). However, the share of assets under management in the UK managed by investment managers from Scotland fell to 17% in 2023 from 26% in 2013. This was attributed to merger and acquisition activity among Scottish firms and the relatively faster growth of assets managed in London, among other factors (The Investment Association, 2024). Research by the Productivity Institute also indicated private investment in the Scottish economy was lower than other top-performing countries and lower than the wider UK in areas such as Research and Development (R&D) (D. Williams et al., 2025).
Scotland’s Green Industrial Strategy identifies four key areas where Scotland has existing strengths, that are most likely to lead to growth and with export potential (Scottish Government, 2024). These are: (i) maximising the wind energy economy, (ii) developing a self-sustaining carbon capture, utilisation and storage (CCUS) sector, (iii) growing the hydrogen sector, and (iv) establishing Scotland as a competitive centre for the clean energy intensive industries of the future. The strategy also advocates for additional public support to green economy financial services to support growth in these sectors.
By providing patient capital, helping to mobilise private finance and accelerating growth in priority green sectors, public financial institutions play a role in the net zero transition. For example, the Scottish National Investment Bank (SNIB) in its Investment Strategy for 2025-2026 positions itself as a patient capital investor focused on crowding in private capital seeking to invest in sectors contributing to net zero (Scottish National Investment Bank, 2025). The National Wealth Fund and Great British Energy also target green sectors.
Research commissioned by Skills Development Scotland and published in 2023 estimated that “green investments” taking place or expected to take place in 2025-2026 amounted to around £90 billion, with £48 billion of that “already going ahead or with a high likelihood of proceeding in the next 2-3 years” (Skills Development Scotland, 2023, p.4). This includes investments targeted in energy, transport, construction, manufacturing, agriculture and land use. However, no other recent studies have been identified which estimate investment levels in green sectors in Scotland or via Scottish financial institutions.
The environment in which sustainable investors operate continues to evolve, both in the UK and globally. Investment sentiment has been affected by the Russian invasion of Ukraine and instability in the Middle East has been driving up fossil fuel and other input prices, leading to concern over energy security and affordability. According to the Investment Association, some sustainable investment strategies affected by these developments generally delivered lower returns (The Investment Association, 2024).
In this context, the Taskforce report outlined how Scotland can position itself as a global green finance centre, but noted further work was needed to map the Scottish financial services landscape (GEFI, 2024a). This included exploring past investment trends, potential future developments and offerings of current green financial services. It noted this work would help the Scottish Government attract more green finance. This report is the first step in this direction, aiming to provide a baseline mapping of the green finance landscape in Scotland over the past five years.
Research questions and methodology
This research outlines the sustainable financing landscape in Scotland, as per the Taskforce recommendation. The goal is to understand which institutions have invested in Scotland, in which sectors and which types of projects over recent years. The study also evaluates available information on investors’ interest in Scotland in the short and medium-term future. It seeks to answer four research questions (RQs):
Which private and public institutions have completed deals for investments over £10 million in Scottish green infrastructure and renewable energy projects since 2020? (RQ1)
Which financial institutions are looking to meaningfully structurally invest in Scottish projects in the short and medium-term future? (RQ2)
Which funding institutions and initiatives operating in Scotland provide green financial services? (RQ3)
What methodologies should be used to identify the opportunities that could be leveraged, the gaps, and challenges for future investment? (RQ4)
To answer these questions, we used a mixed-methods approach. To answer RQ1, we used data on past investment deals derived from the London Stock Exchange Group, (LSEG Data & Analytics), and from Standard & Poor’s (S&P) Global databases. These are specialist and comprehensive data providers who maintain the largest financial databases commonly used in academic financial analysis. This was complemented with desk-based research on Scottish investments and financial organisations. To answer RQ2, we further researched company websites and public documents where these contained stated plans and/or announcements on investing in Scottish green sectors. To answer RQ3, we analysed the green financial instruments and services that larger financial service providers located in Scotland currently offer. This report provides an overview of their green targets, commitments and associated strategies towards sustainable investment, based on publicly available information.
To supplement the desktop research, we conducted interviews with eight selected stakeholders representing the key investor types, including banks and asset managers. These stakeholders represented public and private markets as well as trade associations. The interviews gathered information on both past activity and the future plans of the institutions to support analyses for RQ 1, 2 and 3. Due to our sample size, sentiments expressed should not be considered to be fully representative of the wider investment landscape. To answer RQ4, we reviewed methodology guidance documents from various international institutions. A more detailed summary of our methodology is in Appendix A. Whilst this research is not a comprehensive nor exhaustive overview of the sustainable finance landscape in Scotland, it is intended to serve as a starting point for future research.
Definitions adopted in the study
For the purposes of this study, “investment” in Scottish companies refers to the provision of capital through equity, bonds and loans, or mergers and acquisitions, where a target company or underlying assets are located in Scotland.
This study adopts the definition of “Green Finance” which was developed by the Taskforce. This states “Green finance refers to any financial initiative, strategy, product or service designed to protect the natural environment and support the transition to a sustainable, low-carbon world, and/or to manage climate-related and other environmental risks impacting finance and investment” (Final Report, Scottish Taskforce for Green and Sustainable Financial Services, 2024, p. 12).
Where there was uncertainty about whether an investment activity falls within the above definition, we referred to specific technical definitions in the EU Sustainable Finance Taxonomy (European Commission, 2026). Excluded investments judged to be outside the scope of the project were: (i) electric vehicle (EV) manufacturing, (ii) activities associated with oil supply for wind turbines, (iii) electric coach services, and (iv) smart meters. Although these investments may be classified as “green”, RQ1 focussed on renewable energy and green infrastructure.
Further definitions used in the study relating to for green financial service providers, green instruments, services and finance initiatives are in Appendix B.
Limitations
There is a variety of definitions of green activities within the field. While this report adopts a specific framework and definition, the research may reflect different stakeholder perceptions which may result in slight variations in how the data are interpreted.
The research is unlikely to have identified all relevant deals, especially those which would be considered to constitute lower value deals, activities of small private firms or self-financed projects. To mitigate this, we complemented and cross-checked the information from databases with alternative public sources and news coverage as far as possible. Quantitative data is also supplemented with stakeholder interview evidence. Whilst this qualitative information provides additional detail and context, these insights are neither comprehensive nor necessarily representative of the institutions described in the study or the wider market.
Some investments were only partially located in Scotland, and it was not possible to determine the precise share could be attributed to Scotland. For example, an investment in electricity grids connecting Scotland and the rest of the UK may not specify the share of the total amount spent in Scotland. In other cases, a company may list projects in the UK, including Scotland, but may only publicly state total investment values, not individual amounts. To address this, investments were split into those “fully” and “partially” located in Scotland. It is recognised this is not a precise exercise but is intended to aid interpretation of the available data.
The databases used in the analysis include bonds, debt, equity (see Appendix B for definitions), as well as mergers and acquisitions. However, the databases do not include project equity investments where projects were financed from the balance sheet of a company. In cases where a specific deal reference or location was not explicitly identified within the database, the screening process focused on transactions where the investing or issuing company was headquartered in Scotland. Further desk-based research was then conducted to identify additional information on the underlying projects to confirm whether the investment was linked to projects located in Scotland. However, the UK-level deals may include activity in Scotland which is not captured by the approach taken in this study.
Furthermore, this study focuses on past deals in green energy and infrastructure over £10 million only. Also, it does not capture some broader elements of demand for green investment, such as in energy and energy efficiency.
For details on future investment plans, we have relied on information in the public domain, which may be outdated, incomplete, subject to change and limited in detail given commercial confidentiality and competition. Whilst interviews with stakeholders sought to mitigate this, at least some relevant commercially sensitive information will not be publicly available. Hence, the analysis is likely to reflect the lower end of a true level of investment.
Additionally, a total of eight interviews were conducted, and one institution provided a written response. As the sample size is not statistically representative, the input gathered does not provide a robust reflection of the views of all market participants. Among the interviewed organisations, there were banks (3), asset managers working either in private (2) or in public (1) markets, or both (1), and one trade association. Of the three banks, all are UK-based, with one headquartered in Scotland. The names of the institutions interviewed are not provided. They were selected to include large UK retail and commercial banks, and globally active asset managers.
The analysis of deal activity should be interpreted as indicative rather than exhaustive. It is based on a defined methodological scope, including the use of a dataset (LSEG), complemented by desk-based research and stakeholder interviews. While this approach improves coverage, it remains focused on transactions that are publicly disclosed and meet the study criteria (e.g. deals above £10 million). As a result, certain types of investment activity are not captured, including balance sheet financing. An alternative methodology and data coverage might produce a different but overlapping sample of deals, but the overall trends and aggregate investment values appear broadly consistent across data sources identified.
Investment activity in Scotland’s green sectors since 2020
Introduction
This section analyses completed deals in green infrastructure and renewables over £10 million in value in Scotland since 2020. It identifies patterns in scale, instruments, participating actors and other investment characteristics, alongside further insights from interviews. Further detail on data and methodology is reported in Appendix A.
Data for this section are drawn primarily from the LSEG Data & Analytics using the Sustainability flag incorporated into the database to identify green bonds, green loans, equity issuances and mergers and acquisitions of green Scottish companies. We then cross-checked and complemented the data with desk-based research drawing on public sources, company press releases, investor announcements and industry publications. A full list of sources for the desk-based research is reported in Appendix A.
In total, summing bonds, equity, debt and mergers and acquisitions of Scottish companies, we identified 54 deals between January 2020 and February 2026, with a combined amount of £9.8 billion. This figure captures only private capital market transactions (equity, loans, bonds and M&A involving Scottish companies where Scottish companies were acquired). Excluding M&A the figure is £9.5 billion.
Background
Climate-related investment is significant in both Europe and the UK, although consistent data on green investment is difficult to identify. European Union (EU) level investment averaged around €764 billion per year in activities that reduce greenhouse gas emissions between 2011 and 2020 (European Central Bank, 2025). At UK level, the Office for National Statistics estimates the UK low carbon and renewable energy economy amounted to £77 billion in 2024, an 11.8% increase on 2023, with Scotland accounting for £13.3 billion or one sixth of this total (Office for National Statistics, 2026). Note these figures are not directly comparable to the £9.8 billion estimate of investment in Scotland outlined above and the £48 billion projected by Skills Development Scotland outlined in section 3.1. They include public expenditure, infrastructure programmes and operational capital investment that fall outside the scope of deal data that we collected.
A core ambition in Scotland is to strengthen its contribution to total UK assets under management, putting green and sustainable finance as a core pillar of this growth (GEFI, 2024). This provides context for analysing our dataset of completed green deals in Scotland since 2020, capturing a narrow but growing share of private green investment flows.
Overview of green deals, 2020-2026
Figure 1 reports the number and annual volume of completed deals over £10 million identified in the research, focusing on bonds, equity and loans only. In total, we identified 28 deals which had completed since 2020. These deals were in green infrastructure and renewable energy as defined in LSEG. They include investments in sectors such as renewable energy, clean infrastructure, hydrogen, carbon capture, electric vehicles and renewable utilities (refer to Appendix B for more detail on the definition). The analysis was deliberately scoped to these sectors, applying a minimum £10 million deal size threshold to identify qualifying transactions. Focusing on equity and debt (loans and bonds) financing transactions, no relevant deals were recorded in 2020, likely reflecting the disruption and economic uncertainty associated with COVID-19. Investment activity for these deals has grown steadily since 2021, with a peak of 12 deals in 2025. For completeness, we included the deals reported in January and February 2026. As a result, 2026 is partial and not directly comparable with the previous years. These figures capture only discrete private capital market transactions, excluding investment financed directly from firms’ own balance sheets and are based on the methodology set out in Appendix A.
We interviewed stakeholders active in Scotland’s financial industry for comment on investment trends in these sectors. These included large UK-based retail and commercial banks, globally active asset managers (across private and public markets), infrastructure investors, and a leading industry body. One reported that investment in Scotland’s renewables and green infrastructure has grown but remained concentrated in a relatively narrow set of mature sectors, largely driven by project opportunities (source – interview with a bank). Public interventions, including subsidies, are seen to be playing an important role, particularly in de-risking capital-intensive projects, but several interviewees felt that inconsistent policy signals have constrained broader investment expansion (source – interviews with two banks, an asset manager (private markets), and a trade association). While specific policy instruments were not always explicitly identified, stakeholders indicated that gaps in long-term revenue certainty and pipeline transparency remain key constraints.
As of the end of February 2026, a combined value of around £9.5 billion has been invested in green deals which involve Scotland since 2020, excluding M&A. The total annual investment reached around £500 million in 2021, increasing to around £1.8 billion by 2023 and to over £5 billion in 2025. To provide context, approximately £5 billion per year of combined public and private investment is estimated to be required by the end of this decade to meet a balanced pathway to net zero for Scotland (R. Watts, 2024).
It is important to note that the total amount includes deals both fully and partially located in Scotland. The share of value attributable to Scottish assets in the latter is not disclosed. Despite this limitation, these deals are retained in the analysis to provide a full picture of the number and sectoral distribution of deals (see Section 4.4below). As a result, the total value figure may overstate the amount attributable solely to Scotland somewhat. Therefore, details of deals fully located in Scotland are also provided.
Figure 1 and Figure 2 report the number and monetary value of deals, respectively. These include deals fully located in Scotland (64%) versus deals partially located in Scotland (36%), respectively. Note, deals fully located in Scotland refer to deals where all investment activity is in Scotland. Deals partially invested in Scotland refer to deals forming part of a wider UK investment where the Scottish share of total value is not separately disclosed and the boundary of the investment extends beyond Scotland to the rest of the UK. In a small number of cases these deals also extend beyond the UK itself. In 2024, over three-quarters of deals were fully located in Scotland.
To contextualise the scale of these figures, it is useful to set them against wider investment activity in Scotland. The Scottish Government’s total capital budget stood at £6.2 billion in 2024–25 (R. Watts, 2024), of which around £2.2 billion was classified as low-carbon capital investment (Scottish Government, 2022). This means that private green investment in each year since 2021 in our sample has exceeded green public capital investment in 2024-2025. On the private side, total private equity investment across all sectors in Scotland reached £9.4 billion in 2024 (G. Williams, 2025). Note these figures are not directly comparable to our sample. They encompass a much broader cross-section of sectors and deal types, but provide confidence in the estimate from the sample, as these deals will likely comprise only a proportion of the total private capital deployed in Scotland each year.
The number of published deals is relatively small but steadily growing. This trend is likely to reflect macro conditions. Survey evidence from the Bank of England shows strong economic contraction and high volatility at the UK-level during and following the COVID-19 crisis. In contrast, some evidence suggests that the energy price shock following the Russian invasion of Ukraine in 2021-2022 may have boosted green investment intentions (Bank of England, 2024). The Bank’s survey response at the UK-level reports a growth of approximately 40% in green investment intentions between 2021 and 2023.
Figure 1. Number of completed deals in green infrastructure and renewables in Scotland 2020-2026 – loans, bonds, equity
Source: LSEG databases and desk-based research.
Figure 2. Volume (£ million) of completed deals in green infrastructure and renewables in Scotland 2020-2026 – loans, bonds, equity
Source: LSEG databases and desk-based research. Note: for deals that are only partly located in Scotland, the reported deal amounts reflect the total value of the larger, international or UK-wide transaction, rather than the share corresponding to Scottish assets.
Table 1 reports cross-border M&A activity, which given its specific nature, is presented separately. The analysis covers acquisitions of Scottish-headquartered companies only; acquisitions made by Scottish companies of targets located elsewhere were excluded.
Observing data on M&A deals involving the acquisitions of green companies in Scotland 2020-2026 provides context to inward foreign direct investment trends, and the attractiveness of Scottish green companies. The data show a total M&A deal value of £307 million, which represents foreign and British companies investing in Scottish assets (so called “pure-play M&As” only) rather than necessarily new physical capital expenditure within the country. The energy and power sector consistently leads in both the number of deals and average deal value, with a notable spike in deal value in 2020 at £162 million. In contrast, the industrials sector has more limited activity, with just one deal in 2024 and 2025 respectively.
Table 1: Average M&A deal value amount per sector and per year
Number of deals
Average of deal Value (GBP, Millions)
Year
Energy and power
Industrials
Energy and power
Industrials
2020
3
162
2021
3
6
2022
5
NA
2023
3
NA
2024
5
1
10
NA
2025
4
1
29
100
2026
1
NA
Total
24
2
207
100
Source: LSEG databases and desk-based research. Note: some of the M&A deal amounts are not disclosed in the LSEG dataset. They are listed as NA in this table.
Sectoral distribution
The available data on sub-sectoral distribution remains highly uneven. The evidence suggests a trend toward mature, de-risked technologies. This suggests sectors critical to longer-term climate goals may face investment barriers driven by scalability constraints, uncertain demand and insufficient revenue certainty. This poses a challenge to longer-term decarbonisation ambitions.
Across Scotland’s green infrastructure landscape, stakeholder perspectives reveal a market where capital has flowed mostly into mature, revenue-certain technologies, while emerging sectors continue to face structural barriers for new investment. Interviewees noted that investment activity in renewables and green infrastructure in Scotland had been concentrated in more established sectors, particularly off- and onshore wind, hydro and increasingly in grid infrastructure and storage. Multiple interviewees noted fixed offshore wind as the dominant area of capital deployment but noted growing interest in enabling infrastructure such as transmission networks and battery storage (source – interviews with two banks, an asset manager (private markets), and a trade association). They viewed a notable gap in areas such as hydrogen and nature-based solutions, where uncertainty around revenue models and market structures was perceived to have constrained investment appetite (source – interviews with an asset manager in public markets, and an asset manager in private markets). Also, although peatland and woodland carbon markets in Scotland are considered relatively mature, the National Strategy for Economic Transformation (NSET) has committed to developing a “high-integrity, values-led market” for responsible investment in natural capital (GEFI, 2024a). Similarly, some interviewees noted retrofitting and energy efficiency initiatives in the built environment had struggled to scale due to weak end-user demand and a lack of compelling financing propositions (source – interviews with two banks). These patterns, drawn from stakeholder experience, are broadly corroborated by the deal-level data.
To understand where the deal amounts discussed above have been invested, we analysed the sector allocation of the identified transactions. To do this, we used sector classifications derived from a combination of the Refinitiv Business Classification (TRBC) business sector field and the “use of proceeds” field for each deal, both from LSEG, and supplementary desk-based research to narrow down specific sub-sectors. This was necessary because the dataset does not directly record whether a deal is located in Scotland, requiring us to verify this manually using project-level details. Figure 3 and Figure 4show the deal total amount disaggregated by sector. We analyse the deals that are partially located (Figure 3) and fully located in Scotland (Figure 4) separately. Table 2 and Table 3 report the same statistics disaggregated by sector and year.
Among the projects partly located in Scotland, renewable wind energy dominates the debt, bonds and equity investments made, representing 42.6% of the total value. This was around £1.8 billion out of £4.3 billion, from the 10 deals spread over 2022 to 2025. The electricity transmission sector attracted the second largest investment total (32%), but this was concentrated in a single large-scale deal. This likely reflects that many Scottish wind projects comprise parts of larger UK-wide or international portfolios. In offshore wind especially, the project company and investors are often headquartered outside Scotland, while the physical asset may sit off the Scottish coast. For deals that are only partly located in Scotland (
Figure 3), the reported deal amounts reflect the total value of the larger, international or UK‑wide transaction, rather than the share corresponding to Scottish assets.
In terms of the projects fully located in Scotland, the largest amounts of investment were directed toward electricity transmission which was 32% of the total investment via three large-scale deals – and battery storage (26%) (Figure 4). High-value electricity transmission projects related to: (i) investment in upgrading grid infrastructure, (ii) improving connectivity and (iii) enabling the transport of renewable energy. One deal related to green/low-carbon real estate has been recorded in 2026 to date.
The dominance of energy sub-sectors in the identified investments is in line with the findings of a CBI Economics study analysing the Scottish net zero economy in 2025. According to their market analysis, the net zero transition has been the most visible in the energy sector in Scotland. A key factor behind this is Scotland’s historic strength in the oil and gas, offshore engineering and subsea capability sectors. These skills and expertise from the traditional fossil fuel sector can be applied in the development of offshore wind, green hydrogen and CCS technologies (CBI Economics, 2026).
Figure 3. Deals partly located in Scotland – percentage of the total amount per sector, 2020-2026 – debt, bonds, equity
Source: LSEG databases, desk-based research.
Figure 4. Deals fully located in Scotland – percentage of the total amount per sector, 2020-2026 – loans, bonds, equity
Source: LSEG databases, desk-based research.
Table 2: Sum of deal amount per sector by year for projects partly located in Scotland
Total and breakdown per sector and year
Sector
(GBP, Million)
Number of Deals
TOTAL – Battery storage
635
3
2023
175
1
2025
460
2
TOTAL – Electric buses
150
1
2024
150
1
TOTAL – Electricity transmission
1,363
1
2025
1,363
1
TOTAL – EV infrastructure
326
1
2022
326
1
TOTAL – Renewable Energy (Wind)
1,817
4
2022
551
1
2023
760
2
2025
506
1
AGGREGATE TOTAL
4,292
10
Source: LSEG databases, desk-based research.
Table 3: Sum of deal amount per sector by year for projects fully located in Scotland
Sector
Total and breakdown per sector and by year
(GBP, million)
Number of deals
TOTAL – Battery storage
1,362
4
2023
281
1
2025
1,081
3
TOTAL – Electricity transmission
1,643
2
2025
1,643
2
TOTAL – Green / low‑carbon real estate
135
1
2026
135
1
TOTAL – General corporate Lending
1,444
3
2021
500
1
2023
450
1
2024
494
1
TOTAL – Peatland restoration / carbon‑offset projects
NA
1
2024
0
1
TOTAL – Renewable Energy – Offshore Wind
154
2
2024
56
1
2025
98
1
TOTAL – Renewable Energy – Onshore Wind
394
4
2022
132
1
2023
190
1
2025
62
1
2026
10
1
TOTAL – Renewable Energy – Onshore Wind & Solar
29
1
2025
29
1
TOTAL
5,161
18
Source: LSEG databases, desk-based research. Note: The three corporate lending deals in this table fall under the Basic Materials and Utilities sectors; no further sector detail is available for these transactions.
Although the total deal value for the peatland restoration project is not publicly disclosed, the landscape-scale nature of the programme, covering 400,000 hectares across Caithness and Sutherland and involving multiple public and private funding streams, suggests a substantial investment value.
Deals partly located in Scotland are characterised by larger deal sizes and are mainly led by larger energy companies, financial institutions and major banks. Their dominance suggests that Scotland’s green finance landscape is concentrated among a limited number of larger, established players. In terms of deal values by sector, electricity transmission deals were in the range of £1-1.3 billion per deal, whilst renewable energy deals were approximately £500–£650 million per deal, both attracting substantial capital. Meanwhile, battery storage, EV infrastructure deals and electric bus financing tend to be smaller in size at around £150 million per deal and typically funded by commercial banks. No detailed information was available on these deals.
Investments fully located in Scotland involve a broader mix of investors and more variation in deal size across sectors. Electricity transmission deals range from around £500 million to £1 billion per deal and are typically backed by a combination of energy companies, public financial institutions and institutional investors buying green bonds, such as pension funds and insurance companies. Renewable energy deals – which include onshore and offshore wind – range from around £50 million to more than £200 million per deal. They are mainly financed through project-specific funding from commercial banks, infrastructure funds, and sometimes public co-investors, e.g. the Scottish National Investment Bank. Battery storage sits in the mid-range, around £60 million to £280 million per deal, with specialist energy investors and banks playing a key role. These patterns may also reflect differences in risk appetite. For example, a commercial bank can typically take on more risk, versus deals in more mature technologies where asset owners may take on more of a role.
Smaller sectors indicate more variety in investor types. For example, “green real estate”, involves properties with low‑carbon design and operations. One example identified involved transforming a major office site in Edinburgh into 282,000 square foot of sustainable high-efficiency office space. These were typically over £100 million per deal and were usually financed by commercial banks through green debt. Nature-based solutions, such as peatland restoration, tend to be much smaller and rely on a mix of public bodies, e.g. NatureScot, private investors and environmental funding schemes. Peatland restoration initiatives are also supported through public-private programmes like the Flow Country Green Finance Initiative.
Around 28% of investment flagged as sustainable in LSEG, is classified as “general corporate lending”. For these investments it was not specified whether the use of proceeds is for specific projects or general activities. Other sectors such as low carbon and green real estate received smaller shares of investment (see Appendix B for definitions).
M&A deals were dominated by activity in the energy and power sector this includes offshore wind, onshore wind, solar and hydro company acquisitions (e.g. the Dalquhandy Wind Farm and Beatrice Offshore Windfarm). The nationality and sector of M&A deals are shown in Figure 5 and Figure 6. The investor base was more geographically diverse, with acquirers split relatively evenly between UK-based investors (52%) and international investors from countries including Germany, the US, Denmark and Japan.
The above trends were consistent with the interviewees’ experiences. They noted that investment activity in renewables and green infrastructure in Scotland had been concentrated in more established sectors, particularly off- and onshore wind, hydro and increasingly grid infrastructure and storage. Multiple interviewees noted offshore wind as the dominant area of capital deployment but commented on growing interest in enabling infrastructure such as transmission networks and battery storage (source – interviews with two banks, an asset manager (private markets), and a trade association). They identified a notable gap in areas such as hydrogen and nature-based solutions, where uncertainty around revenue models and market structures was perceived to have constrained investment appetite (source – interviews with an asset manager in public markets, and an asset manager in private markets). Similarly, they considered some noted retrofit and energy efficiency in the built environment had struggled to scale due to weak end-user demand and a lack of compelling financing propositions (source – interviews with two banks).
Figure 5. Cross-border and intra-border M&A deals in Scotland, 2020-2026, including UK
Figure 6. Cross-border and intra-border M&A deals in Scotland, 2020-2026, excluding UK
Source: LSEG databases, desk-based research
Financing structures and instruments
Loans were the primary financing instrument, accounting for 56% of the total deal amount. As above, the deals in this section were identified through LSEG’s deals database which captures publicly disclosed financing deals. This financing was predominantly directed towards large-scale renewable energy generation, battery energy storage systems (BESS) and electricity network upgrades. The majority of these deals take the form of term loans and revolving credit facilities tied to a specific green project rather than corporate lending backed by the company balance sheet. Bridge short-term loans and other corporate loan structures account for only three deals, all of which are partly located in Scotland (refer to Table 7 in Appendix A for more detail on the deal categories’ breakdown).
Bonds account for 35% of the total deal amount and are commonly used to finance projects fully located in Scotland, including Euro-medium term notes and retail crowdfunding bonds. They were used to support large-scale renewables, transmission upgrades in northern Scotland, and for general corporate purposes, such as refinancing corporate debt.
Equity-based deals appear to play a minor part in financing the green transition to date, representing 9% of total deal value. They largely comprise early-stage or blended public-private investments, typically the highest-risk but potentially highest-reward transactions in the investment cycle. An example is the Scottish RenewCo £38 million funding, in which both public sector bodies, including the Scottish National Investment Bank, and private investors provided capital to advance a 7GW onshore wind and solar pipeline (ESG News, 2025).
Other equity investments funded environmental restoration projects such as Flow Country peatlands and BESS projects. These supported grid preparation, carbon sequestration, biodiversity and grid stability. The concentration of equity activity in early-stage and blended structures points to a critical juncture in Scotland’s green finance landscape. Where revenue certainty is insufficient to attract debt financing and the risk profile remains too high for conventional lenders, public and mission-driven investors such as the Scottish National Investment Bank and the National Wealth Fund play a key role in absorbing first-loss risk and unlocking subsequent private investment.
The distribution of financing instruments used for green investment is shown in Figure 7. These data are calculated based on the total monetary value of each deal. For a more detailed breakdown see Table 7 in Appendix A.
Figure 7. Shares of the instrument types used in green investments in Scotland based on total monetary value, 2020-2026
Source: LSEG databases.
Interviewees confirmed that financing structures have largely remained conventional. They tend to rely on a mix of balance sheet lending and project finance structures such as a special purpose vehicle (SPV) with equity and senior debt. They also noted the increasing integration of ESG criteria into credit assessments (source – interviews with a bank and an asset manager in private markets). Banks primarily provide traditional lending products, including green loans. Larger infrastructure investors deploy equity through project finance vehicles, direct equity stakes, co-investments and secondary market acquisitions of operational assets, particularly in large-scale infrastructure (source – interviews with a bank, asset manager (private markets), and an asset owner). Investment sizes vary significantly, ranging from lending to SMEs below £1.5 million, to large-scale infrastructure projects exceeding £500 million. A substantial proportion of activity occurs in the secondary market, focused on de-risked, income-generating assets (source – interviews with a bank, and two asset managers (private markets).
The main financing approaches identified were:
Balance sheet lending and green loans: banks primarily provide traditional lending products, including green debt, to businesses ranging from SMEs (below £1.5 million) to large corporates.
Project finance via Special Purpose Vehicles (SPVs): entities that combine equity and senior debt for a single project, typically operating under a head contract with a local authority and subcontracting to a Tier 1 contractor, which helps allocate risk clearly.
Direct equity and co-investment: larger infrastructure investors deploying equity through direct stakes, co-investments and secondary market acquisitions of operational assets, particularly in large-scale infrastructure (source – interviews with a bank, asset manager (private markets), and an asset owner).
Secondary market: a substantial proportion of activity involves buying and selling existing operational assets rather than financing new ones, reflecting investors’ preference for de-risked, income-generating projects (source – interviews with a bank, and two asset managers (private markets).
The increasing integration of ESG criteria into credit assessments was also noted (source – interviews with a bank and an asset manager in private markets).
Asset classes
An asset class is defined as a group of investments that have similar attributes, behave similarly in the market, and are subject to the same regulations (A. Ganti, 2025) (see Appendix B for a full list). This section examines the types of assets related to the investments described above, i.e. the main investment categories in which finance was invested.
To provide additional insight into investment patterns, transactions were analysed from two asset-class perspectives. The first considers the type of investment exposure represented by the transaction, such as private equity, private debt or fixed income. The second considers the underlying assets or activities targeted by the investment, such as infrastructure or natural capital. These are represented in the ‘Asset class’ and ‘Asset class subcategory’ columns of Table 4, respectively. Given differences between the financing and M&A datasets used for the analysis, the classification approach varied slightly between them. For financing transactions, the underlying asset class was identified based on the stated use of proceeds, while for M&A transactions, it was determined based on the characteristics of the acquired company or asset.
Across all deals, excluding M&A transactions, private debt was the most common (61% of transactions), followed by fixed income instruments (31%) (see Table 4 below). Private equity transactions accounted for only 8% of deals. Within private debt, infrastructure debt was the prevailing subcategory (50 percentage points (p.p.)), followed by corporate debt (8 p.p.) and real estate debt (3 p.p.). Green bonds accounted for all fixed income transactions. For private equity, the subcategories were growth equity (6 p.p.) and natural capital investment (3 p.p.). Overall, debt-based instruments played a central role in green investment activity during the period analysed.
In our sample, there was a high degree of concentration in infrastructure-related investments, which was not only due to the prevalence of infrastructure debt transactions. Infrastructure assets were also financed through fixed-income and equity transactions, potentially indicating an investor preference for assets with established development pathways and long-term revenue potential. This composition of investment activity has remained relatively stable over the period analysed. While the number and value of transactions have increased, this growth was largely concentrated within existing asset classes. Infrastructure has continued to account for the majority of identified investments. This is partly explained by this research solely investigating deals over £10 million.
The representation of other asset classes, such as investments in natural capital (via private equity) and in green real estate (via private debt), was limited. The small number of transactions may indicate that these markets are less mature. Alternatively, this may be due to such deals financed through channels not captured in this analysis, and/or data not being in the public domain.
Table 4: Asset class types of the completed deals, 2021-Feb 2026
Asset class
Number of investments
Asset class subcategory
1. Private debt (total)
22
Real assets (infrastructure)
Infrastructure debt
18
Corporate debt
3
Real estate debt
1
2. Fixed income (total)
11
Real assets (infrastructure)
Green bonds
11
3. Private equity (total)
3
Growth equity
2
Real assets (infrastructure)
Natural capital investment
1
Real assets (natural capital)
Source: LSEG, desk-based research
The asset class used for M&A activity was less concentrated in infrastructure assets than other deals and included investment in a broad range of green sectors. While the majority of acquisitions still involved companies with exposure to infrastructure assets, many transactions targeted project developers, engineering firms, consultancies, technology providers and other specialised service businesses. As a result, it was not always possible to identify an underlying asset class, especially where the target company’s activities were the provision of services. Overall, M&A activity has facilitated investment in infrastructure assets and supported investment in technical capabilities, development expertise, and specialised services required to deliver the energy transition. Acquisitions have been used not only to obtain ownership of low-carbon assets, but also to strengthen capabilities across the wider green economy value chain. Where data were available, companies were mainly acquired through private equity.
Other investment characteristics
Investors in Scottish renewable and green infrastructure projects were mainly developers or operational firms, headquartered in Scotland or elsewhere in the UK. Operational firms describe those that are neither holding companies nor special purpose vehicles (SPVs), which applies to most corporations in the LSEG dataset. Examples include Pulse Clean Energy Ltd and FirstGroup PLC, whose primary function is to provide a service or good. Our data indicates thatmost investors were limited companies (65%), with public limited companies accounting for 15%. The remaining 20% are non-company entities such as public authorities. Of the investors from outside of the UK, a small share was from the rest of Europe (7.14%, from Finland and Denmark for example), while 10.7% of deals are from Canada and the United States.
Most deals financed with private capital were in the large-scale offshore wind and battery storage sectors. Public entities participated in strategic, community or blended-finance deals (e.g. Flow Country peatland restoration (discussed in Case Study 2), Orkney community wind and the Caithness-Moray HVDC connection). Debt was used equally by private and public investors. Public entities tend to play a larger role in bond financing, while equity is more commonly provided by private investors or blended capital.
Private investors and corporate subsidiaries were prevalent in M&A activity in Scotland’s renewable energy sector, with publicly listed companies playing a smaller but notable role. A total of 12 deals (48%) involved private investors. Of these, 8 (32%) were subsidiaries of larger groups and 5 (20%) were publicly listed companies, often using SPVs which are common in energy infrastructure deals. While it is not possible to confirm the specific characteristics of these SPVs based on publicly available information, SPVs are typically structured as project-specific entities.
Conditions influencing investment decisions
This section evaluates evidence on the factors influencing investor confidence in Scottish renewable and infrastructure projects. As such, it draws on eight interviews, and a written response from one institution. Where relevant, we also refer to published research to triangulate these views. As the sample size is not statistically representative, the input gathered does not provide a robust reflection of the views of all market participants.
Policy transparency and regulatory stability were perceived as key determinants of investor confidence. Respondents emphasised the importance of a stable legal and regulatory environment, particularly in established sectors such as offshore wind. In these, Scotland was seen to benefit from mature contracting frameworks and predictable governance conditions (source – interviews with a bank and an asset manager (private markets). However, with emerging sectors such as hydrogen, battery storage or nature-based solutions, some interviewees suggest a lack of familiarity and certainty around policy and longer decision processes may have impacted investor confidence (source – interviews with two asset managers (public and private markets), and a trade association). Stakeholders (asset managers, private markets) noted the absence of long-term revenue guarantees for hydrogen projects and limited visibility of local authority pipelines for early-stage renewable energy initiatives. Other research notes the policy landscape is still considered by some to be complex and cumbersome for many green sectors, including building retrofitting and electricity grids (GEFI, 2024a).
Revenue certainty emerged as a critical factor influencing investment decisions, particularly for capital-intensive infrastructure. Projects offering long-term income streams or supported by government appeared to be viewed by interviewees as significantly more attractive to institutional investors (source – interviews with an asset manager (private markets) and an asset owner). These included pension funds seeking stable, long-duration returns (source – interviews with an asset manager (private markets) and a trade association). This involvement was especially important in reducing perceived risk and enabling investment in large-scale assets once key development milestones, such as land access, had been secured (source – interviews with a bank and an asset manager (private markets). One interviewee noted that large infrastructure projects lasting 25 years or more require confidence in a minimum return (source – interview with an asset manager (private markets). The predictability of revenue streams is also important to debt lenders, who require confidence in a project’s cash flows before committing financing.
Interviewees from two banks indicated that their offering of green lending, for green residential real estate, was primarily demand-led, suggesting that capital availability was not the primary constraint where viable opportunities existed (source – interviews with two banks). This aligns with findings from the Scottish Government’s Green Heat Finance Taskforce that private lenders are doing significant work to develop and test products such as green mortgages. It noted the importance of wider measures in creating the overall conditions required for this market to flourish, with demand stimulation being a critical factor (Green Heat Finance Taskforce, 2023). These conditions include regulation, quality assurance standards, a well skilled and knowledge supply chain, and clear consumer protection measures. In relation to capital allocation more broadly, a private markets asset manager noted there is no internal cap or limit on capital allocation in Scotland, with investment decisions driven entirely by the availability of suitable opportunities (source – interview with an asset manager (private markets).
Several structural and delivery-related barriers were identified by interviewees as constraining investment. These included the lack of visible project pipelines and grid-related challenges, which affected project timelines (source – interviews with a bank and a trade association). A lack of a visible pipeline may make it difficult for investors to commit capital in advance or plan resource allocation. While some stakeholders noted the lack of a visible investment pipeline, it was not clear whether this was due to the low number of projects or a transparency issue. Other research has found that when major projects were known to investors, they were focused on a relatively small number of sectors, which meant little opportunity to diversify risk (Investor Panel, 2023).
Given the above, the Scottish Government has published a pipeline of costed and prioritised projects. The Green Investment Portfolio was launched in 2020 comprising ten market-ready projects with the value of £1.16 billion (Scottish Government, 2020). Interviews with stakeholders suggested mixed levels of awareness of the initiative. Further work is currently underway by the Scottish Government to raise awareness and publicise these portals and pipelines as part of its approach to investment.
Additionally, insufficient grid capacity may create uncertainty on whether it will be possible to integrate new RES projects in the energy system. In addition, concerns over weakening public support for decarbonisation and broader sensitivities around energy costs were noted as factors influencing the policy and investment environment (source – interviews with a bank and an asset manager (public markets). These factors may also complicate long-term commitments for investors, increasing the risks and affecting the revenue model.
Challenges were perceived as more acute for projects in emerging or less mature sectors. Hydrogen and nature-based solutions were consistently identified as facing difficulties in securing finance due to uncertain market structures and a lack of clear, reliable revenue streams (source – interviews with two asset managers (public and private markets). Respondents also highlighted the importance of mechanisms such as public guarantees, blended finance and long-term revenue support in enabling investment in these higher-risk areas, where purely commercial financing remained difficult to obtain (source – interviews with a bank, and two asset managers (public and private markets).
Other factors influencing investment decisions were mentioned less frequently but remain relevant. These included specific regulatory constraints such as high charges affecting certain technologies (e.g. pumped storage), as well as the importance of clear pathways for scaling projects from early-stage development to bankable infrastructure (source – interview with a bank and an asset manager (private markets)).
Investment in Scotland’s green and renewable sector is largely driven by existing project opportunities, as well as policy transparency, regulatory stability and revenue certainty. Structural and delivery-related barriers remain, particularly for emerging sectors such as hydrogen and nature-based solutions. While less frequent, other factors such as investor preferences and project scale also influence decision-making, highlighting the need for a stable and supportive environment to sustain growth in green investment.
Public financial institutions
Public financial institutions (PuFins) play complementary roles in crowding in private finance in Scotland. These include the Scottish National Investment Bank, the British Business Bank, the National Wealth Fund, British Patient Capital, Innovate UK, and GB Energy. There are also other public institutions and companies investing or supporting mobilisation of finance in Scotland, such as Scottish Enterprise and Scottish Futures Trust. Each target specific market failures and investment challenges and operates in different sectors based on technology and market maturity. These include: emerging innovations (Innovate UK, British Business Bank); supporting businesses at the growth stage (British Business Bank, GB Energy, National Wealth Fund); to supporting mature markets (British Business Bank, GB Energy, National Wealth Fund) as set out in Figure 8 below (HM Government, 2025).
The Scottish National Investment Bank (SNIB) provides patient capital, while seeking commercial, societal and environmental impacts from its investments. It invests in debt, equity and external funds (Scottish National Investment Bank, 2025). Since its launch in 2020, SNIB has invested £348.5 million and mobilised an additional £1 billion of third-party capital in net zero-related investment opportunities, which accounts for the largest share of its portfolio. These investments are in addition to the volumes described in the previous section, which were sourced from databases, apart from one £29 million deal. Priority sectors for the Bank’s net zero mission are battery and storage technologies, industrial decarbonisation, grid infrastructure, circular business models and materials, natural resources, and offshore wind supply chain and technologies. Relevant housing sectors from the Bank’s place mission include affordable and sustainable mixed tenure housing and decarbonisation at scale (The Scottish National Investment Bank, 2025). In 2024, SNIB held 39 investments, of which 16 deals were in net zero sectors, including renewable energy, energy infrastructure equipment, and alternative fuels. Leverage of private capital has been highest for investments in green sectors (The Scottish National Investment Bank, 2025). The case study in Box 1 below outlines a key project with SNIB involvement. Further case studies addressing projects with different characteristics in different sectors are summarised in Appendix D.
Meanwhile, the British Business Bank and Innovate UK support smaller early stage businesses. The British Business Bank provides loans and debt finance, including to smaller businesses. The Bank acts as a first mover and tends to invest in riskier but innovative businesses. Similarly, Innovate UK finances innovative businesses at the earliest stage, offering flexible finance and patient capital (HM Government, 2025). Innovate UK provides grants and loans, as well as advisory support for accessing business networks, regular engagement, and technology due diligence (British Business Bank, n.d.; Innovate UK, n.d., 2025).
The National Wealth Fund (NWF) invests for the longer-term. While its risk appetite is greater than that of commercial banks, the Fund focuses on technologies at later stages of development, construction, and commercialisation (HM Government, 2025). Clean energy, CCUS, hydrogen, battery manufacturing and EV supply chain, green steel, power grids, and energy storage are among the priority sectors (National Wealth Fund, n.d.). Additionally, the fund plans to target sustainable aviation fuels and critical minerals, and to accelerate the delivery of core infrastructure, including offshore wind, solar, building retrofitting, heat networks, and EV charging. NWF provides loans, equity and guarantees. In Scotland, it has invested £1.6 billion to upgrade the national grid and enable clean power and energy security across the UK. It also provides bespoke project development and investment support to the local government (National Wealth Fund, n.d.).
Some of the PuFins also partner to crowd in private finance. For example, GB Energy, NWF and SNIB invested in the Pentland Floating Offshore Wind Farm in Scotland, which was developed by funds managed by Copenhagen Infrastructure Partners (NWF, 2025). SNIB and NWF also jointly invested in Nova Innovation to scale up production of recyclable and compostable packaging (HM Government, 2025).
PuFins also support community projects in green sectors. In 2025, GB Energy (GBE) pledged to provide finance for local renewable energy projects in Scotland. Scottish Government has already defined a list of projects to be supported, including by its own investment (UK Government, 2025a). This commitment is part of GBE’s Local Power Plan, under which up to £1 billion of public investment is planned to scale community and locally owned energy projects across the UK (DESNZ, 2026). The plan provides for direct funding through grants, debt, and project finance, aiming to unlock wider investment in local and community energy projects. GBE has also established a £5 million Community Fund to support energy projects, though it is currently limited to England. It invests in equity and joint ventures for both clean energy projects and supply chain investments. It also provides grants, loans, blended finance, and capacity support for local government or community groups with a ringfenced Scottish element (HM Government, 2025).
Some public agencies facilitate increasing private investment in green sectors. For example, Crown Estate Scotland (CES) contributes to the development of offshore wind in Scotland by awarding and managing leases and other enabling work (Crown Estate Scotland, n.d.). It deploys patient capital, aiming to create environmental or social value alongside commercial returns. The Crown Estate – a separate entity to CES – focusses on a broader list of sectors such as science and innovation, clean energy, and nature and biodiversity (HM Government, 2025).
Overall, public financial institutions play a key role in addressing market gaps and enabling investment across different stages of the financing lifecycle. In doing so, they help to reduce risks and support the mobilisation of private capital into green sectors in Scotland. The ecosystem of PuFins with diverse mandates and risk appetites helps create financing continuity for businesses in green sectors as they transition from innovation and demonstration to commercial deployment. An important contribution is the provision of patient capital. This is particularly important in green sectors, which face long payback periods, often greater policy uncertainty, and substantial upfront infrastructure costs. In these cases, commercial finance alone may be reluctant to invest at early stages.
There was limited evidence from interviewees on the role of public institutions in mobilising private finance. However, stakeholders stressed the importance of a favourable regulatory environment and support mechanisms for the green sectors. The effectiveness of public finance institutions in mobilising private capital depends not only on the availability of public investment, but also on wider policy and regulatory certainty across the UK, particularly in capital-intensive and technologically nascent sectors.
Figure 8: Map of public financial institutions relevant for Scotland
Source: An introduction to the UK public investment landscape, HM Government.
Box 1. Case study: Quanterness Wind Farm loan
The Quanterness wind farm is a 28.8 MW community-owned onshore project in the St Ola region of the Orkney Islands, developed by Orkney Islands Council with financial support from the National Wealth Fund. Approved for investment in 2025, the project forms part of a wider portfolio of community wind developments across the islands. It will consist of six turbines, each with a capacity of 4.8 MW, and has an estimated build cost of £50 million. The project is fully financed through a £62.1 million government loan provided by the NWF, offering favourable interest rates aligned with government bond yields. A 15-year Contract for Difference (CfD) has been secured, ensuring long-term revenue stability and strengthening the project’s financial viability. Construction is expected to begin in 2027, with operations commencing in 2028, and debt repayment planned largely within the CfD period.
The investment is an example of broader policy support for onshore wind capacity in the UK and Scotland, as well as of the efforts to enhance local community benefits from RES projects. Quanterness benefits from proven wind technology, high local wind resource, and the potential to export electricity to the Scottish mainland via a planned interconnector. The project is expected to generate approximately 96.6 GWh of electricity annually – enough to power around 26,000 households – while avoiding approximately 40,000 tonnes of CO₂-eq each year. The project illustrates the role of public financing and revenue stabilisation mechanisms for development of green sectors.
Future investment appetite and priorities
Introduction
As noted in section 3.1, the Scottish government is developing a supportive environment to attract investors towards sustainable finance opportunities. In line with actions originally set out in the Green Industrial Strategy (2024), the government hosted a Global Offshore Wind Investment Forum in 2025, where it highlighted £500 million of investment in the Scottish offshore wind supply chain and outlined a goal of leveraging £1.5 billion of private investment.
The InvestScotland portal, also launched in 2025, is hosted by Scottish Development International, the agency responsible for trade and inward investment as the international arm of Scottish Enterprise. It showcases large-scale investment opportunities in renewable energy and other infrastructure. It is intended to support participation from international investors in major projects already underway or planned. These projects include Orkney energy infrastructure, Green Volt Floating Offshore Wind Farm, and Coire Glas pumped storage hydro.
This section provides an overview of publicly available information on which financial institutions are looking to meaningfully, structurally invest in Scottish projects in the short and medium-term. We focussed on the companies identified in Section 4 with completed deals in Scotland since 2020 and the major financial services firms currently operating in Scotland. Furthermore, we conducted a review of relevant news portals to identify published investor plans in Scotland since 2020. We also asked investors active in Scotland to comment on their investment plans. These stakeholders include large UK-based retail and commercial banks, globally active asset managers (across private and public markets), and infrastructure investors. Data in this section should not be treated as exhaustive. A lack of data on certain sectors does not imply a lack of investor interest. Evidence from stakeholders was used to complement desk-based research. Appendix A provides more details on the specific methodology. It should be noted that while the analysis of past deals in Section 4 does not include balance sheet financing, this form of financing is included in the analysis of future plans. This reflects the data available in public sources.
Institutions planning to invest in Scotland
A total of 28 existing and new investors has announced plans to invest in green sectors in Scotland. Of these, 16 were asset management companies, eight were corporate investors, and four were PuFins (see Figure 9). The asset management category includes those seeking to adopt several different investment strategies, including private equity strategies, such as venture capital and growth equity (see Appendix B for definitions), and infrastructure investing.
The corporate investor category included several that plan to invest in Scotland either via their balance sheets or by raising equity and/or debt from the market. For example, SSE plc has announced significant investment planned in electricity transmission, distribution, flexibility and renewables. It plans to invest £33 billion over the course of 2026-2030, with the financing being sourced through a combination of equity issuance and debt (Latief, 2025). For six of the identified investors, the available information does not specify clearly the method, only that the plan to invest was announced.
Several PuFins were also identified: the National Wealth Fund, the Scottish National Investment Bank, and Great British Energy. These institutions either provide grant capital, guarantees, debt or take equity stakes depending on their mandates and the nature of the deal. The National Wealth Fund, under its five-year strategic plan until 2030-2031, plans to invest in power grids, carbon capture and storage, hydrogen, energy storage, offshore wind, solar and EV charging infrastructure (National Wealth Fund, 2026). As of February 2026, the SNIB has committed over £1 billion to Scottish businesses and projects in the preceding five years. With the Scottish government announcing a £2 billion capitalisation over a 10-year period, the SNIB expects to deploy another £1 billion over the next five years (SNIB, 2026). Finally, GBE was awarded £8.3 billion in the 2025 UK government spending review for projects across the UK, however, the total allocation to Scotland has not been indicated (Great British Energy, 2025). There have, however been standalone announcements on funding for Scotland through GBE for public sector buildings and community and local renewable schemes with £4.85 million allocated in March 2025 (UK Government, 2025b) and another £5.5 million in December 2025 (UK Government, 2025a).
Figure 9: Organisations with future plans to invest in Scotland, announced since 2020
Source: desk-based research conducted in February and March 2026, which focused on identifying investors with plans to invest in Scotland. This included reviewing public announcements from the companies identified in Section 4 with completed deals in Scotland, major financial services firms currently operating in Scotland and relevant news portals. For more detail on methodology and sources, see Appendix CC. The figure only includes organisations that have publicly announced intentions and therefore should not be considered exhaustive.
Short- and medium-term priorities
This section categorises identified investment plans into short (< 5 years) to medium (5-10 years) term and within five broad categories: renewable energy; energy storage; grid infrastructure and transmission networks; nature-based solutions; and carbon capture and storage. These categories are based on themes emerging from desk research as well as insights on sectors of interest gleaned from stakeholder interviewees, publicly available data and investor announcements. These investors themselves are described in section 5.1.
A total of 20 investors were identified. These include investors that announced plans for a specific sector. Note we excluded eight investors that are “open to multiple sectors” from this section. These are discussed in section 3.
Figure 10: Number of investors that plan to invest in Scotland by sector of investment, as announced since 2020
Source: desk-based research conducted in February and March 2026,
The most common form of capital deployment that investors plan to utilise is taking equity stakes in the target project or company. There were 20 investors that intend to invest through equity stakes. The review also identified several instances of investors planning to finance projects through the firm’s own balance sheet. This is followed by the provision of loans by lenders. The least common forms were guarantees or grants, which would be likely to be provided by the UK government or PuFins.
Ticket sizes vary significantly and reflect both the investment need and stage of development of the target business or project. As an example of lower ticket size investments, the Foresight Group’s Foresight Scotland Fund invests between £1-5 million in “growing businesses across Scotland”, with businesses in the renewables sector eligible for investment through various deal types (Foresight, 2026; Scottish Enterprise, n.d.). For large-scale projects or major business expansion plans, investment sizes can run into billions of pounds. An asset manager estimated that wind farm and storage assets may require additional capital of £1 billion over the next four years (source – interview with an asset manager (private markets).
Banks and asset managers investing in the UK do not publicly quantify their Scottish green investment plans. Interviewees referred to two banks active in the UK that do not have specific plans for Scotland, but rather UK-wide environmental spending and sustainable finance goals (source – interviews with two banks). A similar sentiment was expressed by two asset managers. They noted investment allocations in the UK are not regionally based, but rather, on the most attractive investment opportunities which meet their customers’ risk and return expectations across various asset classes (source – interviews with an asset manager (public markets) and an asset owner).
Sector and technology focus
Using the investor categories and the priority investment sectors described above, Figure 11 disaggregates the type of organisations that are planning to invest along with the destination sector. The renewable energy category is the most common sector and has the greatest diversity of investor types, followed by nature-based solutions and energy storage. The “open to multiple sectors” category comprises asset managers with past activities or investment in green sectors that have either announced a plan to invest in several green sectors in Scotland, or have general investment volumes, or funds allocated to Scotland.
Figure 11: Investment plans by sector and type of investor
Source: desk-based research conducted in February and March 2026, which focused on identifying investors with plans to invest in Scotland. This included reviewing public announcements from the companies identified in Section 4 with completed deals in Scotland, major financial services firms currently operating in Scotland and relevant news portals. For more details on methodology and sources, please see the Appendices. Note: the investment plans by sector may number more than the plans identified.
Available investment plan evidence suggests that renewable energy is the most common sector of interest for investors with plans for Scotland (see Figure 11). In Scotland, this sector primarily consists of onshore and offshore wind farms, given that onshore wind represents 59% and fixed offshore wind represents 24% of installed renewables capacity in Scotland as of Q3 2025 (UK Government, 2026). A bank interviewed as part of the study noted that it is keen on supporting the UK Clean Power Plan, has developed an internal strategy to align with that plan and has become a financier of the energy transition in the UK (source – interview with a bank). Interviewees also implied increasing interest in complementary sectors key to the rollout of renewables and clean power transition, for instance grid infrastructure, transmission networks and energy storage. Two asset manager interviewees indicated that the pump hydro storage sector will be a priority for them in the near future as such projects provide long term revenue certainty (source – interviews with two asset managers (private markets)).
This is in line with the findings of CBI Economics, which noted that Scotland has a significant role in the UK’s planned energy infrastructure development, with around £211 billion of planned energy infrastructure investment and 88 GW capacity. This is equivalent to 34% of the UK’s total infrastructure pipeline by value. Battery storage (33.4 GW), onshore wind (20.3 GW), offshore wind (17.7 GW) and pumped storage hydroelectricity (9.6 GW) account for the largest shares of planned capacity (CBI Economics, 2026).
Nature-based solutions are another common category of interest for investors. There are a wide variety of projects that fall under this category. The research identified five investment plans in the areas of rewilding, peatland restoration and forestry management. Rewilding typically generates returns through natural capital markets, peatland restoration through carbon credit sales and broader ecosystem services, and forestry management through sustainable timber harvesting and carbon credits. While there is investor interest in nature-based solutions, stakeholders noted uncertainty around offtake and long-term returns, which can reduce their attractiveness relative to other investment opportunities. They judged that if these issues could be mitigated, for example via market-based or government mechanisms, they have potential for further scale in Scotland (source – interviews with an asset manager (public markets) and a bank).
Limited evidence was found of investments plans for the carbon capture and storage (CCS) sector. The research identified one plan for this sector. In addition to publicly disclosed plans, two interviewees expressed that CCS projects could be developed in Scotland (source – interviews with an asset manager (public markets) and a bank). We did not find specific evidence on why the number of companies that have announced plans on CCS was low. This could be due to a lack of viable and attractive investment opportunities, insufficient policy and regulatory support, the carbon dioxide removal market not yet reaching the scale required for supporting revenue streams, the status of non-pipeline transport options for greenhouse gas removals, or simply due to investors not divulging their plans.
These findings align with investor preferences at the UK level, as reported in the Deloitte survey on investing in the energy transition (Deloitte, 2026). This survey comprised of 106 investors and included both institutional and corporate investors, 49% of whom were located in the UK. This indicated that investors have greater interested in energy storage, mature renewables (solar and onshore and offshore wind), grid infrastructure, and some emerging technologies (green hydrogen). These are followed by EV charging infrastructure, CCS, low-carbon buildings, low-carbon transport and others.
Barriers and opportunities for scaling investments
Several interviewed stakeholders had positive views on investment opportunities in Scotland, with one asset manager noting that it will likely have more progress than the rest of the country due to more ambitious climate targets. The preceding analysis highlights the growing scale of investment deals to date. Moreover, according to a 2026 survey by Deloitte, UK investors appear more committed to the energy transition than a year ago (Deloitte, 2026). At the same time, stakeholders identified several structural barriers to scaling investments. In many cases, this reflects challenges in scaling investment and associated activity and cannot be interpreted as indicative of wider sentiment. Similarly, several reflect external factors arising from global conditions. These barriers and opportunities were:
Project-level investment risk: One bank noted that investment in sustainable finance could be scaled by more targeted blended finance or instruments such as guarantees or insurance that reduce investment risk for banks (source – interview with a bank). This aligns with the findings of Deloitte’s 2026 survey of investors interested in the UK energy transition. This indicated a desire for more direct public funding/support for early-stage projects, such as tax credits, exemptions and public co-funding. While scaling needs blended finance, including CfDs, Regulated Asset Base (RABs) and revenue support (Deloitte, 2026).
Long-term certainty to reduce risk: The 2026 Deloitte survey found that clear visibility of risk or predictable cash flows is crucial for investments in energy transition (90% of respondents), and that this is a crucial challenge for the sector. In an interview an asset manager underlined that for capital intensive projects, investors require long-term certainty that returns on investment are secure (source – interview with an asset manager (private markets). This is in line with findings from the “net zero: investment panel” report, which recommends the private and public sectors work closely together (Investor Panel, 2023).
Lack of grid infrastructure: The Deloitte survey noted above found that for most investors (70%), an expanded and modern electricity grid is a key energy transition enabler, with policy support to incentivise investments in grid optimisation, balancing services, data and technology solutions, and hardware manufacturing.
Inefficiency of permitting processes: The Deloitte survey also confirms that faster planning and permitting should be a key energy policy priority, (77% of respondents).
Shortage of skilled human capital: Previous research has noted a need to increase understanding of private sector investment skills requirements to better inform upstream policy development and downstream policy implementation (Investor Panel, 2023). It is not clear that this relates to green investments specifically or acknowledges the extent of devolved powers, however. Despite this, the Deloitte survey notes investors are cautiously optimistic that the UK will develop the green skills needed for energy transition by 2030.
City-level partnerships: One asset manager pointed to city partnerships in England where cities and local authorities appoint a private-sector partner to work with and develop a pipeline for green projects. These are long-term partnerships over 10-15 years working towards specific KPIs. A similar model in Scotland may encourage investors to invest in projects which otherwise may be riskier (source – interview with an asset manager (private markets). There have been recent developments towards such partnerships in Scotland, such as the national Wealth Fund’s Regional Accelerator Project in Glasgow (NWF, 2025).
Adaptation investment: One bank noted that while there is often a business case for adaptation and resilience investment, many businesses do not yet see it as a revenue generating opportunity. As better climate intelligence and data become available, more investment in this area could be made (source – interview with a bank).
Nature investment: One asset manager pointed out that the challenge with nature-based solutions is the lack of certainty about the end market for carbon credits, which puts investors’ returns at risk (source – interview with an asset manager (public markets). One bank similarly noted that there is greater equity risk in nature-based investments, as there is relatively less price and offtake guarantee (source – interviews).
In summary, the renewables sector features most prominently in investors’ priorities with complementary plans announced in the grid infrastructure and energy storage sectors. There is also investor interest in nature-based solutions, although they generally seek more certainty around project viability and profitability to scale investment in this sector. There are several opportunities to facilitate further sustainable finance flows in Scotland. They include:
growing investor relations management capacity, providing clarity to investors on who to engage with and how.
devising a pipeline of strategic investment priorities with transparency on Government support. Targeted support to Small and Medium Sized enterprises (SMEs) is likely to be particularly important.
Consider the need for further supporting mechanisms around business models for adaptation and nature-based investments.
Undertake further specific analysis on targeted investment support needs to decrease project level risk.
Green financial service providers in Scotland
Introduction
This section identifies the institutions providing green financial services in Scotland and outlines the services and products they offer. We evaluate their green investment targets, commitments, and note sustainable investment strategies, where data are available. It should be noted that not all investors disclose their activity in Scotland, hence, most findings in this section are based on evidence gleaned via global financial institutions. Appendix C Provides a list of data sources. Green financial initiatives in Scotland are also analysed.
We identified the largest financial service providers present in Scotland using the LSEG database and the Net Zero Finance Tracker of the Climate Policy Initiative. This list was complemented with a further review of financial institutions, which identified one further company. These institutions were screened in terms of the green financial services or products they offer. As noted above, many Scotland-based institutions operate within wider group structures, which report sustainability performance at the international group level. As such, analysis was conducted at the group level where appropriate. A total of 49 institutions were identified and included in the analysis. Desk-based research also identified green services and financial instruments, green targets, associated commitments, and governance structures. The institutions analysed is not exhaustive, reviewing all financial service providers present in Scotland (over 1,700) was outside of the scope of this research. Additionally, nine interviews were conducted, and one institution provided answers in writing. Organisations represented included banks (4), asset managers working either in private (2) or in public (1) markets, or both (1), and a trade association. The names of institutions interviewed are not provided for reasons of confidentiality.
Overview of service providers
Most of the large financial institutions that were analysed have headquarters in Scotland, elsewhere in the UK and the United States. Out of the 49 financial service providers analysed, 27% have either their main or regional headquarters in Scotland. The remaining companies are headquartered in the rest of the UK, mainly London (31%), and the USA (24%), Canada (6%), Australia (4%), Switzerland, Luxembourg, Denmark and France (2% each). This pattern is in line with other published research. For example, the United States was the single biggest originator of Scottish foreign direct investment (FDI) projects in 2024, comprising 27% of Scotland’s total FDI based on analysis from Ernst and Young (EY, 2025).
Among the Scottish providers, we distinguished between four types of institution. These categories are used as practical groupings for the purposes of the analysis and do not imply that institutions’ activities fall exclusively within a single category:
Asset managers in public markets, defined as companies that manage third-party capital and invest it in public markets, i.e. listed companies.
Asset managers in private markets, defined as companies that manage third-party capital and invest it in private markets, i.e. projects or non-listed companies.
Asset owners, defined as institutions that invest their own capital institutions and invest it directly and/or via external managers, e.g. insurance companies or pension funds; and
Banks.
In terms of the number of investors, asset management companies were the largest category identified as providing green financial services and products (63%), followed by banks (20%) and asset owners (16%). In the asset management category, the majority of institutions focused their overall activity on private markets (33 percentage points (p.p.), although many worked both in public and in private markets (22 p.p.), and a smaller share focused solely on public markets (8 p.p.). Those categories can be further broken down into subcategories:
Asset managers working in private markets were represented by global alternative asset managers (see Appendix B for definitions) investing across a range of sectors and strategies, including private equity.Those included Blackstone, KKR, Apollo Global Management, Brookfield Asset Management, the Carlyle Group, CVC, Permira, Bain Capital. While these organisations invest in green sectors, this tends not to be the primary investment focus. Brookfield invests across multiple sectors (e.g. infrastructure, real estate, private equity). It appears to have stronger activity in green sectors than those listed, but this is undertaken as part of a broader strategy. The second largest subcategory was investors specialising in green sectors, such as renewables and storage, as well as infrastructure more generally. These tend to invest long-term, alongside developing and operating assets. They include Macquarie/Green Investment Group, Quinbrook, Equitix, IFM, Schroders Greencoat, Copenhagen Infrastructure Partners, InfraRed, and Foresight.
Asset managers working in public markets allocate capital in listed equities, including those in green sectors. These include Baillie Gifford, Alliance Witan, Scottish American Investment Company. Their role in green finance is mainly indirect, as they invest in listed companies rather than directly fund green projects. They support green outcomes by choosing to invest in greener companies or by influencing companies they own shares in. Hence, their role can become more active through long-term stewardship. While these institutions have a global reach, these managers allocate capital to Scottish companies in addition to international portfolios.
Asset managers working in private and public markets comprise two types. The first is companies operating globally and investing mainly in public markets with some exposure in private markets. These include BlackRock, State Street Global Advisors, Amundi, Invesco, Pimco, Franklin Templeton, Northern Trust. They act through capital allocation, integration of green and climate aspects in their investments, and stewardship. The second type is UK-based asset managers who, while investing in public markets, have a stronger presence in private markets, for example, abrdn, Schroders, M&G, Foresight.
Asset owners were represented by pension funds – for example, CPP Investments, Ontario Teachers, and insurance companies – for example, Scottish Widows, Aegon, Prudential, Legal & General, Royal London, Phoenix. Based on publicly available information on their past activity, nearly all have significant exposure to the UK market. However, Scotland does not appear to be identified as a distinct focus market. Some evidence suggests that Pension funds are increasing their investments in renewable infrastructure, such as solar, wind, and hydropower more generally (Pensions Policy Institute, 2024).
The most common sector that institutions in Scotland invest in or finance is renewable energy. Nearly all investors have exposure in renewables, with wind and solar being the most common (see Figure 12). Most of the identified institutions also appear to channel capital into projects or companies involved in energy storage. Despite this, investments portfolios appear to be diversified and include buildings, transport, industry, energy efficiency, circular economy, sustainable water management, nature-based solutions and carbon removal. In terms of specific examples, Equitix and Macquarie Asset Management have supported the offshore wind sector in Scotland, Copenhagen Infrastructure Partners has financed the construction of battery energy storage in South Lanarkshire, and Carlyle has invested in green ammonia company based in Edinburgh (Carlyle, 2022; Copenhagen Infrastructure Partners, n.d.; Equitix, 2023; Macquarie Group, 2024). Banks, such as TSB and Virgin Money, have provided finance for energy efficiency in residential buildings. Some banks are increasingly establishing dedicated teams and platforms to support green infrastructure and emerging low-carbon technologies, including Lloyds Banking Group, NatWest, and HSBC.
Figure 12. Investment sectors of Scottish green financial service providers
Source: desk-based research, see Appendix C for the list of sources. RES is “renewable energy sources”.
Green financial instruments
Our research indicates financial service providers present in Scotland tend to use the three key types of instruments to finance their activity in green sectors. Those are equity investments that differ between public markets (listed shares) and private markets (direct project or asset ownership), green bonds, and loans. The use of these instruments and their subtypes vary between institutions.
Asset managers in private markets primarily use equity and debt, where equity represents direct ownership in green infrastructure and projects, particularly in the renewables sector. Some large generalist investors may deploy all three instruments, including bonds – for example, Blackstone, KKR, Brookfield, Apollo. More specialist managers, such as Quinbrook, Equitix, and Schroders Greencoat tend to focus on equity. Additionally, some asset managers offer green and sustainable funds or sector-focused investment strategies. For example, Quinbrook manages the Net Zero Power Fund, and Apollo’s Sustainable Investing Platform helps to deploy capital in energy transition and decarbonization (Garcia, 2024).
Conversely, asset managers operating in public capital markets rely more on listed equities and bonds, which reflects their investment strategies. For example, Baillie Gifford, Alliance Witan, and the Scottish American Investment Company. ESG-labelled or sustainability funds with a broader mandate than funds focused on climate and environment objectives are also offered – for example abrdn’s Global Corporate Sustainable Bond Fund, range of ESG ETFs and active funds of Invesco.
Asset owners, such as pension funds and insurers, tend to use all three instruments, i.e. equity, bonds, and debt. This is likely due to their diversified portfolios and long-term strategies that include both public and private markets for example CPP Investments, Ontario Teachers’, Legal & General.
Larger international banks, such as JPMorgan, HSBC, and Barclays, tend to use a mix of equity and debt, while the smaller or domestic banks – e.g. TSB, Hampden & Co, Virgin Money, appear to usually provide debt only. Other banks also use labelled debt instruments – green bonds, sustainability and sustainability-linked loans – for example NatWest, JPMorgan, HSBC.
Green services
Green financial service providers present in Scotland offer a wide range of services, which vary by institution type. Our research indicates that institutions working in private markets tend to invest directly in projects and assets, while institutions working in public markets appear to allocate capital and influence companies through investment decisions and engagement. Banks also help structure transactions, while asset owners primarily supply long-term capital.
Table 5 provides a summary of the services offered, by the types of institution. These services include direct ownership of projects as well as ongoing asset management. In practice, functions such as due diligence, structuring and climate risk assessment also form part of their service but built into the investment process. This reflects the nature of investments in green infrastructure and other real assets, which often require hands-on involvement.
Table 5: Services offered by green financial service providers
Function / Service
Private market asset managers
Public market asset managers
Asset owners
Large banks
Smaller banks
Capital allocation
Yes
Yes
Yes
Yes
Limited
Investment portfolio management
Yes
Yes
Yes
Yes
–
Asset ownership, active management
Yes
–
Partial
–
–
Lending
Yes, private credit
–
Indirect
Yes
Yes
Underwriting (bonds/equity)
–
–
–
Yes
–
Advisory/ structuring
Yes, embedded
Limited, embedded
–
Yes
Limited
Climate analytics/ scenario tools
Yes, embedded
Yes
Yes, internal
Yes, embedded
Limited
Stewardship/ engagement
Yes, asset level
Yes, corporate level
Yes, often delegated
–
–
Source: based on desk-based research, see Appendix C for the full list and Appendix B for definitions. In this report, we understand stewardship and engagement as cases in which investors use their ownership rights to influence company behaviour. Banks do not undertake stewardship in this sense, but may influence counterparties through the credit process, including through lending conditions, covenants, and ongoing borrower engagement. This aspect of banks’ activity was not analysed in the current study.
Private market asset managers appear to provide the most comprehensive range of services. Their activities usually cover the full investment lifecycle, from allocating capital to managing assets in the long run. But public market asset managers also provide a range of services, focussed on investments in listed markets. Their role focuses on portfolio management, supported by research and company analysis, including the integration of climate considerations into investment analysis and decisions. They engage with companies through stewardship activities, such as dialogue with management and voting at shareholder meetings, influencing decision-making and investment strategy. Some firms provide analytical tools, such as climate risk metrics or scenario analysis, although these are usually part of their broader investment offering rather than standalone services – for example, Blackrock, Amundi, Northern Trust Asset Management.
The identified asset owners, such as pension funds and insurers, mainly act as providers of capital. They allocate capital across asset classes and investment managers, with investment strategy typically set in-house but implementation often delegated. While they use climate-related analysis to inform their decisions, these capabilities are typically internal and not offered externally. Their role in green finance is therefore indirect, as they support investment rather than deliver financial services. This role is closely linked to asset managers, with asset owners influencing investment outcomes through the mandates and requirements they set.
Banks provide green financial services via lending and by arranging and structuring transactions, including loans and bond issuance, but the extent and diversity of services differ. Larger banks offer a wider range of services, including lending, underwriting and support with structuring transactions. They may also provide advisory support, for example Lloyds Banking Group, incl. Bank of Scotland, advises on energy transition finance and provides transition planning advisory services. These activities are often supported by internal analytical capabilities. Smaller or more domestically focused banks tend to focus on lending only, such as green mortgages or financing for smaller businesses, with limited involvement in capital markets or advisory services.
Green financial service providers also use proprietary tools and frameworks to support green investment. Several firms have developed internal platforms and methodologies, such as climate scenario analysis tools (e.g. Blackstone), ESG data and analytics systems (e.g. Invesco, Northern Trust Asset Management), and decarbonisation or net zero frameworks used to guide portfolio companies (e.g. Brookfield). These tools are used to support investment decisions, risk assessment, and portfolio monitoring, rather than being offered as standalone services. At the same time, banks also provide client-facing services, including carbon foot printing tools, business transition planning, and assistance with regulatory reporting and ESG ratings – for example, NatWest Group (NatWest and Royal Bank of Scotland), JPMorgan Chase. Some banks also provide more targeted support, such as mentoring or advisory services for climate-focused businesses, e.g. Barclays.
Banks appear to be the most active providers of finance for small and medium enterprises (SMEs). The majority institutions reviewed provide loans to SMEs, including those working in green sectors. Asset managers, both those in public and in private markets, appear to have a mixed approach. While a few firms, e.g. Blackstone, KKR, Carlyle, Schroders, Invesco, Amundi, invest in SMEs, others do not, focusing on large-scale investments only. Overall, SME financing in green sectors appears to be driven mainly by banks, with other institutions contributing either in a more targeted or indirect way. At the same time, SMEs make up the vast majority of Scotland’s net zero economy, accounting for around 90% of identified firms (CBI Economics, 2026).
Limited evidence has been identified that institutions in the sample provide venture capital to companies in green sectors in Scotland. Some asset managers, a small number of banks and asset owners invest in early-stage companies. However, many others, particularly those focused on large-scale infrastructure, do not appear to provide this service. The available data do not specify whether they direct venture capital towards green sectors. As a result, while some institutions provide venture capital, its role in supporting early-stage development in green sectors cannot be established based on the available evidence. We did not identify evidence that private equity firms support the growth and scaling of such companies.
Green targets and commitments, internal governance structures
As a result of regulatory requirements as well as industry initiatives, financial institutions are increasingly required to measure, disclose and reduce emissions, including those associated with their financing and investment activities. Financial institutions are also increasingly being evaluated on the real-economy impact of their transactions, with data providers such as LSEG and Bloomberg incorporating such metrics into their assessments. This section summarises thematic findings on whether the institutions we analysed have published green targets or have associated governance structures supporting green investment activities.
Most of the analysed institutions have adopted targets on greenhouse gas (GHG) emissions reductions, although their scope and level of ambition vary. The most common approach is the adoption of net zero targets by 2050, often supported by interim targets for 2030. In particular, the asset managers and banks in our sample have set such targets, for example Brookfield Asset Management, Carlyle, Schroders and Legal & General. These organisations combine long-term net zero commitments with interim emissions reduction or portfolio alignment targets. Despite this, around a third of institutions do not appear to have adopted explicit 2050 net zero targets. A number of firms either focus on operational emissions only or have not set portfolio-level targets. Some have weakened GHG emission reduction targets or withdrawn from net-zero or climate alliances. Overall, their scope, coverage, and implementation vary.
Often these targets cover financed or portfolio emissions. However, in some cases it was not clear which emissions the targets cover. In private markets, green targets are often linked directly to portfolio companies and assets. For example, Blackstone has introduced an emissions reduction target applied to certain investments where it has operational control, while CVC sets targets for portfolio companies to adopt science-based emissions reduction targets over time. InfraRed Capital Partners also focuses on portfolio alignment with net zero pathways and has committed to engaging with the companies responsible for the majority of its financed emissions. Overall, these investors appear to have more influence over underlying assets compared to public market investors.
In addition to setting targets, many institutions have made commitments to increase financing or investment in green and transition activities over a defined period. Large banks in the sample have been the most active in setting quantified commitments, often in the range of hundreds of billions or more, typically covering lending, underwriting, and investment in green and transition activities. For example, NatWest Group, HSBC, Barclays and JPMorgan have all set substantial targets. The commitments are not typically specificallylinked to Scotland or other countries and regions. This is in line with the findings from stakeholder interviews, as several banks confirmed they do not have specific Scottish targets or commitments (source – interviews with two banks).
Among asset managers, several institutions have explicit pledges on green financing, but this practice does not appear widespread. Firms such as Blackstone and Apollo have announced large-scale investment targets in green or decarbonisation strategies, while Brookfield has raised significant capital for funds dedicated to the energy transition. Infrastructure-focused investors sometimes commit to allocate capital to specific green sectors. Copenhagen Infrastructure Partners aims to raise €130 billion by 2030 for greenfield renewable energy investments.
Governance of green investment is usually embedded in broader corporate governance and risk management. Boards and Board committees, e.g. risk, sustainability, or governance committees, often set overall direction, approve strategies, and monitor progress. Executive committees and senior leadership translate strategic objectives into operational processes.
Many companies have dedicated sustainability or responsible investment teams. These teams develop policies, provide analytical support, and coordinate reporting, while working closely with investment, risk, and business units. It is not clear if there are dedicated teams for Scottish investment. Additionally, climate and sustainability aspects are often integrated into existing functions such as risk management frameworks, due diligence processes, and portfolio monitoring.
Moreover, green financial service providers oftenintegrate climate considerations throughout the investment lifecycle. They embed climate risks and opportunities in investment decision-making, instead of treating them as a separate activity. This spans initial screening and due diligence to asset management and stewardship, in particular, for private market investors.
Interviewees suggest climate considerations are integrated into institutions’ strategies in different ways. For banks, this may involve a combination of internal operations, customer products, and supplier engagement (source – an interview with a bank). For asset managers, client demand often determines the way climate change is integrated, depending on the mandates from investors (source – an interview with an, asset manager (public markets)).
Overview of initiatives aimed at mobilising green finance
There are several initiatives that aim to mobilise green finance in Scotland. We have identified some of the key partnership-led efforts to strengthen Scotland’s green finance ecosystem below. They support different stages of the green investment cycle, including early-stage innovation and commercialisation, project pipeline development, system-level coordination and strategy, as well as capital mobilisation and scaling. While some initiatives focus on specific segments, such as climate technologies or nature-based solutions, others take a broader approach to enabling green finance across sectors. The initiatives are as follows (the full list of participants is in Table 6):
Climate Tech Accelerator supports early-stage climate technology companies by providing mentoring, network access, and business development support (ScotlandIS, 2025). It was founded in 2025 through a partnership between Barclays and Sustainable Ventures (Sustainable Ventures, 2021).
Facility for Investment Ready Nature in Scotland (FIRNS) focuses on developing a pipeline of investable nature-based projects (NatureScot, n.d.-b). It addresses barriers such as limited sources of revenue and limited pipeline and scale (NatureScot, 2026). While it does not deploy capital directly, it is designed to unlock private investment into nature. It was founded in 2023 by a partnership of the Scottish Government, NatureScot, National Lottery Heritage Fund and Green Finance Institute (Green Finance Institute, 2026).
Restore Scotland’s Native Woodlands supports the financing of environmental projects such as forestation, targeting landowners interested in nature restoration and carbon capture programmes (NatureScot, 2023). It was founded in 2023 by a partnership of Hampden & Co Bank, NatureScot, Lombard Odier Investment Managers, and Palladium. It aims to mobilise up to £2 billion for landscape-scale native woodland restoration projects.
Transition Finance Scotland supports the mobilisation of capital into priority decarbonisation sectors (Green Finance Institute, 2025). Objectives of the initiative include unlocking green investments across Scotland, generating economic and employment opportunities and leveraging public finance to crowd in private investment. It was founded in 2025 by a partnership of the Green Finance Institute and 40 leading Scottish organisations across financial services, project developers and the public sector, to help facilitate expansion of investment in net zero initiatives.
Carbonplace supports the secure and transparent transfer of carbon credits by providing market infrastructure that improves efficiency and trust in carbon markets (Segal, 2023). It was founded in 2021 by a partnership of banks including NatWest Group and other global financial institutions and became independent in 2023.
The Scottish Taskforce for Green and Sustainable Financial Services supported the development of Scotland’s green finance sector through coordination, strategy, and policy alignment (Global Ethical Finance, 2024). It was active in 2022-2024 and was a partnership of the Scottish Government, Global Ethical Finance Initiative, Scottish Financial Enterprise.
The accelerating Scotland’s Impact Investing Ecosystem initiative supports the growth of Scotland’s impact investing market by improving coordination, strengthening networks, and increasing visibility of investment opportunities (Impact Investing Institute, n.d.). It is a partnership of the Scottish National Investment Bank and Impact Investing Institute. SNIB supports the design of the initiative as the key partner and shares key insights on the investment landscape in Aberdeen and the larger Scottish ecosystem.
The Scottish Business Climate Collaboration supports SMEs in developing carbon reduction plans and transition strategies (Scottish Business Climate Collaboration, 2026). It was founded in 2021 by Aggreko, Bank of Scotland, Diageo, EY, Scottish Power, Scottish Water, and Zero Waste Scotland (Newlands, 2021).
Table 6. Initiatives with aims including mobilisation of green finance in Scotland
Name of the initiative
Participants
Theme/Focus
Climate Tech Accelerator in Scotland
Barclays & Sustainable Ventures
Climate-technology, Start-ups
Transition Finance Scotland
Green Finance Institute
Green Finance
Scottish Taskforce for Green and Sustainable Financial Services
Scottish Government, Global Ethical Finance Initiative, Scottish Financial Enterprise
Green Finance
FIRNS – The Facility for Investment Ready Nature in Scotland
Scottish Government, NatureScot, National Lottery Heritage Fund, Green Finance Institute
Nearly all the identified initiatives involve the Scottish Government as a key partner. This highlights the importance of public–private collaboration in efforts to mobilise green finance in Scotland. In addition to these initiatives, there are other Scotland-based programmes that do not directly mobilise financial capital or address investment barriers but which do contribute to net zero, nature restoration and broader sustainable development objectives more generally (Landscape Finance Lab, 2026; Scottish Government, n.d.). These initiatives leverage existing finance for net zero or adopt a more research and advisory-oriented approach (Adaptation Scotland, 2024). For example,the Clean Transport Accelerator supports early-stage clean transport companies by providing mentoring, expert guidance, and access to networks (Flux Aviation, 2024; NatWest Group, 2023). It was established through a partnership between NatWest Group and Warwick Manufacturing Group and focuses on strengthening innovation and investment readiness in the transport sector.
Frameworks to identify gaps and opportunities
Introduction
This section presents approaches that could be used to identify the opportunities that could be leveraged for green finance in Scotland, as well as the gaps, and challenges for future investment. It is based on a targeted review of international best-practice approaches and guidance that could be adopted by the Scottish Government or their agencies to support identification of market gaps and investment opportunities. We reviewed documents that capture both conceptual and practical approaches to diagnosing how to attract private green investment.
Assessment of investment opportunities
In the documents reviewed, the identification of investment opportunities tended not to be viewed as a separate step, rather as the result of other actions, such as policy prioritisation, analysing sector needs and associated financial flows. However, several principles can be observed. These are discussed below, with examples.
Climate policy priorities should be a starting point. The available documentation suggests that opportunities for investments in green sectors should be identified by starting from sectors or technologies prioritised in climate and development strategies and then assessing their investment potential. The idea is that opportunities emerge where policy objectives have been translated into sectoral priorities and investment needs. For example, the UNDP guidebook on catalysing climate finance recommends identifying priority mitigation and adaptation technologies based on green and low-emission development objectives, as well as national socio-economic conditions. The toolkit on developing roadmaps by Sustainable Banking and Finance Network (SBFN) notes that sustainable finance roadmaps should help channel finance into priority sectors for which the financing need is the largest.
Demand for financing within the priority sectors needs to be assessed. The SBFN toolkit highlights the need to identify financing needs or market demand in priority sectors. This implies assessing the scale of investment needed to achieve climate objectives in certain sectors, as well as the extent to which current financing is (in)sufficient. For example, in the energy sector, national strategies may prioritise the expansion of green hydrogen capacities. While this creates a need for investment, access to long-term finance for this sector may be limited either due to projects being perceived as higher risk or due to regulatory framework not providing enough support. To define actions and measures needed to support its development, one of the first steps should be quantifying its finance needs.
Analysis of the existing financial flows and market patterns. The approach of the Climate Policy Initiative (CPI), an international research organisation specialising in climate finance, in Guidelines for Building a National Landscape of Climate Finance, suggests that comprehensive tracking where finance is currently flowing may reveal areas with potential for scaling up investment. Accordingly, sectors that have attracted low capital flows relative to their importance in national climate strategies can potentially indicate underinvestment and missed opportunities (CPI Guidelines; CPI Global).
Project pipelines. Several documents, for example, UNCTAD’s Investment Policy Framework for Sustainable Development, highlight that the visibility of project pipelines is important. While policy prioritisation and sector potential are important, without a sufficient pipeline of concrete projects those sectors may struggle to attract investment. As noted in section 5, in 2025, the Scottish Government established the InvestScotland portal to showcase key opportunities for investment. As the portal develops, a greater number of opportunities are expected to increase investment, provided wider awareness of those opportunities among stakeholders is ensured.
Identification of investment gaps
A common recommendation in the identified literature is to identify investment gaps by systematically comparing investment needs by sector in terms of policy targets and priorities with actual finance flows (Climate Policy Initiative, 2025; IMF & SBFN, 2023). Furthermore, some documents encourage analysis of gaps across different layers of the financial system. For example, the OECD report emphasises that assessment should cover “real-economy investments, financial assets, financial institutions, and financial jurisdictions”, meaning the gaps may arise at multiple levels, and investment volumes should not be the only indicator (OECD, 2024, p.18). For example, the report makes a distinction between financial flows, meaning new financing over a period, and stocks or existing financial assets, both of which need to be tracked.
Investment barriers
Policy and regulatory frameworks are responsible for creating enabling environments for investments in green sectors. For example, the EU Strategy for Financing the Transition to a Sustainable Economy highlights a need to have a framework for sustainable finance that is “clear, consistent and robust”. This is not further defined or explored in the document, however. The OECD report also notes that some existing policies still inadvertently create incentives for investments in high-emitting sectors (European Commission, 2021; OECD, 2024). The relevance and severity of the barriers vary across sectors and are influenced by their maturity, with emerging technologies usually facing higher risks, costs, and uncertainty than more mature sectors.
Overall, several barriers are recurring across the reviewed literature. The UNDP framework provides a comprehensive list of possible barriers to attracting finance in the green sectors. It categorises these into behavioural, e.g. knowledge gaps, reliability concerns, higher cost perception, institutional, e.g. weak policy implementation and enforcement, regulatory, e.g. legacy policies, administrative barriers, financial, e.g. higher upfront costs, transaction costs, and technical, e.g. lack of technical skills or certification facilities (UNDP, 2011).
Other documents, including “A Guide to Adaptation Climate Finance” by the Scottish Government, Adaptation Scotland, and SNIFFER (Scotland and Northern Forum for Environmental Research), emphasise market and project-level barriers, such as financial viability, information gaps, and the fact that some investments generate benefits that are not captured by investors, such as improved health, environment, well-being (Adaptation Scotland, 2022). This is particularly relevant for adaptation measures, as they often provide wider societal benefits but struggle to have clear private revenue streams (Adaptation Scotland, 2022).
In addition, the lack of assessment of the scale and distribution of financing needs and related emission reductions across sectors may act as a barrier, limiting effective policy development. In particular, this applies to less well-established areas compared to sectors such as renewable energy. Here, a distinction should be made between the actual needs where businesses have determined them but are struggling to attract finance, and needs based on the gap to policy targets (e.g. in terms of emission reductions, installed RES capacity). It is important to estimate both.
Data requirements and data gaps
In all identified documents, data availability, completeness and consistency appear to be a potential constraint in identifying opportunities, gaps and barriers (Clark, 2018; Climate Policy Initiative, 2021, 2025; OECD, 2024). Common challenges include fragmented and insufficient data availability, particularly for private sector actors.
Some documents also identify challenges of limiteddata as well as inconsistent methodologies for tracking climate finance. Data on financial flows in different sectors may be incomplete, while definitions of climate finance vary. This may lead to differences in assessments of the gap or their underestimation (CPI Global). These issues lower the reliability of analysis and highlight a need for credible, transparent, and comparable metrics and data on climate finance flows (Adaptation Scotland, 2022; Climate Policy Initiative, 2025; OECD, 2024). This implies that data availability and quality can directly affect the ability to identify opportunities, gaps and barriers.
To improve the identification of opportunities, gaps, and barriers, more granular, consistent data would be required across several areas. This includes:
Data on bank lending to UK businesses, disaggregated by sector and geography (including Scotland).
Information on private investment flows into green sectors in Scotland, including equity, debt, bonds, and project finance.
Estimates of financing needs across sectors and technologies, including actual needs of businesses and financing needs based on policy priorities and targets.
Data on project pipelines, including early-stage and pre-financial close projects, to improve visibility of future investment opportunities.
Data on risk and return profiles of green investments, including cost of capital and revenue stability across sectors.
Information on the use of proceeds for general corporate lending and bond issuance, to better identify alignment with green activities.
Data on SME financing, in particular on access to finance for smaller firms in green sectors.
Addressing these data gaps would likely require regulatory measures. Those may include standardised reporting requirements for financial institutions, improved disclosure of lending and investment activity, and the development of centralised datasets or platforms to aggregate and share information. Such measures should draw on experience from other policy areas, such as the Streamlined Energy and Carbon Reporting regulation, emissions trading, and social value reporting.
Relevance for Scotland
Several of the identified sources are either global in scope or focus on emerging economies. However, many thematic measures they recommend are applicable for advanced economies such as Scotland. For instance, the analysis of opportunities and gaps based on policy priorities, comparing finance flows and needs, and identification of barriers using the key categories are all relevant (Adaptation Scotland, 2022; Climate Policy Initiative, 2025; OECD, 2024).
To define the next steps for addressing gaps and barriers, and for leveraging or creating opportunities for green investments, a deeper understanding of the Scottish sustainable finance landscape is needed. This report is intended as the first step in investigating the landscape of sustainable finance in Scotland and is necessarily limited. Further research alongside regular engagement of the investment and energy sectors are required.
While this study relied on data from closed databases, open sources and interviews, it is likely that details on many past investments are not publicly available. This may be particularly true for project equity investments financed from companies’ balance sheets. Expanding the evidence base, including via the stakeholder engagement noted above would improve the robustness and representativeness of the findings. This will also help to understand whether green financial services and instruments offered by financial service providers differ in Scotland compared to the rest of the UK and other countries. A larger database of deals would allow for the identification of investment trends based on more granular investor categories than in the current study. Those could be different types of banks, asset managers, asset owners, etc. This would support more targeted policy measures.
The current research has analysed gaps and barriers to investments in green sectors raised by stakeholders; however, this was not the primary focus of the study. At the same time, any future efforts to scale green investment will need to be grounded in a robust understanding of the barriers, gaps, and challenges investors face. Future research could analyse them comprehensively and estimate their impact.
More broadly, future research could aim at a strategic assessment of the factors influencing investors’ decision-making, including not only barriers but also drivers of investment. This may include further stakeholder consultation to explore factors related to why Scotland attracts or loses investment compared to the rest of the UK or other countries.
While the report provides an overview of past and announced investment activity, it does not assess how these flows compare to the level of investment required to meet Scotland’s net zero target. Future research could develop forward-looking scenarios that estimate the scale of investment needed across sectors and compare this with current and expected investment trajectories. This could draw on existing evidence, such as high-level estimates from the Climate Change Plan, and be extended to consider investment needs from a broader societal perspective, including sectors not covered in the current analysis. The current analysis could be used to identify potential investment gaps between observed activity and estimated need. This would help inform the design of policies to mobilise capital in green sectors. Scenario analysis could also be used to assess the potential impact of different policy measures on investment outcomes.
Furthermore, while this study focuses on past deals in green energy and infrastructure, it does not capture the demand side for green investment, e.g. in energy and energy efficiency. Future research could address this gap.
Key findings and lessons learned
This section summarises the main findings and lessons learned from the study. It highlights patterns in past investment activity, investors plans and priorities for the future, and the ecosystem of Scottish green financial service providers.
Some of the key findings on the completed deals in green energy and infrastructure are:
54 deals over £10 million in green infrastructure and renewable energy were identified in Scotland since 2020, either fully or partially located in Scotland, with a total value of around £9.5 billion (excluding M&A).
Total annual investment increased from £500 million in 2021 to £1.8 billion in 2023 and over £5 billion in 2025.
64% of deals were fully located in Scotland, with the remainder having been a part of wider activity.
For deals partly and fully located in Scotland, electricity transmission had the largest share of total investment (32%), followed by renewable energy (25%), and battery storage (21%). The largest investment sectors included renewable wind energy, electricity transmission and battery storage. Investment appears concentrated in a relatively narrow set of mature assets, with more limited activity in less mature sectors such as green hydrogen and nature-based solutions.
Investment activity involves a broad mix of investors, including energy companies, commercial banks, infrastructure funds, institutional investors and public financial institutions.
The figures above are based on publicly available data and LSEG databases and are likely to underestimate total investment flows.
A key trend in Scotland’s green finance landscape is the role of public financial institutions in crowding in private finance. Over recent years, a network of public investors has emerged, including the Scottish National Investment Bank, the British Business Bank, InnovateUK, the National Wealth Fund, and GB Energy. Public financial institutions appear to play complementary roles across different stages of the financing lifecycle. Through guarantees, patient or concessional capital, and early-stage funding, these institutions help de-risk projects and mobilise additional private finance in green sectors. For example, the Flow Country Green Finance Initiative is funded through public-private partnerships and attracts investments in carbon credit projects (see Case study 2). Another example could be joint investments by the private sector and GB Energy, NWF, and SNIB, e.g., in the Pentland Floating Offshore Wind Farm.
Analysis of future investment plans identified 29 existing and new investors who have announced plans to invest in green sectors in Scotland. Key sectors of interest are renewable energy, being the most common, energy storage, and grid infrastructure and transmission networks. Emerging interest in nature-based solutions was identified, in areas such as peatland restoration, forestry and rewilding. Several stakeholders also mentioned CCS and the circular economy as promising sectors.
Asset managers and corporates were the most common investor types with publicly documented investment plans. Planned investment sizes varied significantly, from £1-5 million to £1.5 billion and from smaller-scale investments in growing businesses to large, capital-intensive infrastructure projects that can require commitments of hundreds of millions or billions. Some stakeholders perceive Scotland as a relatively stable market, and some held mixed views on its attractiveness for future investment. Some considered Scotland is likely to make more progress in investment activity than the rest of the UK due to more ambitious climate targets. Evidence also suggests that, as public financial institutions mature and develop, clearer engagement with investors and definition of roles may increase their impact.
To understand green financial services provided in Scotland, 49 of the larger institutions present in Scotland were reviewed. Most have headquarters in Scotland, elsewhere in the UK and the United States, operate globally and allocate capital across multiple geographies. They tended not to distinguish between Scottish and other services in publicly available documents; hence the assessment reflects general offering of services and instruments as well as company-level targets and commitments. The key categories of services providers were asset managers investing in public markets, i.e. listed companies, asset managers investing in private markets, asset owners, such as insurance companies or pension funds, as well as banks. The extent to which they specialised in green sectors differed. The most common sector that institutions present in Scotland invest in or finance is renewable energy, followed by energy storage, green buildings, low-carbon or clean transport, and grids. Private market asset managers appear to provide the most comprehensive range of services, covering the full investment lifecycle, from allocating capital to managing assets in the long run. Some firms have also developed internal platforms and methodologies, such as climate scenario analysis tools, ESG data and analytics systems, and decarbonisation or net zero frameworks used to guide portfolio companies. However, it was not possible to establish whether they provide the whole spectrum of green services and instruments in Scotland.
Initial findings from this research suggest there are several barriers that constrain the scale and diversification of private investment in Scotland’s green sectors. Some of the barriers for scaling up investments in these sectors include scalability, demand and revenue certainty. Among the conditions influencing investment decisions, interviewees mentioned policy transparency and regulatory stability, revenue certainty, and visible project pipeline. Sustained growth in capital deployment depends on a pipeline of investable projects, which some consultees considered to be lacking. Revenue uncertainty is a further constraint. Whilst renewable energy benefits from clear and predictable future revenues, other such as nature-based solutions or climate adaptation can face greater uncertainty around returns limiting their attractiveness. The research also identified that infrastructure constraints may also be limiting investment, with challenges in connecting new projects to the grid acting as a bottleneck, even where demand is strong. Supply chain pressures, rising costs and skills shortages also affect the ability to deliver projects at scale. At the same time, capital-intensive and projects in less developed sectors have higher risks, which may be mitigated with blended finance, guarantees or supportive regulatory frameworks.
While Scotland has established strengths in sustainable finance, it operates in a competitive international market for green capital. Ensuring policy stability, revenue certainty, and a predictable investment environment for priority sectors will be important for influencing investment decisions.
To better understand the gaps, barriers and challenges of green investment in Scotland more thorough analysis is necessary. A targeted review of international best-practice approaches and guidance on approaches to determining the opportunities, gaps, and challenges for green investment was undertaken through a review of guidance documents and reports of international institutions. A common recommendation in the identified literature is to identify investment gaps by systematically comparing investment needs by sector in terms of policy targets and priorities with actual finance flows. Possible barriers were categorised into behavioural, e.g. knowledge gaps, reliability concerns, higher cost perception, institutional, e.g. weak policy implementation and enforcement, regulatory, e.g. legacy policies, administrative barriers, financial, e.g. higher upfront costs, transaction costs, and technical, e.g. lack of technical skills or certification facilities.
While some of the identified sources are either global in scope or focus on emerging economies, many thematic measures they recommend are applicable for advanced economies such as Scotland.
Lessons learned
The findings suggest cross-cutting lessons on how private investment in Scotland’s green sectors is currently mobilised and requirements to scale it further.
Private investment in green sectors is most readily mobilised in areas with established technologies, clear delivery models and predictable revenue streams. Sectors such as renewable energy and core infrastructure continue to attract the majority of capital.
Effectively target the use of blended finance and risk-sharing mechanisms where private finance still needs to be unlocked, including in sectors such as industrial decarbonisation, heat, transport and nature-based solutions, and to support early-stage and innovative projects.
The public sector plays a key role in enabling private investment. Investors prioritise opportunities with stable and predictable returns, while higher-risk or less mature sectors require additional support. Risk mitigation mechanisms, including blended finance and guarantees, can help improve the attractiveness of such investments. Another core role of the public sector is creating regulatory environment that enables investments in green sectors.
A visible pipeline of investable projects is essential for further scaling private investment. Fragmentation or lack of project readiness can limit capital deployment, even where investor interest exists. Strengthening project development and improving the clarity of investment propositions can therefore play a key role in unlocking investment. Since the Scottish Governments launched such a portal for investors in 2025, it will need to make sure ongoing engagement dialogue supports its use and awareness continues to increase.
Infrastructure and delivery constraints significantly slow investment activity. Limitations in grid capacity, planning processes, supply chains and skills availability affect the ability to bring projects to market and deliver them at scale. Addressing these constraints is critical to sustaining investment momentum.
Mechanisms should be explored to attract and mobilise more risk capital into emerging green sectors, including venture capital and growth equity, to support innovation and the scaling of new technologies.
References
Adaptation Scotland. (2022). A Guide to Adaptation Climate Finance. https://adaptation.scot/app/uploads/2024/09/a-guide-to-adaptation-climate-finance.pdf
Bank of England. (2024). Firm climate investment: A glass half‑full (Bank of England Staff Working Paper No. 1,095).
British Business Bank. (n.d.). Investment Fund for Scotland. Retrieved April 8, 2026, from https://www.british-business-bank.co.uk/finance-options/nations-and-regions-investment-funds/investment-fund-for-scotland
Carlyle. (2022). Carlyle and GIC invest in green ammonia development company Eneus Energy to accelerate gigawatt-scale energy security and decarbonization solutions. https://www.carlyle.com/media-room/news-release-archive/carlyle-and-gic-invest-in-green-ammonia-development-company-eneus-energy
CBI Economics, E. (2026). The Scottish Net Zero Economy in 2025. https://ca1-eci.edcdn.com/The_Scottish_Net_Zero_Economy_in_2025.pdf?v=1779453982
Clark, R. R. J. S. T. (2018). Bridging funding gaps for climate and sustainable development: Pitfalls, progress and potential of private finance. https://www.sciencedirect.com/science/article/pii/S0264837717310049#sec0020
Climate Change Committee. (2025). End the fossil fuel age for a secure and prosperous future. – Climate Change Committee. https://www.theccc.org.uk/2025/02/26/end-the-fossil-fuel-age-for-a-secure-and-prosperous-future
Climate Policy Initiative. (2021). Guidelines for Building a National Landscape of Climate Finance. https://www.climatepolicyinitiative.org/wp-content/uploads/2021/01/Guidelines-for-Building-a-National-Landscape-of-Climate-Finance-4.pdf
Climate Policy Initiative. (2025). Global Landscape of Climate Finance 2025. https://www.climatepolicyinitiative.org/wp-content/uploads/2000/06/compressed_Global-Landscape-of-Climate-Finance-2025.pdf
Copenhagen Infrastructure Partners. (n.d.). Alcemi – On battery power. Retrieved April 8, 2026, from https://www.cip.com/projects/our-projects/alcemi/
D. Williams, J. Tsoukalas, B. Wessels, & P. Gaska. (2025). Scotland’s Productivity Challenge: Exploring the issues – 2025. https://www.productivity.ac.uk/wp-content/uploads/2025/01/PIP045-Scotland-Insights-Paper-January-2025.pdf
Deloitte. (2026). Financing the UK energy transition. https://www.deloitte.com/content/dam/assets-zone2/uk/en/docs/industries/energy-resources-industrials/2026/deloitte-uk-energy-transition-investment-survey-2026.pdf
Department for Energy Security and Net Zero, & Michael Shanks MP. (2025). New plan to kickstart onshore wind revolution. https://www.gov.uk/government/news/new-plan-to-kickstart-onshore-wind-revolution
DESNZ, G. E. (2026). Local Power Plan. https://assets.publishing.service.gov.uk/media/698b50136c8ef8db1fcfd88e/gbe-local-power-plan-2026.pdf
Equitix. (2023). Equitix join forces into Moray East. https://equitix.com/news/ocean-winds-and-equitix-join-forces-into-moray-east-scotlands-biggest-operational-offshore-wind-farm/#
ESG News. (2025). Scotland Backed Renewco Secures $38M to Advance 7 GW Onshore Wind and Solar Pipeline. https://esgnews.com/scotland-backed-renewco-secures-38m-to-advance-7-gw-onshore-wind-and-solar-pipeline/
European Central Bank. (2025). Green investment needs in the EU and their funding. https://www.ecb.europa.eu/press/economic-bulletin/articles/2025/html/ecb.ebart202501_03~90ade39a4a.en.html
European Commission. (2026). EU taxonomy for sustainable activities. https://finance.ec.europa.eu/sustainable-finance/tools-and-standards/eu-taxonomy-sustainable-activities_en#:~:text=on%20sustainable%20finance.-,Relevant%20legislation,through%20delegated%20and%20implementing%20acts%20.
European Union. (2021). Strategy for financing the transition to a sustainable economy. https://eur-lex.europa.eu/legal-content/EN/TXT/?uri=CELEX:52021DC0390
EY. (2025). EY UK Attractiveness Survey Scotland. https://www.ey.com/content/dam/ey-unified-site/ey-com/en-uk/newsroom/2025/06/ey-uk-attractiveness-survey-scotland-06-2025.pdf
G. Williams. (2025). KPMG: Private equity investment in Scotland jumps by over 35%. https://www.scottishfinancialnews.com/articles/kpmg-private-equity-investment-in-scotland-jumps-by-over-35
Garcia, L. (2024). Quinbrook Banks $3 Billion for Renewable-Power Deals . Wall Street Journal. https://www.wsj.com/articles/quinbrook-banks-3-billion-for-renewable-power-deals-67ee8d38
GEFI. (2024a). Scottish Taskforce for Green and Sustainable Financial Services. Final Report. https://www.globalethicalfinance.org/wp-content/uploads/2024/09/GEFI705_Scottish-Taskforce-Report_SCREEN.pdf
GEFI. (2024b). Scottish Taskforce for Green and Sustainable Financial Services. https://www.globalethicalfinance.org/taskforce/
Global Ethical Finance. (2024). Scottish Taskforce for Green and Sustainable Financial Services . https://www.sfe.org.uk/news-database/new-sector-growth-strategy-sets-out-plan-to-boost-the-contribution-of-financial-services-to-
Great British Energy. (2025). Strategic Plan. https://www.gbe.gov.uk/sites/default/files/2025-12/GBE%20Strategic%20Plan%20Dec2025.pdf
Green Finance Institute. (2025). New initiative launched to accelerate financing of net zero projects in Scotland in partnership with Green Finance Institute. https://www.greenfinanceinstitute.com/news/new-initiative-launched-to-accelerate-financing-of-net-zero-projects-in-scotland-in-partnership-with-green-finance-institute/
Green Finance Institute. (2026). Facility for Investment Ready Nature in Scotland (FIRNS). https://www.greenfinanceinstitute.com/hive/firns/
Green Heat Finance Task Force. (2023). Green Heat Finance Taskforce Report: Part 1. https://www.gov.scot/binaries/content/documents/govscot/publications/independent-report/2023/11/green-heat-finance-taskforce-report-part-1-november-2023/documents/green-heat-finance-taskforce-part-1-report/green-heat-finance-taskforce-part-1-report/govscot%3Adocument/green-heat-finance-taskforce-part-1-report.pdf
HM Government. (2025). An introduction to the UK public investment landscape. https://www.gov.uk/government/publications/an-introduction-to-the-uk-public-investment-landscape
IEA. (n.d.). Wind. Retrieved April 9, 2026, from https://www.iea.org/energy-system/renewables/wind
IMF. (2024). Issues Note: Sustainable Finance Definitions in the 2025 SNA and BPM7. https://www.imf.org/external/pubs/ft/bop/2024/pdf/43/24-03.pdf
Impact Investing Institute. (n.d.). Accelerating Scotland’s impact investing ecosystem. Retrieved April 8, 2026, from https://www.impactinvest.org.uk/our-work/projects/accelerating-scotlands-impact-investing-ecosystem/
Innovate UK. (n.d.). The Scotland Innovation Landscape. Retrieved April 8, 2026, from https://iuk-business-connect.org.uk/place/scotland/
Innovate UK. (2025). Innovation Collaboration Framework for Scotland. https://iuk-business-connect.org.uk/wp-content/uploads/2025/10/Innovate-UK_Scotland-Action-Plan_Final.pdf
Investopedia. (2025a). Bonds: How They Work and How to Invest. https://www.investopedia.com/terms/b/bond.asp
Investopedia. (2025b). Equity: Meaning, How It Works, and How to Calculate It. https://www.investopedia.com/terms/e/equity.asp
Investopedia. (2026). Understanding Loans: Types, How They Work, and Tips for Approval. https://www.investopedia.com/terms/l/loan.asp
Investor Panel. (2023). Mobilising international capital to help finance the transition to Net Zero. https://www.gov.scot/publications/investor-panel-mobilising-international-capital-finance-transition-net-zero/
Just Transition Commission. (2025). Flow Country Green Finance Initiative. https://www.justtransition.scot/case-study/flow-country-green-finance-initiative/
Landscape Finance Lab. (2026). Flow Country Green Finance Initiative | Featured Landscapes. https://landscapefinancelab.org/featured-landscapes/flow-country-green-finance-initiative
Latief, Y. (2025). SSE unveils £33bn investment plan with majority into the power grid. https://www.enlit.world/library/sse-prioritises-grid-upgrades-in-33-billion-gbp-investment-plan
Macquarie Group. (2024). Macquarie Asset Management agrees to acquire additional stake in Lynn and inner Dowsing offshore wind farms. https://www.macquarie.com/au/en/about/news/2024/macquarie-asset-management-agrees-to-acquire-additional-stake-in-lynn-and-inner-dowsing-offshore-wind-farms.html
National Energy System Operator. (n.d.). Stability Network Services. Retrieved April 9, 2026, from https://www.neso.energy/industry-information/balancing-services/network-services/stability-network-services#What-we%E2%80%99re-trying-to-achieve
National Wealth Fund. (n.d.). Quanterness Windfarm, Orkney Islands Council: Factsheet . Retrieved April 9, 2026, from https://www.nationalwealthfund.org.uk/media/k4pl2lxc/factsheet-orkney-islands-council.pdf
National Wealth Fund. (2026). Unlocking the UK’s Future our Five-Year Strategic Plan to 30/31. https://www.nationalwealthfund.org.uk/media/ca1pvtjp/national-wealth-fund-five-year-strategic-plan.pdf
Nature Finance Pioneers. (n.d.). Landscape Finance Lab. Retrieved April 9, 2026, from https://finance.naturalcapitalscotland.com/member/landscape-finance-lab/
NatureScot. (n.d.-a). Facility for Investment Ready Nature in Scotland (FIRNS) – Aims and Outcomes. Retrieved April 9, 2026, from https://www.nature.scot/funding-and-projects/firns/facility-investment-ready-nature-scotland-firns-aims-and-outcomes
NatureScot. (n.d.-b). FIRNS – The Facility for Investment Ready Nature in Scotland. Retrieved April 8, 2026, from https://www.nature.scot/funding-and-projects/firns-facility-investment-ready-nature-scotland
NatureScot. (n.d.-c). Peatland ACTION and Peatland Code – Frequently Asked Questions (FAQs). Retrieved April 9, 2026, from https://www.nature.scot/climate-change/nature-based-solutions/nature-based-solutions-practice/peatland-action/peatland-action-resources/peatland-action-and-peatland-code#:~:text=The%20Peatland%20Code%20is%20managed%20by%20the,IUCN%20UK%20PP%20to%20streamline%20the%20processes.
NatureScot. (n.d.-d). Peatland ACTION case study: What’s the connection between peatland restoration and future-proofing your farm business? Retrieved April 9, 2026, from https://www.nature.scot/doc/peatland-action-case-study-whats-connection-between-peatland-restoration-and-future-proofing-your
NatureScot. (2023). £2 billion private finance pilot potential ‘vital step in restoring Scotland’s woodlands.’ https://www.nature.scot/ps2-billion-private-finance-pilot-potential-vital-step-restoring-scotlands-woodlands
NatureScot. (2025). Scotland’s Flow Country to receive world premiere performance. https://www.nature.scot/scotlands-flow-country-receive-world-premiere-performance
NatureScot. (2026). Facility for Investment Ready Nature in Scotland (FIRNS) – Aims and Outcomes. https://www.nature.scot/funding-and-projects/firns/facility-investment-ready-nature-scotland-firns-aims-and-outcomes
NatWest Group. (2023). A clean transport revolution. https://www.natwestgroup.com/news-and-insights/latest-stories/climate/2023/nov/a-clean-transport-revolution.html
Net Zero Scotland. (2026, March). Building Scotland’s net zero workforce. https://netzeronation.scot/blog/building-scotlands-net-zero-workforce
Newlands, E. (2021). Major Scots firms team up to form eco-focused initiative ahead of COP26. The Scotsman. https://www.scotsman.com/business/major-scots-firms-team-up-to-form-eco-focused-initiative-ahead-of-cop26-3416348
North Highland Initiative. (n.d.-a). Green Finance Initiative Funding Acknowledgement. Retrieved April 9, 2026, from https://www.northhighlandinitiative.co.uk/green-finance-initiative-funding-acknowledgement/
North Highland Initiative. (n.d.-b). Sustainability. Retrieved April 9, 2026, from https://www.northhighlandinitiative.co.uk/sustainability/
NWF. (2025). National Wealth Fund launches new Regional Project Accelerator for local government. https://www.nationalwealthfund.org.uk/news-and-publications/news/national-wealth-fund-launches-new-regional-project-accelerator-for-local-government/
OECD. (2024). Review on Aligning Finance with Climate Goals. https://www.oecd.org/content/dam/oecd/en/publications/reports/2024/10/oecd-review-on-aligning-finance-with-climate-goals_646508f2/b9b7ce49-en.pdf
Office for National Statistics. (2026). Low carbon and renewable energy economy, UK: 2024. https://www.ons.gov.uk/economy/environmentalaccounts/bulletins/finalestimates/2024
Orkney Community Wind Farms. (n.d.-a). Community Benefits. Retrieved April 9, 2026, from https://orkneywindfarms.co.uk/community-benefits
Orkney Community Wind Farms. (n.d.-b). FAQs – About the Project. Retrieved April 9, 2026, from https://orkneywindfarms.co.uk/faqs
Orkney Islands Council. (2025). Unanimous Decision to Back Quanterness Wind Farm Project. https://www.orkney.gov.uk/latest-news/unanimous-decision-to-back-quanterness-wind-farm-project/
Pensions Policy Institute. (2024). Pension scheme assets – a deep dive into infrastructure . www.pensionspolicyinstitute.org.uk
PwC UK. (2023). Green Jobs Barometer. https://www.pwc.co.uk/services/sustainability-climate-change/insights/green-jobs-barometer.html
R. Watts. (2024). The Scottish Government’s capital budget. https://spice-spotlight.scot/2024/05/29/the-scottish-governments-capital-budget/
Scotland Beyond Net Zero. (2026a). About Scotland BNZ. https://scotland-beyond-net-zero.ac.uk/about/
Scotland Beyond Net Zero. (2026b). Scotland BNZ Research. https://scotland-beyond-net-zero.ac.uk/research/
ScotlandIS. (2025). New Scottish climate tech accelerator launches. https://www.scotlandis.com/blog/new-scottish-climate-tech-accelerator-launches/
Scottish Business Climate Collaboration. (2026). What is SBCC? https://sbcc.group/what-is-sbcc/
Scottish Construction Now. (2025). National Wealth Fund backs Orkney community wind farm project. https://www.scottishconstructionnow.com/articles/national-wealth-fund-backs-orkney-community-wind-farm-project
Scottish Enterprise. (n.d.). Foresight Group – entrepreneur support. Retrieved April 8, 2026, from https://www.scottish-enterprise.com/how-we-can-help/business-strategy/support-for-entrepreneurs/ecosystem-organisations/financial-support-organisations/foresight-group
Scottish Financial Enterprise. (n.d.). More success for Edinburgh and Glasgow in Global Green Finance Index. Retrieved April 8, 2026, from https://www.sfe.org.uk/news-database/more-success-for-edinburgh-and-glasgow-in-global-green-finance-index
Scottish Financial Enterprise. (n.d.). Sector unveils asset management strategy to drive Scottish financial sector towards £1 trillion goal. Retrieved June 1, 2026, from https://www.sfe.org.uk/news-database/sector-unveils-asset-management-strategy-to-drive-scottish-financial-sector-towards-1-trillion-goal
Scottish Financial News. (2025). Edinburgh climbs global green finance rankings. https://www.scottishfinancialnews.com/articles/edinburgh-climbs-global-green-finance-rankings
Scottish Government. (2020). Green Investment Portfolio launched. https://www.gov.scot/news/green-investment-portfolio-launched/
Scottish Government. (n.d.). Green Freeports – Cities and regions. Retrieved April 8, 2026, from https://www.gov.scot/policies/cities-regions/green-ports/
Scottish Government. (2022). Scottish Budget: 2023 to 2024. https://www.gov.scot/publications/scottish-budget-2023-24/pages/21/
Scottish Government. (2023). Draft Energy Strategy and Just Transition Plan delivering a fair and secure zero carbon energy system for Scotland. https://www.gov.scot/binaries/content/documents/govscot/publications/strategy-plan/2023/01/draft-energy-strategy-transition-plan/documents/draft-energy-strategy-transition-plan/draft-energy-strategy-transition-plan/govscot%3Adocument/draft-energy-strategy-transition-plan.pdf
Scottish Government. (2024). Green Industrial Strategy.
Scottish Government. (2025a). Scotland’s costs towards net zero target: EIR release. https://www.gov.scot/publications/foi-202500457189/
Skills Development Scotland. (2023). CESAP Pathfinder. https://www.skillsdevelopmentscotland.co.uk/media/5hcorb5t/cesap-pathfinder-wp1-report.pdf?_gl=1*13lhuc3*_up*MQ..*_ga*MTkyNjAxODc4Ny4xNzcyMDE2MDQw*_ga_2CRJE0HKFQ*czE3NzIwMTYwMzckbzEkZzEkdDE3NzIwMTYyNTMkajYwJGwwJGgw
SNIB. (2026). £1bn milestone surpassed with Aurora investment. https://www.thebank.scot/ps1bn-milestone-surpassed-with-aurora-investment
Solar Power Portal. (2025). Zenobē 200MW BESS operational, first to provide stability services for NESO. https://www.solarpowerportal.co.uk/battery-storage/zenob-200mw-bess-operational-first-to-provide-stability-services-for-neso
Strategy for Financing the Transition to a Sustainable Economy (2021). https://eur-lex.europa.eu/legal-content/EN/TXT/?uri=CELEX:52021DC0390
Sustainable Ventures. (2021). New Climate Tech Accelerator in Scotland Launches with Barclays & Sustainable Ventures. https://www.sustainableventures.co.uk/sustainable-stories/glasgow-programme-launch
The Investment Association. (2024). Investment Management in the UK 2023-2024. The Investment Association Annual Survey. https://www.theia.org/sites/default/files/2024-10/Investment%20Management%20in%20the%20UK%202023-2024.pdf
The Flow Country. (n.d.). The Flow Country. Retrieved April 9, 2026, from https://theflowcountry.org.uk/the-flow-country-2/
The Flow Country Green Finance Initiative. (2025). Facility for Investment Ready Nature in Scotland – End of Project Report. https://theflowcountry.org.uk/wp-content/uploads/2025/11/FCGFI-FIRNS-End-of-Project-Report.pdf#:~:text=Funding%20was%20successfully%20secured%2C%20with%2089%25%20of,private%20investment%20to%20allow%20full%20loan%20repayment.
The Register. (2025). Scotland now home to Europe’s biggest battery as windy storage site fires up. https://www.theregister.com/2025/03/05/blackhillock_europes_largest_battery_scotland/
The Scottish National Investment Bank. (2025). Impact Report. https://www.thebank.scot/sites/default/files/2025-05/SNIB099%20Impact%20Report%202025_v8.pdf
UK Government. (2025a). Great British Energy backs Scotland, Wales and Northern Ireland. https://www.gov.uk/government/news/great-british-energy-backs-scotland-wales-and-northern-ireland
UK Government. (2025b). Great British Energy to cut bills for hospitals and schools. https://www.gov.uk/government/news/great-british-energy-to-cut-bills-for-hospitals-and-schools
UK Government. (2026). Energy Trends: UK renewables. https://www.gov.uk/government/statistics/energy-trends-section-6-renewables
University of Leeds. (n.d.). Environmental and Socio-economic Benefits of Peatland Restoration. Retrieved April 9, 2026, from https://water.leeds.ac.uk/our-missions/mission-3/parliamentary-question-on-peat/#:~:text=Restored%20peatland%20can%20increase%20biodiversity&text=Recent%20drain%2Dblocking%20initiatives%20to,climate%20change%2C%20drought%20and%20wildfire.
Wärtsilä Corporation. (2025). Now operational: Wärtsilä delivers first-of-its-kind energy storage system for Zenobē in Scotland. https://www.wartsila.com/media/news/03-03-2025-now-operational-wartsila-delivers-first-of-its-kind-energy-storage-system-for-zenob%C4%93-in-scotland-3558119
World Trade Organization. (n.d.). Annex on financial services. Retrieved April 9, 2026, from https://www.wto.org/english/tratop_e/serv_e/10-anfin_e.htm
Zenobē. (n.d.-a). Blackhillock: Europe’s largest grid-scale battery. Retrieved April 9, 2026, from https://www.zenobe.com/case-studies/blackhillock-battery-scotland/
Zenobē. (n.d.-b). Building Blackhillock: Stacking services to power bigger, better battery systems. Retrieved April 9, 2026, from https://www.zenobe.com/insights-and-guides/building-blackhillock-stacking-services-to-power-bigger-better-battery-systems/
Zenobē. (n.d.-c). Zenobē begins construction on pioneering battery storage projects totalling £750 million in Scotland. Retrieved April 9, 2026, from https://www.zenobe.com/news-and-events/zenobe-begins-construction-on-pioneering-battery-storage-projects-totalling-750-million-in-scotland/
Zenobē. (2023a). Zenobē breaks ground on pioneering 300MW battery project in Blackhillock. https://www.zenobe.com/news-and-events/zenobe-breaks-ground-on-pioneering-300mw-battery-in-blackhillock/
Zenobē. (2023b). Zenobē secures £235 million of non-recourse project finance debt from a club of five banks to support the build-out of grid-scale energy storage in Scotland. https://www.zenobe.com/news-and-events/zenobe-235-million-project-finance-five-banks-energy-storage/
Zenobē. (2025). Zenobē powers up a world first solution and Europe’s biggest battery at Blackhillock, Scotland. https://www.zenobe.com/news-and-events/blackhillock-battery-storage-launch/
Zenobē. (2026). Zenobē powers up 300MW/600MWh Kilmarnock South battery storage project. https://www.zenobe.com/news-and-events/zenobe-powers-up-kilmarnock-south-battery-storage-project/
Appendices
Appendix A: Methodology
Data sources
The study used a mixed-methods approach that combines desk-based evidence with stakeholder interviews. The data sources were:
LSEG Data & Analytics, provided by London Stock Exchange Group (LSEG) and S&P Global, provided by Standard & Poor’s (S&P) Global Inc, databases for data on past deals, list of investors who expressed interest in investing in Scotland, and financial service providers present in Scotland. These sources were chosen for their comprehensive coverage of sustainable finance and specialisation in green finance. They are trusted by investors, analysts and regulators for providing accurate and reliable data on renewable energy and sustainable investments, making them the ideal platforms for this report’s analysis.
Desk-based research for additional data on completed deals in green infrastructure and RES sectors. We also researched which companies have stated plans or made public announcements on investing in Scottish green sectors. Via desktop search, we also gathered data on financial service providers in terms of green financial instruments and services they offer, their green targets, commitments etc.
Interviews with eight stakeholders, including banks (N=3), asset managers (N=4), and a trade association of pension schemes (N=1). The initial list of stakeholders to who we reached out was compiled based on the large financial institutions present in the UK and Scotland. We developed and used an interview guide that was tailored depending on the stakeholder. These interviews aimed at collecting data on the past activity and future plans of these institutions.
Three case studies are included in Appendix D to illustrate how different types of sustainable finance are being deployed in practice. These case studies were selected to reflect a range of financing models and sectors, including mature renewable energy projects, blended finance structures and large-scale strategic infrastructure. Taken together, they highlight key enablers of investment in Scotland, such as the importance of stable policy frameworks and revenue certainty, the role of public finance in de-risking and mobilising private capital in less mature sectors, and the use of private debt financing within broader government-supported programmes.
Method for each research question
This section provides further detail on our approach to each research question (RQ). In addition to the methods described below, a total of eight interviews were conducted, with one institution providing answers in writing. The topics spanned RQ 1-3. The names of institutions interviewed are not provided for reasons of confidentiality. In total, the project team reached out to 28 financial institutions, however, the response rate was low presumably due to the end of financial year (March 2026). Several organisations declined the invitation as they were present in the UK but not active in Scotland.
RQ1: Which private and public institutions have completed deals for investments over £10 million in Scottish green infrastructure and renewable energy projects since 2020?
The data collection process was conducted using the LSEG Workspace Deals Screener consisting of the LSEG Project Finance Database and the LSEG Deals Databases (equities, loans and bonds). The initial screening was performed using the Sustainable Finance Flag (Y/N) filter, where only transactions marked as “True” were included to ensure that the deals were classified as sustainable finance transactions.
Following this screening process, the search was repeated separately for green bonds, green loans/debt, and sustainable equity transactions in the database. Further detail was obtained from the Project Finance database, another database provided in LSEG, which provides more granular information on infrastructure and energy deals. Where possible, transactions were matched using the deal number to merge information between the Project Finance database and the equities, bonds, and loans databases within LSEG.
In cases where a specific deal reference or location was not explicitly identified within the database, the screening process focused on transactions where the investing or issuing company was headquartered in Scotland. Further desk-based research was then conducted to identify additional information on the underlying projects, including project announcements, company disclosures, and industry reports, in order to confirm whether the investment was linked to renewable energy or green infrastructure projects located in Scotland.
Investments were split into those which are “fully” and “partially” located in Scotland. For example, an investment was considered to be partially located in Scotland in cases of electricity grids connecting Scotland and the rest of the UK. Additionally, in some cases, the total amount for several projects was indicated, of which only some were in Scotland. It was not possible to disaggregate the amount of investment for projects in Scotland in those cases, hence we make use of the total amount for the project.
Additional desk-based research was conducted using publicly available sources including the Financial Times, company press releases, investor announcements, and industry publications, relating to those which were not identified from the LSEG databases. These sources were used to confirm project locations, financing structures, and the classification of transactions as green or sustainable finance instruments. Desk-based research also enabled the identification of transactions associated with specific renewable energy and infrastructure projects such as wind farms, battery energy storage systems, transmission infrastructure, and electric vehicle charging networks that were partly or fully located in Scotland but were not explicitly captured through the database screening (i.e. the “Workspace Deals Screener”) function in LSEG.
For each identified deal, a range of variables was extracted from the LSEG databases to construct the analytical dataset. These variables include unique identifiers and deal-level information, such as the SDC Deal Number. Firm-level characteristics were collected, including company name, company headquarters and company location. Financial characteristics of the transaction include instrument type, instrument amount in GBP, total deal amount in GBP, year of issuance, etc. Sectoral classifications were captured using the TRBC sector classification. Project-level variables were also recorded, including project description, use of proceeds and project location. These fields were limited to that investment in the LSEG Project Finance Database. Finally, supplementary qualitative information such as project website links from investing companies, relevant news sources, and additional external references were recorded to support verification.
In addition to financing transactions, mergers and acquisition (M&A) activity related to renewable energy and green infrastructure in Scotland was also analysed using the LSEG “Workspace Deals Screener” which is a function in the database. The screening process focused on transactions where the asset class was classified as M&A, and when Sustainable Finance Flag is selected. For M&A activities, this flag indicates whether a transaction involves a party that is classified as sustainable according to the TRBC industry codes. Specifically, the flag is set to “True” if either the buyer side or seller side is linked to a sustainable industry: the Buyside Sustainable flag is true when the acquirer, or any parent entity is in a sustainable industry, while the Sellside Sustainable flag is true when the target, or any parent entity of the target or seller, is in a sustainable industry. We filtered the deals where a target company has a sustainable flag and is located in Scotland, as only investments in Scotland were of interest.
Since the database does not provide a direct filter for Scotland, transactions were further refined through manual verification of target company location information, including postcode or operational location data corresponding to Scotland for the target company.
RQ2: Which financial institutions are looking to meaningfully, structurally invest in Scottish projects in the short- and medium-term future?
In response to RQ2, we provide an overview of publicly available information on investors plans for investing in Scotland’s green sectors. We focus on information from 2020 onwards. We examine the types of institutions expressing interest in deploying capital in Scotland in the short, defined as < 5 years, to medium term, defined as between 5-10 years. These are illustrative but align with benchmarks. We analyse stated investment priorities including the focus sector(s), the target asset classes, ticket sizes, as well as strategic positioning of such investments within broader portfolios. We also briefly review constraints that may limit investment flows, although this is not the focus of the current study.
We focussed on the companies already identified in Section 4with completed deals in Scotland since 2020 and reviewed public announcements on their future plans. Further research was also undertaken on the major financial services firms currently operating in Scotland. These firms were identified through the Net Zero Finance Tracker, S&P and LSEG databases. A review of relevant news portals was also conducted, to identify published investor plans in Scotland, such as Renewable Energy Magazine, BusinessLive, Sustainability Magazine, Business Green, ESG News, Scottish Construction Now, and the Solar Power Portal. The analysis in this section is a thematic summary of the evidence from various sources.
The research is limited by the extent of publicly available information. Investors tended to announce plans for the UK as a whole rather than Scotland specifically and often do not disclose the amount they plan to invest. As a result, data in this section should not be treated as exhaustive. A lack of data on certain sectors does not imply a lack of investor interest. Evidence from stakeholders was used to complement desk-based research.
RQ3: Which funding institutions and initiatives operating in Scotland provide green financial services?
Three types of data sources were used. The first data source was the LSEG financial database, which provided a list of financial firms which have their headquarters in Scotland. The list had over 1,700 legal entities/companies, and we narrowed it down by choosing the largest legal entities, with assets over £1 billion.
Since the list sourced from LSEG did not cover companies present in Scotland but headquartered outside of it, additional desk-based research was conducted.
The second data source was the Net Zero Finance Tracker compiled by Climate Policy Initiative. Over 150 largest financial service providers were identified based on their size, i.e. total assets or assets under management. Second, we checked which of them have activity in Scotland. Additional green financial service providers from the completed deals and interviews lists were also included in the list of companies.
The list of companies was then finalised through a further round of screening, which applied a more thorough and consistent assessment of relevance and geographic presence. This screening ensured that the first group of companies headquartered in Scotland are filtered to those who provide either green financial services or instruments.
The list of green financial service providers identified 42 in total.
Further a data gathering was conducted through desk-based research. This looked at location of the company, type, sector and regional focus of the company, green services and financial instruments they provide, green targets, green commitments, and relevant governance. We reviewed each institution’s sustainable and responsible investing pages, climate commitments and policies-related documents, and corporate website disclosures, as relevant. In addition, disclosures were drawn from their Task Force on Climate-related Financial Disclosures (TCFD) reports, stewardship reports, annual reports, sustainability reports, and emissions reports where these were available.
RQ4: What methodologies should be used to identify the opportunities that could be leveraged, the gaps, and challenges for future investment?
Through desk-based research, various documents were identified that are relevant for helping policy makers to identify opportunities, barriers and gaps to attracting green investments. In total, nine documents were identified:
Investment Policy Framework for Sustainable Development, UNCTAD, 2015.
Developing Sustainable Finance Roadmaps, SBFN and IFC, 2023 (toolkit).
Guidelines for Building a National Landscape of Climate Finance, CPI, 2021 (guidance).
OECD Review on Aligning Finance with Climate Goals, OECD, 2024 (report).
Global Landscape of Climate Finance 2025, CPI, 2025 (report).
A Guide to Adaptation Climate Finance, Scottish Government, Adaptation Scotland, Sniffer, 2022 (guide).
Bridging funding gaps for climate and sustainable development: Pitfalls, progress and potential of private finance, R. Clark et al, 2018 (academic paper).
Strategy for Financing the Transition to a Sustainable Economy, European Commission, 2021 (regulation).
While the focus was on guidelines, frameworks and toolkits, the European Commission Strategy for financing the transition to a sustainable economy was included. The strategy was deemed to be relevant for the context of a developed country, since it may serve as a policy reference point from a mature financial system.
The identified documents fall into five categories: 1) high-level policy frameworks that establish principles; 2) practical toolkits that provide stepwise methods; 3) analytical reports that quantify investment flows and gaps; 4) an academic paper which contained a literature review and analysis of barriers and gaps; 5) a specific regulatory act.
Most of the identified documents provide high-level overview and principles or analyse financial flows, policy frameworks and barriers. They provide limited guidance on how to identify opportunities, gaps and barriers to attracting private investment in green sectors; however, steps and actions are inferred from these sources.
The documents were reviewed to identify recommendations on or implications for identifying opportunities, barriers and gaps to attracting finance in green sectors. We also analysed whether these findings are relevant for the Scottish context. A limiting factor was the fact that nearly all identified documents do not explicitly provide the granular, practical recommendations on approaches to identifying opportunities, gaps, and barriers that we were seeking. Rather they discuss the opportunities, barriers and gaps themselves. Additionally, many were designed for developing countries, although some of those recommendations would be relevant for advanced economies as well.
Additional charts
In the analysis, instrument types were aggregated for simplicity (see Figure 7) in Section 4. The table below summarises the types of different instruments used for green bonds, equities and loan/debt deals for projects partly located in Scotland and fully located in Scotland. Note that revolving credit facility, term loans and other loans were summed up into one category of loans.
Table 7. Instrument types used in investments fully and partly located in Scotland, 2020-2026
Project Location
Scotland
Partly in Scotland
GRAND TOTAL
Instrument Type
Bonds
Equity
Loans
Total
Bonds
Loans
Total
Blended public‑private Equity
2
2
2
Private Equity
1
1
1
Crowdfunding Retail Bond
1
1
1
Senior Medium-Term Notes
2
2
2
Euro Medium Term Note Program
4
4
1
1
5
Revolving Credit Facility
7
7
2
2
9
Bridge Loan
1
1
1
Term Loan
14
14
8
8
19
Other Loan
2
2
2
Total
5
3
21
29
3
13
16
45
Source: LSEG databases.
Limitations
Overall, data on completed deals (RQ1) and future plans (RQ2) were limited, even considering those cleaned via databases. We assume that a large share of this information is not available to access publicly. Hence, the analysis likely covers the minimum volume of deals and should be seen as a lower end of the potential range.
Both LSEG and the desk-based research tend to over-represent larger transactions with associated public information. Our sample might underreport early-stage and unlabelled green deals, such as project equity investment financed directly from corporate balance sheet. The databases used in the analysis cover bonds, loans, equity and M&As, but they do not include project equity investment, where projects were financed from balance sheet of a company. In addition, the scope of the research limited deals to those over £10 million. Some of these data have come from stakeholder interviews, but as the number of interviews was small, relevant evidence is not comprehensive.
In research on green financial service providers (RQ3), the central limitation was the lack of detailed data available in public access. Where companies do not disclose their green targets, internal structures and governance arrangements, or they are not up to date, incomplete or simply not public, that is reflected in the findings. Interviews provided some further data, but as noted above, the number was modest.
The central limitation of the method used to identify opportunities, barriers and gaps for attracting green investments was the lack of relevant sources. Documents generally did not provide such guidance, although in some cases it could be inferred from other recommendations therein.
Appendix B: Definitions used in the study
The definition of green finance adopted in this report uses the overarching definition of the Scottish Taskforce for Green and Sustainable Financial Services. This is: “Green finance refers to any financial initiative, strategy, product or service designed to protect the natural environment and support the transition to a sustainable, low-carbon world, and/or to manage climate-related and other environmental risks impacting finance and investment”.
To identify the list of completed green deals reported in LSEG Data & Analytics we used their operational definition. LSEG defines green investments/deals based on the Refinitiv Business Classification (TRBC) industry code of the acquirer, investor, target company, seller, or their immediate or ultimate parent, if it falls into one of the sustainable industry classifications defined in their Sustainable Finance Quarterly Review. These classifications include renewable energy and clean infrastructure sectors, such as renewable energy equipment and services, wind systems and equipment, solar power systems, hydropower equipment, renewable fuels, hydrogen fuel, carbon capture and storage, electric vehicles, power charging infrastructure, renewable utilities, and renewable independent power producers. LSEG applies an operational definition of sustainable investment based on the industry classification of the parties involved.
We include international and interregional mergers & acquisitions to capture green Foreign direct Investment (FDI) into Scotland.
Where there was a discrepancy or uncertainty regarding whether a LSEG sustainable-flagged investment activity falls under the above definition, we used the EU Sustainable Finance Taxonomy to resolve it (European Commission, 2026). This is a comprehensive classification system defining which economic activities qualify as “environmentally sustainable”. No similar document has been adopted by the Scottish government or at the UK level. For example, waste-to-energy deals were excluded from scope, as they are not considered to be environmentally sustainable under the EU Taxonomy. We also excluded deals if they were outside the scope of the project or RQ, such as waste-to-energy deals investments in electric vehicle manufacturing, supply of oil for wind turbines, electric coach services, and smart meters. Although they were classified as “green” in the LSEG, these deals do not fall in the scope of the study, as its focus is on renewable energy and green infrastructure. However, investments in support services for Renewable Energy Sources (RES) industries and technical services for the power sector were considered to be in the scope. Other sectors considered were green/low-carbon real estate and peatland restoration/carbon offsetting.
In the study, we also examine green instruments, services and finance initiatives. These are defined as green if they fall into the above green finance definition. Rather than an exhaustive academic definition, we provide working definitions to capture market realities as:
Green instrument is used to mean financial instruments including green bonds, loans, equity and investment fund shares. Source: IMF (IMF, 2024).
Green deals/investments is used to mean projects/investments classified (by LSEG/Refinitiv TRBC codes) as environmentally sustainable, involving companies or assets in sectors such as renewable energy, clean infrastructure, low-carbon technologies, and climate solutions, e.g., solar, wind, hydropower, hydrogen, carbon capture, electric vehicles and related support systems like charging and renewable utilities.
Green service is used to mean other financial services such as asset management, underwriting, advisory, intermediation and other auxiliary financial services, including investment and portfolio advice, advice on acquisitions etc., where they are provided to achieve environmental objectives alongside financial returns. The definition is based on the definition of the WTO, (see “Banking and other financial services”) (World Trade Organization, n.d.).
A green finance initiative is used to mean a targeted programme or mechanism that aims to support and enable the mobilisation of financial capital towards projects and activities that create environmental alongside financial returns. Their goal is to help tackle investment barriers, create suitable financial instruments, and create an enabling policy environment so that capital flows contribute to net zero and other environmental objectives. A bond is a fixed income investment issued by governments or corporations to raise funding (Investopedia, 2025a).
A loan or debt is a financial arrangement where an entity provides money to another with the expectation of repayment over time, often including interest as a cost of borrowing (Investopedia, 2026).
An exchange-traded fund (ETF) pools a group of securities into a fund and can be traded like an individual stock on an exchange. This allows investors to hold a diversified portfolio through the purchase of single investment.
Equity: in the stock market, shareholders’ equity or owners’ equity for privately held companies represents the difference between a company’s assets and liabilities (Investopedia, 2025b).
Venture capital is high-risk, private funding provided to early-stage companies in exchange for an ownership stake, usually delivered in stages as the business proves it can scale.
Growth equity is a type of investment opportunity in relatively mature companies that are going through some transformational event in their lifecycle with potential for significant growth.
Ticket size is the typical amount an allocator invests in a single fund, deal, or commitment.
By alternative asset managers we mean asset managers specialising in assets other than stocks, bonds and cash, e.g. infrastructure, real estate and private equity.
By capital allocation, we mean the process of directing capital from investors to assets, projects, or companies.
By portfolio/investment management we mean the management of investment portfolios on behalf of clients, including asset selection, allocation, and ongoing performance monitoring.
By asset ownership, active management we mean direct ownership of assets or companies, combined with active involvement in their management, strategy, and performance.
By lending we mean the provision of debt financing to companies, projects, or individuals, typically through loans or credit facilities.
By underwriting (bonds/equity) we mean the structuring, pricing, and issuance of securities (such as bonds or shares), including facilitating their sale to investors.
By advisory/structuring we mean providing advice and designing financial structures for transactions, including mergers, acquisitions, and project financing.
By climate analytics/scenario tools we mean analytical tools and methodologies used to assess climate-related risks, opportunities, and alignment with transition pathways.
By stewardship/engagement we mean the use of investor influence to engage with companies and encourage improvements in environmental performance.
An accordion facility is a provision in a loan agreement allowing a borrower to increase the credit limit or add a new term loan to an existing agreement. It offers flexible, pre-approved access to extra capital, often for acquisitions or growth, without needing to negotiate a new loan agreement.
Green real estate is used to refer to buildings with low-carbon design and operations e.g. redevelopment of large-scale property assets to deliver energy-efficient space or transforming a major office site in Edinburgh into 282,000 sq ft of sustainable high-efficiency office space.
Immediate parent is the organisation that is reported as ‘parent’, ‘majority owner’ or not reported as ‘parent’, ‘majority owner’ but owns more than 50% shares of voting stock of another company. If the immediate parent is not known, it is considered as self-owned.
An asset class is defined as a group of investments that have similar attributes, behave similarly in the market, and are subject to the same regulations (A. Ganti, 2025).
Data were collected through desk-based research on completed deals (Section 4), future plans of investors (Section 5), and green financial service providers (Section 6).
In Section 4, the following open sources were used to find information on past investments:
In October 2025, the National Wealth Fund formerly the UK Infrastructure Bank provided a long-term loan to the Orkney Islands Council for a community-owned onshore wind farm at Quanterness. The project is located in in the St Ola region of the Orkney Islands and has been in development since 2019. In addition to providing renewable electricity, the Quanterness wind farm is purported to also support the delivery of the Scottish and Southern Electricity Networks interconnector cable to the Scottish mainland (Orkney Community Wind Farms, n.d.-b; Scottish Construction Now, 2025).
The Quanterness project is part of a broader portfolio of community-owned wind farms in the Orkney Islands, including Hoy and Faray (National Wealth Fund, n.d.). It reached a final investment decision in 2025, and construction is anticipated to start in 2027. It is a fully council-owned model, where long-term income will be retained locally. The NWF loan is the only source of financing for the wind farm; the Orkney Islands Council funded the development of the project up to taking its final investment decision from its Strategic Reserve (Orkney Community Wind Farms, n.d.-b).
Investment details
The Quanterness project is a 28.8 MW onshore wind farm with six turbines, 4.8 MW generation capacity each. The turbines are Nordex N133 models, with heights of 149.1 meters and rotor diameters of 133.2 meters. They are custom-designed for Orkney’s specific wind environment (Orkney Community Wind Farms, n.d.-b). The build cost of the project is estimated at £50 million (Orkney Islands Council, 2025). The project has secured a 15-year Contract for Difference (CfD), a government-backed mechanism for stabilising long-term revenue from the sale of low-carbon electricity by agreeing a fixed strike price (Orkney Islands Council, 2025).
The NWF loan financing the project is a government loan with a total value of £62.1 million. It is provided through the Local Authority Advisory and Lending team to cover the cost of project build. The interest rates will be fixed at the government bond rate at the time of borrowing, thus providing a lower-cost financing option than those generally available on the capital market. The Orkney Islands Council plans to repay most of its loan within the CfD period and clear all debt by the end of the turbine lifetime (Orkney Community Wind Farms, n.d.-b).
Drivers and context
Although it is difficult to ascertain from public information the ultimate drivers for this particular investment, several factors are likely to have contributed to securing it. Firstly, it is part of a broader effort on behalf of the UK government to accelerate onshore wind production. This includes a renewed focus on ensuring community benefits from wind farms, although these remain voluntary (Department for Energy Security and Net Zero & Michael Shanks MP, 2025). Secondly, onshore wind is a mature and proven technology, with high levels of technology readiness and increasing efficiency of wind turbines (IEA, n.d.). Although for onshore wind this is generally limited by height restrictions. Thirdly, the fact that the Quanterness project secured a CfD may have increased project bankability, as the wind farm will benefit from long-term revenue certainty allowing it to repay the NWF loan. The potential to export electricity to the Scottish mainland has also boosted the project’s forecasted profitability, estimated at £3.3 million average annual real profit, equivalent to a total of £119 million profit over the project’s 25-year lifetime, including inflation. Beyond bankability of the project itself, the project is part of the new generation capacity required to justify spending on the new high-voltage transmission connection from Orkney to the Scottish mainland (Orkney Community Wind Farms, 2023). Finally, while onshore wind can encounter greater local community resistance than offshore generation, the Orkney Islands community wind farm proposals were met with a high level of public approval during 2023 consultations, increasing the certainty that the project will be deployed according to plan (Orkney Community Wind Farms, n.d.-b).
Outcomes/Impacts
The Quanterness project is currently awaiting construction, due to start in 2027, with generation expected to start in 2028. It is estimated to avoid nearly 40,000 tCO2e per year and create/support 170 jobs, the majority in construction. With its capacity of 28.8 MW and an average capacity factor of 38.3% for the Orkney Islands, the wind farm is estimated to produce approx. 96.6 GWh of electricity per year, enough to power nearly 26,000 average UK households (National Wealth Fund, n.d.; Orkney Community Wind Farms, 2023). A portion of the annual project revenues will be ringfenced in a community benefit fund of £144,000, with 60% going to the local council of the host community and the remainder split between the Islands’ other 19 Community Councils (Orkney Community Wind Farms, n.d.-a).
Key takeaways/Lessons
Although the project itself is still under development, we have selected the NWF loan to Quanterness as an example of a successful case study, given its potential role in unlocking the substantial wind energy resources of the Orkney Islands. It is also an investment which demonstrates the key role of public financing instruments, by offering low-cost financing options supported by revenue stabilisation mechanisms, both key advantages for bankability. No public information is available on barriers overcome by the Quanterness project. However, its business case appears to have been more robust than comparative wind farm proposals that were not progressed.
Case study 2: Flow Country Green Finance Initiative
Project/Investment overview
The Flow Country Green Finance Initiative (FCGFI) is a locally led blended finance initiative to fund the restoration of peatland in the Flow Country region in the north of Scotland (NatureScot, 2025; The Flow Country, n.d.). The Flow Country peatland bog, which the FCGFI primarily targets, is the largest in Europe, spanning an area of 400,000 hectares, estimated to store 400 million tonnes of carbon, and home to a wide range of wild plants and birds. It has been historically degraded by activities such as forestry and agriculture and is in need of restoration to continue contributing to carbon storage and biodiversity (North Highland Initiative, n.d.-b).
As of winter 2025, the FCGFI had supported two pilot restorations to demonstrate investment pathways that could be scaled up across the Flow Country (North Highland Initiative, n.d.-b; The Flow Country Green Finance Initiative, 2025). The pilots secured funding and completed restoration in 2025, at Armadale Farm (farmland) and Achentoul Estate (mixed-use land), the former through a full public grant and the latter through a mix of public grants and commercial short-term financing (The Flow Country Green Finance Initiative, 2025). Public grants were awarded through Scotland’s Peatland ACTION programme and its Facility for Investment Ready Nature in Scotland (FIRNS), in a partnership which includes the Scottish Government, Scottish Water, Cairngorms National Park Authority, and the National Lottery Heritage Fund (North Highland Initiative, n.d.-a). Little detail is publicly available on extent of private investment, however private finance was secured from Social Investment Scotland and Highland Opportunities Investment Limited (The Flow Country Green Finance Initiative, 2025). Private investment also came through landowners; for example, the restoration of approx. 10% of the surface of Armadale Farm, outside of the FIRNS-funded pilot, was funded through a compensatory restoration scheme by SSE Renewables (NatureScot, n.d.-d).
Investment details
The FCGFI is a blended finance initiative, seeking to combine public grants, private investment, and sales of carbon credits under the UK’s Peatland Code voluntary carbon market. In this carbon market, landowners with damaged peat who meet the Peatland Code carbon market standard can attract private finance for peatland restoration through the sale of carbon credits on the voluntary market (NatureScot, n.d.-c). The FCGFI aims to enable the sale of “premium” carbon credits by landowners in Flow Country. These so-called “charismatic” carbon credits are credits which provide tangible biodiversity and social benefits as well as emissions reductions (North Highland Initiative, n.d.-b).
With the restoration project being in pilot stage, the scale of funding raised under the FCGFI is small compared to Scotland’s renewable energy or green infrastructure financing. There is no publicly available information on the size of the public grants received, while the commercial short-term finance in the form of bridging loans raised to complete pilot restorations totalled £180,000 at the end of October 2025. Most of the financing for pilot restoration projects is from public sources, which is 100% at Armadale Farm and 89% at Achentoul Estate.
Drivers and context
Peatland restoration is a relatively matured measure for climate change mitigation and adaptation compared to other nature-based solutions. The exact restoration techniques depend on the characteristics of the specific area, but generally include stabilisation, damming, and re-profiling eroded peat edges (University of Leeds, n.d.). However, peatland restorations, such as those under the FCGFI are fundamentally ecosystem services-focused projects and tend to be small-scale. Many of the benefits they generate, such as carbon sequestration and biodiversity are not captured in market prices, which can make the business case for attracting private financing more difficult (NatureScot, n.d.-a). To overcome this, the FCGFI is designedat landscape scale, identifying synergies between economic activities and ecosystem services which could be packaged into a larger investment opportunity. For example, an increase in eco-tourism facilitated by restoration which also improves access to peatland areas for visitors (North Highland Initiative, n.d.-b). It also leverages the UK voluntary carbon market to increase bankability for private investors. However, the fundamental uncertainties surrounding voluntary carbon credits mean that although the pilots have been successful, the success of scaling up the project will depend on the ability to sell carbon credits at a premium and at scale. The extensive public-private collaboration, as well as the commitment to pilot investment models, likely also contributed to the success of the FCGFI in securing public and private funding for its pilot projects.
Outcomes/Impacts
The pilot projects at Armadale and Achentoul were completed in 2024 and 2025, respectively. Together, the two pilots covered restored approx. 1,000 ha of peatland and were estimated to generate 200,000 carbon credits. A third project, at Borgie, is currently pending a decision from the Land Court (Just Transition Commission, 2025). If successful, the project would restore 400 ha of peatland at a common grazing site. The FCGFI has mapped a further 129,000 ha of Flow Country land, currently not part of the pilot restorations, which would be eligible for carbon credit sales under the Peatland Code (Just Transition Commission, 2025). Alongside carbon storage and biodiversity benefits, the project also foresees job creation in “green skills” areas, including a commitment to fund a pre-restoration apprenticeship. Wider economic benefits could include boosting eco- and heritage tourism in the region (Nature Finance Pioneers, n.d.).
Key takeaways/Lessons
The FCGFI is a successful example of wide-ranging partnership between public entities, private finance providers, and landowners in deploying nature-based solutions for reducing Scotland’s emissions. The success of this investment to date is evidenced through the successful completion of its pilots. While it has demonstrated investment readiness, ongoing challenges will remain for demonstrating the price premium which project developers hope will be achieved by Flow Country carbon credits. This is a systemic barrier, generated by the lack of a benchmark price and limited trading volumes for credits on the UK voluntary carbon market, as well as investor caution around the still-emerging market for nature capital finance. The project has reported interest from a carbon buyer, which could signal evolving market demand, however challenges remain in securing long-term financial commitments and competing in the UK and international carbon markets (NatureScot, n.d.-a).
Case study 3: Zenobe Blackhillock BESS
Project/Investment overview
The Blackhillock Battery Energy Storage System (BESS) is a 300MW / 600MWh capacity grid-scale energy storage project developed by Zenobe, a UK headquartered provider of electric fleet solutions, large-scale battery storage, and second-life batteries. The project is aimed at maximising the usage of Scotland’s renewable energy output and contributing to grid flexibility. Its location between Inverness and Aberdeen allows the battery to reduce grid congestion from major offshore wind farms in the North Sea, including Viking (443MW), Moray East (950MW) and Beatrice (588MW) (Zenobē, n.d.-a). Phase 1 (200MW) of the project went live in 2025, with the remaining 100MW expected to become operational in 2026. The £235 million long-term debt facility for the project was announced in 2023. At the time of announcement, it was the largest project finance facility for battery storage to be arranged in Europe. The debt financing was provided by NatWest, the structuring bank, Canadian Imperial Bank of Commerce, Rabobank, Santander UK, and Siemens Financial Services through Siemens Bank (Zenobē, 2023a).
Investment details
The £235 million financing for the Blackhillock project forms part of a total £750 million investment in Scotland across Zenobe’s portfolio (Zenobē, n.d.-c). The debt structure also included a £400m accordion facility that would be used to finance expansions at Zenobe’s Blackhillock and Kilmarnock South BESS sites and future projects in Zenobe’s battery storage portfolio (Zenobē, 2023b).
Once fully operational, the project will have a capacity of 300MW / 600MWh, with 200MW in operation since 2025. The Blackhillock project is the first project delivered under the National Energy System Operator’s (NESO) Network Options Assessment (NOA) Stability Pathfinder programme. This programme aims to improve the long-term stability of the electricity system. Zenobe procured the energy storage system from Wartsila Energy, who provided their Quantum battery energy storage system alongside their GEMS Digital Energy Platform for remote monitoring and operations (Wärtsilä Corporation, 2025). Zenobe has also contracted EDF and Kraken to provide real-time charge/discharge optimisation and to ensure effective utilisation of the battery (Zenobē, n.d.-b).
Drivers and context
The key drivers for this project were the need for stability services in the grid, storage of excess wind power at times of low demand and delivery when demand is high. The project earns revenue through meeting these needs. NESO’s NOA Stability Pathfinders programme was created to develop technologies that generate important system characteristics like inertia and short-circuit level, as an alternative to fossil fuel plants providing these services. The programme was set up to enable NESO to decide where investment into reinforcing the system should be directed, including the types of technologies and geographical location of projects. Through market tenders, NESO contracts with stability service providers to address stability issues on the grid (National Energy System Operator, n.d.). The Blackhillock BESS is the first project delivered under this programme (Solar Power Portal, 2025). Grid congestion from Scotland’s rapidly growing offshore wind capacity was another driver for this project.
This investment also aligns with the broader energy goals of the UK and Scottish governments. Zenobe’s analysis indicated that over 22GW of battery capacity is needed to meet the UK’s Clean Power 2030 Action Plan’s targets (The Register, 2025). Furthermore, Scotland’s Draft Energy Strategy and Just Transition Plan, alongside an emphasis on scaling renewable energy, calls for additional energy storage projects (Scottish Government, 2023).
Outcomes/Impacts
Phase 1 (200MW) of the project has been operational since March 2025. Phase 2 (100MW) is expected to become operational in 2026. Upon completion, this project will represent roughly 30% of installed battery storage capacity in Scotland. The project is expected to prevent approximately 2.61 million tonnes of CO₂ emissions and lower consumer energy bills by £172 million over 15 years. £8 million of these savings are attributed to the use of the battery storage technology for grid stability, instead of fossil gas. Zenobe assumed that this contract for the provision of inertia and short-circuit level, historically provided through fossil fuel plants, will avoid the use of combined-cycle gas turbines (CCGTs). This will result in savings for the consumer given the efficiency levels of CCGTs and the outlook for gas prices. The remaining £164 million in consumer savings is attributed to balancing services and constraint management. The battery is expected to provide savings when compared to the alternative actions that grid operators would undertake in its absence. This includes storing excess energy instead of curtailing wind generation during periods of network constraint or offering more competitive electricity prices in auctions rather than the grid having to rely upon gas peakers or CCGTS. At full capacity, the site will store enough energy to supply over 3.1 million homes for one hour (Zenobē, 2025).
Key takeaways/Lessons
This case highlights the role that supportive policies can play in technology uptake and project developments. The UK and Scottish governments provided the signalling that battery storage is a key element of meeting clean power goals. NESO began a programme to procure stability services from clean technologies instead of fossil fuel plants. These conditions play a key role in attracting financing from the private sector. Kilmarnock South, another Zenobe BESS project, went live in January 2026 about 10 months after Blackhillock (Zenobē, 2026). This shows the likely replicability of this operational model. The project also highlights successful collaboration between public bodies such as NESO and the private actors including Zenobe, Wartsila, Kraken, EDF and the financing banks.
How to cite this publication:
Kulaga, D, Umer, H, Aycan, D, Tyrer, D, Chiara Iannino, M, Vella, S. (2026) ‘Mapping Scotland’s sustainable finance landscape’ , ClimateXChange. DOI https://doi.org/10.7488/era/7318
While every effort is made to ensure the information in this report is accurate as at the date of the report, no legal responsibility is accepted for any errors, omissions or misleading statements. The views expressed represent those of the author(s), and do not necessarily represent those of the host institutions or funders.
This work was supported by the Rural and Environment Science and Analytical Services Division of the Scottish Government (CoE – CXC).
Scotland’s businesses, infrastructure, communities and natural environment face increasingly severe climate change impacts. Yet, the required adaptation actions – how they will evolve over time, what they will cost, and who should pay – remain poorly understood.
This report provides the first estimate of Scotland’s climate adaptation investment needs through to 2040 across five sectors (and eight subsectors):
agriculture;
communities (flooding);
the natural environment (woodland creation, peatland, nature restoration);
transport (trunk roads, motorways, railways); and
water (public water and wastewater services).
It then presents two further discrete analyses: macroeconomic modelling to estimate the wider economic effects of similar levels of adaptation spending, The five sectors were chosen to reflect the diverse approaches required to assess indicative adaptation costs. We examine four aspects of climate adaptation investment: required investment, its macroeconomic impacts, public-private funding splits, and the potential to mobilise private capital. This work is intended to support the Scottish Government in building an evidence based ahead of the fourth Scottish National Adaptation Plan (SNAP4).
Estimating future adaptation cost is inherently challenging. It requires assumptions about future warming, the level of climate risk that society are willing to tolerate, and the associated scale of adaptation and residual damages. Deep uncertainty in climate projections, socioeconomic change, asset vulnerability, and political priorities make precise modelling both challenging and resource intensive. As a result, the findings in this report should be treated as pragmatic, evidence-based approximations that indicate the order of magnitude of investment needs—not definitive targets.
Why adaptation investment matters
Failing to invest in mitigation and adaptation carries significant economic costs. Estimates for this study suggest climate change could reduce GDP by 0.3-0.4% a year in the 2030s, rising to 1.2-1.6% by the 2050s and 1.6-3.3% by the 2070s. Other studies project higher impacts but these depend on the models and assumptions used. The Scottish Environment Protection Agency estimate that flooding alone already costs Scotland an estimated £500 million per year. Adaptation can reduce these damages, but it also requires upfront investment, is rarely fully effective, and involves trade‑offs between expenditure and residual risk. The key question is therefore not whether to invest in adaptation, but how much and who should pay.
Adaptation investment also delivers wider benefits, often described as the “triple dividend”: avoided losses, economic gains, and social and environmental co-benefits such as biodiversity improvements, carbon sequestration, and better mental health. These co-benefits further strengthen the economic case for adaptation.
Climate costs are projected to rise significantly beyond 2040. The research and strategic priorities below are therefore time-sensitive: early action on adaptation can reduce long-run costs and delivers benefits that delayed investment may not recover.
Estimated climate adaptation investment need for Scotland in five sectors
Adaptation investment needs across the five sectors and eight subsectors assessed in this study are estimated at £7.8–£14.2 billion between 2026 and 2040, or £566–£1,027 million per year. Sector and subsector level results are shown in Table 1.
Previous estimates from the Climate Emergency Response Group, Paul Watkiss Associates, and the Office for Budget Responsibility – based on UK wide analyses and international benchmarks – suggested Scotland’s total adaptation costs would range from £196 million to £1,340 million per yearfrom 2030 onwards. The sector specific estimates in this study fall within that range. However, because this analysis covers fewer sectors than the Scottish National Adaptation Plan, the findings suggest that Scotland’s full adaptation investment needs may be higher than previously anticipated.
The study also compared the estimated annual adaptation investment needs to current allocations in the Scottish budget. It found that only the agriculture sector is likely meeting its adaptation needs. The communities (flooding), transport, and nature sectors will likely require additional investment to maintain current risk levels. We could not assess the water sector due to a lack of available information on existing adaptation spending.
The results in this report carry low confidence and should be viewed as indicative, not precise. Confidence levels vary by sector (Table 1) due to fragmented data, limited understanding of asset vulnerability, and the lack of clear adaptation targets to scale investment needs. Where Scottish specific data was unavailable, we crosschecked estimates with international comparisons, which also have limitations because of differing risks and institutional contexts. These figures therefore represent order of magnitude estimates designed to inform policy discussion and future research, rather than definitive costings.
Table 1: Climate adaptation investment estimates for 14 years 2026/27 to 2039/40 across five sectors and their key sub-sectors (2026/27 prices). Where available, current budget (or estimates) are presented alongside estimated investment need, with a RAG rating indicating whether current spend meets the estimated need (green), falls within 20% below it (amber), or is more than 20% below it (red). A confidence rating is assigned to each investment estimate, alongside the primary source from which the investment estimate was derived.
The macroeconomic effects of investing in climate adaptation
A full assessment of the macroeconomic costs and benefits of adaptation were beyond the scope of the study. However, the study did model the direct economic effects of adaptation spending across sectors. It also explored how different approaches to cost recovery affect economic activity, employment, and household incomes.
The modelling consistently shows that adaptation spending generates a positive economic stimulus during the investment period, supporting jobs and output particularly in construction, engineering, and land-based supply chains. However, the way costs are recovered matters considerably. Income-tax-based recovery is progressive but dampens household consumption and reduces activity in consumer-facing sectors. Charging-based approaches – such as higher food prices in agriculture or water bills in the water sector – tend to be regressive, falling disproportionately on lower-income households for whom essential goods represent a larger share of budgets. Recovery through public spending cuts generates the most widespread economic losses, particularly across service sectors. Funding design is therefore important to consider alongside investment scale.
These results should not be interpreted as a full cost-benefit assessment of adaptation. The modelling captures the demand-side effects of spending and cost recovery, but does not account for avoided climate damages, residual risks, or the broader triple dividend of adaptation.
How will costs be borne by households, businesses, and the public sector?
The study investigated how adaptation is currently funded in each of the sectors. Climate adaptation in Scotland is currently funded predominantly by the public sector. Central and local government fund and finance most adaptation-relevant expenditure across transport, flood management, water infrastructure, agriculture, and the natural environment. This is largely through existing budget lines that deliver multiple objectives alongside adaptation. However, households and businesses pay more than previously understood, through Council Tax and Non-domestic rates. Households and businesses also bear some costs directly, for example through property-level insurance and on-farm investments, but this remains modest in most sectors.
This balance is unlikely to shift fundamentally. Most of the adaptation investment – including flood protection, transport resilience, and natural flood management – generates little or no direct financial return and is therefore structurally dependent on public funding. Analysis suggests that approximately three-quarters of adaptation investment needs will require public financing regardless of innovations in private finance mechanisms.
Scope to boost private sector participation
The study reviewed the innovative funding and financing models being used internationally and within Scotland. Analysis found that there is modest potential to increase private sector participation in adaptation funding and financing across all five sectors, and a range of innovative mechanisms are emerging. These include parametric insurance in agriculture, biodiversity credits and voluntary carbon markets in the natural environment, green and resilience bonds for flood and transport infrastructure, and catchment co-investment models in water. However, several important caveats apply:
Scaling private investment will not happen through market forces alone. It will require concerted public policy action, enabling conditions, and in many cases public co-financing to de-risk private investment. The private sector’s role is best understood as complementary to, rather than a substitute for, public adaptation finance.
There is a critical distinction between private financing (where private capital provides upfront funding) and private funding (where costs are ultimately borne by the private sector rather than transferred back to government or consumers). Many instruments that appear to increase private participation in practice shift the funding burden, rather than share it. Policy ambitions to mobilise private capital should be assessed against this distinction.
High benefit-cost ratios in the adaptation literature typically reflect societal and environmental returns, including non-market values that generate no cash flow. Private investors assess financial returns, incremental revenues and recoverable costs, which are considerably lower. Treating strong societal co-benefit ratios as evidence of private investment attractiveness risks generating unrealistic expectations about the scale of private finance that can realistically be mobilised.
Recommendations
The report lays out the following key recommendations, in no particular order:
Table 2: Key recommendations for further research and strategic priorities.
Theme
Research priority
Strategic priority
Adaptation targets, objectives & risk tolerance
Develop quantified adaptation targets and sector specific risk tolerance thresholds. Use these to conduct gap analyses and support SNAP4.
Recognise that sectors are at different stages of the adaptation investment cycle and develop sector-differentiated investment strategies accordingly.
Asset level vulnerability & investment pipelines
Develop spatially referenced vulnerability inventories across all sectors to prioritise sites, assets, and interventions, integrating existing datasets such as SEPA flood risk assessments.
Build investment-ready pipelines capable of attracting both public and private finance at scale, moving from risk assessment towards costed, prioritised investment programmes.
Financial transparency & attribution
Develop methods to isolate adaptation specific spending in agriculture and assess funding adequacy.
Improve budget reporting so adaptation spending is clearly distinguished from mitigation and other objectives.
Embed adaptation objectives within existing spending programmes (e.g., infrastructure maintenance, housing retrofit) through improved budget tagging and apportionment guidance.
Triple dividend evidence base
Avoided losses: Strengthen evidence on avoided damages across sectors.
Economic stimulus: Quantify employment, supply chain, and distributional impacts.
Co-benefits: Assess wider social and environmental co-benefits.
Use fuller quantification of the triple dividend to build the economic case for public investment in adaptation.
Distributional impacts
Analyse how different financing mechanisms (tax, price, charges) affect different groups.
Identify compensatory policies to ensure fair and equitable funding.
Cross‑sector collaboration
Explore catchment‑scale approaches that deliver multiple co‑benefits.
Map how adaptation priorities can be embedded within civil contingencies, biodiversity governance, spatial planning, and infrastructure regulation.
Create mechanisms for sharing research and delivery across sectors, building on existing networks such as the CRIS Forum.
Prioritisation
Develop prioritisation frameworks that account for rural vulnerability, social equity, and Just Transition principles.
Private finance mobilisation
Develop a coherent national approach identifying appropriate mechanisms for each sector, the enabling conditions required, and how public co-financing can de-risk private investment.
Draw on international experience with blended finance, green bonds, and nature finance.
Monitoring and evaluation
Develop an adaptation investment monitoring and evaluation framework, aligned with SNAP3 but capturing financial flows and asset-level outcomes.
Glossary
Annual Average Loss (AAL)
The expected average financial loss from flood events in any given year, calculated across all possible flood scenarios weighted by their probability of occurrence.
Adaptation pathways
A planning approach that sequences adaptation actions over time, allowing for adjustments as climate change and its impacts become better understood.
Bottom-up costing
An approach to estimating adaptation investment needs that builds cost estimates from detailed, project-level information gathered from engineers, contractors and technical specialists, or from specific policy objectives where budget lines can be scaled up.
Computable General Equilibrium model (CGE model)
An economic modelling framework that simulates the interactions between different sectors of an economy to assess the broader macroeconomic impacts of policy changes or external shocks, such as climate change.
2026/27 Climate Taxonomy
A classification system, published alongside the Scottish Government budget, that identifies budget lines according to their impact on climate change mitigation and adaptation.
Community Benefit Funds (CBFs)
A community benefit fund is a voluntary, typically annual, financial contribution provided by developers to local communities hosting major projects, such as renewable energy sites.
Consumer Price Index (CPI)
Presents the percentage change in prices that consumers pay for goods and services.
Control Period (CP)
Network Rail’s fixed five-year funding and planning cycle that sets budgets and outputs for the railway (e.g. CP7: 1 April 2024 – 31 March 2029).
Expected Annual Damages (EAD)
The average annual financial cost of flood damage calculated across return periods, accounting for both the likelihood and severity of events.
Gross Value Added (GVA)
A measure of the value of goods and services produced in an area, industry or sector of an economy, used here as a proxy for scaling adaptation investment estimates across countries.
Major Capital Investment (MCI)
Large-scale, transformational infrastructure schemes where continued operations would otherwise become impossible as a result of a changing climate.
Natural Flood Management (NFM)
An approach to reducing flood risk that works with natural processes, for example through wetland creation, tree planting or river restoration, to slow the flow of water and reduce peak flood levels.
Organisation for Economic Co-operation and Development (OECD)
An international, intergovernmental forum of 38 developed market-based economies established in 1961 to stimulate economic progress and world trade. Headquartered in Paris, it provides data, policy analysis, and standards to promote prosperity, equality, and well-being.
Office for Budget Responsibility (OBR)
The Office for Budget Responsibility was created in 2010 to provide independent and authoritative analysis of the UK’s public finances.
Operations, Support, Maintenance and Renewals (OSMR)
The category of Network Rail Scotland investment covering day-to-day operational response to weather, preventative and reactive maintenance, and asset renewals.
Property Flood Resilience (PFR)
Measures applied at the individual property level to reduce the risk of flooding or minimise flood damage, such as flood doors, air brick covers, or non-return valves.
Potential Vulnerable Areas (PVAs)
Areas identified by SEPA as being at significant risk from flooding, which form the basis for Flood Risk Management Planning in Scotland.
Representative Concentration Pathway (RCP)
A greenhouse gas concentration trajectory used in climate modelling to represent different possible futures based on varying levels of emissions (e.g. RCP 4.5 is a moderate emissions scenario; RCP 8.5 is a high emissions scenario).
Residual damage
The climate-related losses or damages that remain even after adaptation measures have been implemented, reflecting the limits of adaptation effectiveness.
Scottish Environment Protection Agency (SEPA)
Scotland’s environmental regulator, responsible for flood risk assessment, flood warning, and producing Scotland’s Flood Risk Management Plans.
Scottish National Adaptation Plan 3 (SNAP3)
The third Scottish National Adaptation Plan, covering 2024–2029, setting out actions to achieve five national outcomes for climate resilience across society, the economy and the environment.
Scottish National Adaptation Plan 4 (SNAP4)
The fourth Scottish National Adaptation Plan will cover 2029 – 2034, setting out actions to better adapt Scotland to the changing climate.
Strategic Review 27 (SR27)
Scottish Water’s regulatory investment planning period covering 2027–2032, within which adaptation investment needs are assessed and costed.
Sustainable Urban Drainage Systems (SUDS)
Drainage infrastructure designed to manage surface water in a way that mimics natural drainage, reducing flood risk, improving water quality and enhancing the urban environment.
Top-down costing
An approach to estimating adaptation investment needs that uses economic models and sector-level damage assessments to derive aggregate cost estimates, typically without detailed project-level information.
Triple dividend
The three categories of benefit that adaptation investment can deliver: (1) avoided climate losses; (2) wider induced economic benefits such as infrastructure investment stimulus; and (3) social and environmental co-benefits such as biodiversity gains and improved mental health.
UK Climate Projections 2018 (UKCP18)
The most recent set of probabilistic climate projections for the UK, produced by the Met Office, used to inform climate risk assessments and adaptation planning across multiple sectors.
Value transfer
A method of estimating costs or benefits by applying findings from existing studies in comparable contexts (e.g. other countries or regions) to a new setting, adjusted for relevant differences such as economic scale or population.
Introduction
Overview, aim and scope
Tackling the climate emergency is a priority area for the Scottish Government – alongside eradicating child poverty and growing the economy and delivering high quality sustainable public services (Scottish Government, 2025a). As part of tackling the climate emergency, three questions have emerged associated with the need to better understand:
The costs of the Scottish Government climate change ambitions for adaptation and the residual damage of necessary trade-offs.
The macroeconomic effects of climate impacts and adaptation.
How these costs are being met today, and options for how these costs will be met by different groups, including public and private sectors.
This project provides an initial exploration of some of these issues. In doing so, it supports the Scottish Government in developing an evidence base on the potential costs of climate adaptation across a range of sectors. This is important information to assist in strategically planning and driving forward future adaptation action, in line with Scotland’s National Adaptation Plan.
The analysis focuses on three interconnected research objectives:
Estimate adaptation investment needs for five sectors – agriculture, communities (focusing on flooding), natural environment (woodland creation, peatland restoration and nature restoration), transport (trunk roads and motorways and railways), and water (supply and treatment) – until 2040. This should be aligned with the with adaptation objectives defined in the Scottish National Adaptation Plan 3 (SNAP3) 2024–2029;
Assess the likely investment split, over time, between the public sector, private sector businesses and individuals for each sector; and
For each sector, identify the potential to support private sector participation in funding and financing adaptation, highlighting barriers to scale, and recommending policy instruments to mobilise private capital.
Context: climate risks in Scotland
Scotland’s businesses, infrastructure, communities and environment are becoming increasingly exposed to climate change. These impacts carry serious economic consequences.
The estimated impact of climate change on the UK’s economy differs depending on the climate scenarios used and wider socio-economic assumptions made within modelling. This study assessed the results for Scotland using results from a major EU project (Bosello et al., 2020). Across several climate scenarios, these suggests that from 2030 Scotland’s economy could be 0.3 – 0.5% smaller each year. By 2050, losses could rise to 1.2 – 1.6%, increasing further to 1.5 –3.3% by the 2070s. These are shown in Figure 1, and have been used as the basis for supporting subnational assessments of economic impacts in Scotland (e.g. Climate Ready Clyde, Highland Adapts, South East Scotland and Forth Valley).
Figure 1: Projected impact of climate change on GVA in Scotland for a range of future climate scenarios using Shared Socioeconomic Pathways 2 (SSP2). High Investment Mobility. SSP2 is also known as ‘middle of the road’ and assumes the world follows a path in which social, economic and technological trends to not shift markedly from historical patterns…
A second study, Rising et al. (2022), included additional risks, such as low-probability high-impact events, projecting that under current policies – and compared to a 2000 baseline – the total cost of climate change damages to the UK are projected to increase from 1.1% of GDP at present to 3.3% by 2050 and up to 7.4% by 2100 (Rising et al., 2022). Furthermore, the Office for Budget Responsibility (OBR) estimate that the cost of climate change could even reduce the UK level of GDP by 8% by 2070 if the world was to warm by 3oC by the end of the century (Office for Budget Responsibility, 2025).
While adaptation can significantly limit climate related damages, fully eliminating climate risk is neither technically feasible nor economically rationale (Rexer & Sharmer, 2024). This means that even robust adaptation actions will leave some residual risk, highlighting the need to target measures that deliver the greatest benefit relative to their cost.
The Climate Change (Scotland) Act 2009 requires a National Adaptation Plan to be published every five years, aligned with the latest UK Climate Change Risk Assessment (CCRA). The latest, SNAP3, covers 2024 – 2029. SNAP3 sets out outcomes, delivery objectives and policy actions. It the first UK Adaptation Plan to also be supported by a monitoring and evaluation framework to track progress. However, specific objectives around risk reduction, as well as associated costs or budgetary allocations remain undefined in Scotland and across the UK.
As the Scottish Government prepares to receive the upcoming fourth UK Climate Change Risk Assessment (CCRA4) and Well Adapted UK report, there is growing recognition of the need to be more specific about the assumptions underpinning adaptation planning, and the costs and benefits. The Climate Change Committee (CCC) recommends that the Scottish Government introduce quantified, timebound adaptation targets to better track progress and strengthen accountability, consistent with preparing for +2°C warming by 2050 while managing risks associated with up to +4°C by the end of the century (Scottish Government, 2025b). However, setting such targets requires clarity on the level of climate risk that government and society are willing to tolerate.
This raises the important question of the acceptable level of risk, and for whom. Different communities, sectors and social groups will be affected in different ways. Given these complexities, developing adaptation targets will likely require broader engagement, including opportunities for the public and stakeholders to contribute to discussions about acceptable levels of risk. It also involves considering who pays – raising questions of equity and risk ownership. As such, adaptation target setting can be closely linked to Just Transition principles.
Defining the level of climate risk that is acceptable is therefore closely associated with the question of how much adaptation investment is needed, and who should pay for it.
Yet current evidence on these questions for Scotland is limited. There are partial estimates of adaptation investment need within the literature, but no agreed sector-specific adaptation targets, no systematic estimates of the investment required to meet them, and no established framework for understanding how costs should be shared between the public sector, private sector, and individuals.
This gap matters: without a clearer picture of adaptation investment needs, it is difficult to plan strategically, allocate budgets effectively, or make the case to mobilise private capital alongside public expenditure. But it is also challenging due to the deep uncertainty of climate change – including our warming trajectories and socioeconomic change.
This report seeks to begin closing that gap. Drawing on a range of analytical methods and the best available evidence across five sectors – agriculture, communities (flooding), transport, water, and the natural environment – it provides indicative estimates of Scotland’s adaptation investment needs to 2040, an assessment of public-private investment splits, and an exploration of opportunities to increase private sector participation in financing Scotland’s adaptation.
This report is structured as follows:
Section 2 sets out a general account of the economics of adaptation. This sets out the conceptual framework for estimating investment needs, and approaches exploring the public-private investment split. It also positions the existing evidence base for Scotland.
Section 3 presents our approach and methods.
Section 4 provides sector-specific results for agriculture, communities (floods), the natural environment, transport, and water. It explores adaptation investment needs, macroeconomic effects and wider impacts, and funding and financing arrangements across all five sectors.
Section 5 presents a summary of our analysis
Section 6 outlines recommended research and strategic priorities.
The economics, costing and financing of adaptation
The economics of adaptation
In simple terms, adaptation costs and benefits can be estimated by first assessing the current and future impacts of climate change, then evaluating how much these impacts can be reduced and at what cost (Boyd and Hunt, 2004; UNFCCC, 2009). Adaptation measures can substantially reduce damages, but even well-designed strategies involve trade-offs: investing more in adaptation may deliver greater risk reduction but also increases cost. As a result, reducing risk to zero is neither technically feasible nor economically desirable, and some residual risk will always remain (Rexer & Sharma, 2024).
The scale of costs and benefits depends heavily on chosen objectives. For example, whether aiming for economic efficiency, reducing risks to acceptable levels, or maintaining today’s relative level of climate risk despite worsening conditions. In practice, estimating adaptation costs is highly complex because of deep uncertainty, with issues of socioeconomic change, future emissions, climate models, regional scenarios, impacts, adaptation responses, and political priorities combining to make modelling challenging (Wilby and Dessai, 2010; Taylor et al., 2025; Valverde et al., 2022). These uncertainties make it challenging to assess costs and benefits, creating the potential for over or underestimation of investment.
Despite this, there are some examples. These include national design standards for flood risk (e.g.to a 1-in-200-year event in Scotland, or up to 1-in-10,000-year in the Netherlands (Westerhof et al., 2023)), and emerging work on resilience in warming trajectories more broadly. The UK Government’s Long Term Investment Scenarios explore the optimum levels of investment under different climate scenarios and then use that to guide the spending envelope in the UK’s Flood and Coastal Erosion Risk Management (Environment Agency, 2021). And on reference scenarios, the Climate Change Committee has advised the UK Government to plan for 2 degrees of warming and prepare for 4, while in France the French Government has adopted a reference trajectory of four degrees.
Furthermore, adaptation investment can deliver multiple co-benefits, collectively known as the ‘triple dividend’ (Global Commission on Adaptation, 2019):
The first dividend relates to avoided losses from successful adaptation. For example, a home that doesn’t flood because flood defences were built.
The second relates to induced economic benefits such as the stimulus to the economy. For example, from capital investment in infrastructure development projects.
The third includes social and environmental benefits. For example, afforestation projects that slow water runoff to rivers provide flood mitigation but also deliver biodiversity gains, carbon sequestration, and mental health benefits through green space access.
Considering all three dividends has the potential to improve the economic rationale of investing in climate change adaptation (Figure 2). In this report, while our analyses partially explore triple dividend benefits, it is beyond the scope of work to comprehensively consider wider savings made on triple dividends (see Section 8 on next steps).
Figure 2: The economics of adaptation. The orange line shows projected climate change impacts on GDP (%) without adaptation; the teal line shows residual damages with adaptation. The gap between them represents the gross benefits of adaptation – subtracting the cost of adaptation yields the net benefits, comprising components such as avoided losses and economic, social and environmental co-benefits. Shaded areas indicate indicative uncertainty ranges only. The benefit breakdown is illustrative and not to scale. Adapted from Boyd and Hunt (2004), Global Commission on Adaptation (2019), and Watkiss et al. (2026a).
Apportioning adaptation costs
A key challenge in estimating adaptation investment needs is defining what constitutes ‘adaptation’ and how to attribute costs when activities serve multiple purposes. Climate adaptation rarely occurs in isolation – it is typically integrated into broader investment programmes, delivered alongside other policy objectives, or embedded within routine infrastructure maintenance and renewal. This raises practical questions for cost estimation: should we count the full cost of a project that includes adaptation as one of several objectives, or only the incremental cost of climate-proofing measures above a baseline investment?
To address this, the study adopted the adaptation cost taxonomy developed by the Multilateral Development Banks (MDBs), which has been widely applied internationally to track adaptation finance and compare investment needs across countries (MDB, 2022). This taxonomy categorises adaptation investments into three types based on the role adaptation plays in the overall investment (Figure 3):
Figure 3 Taxonomy of adaptation costs. Adapted from Watkiss et al. (2026a) based on Multilateral Development Banks (2023).
Building climate adaptation into proposed programmes and investments (climate proofing). For example, to include climate change in the design standards for new road investments. In this case, adaptation is not a major objective. Instead, assessments investigate the incremental costs of adaptation, over and above the core programme / investment costs.
Targeted/pure adaptation programmes and investments (targeted adaptation). In this case, the primary objective of the policy, programme or project is adaptation to climate change. For example, investing in coastal flood protection to address sea-level rise. In this case, the total costs of the investment are counted as adaptation.
Investments with multiple benefits that include adaptation (mixed objectives). Sitting between the two extremes above are a set of cases where adaptation is one of several objectives of the policy, programme or project (a secondary or significant objective). For example, investing in peatland restoration will lead to greater resilience of the peatland (to climate change) as well as off-site benefits (water management) but this investment is primarily associated with biodiversity and ecosystem services. In this case a proportion of the cost is attributed to adaptation, but this is often difficult to do accurately and involves more subjective decisions.
These distinctions are important for climate adaptation investment estimation and the economic rationale for investment. However, this categorisation can create potential for confusion in practice. Activities that might have been pursued primarily for economic development, environmental restoration, or other policy goals can be classified as ‘adaptation’ if they deliver climate resilience benefits – even when adaptation was not the original or primary driver. This raises important questions about additionality: would the investment have proceeded anyway without climate considerations?
Approaches to costing adaptation investment
International approaches
There is no single ‘correct’ method for costing climate adaptation. Instead, there are a variety of approaches, and the most appropriate approach depends on the context. Factors such as specific objectives, analysis level, measure types, and critically, the available data and resources all influence the choice (World Bank, 2024; Taylor et al., 2025).
Climate adaptation objectives can be framed in several ways – by setting targets based on future warming levels, engineering resilience standards, specific risk reduction goals, economic thresholds, or process-based requirements (World Bank, 2024). Each framing influences the scale of action, investment needs, and acceptable levels of residual risk. These choices shape how ambitious adaptation efforts must be, the types of projects prioritised, and the balance between public, private, and household responsibilities. Higher resilience standards typically require greater upfront investment, while economic optimal or process-based approaches may lower costs but leave more risk unaddressed (Taylor et al., 2025).
Costing methodologies exist on a spectrum: ‘top-down, science-first’ approaches use economic models and sector-level damage assessments to estimate aggregate costs, while ‘bottom-up, policy-first’ approaches build estimates from detailed project-level information gathered from contractors, engineers, and technical specialists, focused on answering specific near-term questions. There are also hybrid methods that blend top-down and bottom-up approaches. The World Bank identifies various tools and approaches for both sets of methods including top-down sector integrated assessment models (IAMs), computable general equilibrium (CGE) models, through to bottom-up sector-based costing, climate adaptation markups, and budget tagging approaches at the more granular level (World Bank, 2024).
The most accurate estimates for appraisal or project delivery come from bottom-up costing based on detailed contractor quotes. However, this approach requires substantial resources, data availability, time, and technical capacity to progress projects through to a level of maturity which can provide this, and this is not always available (Taylor et al., 2025).
European estimates
Multiple European countries have recently attempted to quantify their national adaptation investment needs, each developing similar, yet distinct, methodologies suited to their institutional context and data landscape. To inform the approach to Scotland, this study reviewed literature from these studies and drew key lessons from each, as follows:
Austria took a parallel approach (Knittel et al. 2017), adopting a top-down budget review using expert interviews to assign flexible apportionments of current spending to climate adaptation (such as 60% for flood infrastructure for example) and bottom-up costing of 67 National Adaptation Strategy measures grouped into cost bands. The two methods produced different results, €488m/yr versus €385m/yr respectively, revealing they measured fundamentally different things: current government activity versus strategic intent (Knittel et al., 2017).
France compiled existing estimates across 15 policy areas, gathering what stakeholders had already produced and providing unit-cost benchmarks from completed projects. It was openly acknowledged this represented ‘what exists’ in planning discussions rather than rigorous comprehensive costing (Dolques et al., 2025).
Spain aggregated funding from multiple sources, historical environmental spending, COVID recovery allocations, and department budgets, applying different percentages based on how directly measures addressed adaptation (100% for flood defences, 40% for ecosystem restoration, 10% for co-benefits). This reached €1.55bn for 2021-2025, though many costs remained undefined and excluded (MITECO, 2020).
Bulgaria grouped measures into Low/Medium/High-cost bands (up to €1m, €1-100m, over €100m) but using specific figures where detailed studies existed, such as €347.81m for irrigation from cost-benefit analysis (Dale & Zhekova, 2019).
Croatia took a strategic approach, developing a prioritised 20-year portfolio of adaptation investments (€3.6bn) through climate modelling and stakeholder workshops, then justifying the annual cost (€183m) by showing it was less than current average damages from extreme weather (€295m) (Croatian Parliament, 2020).
EU level analysis by Neumann et al. (2025) compiled national studies, adjusted them for different emission scenarios and hazards, then extrapolated to countries lacking data using sector economic output as a proxy. Transport estimates drew on seven national studies while agriculture relied on only three, highlighting persistent data gaps (Neumann et al., 2025). A separate EU level study (European Commission, 2026) conducted a bottom-up analysis, which reviewed member state risk assessments, identified and costed relevant measures and then scaled them to the EU. This suggests annual investment needs of €69bn/year to 2050, dominated by infrastructure and ecosystem investments.
There have also been estimates for the UK. These have focused on the costs of adaptation today by categorising actions in the National Adaptation Plan (NAP) in line with Multilateral Development Bank (MDB) taxonomies and estimating investment needs (Watkiss et al., 2026a), though there have been some estimates for future costs as part of the forthcoming Well Adapted UK report (e.g. in Watkiss et al, 2026b and others).
All these studies were transparent about the limitations of the methods used, acknowledging uncertainty rather than presenting false precision. They demonstrated that pragmatic, evidence-led approaches are essential given current data constraints, and framed estimates as ‘evolving documents’ requiring iterative refinement, not as definitive adaptation investment estimates.
Existing estimates for adaptation investment need
Globally, climate finance flows have grown significantly, with total flows reaching US$1.9 trillion in 2023 and private contributions exceeding US$1 trillion for the first time. However, the vast majority of this is directed towards mitigation, with Climate Policy Initiative (2025) estimating only 3.4% is going towards adaptation. The latest United Nations Environment Programme (UNEP) estimates show that developing countries will need at least US$320bn/yr – $400bn/yr for adaptation by 2035, which is roughly ten times higher than today’s international public adaptation finance flows (Watkiss and England, 2025).
To date, there has been limited research specific to Scotland on climate change adaptation investment need. Estimates are instead deduced from broader studies, ranging from £196–£1,340m per year:
A recent World Bank study suggests that near-term adaptation investment for the EU27 could amount to 0.1% – 0.4% of GDP annually by 2030 (World Bank, 2024). Scotland’s Climate Emergency Response Group (CERG) applied these values to Scotland, estimating £196 – £784m per year by 2030 (CERG, 2024).
Indicative estimates for the UK suggest adaptation costs of around £5bn/yr to 2030 for a subset of priority risks, rising to £10bn/yr or more when all 61 CCRA3 risks and proactive adaptation measures are included (Watkiss, 2022). These figures are expected to increase significantly after 2030 as the number of high magnitude climate risks grows from 12 to 21 by the 2050s. Yet these estimates remain partial and indicative, with substantial gaps in sectoral coverage, inconsistent assumptions, and a bias toward engineering solutions rather than social or institutional adaptation (Watkiss, 2022). Using Watkiss (2022) values, and assuming Scotland accounts for 7.5% share of UK economic output as a proxy (Harari & Murray, 2024), implies adaptation costs of approximately £375 – £750m per year.
Analysis by the Office for Budget Responsibility (OBR) suggests adaptation costs of around 0.3% of GDP per degree of warming (OBR, 2021). The OBR also highlights that adaptation costs are likely to rise unevenly over time, with larger and more frequent economic shocks expected later in the century. Using 2024 prices, these costs are equivalent to £670 – £1,340m per year for Scotland under 1 – 2°C of warming respectively.
Scotland’s specific vulnerabilities and policy landscape mean these broader UK estimates may not accurately reflect Scotland’s climate adaptation investment need. For example, Scotland faces a distinctive combination of climate hazards and geographic contexts. This includes a higher proportion of woodland and peatland, topographic challenges, and 93 inhabited islands, that may not be captured by downscaling UK-wide estimates based on Scotland’s share of GDP. The CCRA3 Scotland summary is also the only national summary to identify flooding as the most severe and costliest hazard to businesses, further highlighting the limitations of direct comparison to UK-level estimates.
Investment need will also vary within Scotland, with some regions more vulnerable to climate risks. Nascent estimates of the public sector adaptation gap in Glasgow City Region (Climate Ready Clyde, 2021) suggested a gap of £187m in 2018/19 alone for the region’s local authorities and the health board, equivalent to around 2% of combined local authority and NHS expenditure across the region’s eight councils and two health boards. No other regional estimates in Scotland have been published.
While national climate adaptation investment estimates are lacking, some public bodies, such as Scottish Water and Network Rail Scotland, have conducted bespoke asset climate vulnerability assessments and initial adaptation cost estimates to facilitate strategic business planning (e.g., Network Rail Scotland, 2024; Scottish Water, 2025). Others have more limited research on specific adaptation investment need. Therefore, while some sector specific information exists, it is fragmented.
As well as absence of Scotland-wide adaptation estimates, there is a lack of robust estimates of the wider returns from adaptation investment. These include avoided climate damages, economic benefits, and broader socio-environmental gains that comprise the ‘triple dividend’ of adaptation.
Who pays for adaptation?
Financing versus funding
A critical but often overlooked distinction in climate adaptation investment is the difference between financing and funding (Watkiss and England, 2025). Financing refers to where the upfront money comes from, whether public grants, government borrowing, sovereign green bonds, or private capital, and the financial instruments and terms involved. Funding, by contrast, refers to who ultimately pays for the adaptation over the lifetime of the investment, whether through public budgets, taxation, or user charges. This distinction matters because private sector involvement can help close the financing gap without necessarily closing the funding gap: costs may simply be transferred back to governments or households rather than genuinely shared.
This is illustrated in Figure 4, which shows options for delivery of a programme of coastal flood protection in a developing country context. Here, the delivery is provided by the private sector, who build the contract. The financing can be provided in many ways, including from public budget, tax rises, or private sector financing through the capital markets. These are important since there is much greater potential for private sector financing than for developing business. For example, it is possible to attract significant amounts of private sector financing to support public sector investment, but ultimately government repays with interest. Therefore, it is important to consider whether we are seeking to boost private sector funding (i.e. the proportion of companies and businesses that actually contribute to the costs of adaptation), or merely the financing.
Figure 4: A simple example of the financing, funding, and delivery of adaptation for coastal protection. Source: Watkiss and England. 2025.
The role of public and private sectors
In recent years, there have been substantial efforts to better understand the factors which can inform whether such activities should be funded by the private or public sectors. These include whether the costs and benefits of activities are public or private as well as the level of financial returns they offer. These can be none/limited (and are therefore typically public), below-market or market level returns (OECD, 2023). The level of market returns for many adaptation options have been classified in Table 3, and these have been reviewed and updated to be relevant to the sectors in scope of this study:
Table 3 – Adaptation activities and potential returns in developed countries for the sectors explored in the study. Updated from Watkiss and England, 2025 and OECD, 2023.
Building on this approach, UNEP (2025) outline a useful typology (adapted into Figure 5) for understanding where public and private actors are best placed to act, based on the combination of level of returns and whether the costs and benefits are public, private or joint. These can be used to help classify a broad range of activities which are funded by either the public sector, private sector, or a mix of both.
Type A actions are public goods, such as major flood protection schemes, that generate little or no financial return and are therefore typically initiated and funded by government. Type B actions involve a mix of public and private costs and benefits, and where returns are typically below market. For example, supporting climate-smart agriculture. These typically involve blended finance arrangements. Type C actions sit within existing well-functioning markets and generate commercial returns, such as industrial cooling systems, and would be expected to be entirely privately financed and funded.
Figure 5: Simplified categorisation of adaptation types (A-C) and opportunities for private sector engagement. Adapted from UNEP (2025).
Barriers to adaptation finance
Private sector investment in climate adaptation remains persistently low, despite adaptation often delivering high economic returns for society (World Bank, 2024).
The core problem is that while the societal benefits of adaptation can be substantial, the financial returns that matter to private investors are much lower. Adaptation frequently reduces losses or damages and generates limited revenues, making it difficult to construct a viable business case for private finance. This is especially the case, given the opportunity cost of capital, and difficulties of modelling climate-related disruption in cashflows and returns (Watkiss and England, 2025). There are also issues of discounting, where costs arise today, but benefits occur far in the future and are therefore higher. The private sector also uses higher discount rates than the 3% in the public sector (HM Treasury, 2026), compounding this issue.
Many studies reporting high benefit-to-cost ratios for adaptation are measuring economic or societal returns, which include non-market benefits such as environmental value. Private investors, however, assess financial returns, incremental revenues and cash flows, which are considerably lower. This distinction is frequently misunderstood and leads to unrealistic expectations about the role private finance can play (Watkiss and England, 2025).
Watkiss and England (2025) identify five main categories of barrier to adaptation finance:
Information barriers, including insufficient data on climate risks and limited investor understanding of adaptation as an asset class.
Market failures, including public good characteristics and underdeveloped adaptation markets.
Behavioural barriers, including low perceived urgency and limited willingness to pay for risk reduction.
Policy and governance barriers, including weak or conflicting regulation and poor cross-sector coordination.
Financial and bankability barriers, including long payback periods, small project sizes, high complexity, and limited replicability.
Scaling private investment into publicly identified adaptation priorities remains a significant challenge, particularly for smaller, fragmented projects involving many actors and beneficiaries.
Boosting private sector opportunities
Globally, current private sector contributions to climate adaptation are very small (approximately 3% of total needs). Even with substantial innovation and concerted effort, the private sector is expected to deliver only around 15% of required adaptation by 2035, with even less in least developed countries and small island developing states (Watkiss & England, 2025). However, this varies significantly based on country and sector structure. Recent analysis of the UK’s third National Adaptation Plan finds much higher numbers, suggesting around 45% of total adaptation costs are borne by private households and businesses (Watkiss et al., 2026a), in part driven by the privatised nature of the water sector in England. As Scottish Water is publicly owned, the equivalent figure for Scotland is likely to be lower, with a greater share of adaptation costs falling to the public sector.
As a result, climate adaptation is currently funded predominantly by the public sector, both globally and within the Scotland. Central and local government fund most adaptation-relevant expenditure across transport, flood management, water infrastructure, agriculture and the natural environment, largely through existing budget lines that deliver multiple objectives alongside adaptation, climate-proofing, or pure adaptation investment (e.g. for flood protection). Across all sectors, households and businesses also bear some adaptation costs directly. For example, through property level insurance or on-farm investments. However, this remains modest.
Crucially, scaling up private sector participation will not happen through market forces alone. It will require concerted public policy action, enabling conditions, and in many cases public co-financing to de-risk private investment. The private sector’s role is therefore best understood as being complementary to, rather than a substitute for, public adaptation finance (Watkiss and England, 2025).
Governments can adjust the financial characteristics of adaptation activities to increase private sector participation, either at the market level or at the level of individual investments. At the market level, this can include improving existing markets (e.g. through better provision of climate risk information), creating new markets (e.g. through water credits), or supporting public provision where markets fail (Greenhill et al., 2026). At the level of individual investments, policy and regulation or blended finance arrangements can be used to alter financial characteristics and improve commercial viability (World Bank, 2019; Watkiss and Ward, 2025). Where neither approach is sufficient, there remains scope to diversify the range of public financing sources and instruments. This is illustrated in the decision tree in Appendix A.
Climate justice considerations
Another significant consideration within the costs of adaptation are the distributional aspects, and the need for a “just resilience”. The CCC report to Scottish Government on climate adaptation and just transition in 2022 highlighted that fairness in adaptation is strongly linked to just transition concepts, and it is crucial to consider distributional effects to ensure effective and fair adaptation (CCC, 2022). Several characteristics that lead to increased vulnerability and reduced adaptive capacity to climate risk were identified, and include low-income groups, the very young and the elderly, and those in rural regions. The CCC recommended that policy to help address adverse distributional impacts should be routed in an understanding of the distributional effects of climate risks and opportunities.
While climate risks are unevenly distributed and demand equitable responses (European Environment Agency, 2025), they also involve costs. Such costs can be explored from several perspectives. A simplified set of approaches is shown in Table 4, ranging from most targeted to those most socialised, though in reality the approach may be context specific.
Table 4: Indicative approaches to guide who should pay for adaptation: Adapted from Paul Watkiss Associates.
Approach
Description and examples
Justification
Costs borne by those at risk
Those directly exposed to risks bear the costs of adaptation (e.g. PFR)
Beneficiaries should pay costs
Costs socialised amongst users
Investment in water / rail networks for adaptation through water bills and ticket sales
Efficiency, user pays
Maximise social welfare – prioritise dense population
Use of Cost-Benefit analysis to maximise (e.g. flood defences in England)
Social welfare, cost effectiveness
Costs socialised across society
Adaptation of nature and biodiversity, flood protection
Public goods, fairness or equity
Adaptation responsibility based on historic and current emissions
Highest emitters pay for adaptation (e.g. Green Climate Fund, Adaptation Fund)
Adaptation costs driven by historic emissions / most wealthy
The CCC recommended that policy to help address adverse distributional impacts should be rooted in an understanding of the distributional effects of climate risks and opportunities.
Early work underway globally is considering some of the principles behind the costs of adaptation. The Government of New Zealand (2025), set out some early principles in its National Adaptation Framework such as ensuring pre-and post-climate event costs are shared across society and over time, and that the public sector is used to incentivise private sector action, and to take market-based approaches that adjust over time. While beyond the scope of this report, it is noted that such considerations may have the potential to significantly vary relative distribution of costs.
Knowledge gaps and challenges
Evidence gaps in Scotland’s adaptation investment landscape
It is important to note here that adaptation investment, globally, is poorly understood, and many countries are, like Scotland, working to quantify their national adaptation investment needs. Scotland faces multiple knowledge gaps around climate adaptation investment. These include:
No clear understanding of the total investment required across sectors, including whether this will involve millions or billions of pounds, or how this spending will be distributed with time.
No detailed picture of what climate adaptation investment could deliver for different sectors.
No specific, measurable, achievable, relevant and time-bound (SMART) adaptation objectives under SNAP3.
No assessment of associated costs of not adapting, and/or expected residual damages.
No budget allocation for each SNAP3 objective.
These knowledge gaps make it difficult to determine whether a financing gap exists or how large that gap might be in Scotland.
Broader knowledge gaps in Scotland and beyond include:
Lack of robust estimates of the wider returns from adaptation investment, including avoided climate damages, economic benefits, and broader social and environmental gains that comprise the ‘triple dividend’ of adaptation.
Limited research exploring opportunities for blended public-private funding partnerships to support climate change adaptation spending.
Further research on these broader topics is key to ensuring and prioritising just and equitable climate adaptation solutions in Scotland.
Box 1: Challenges and limitations
Estimating Scotland’s climate adaptation investment need is inherently challenging. This work provides an initial method, approach, and set of assumptions to estimate climate adaptation spending across sectors. It is intended as a first step that will require further development. The figures presented should therefore be treated as indicative, order of magnitude estimates rather than precise calculations. Readers and peers are encouraged to build on this analysis by adding new assumptions, incorporating additional sub-sectors or hazards, or testing alternative scenarios and risk-tolerance thresholds.
The key data limitations and challenges underlying these estimates include:
Baseline spending: Incomplete information on current adaptation expenditure across Scotland makes it difficult to establish a reliable baseline from which to measure progress or scale up investment.
Asset vulnerability: Comprehensive inventories of climate-vulnerable assets are lacking in most sectors, and there is limited understanding of how vulnerability will evolve as the climate changes.
Climate and socio-economic uncertainty: Projections of how Scotland’s climate will change over the coming decades remain uncertain, as does the evolution of the broader socio-economic and political landscape.
Risk tolerance: Without clearly defined government risk tolerance thresholds or adaptation objectives for each sector, it is difficult to establish an ‘end goal’ against which investment needs can be scaled.
Scope limitations: The analysis focuses on selected sub-sectors and key hazards; many relevant adaptation actions and climate risks across Scotland’s wider economy are not included.
Methodological assumptions: Estimates rely on assumptions regarding appropriate adaptation objectives for 2040 and whether spending continues at current levels or scales up in line with growing climate risks.
Study methods
Our approach
Scotland faces similar challenges in estimating climate adaptation investment need to those across Europe, and the fragmented data landscape means no single method could be applied consistently across all sectors. The study therefore adopted a pragmatic, multi-stage and multi-method approach:
estimating adaptation costs for each sector using the most appropriate costing method given available evidence;
feeding these into a macroeconomic model to explore the economic impacts of different financing routes;
mapping current governance arrangements to understand how adaptation is being paid for today; and,
exploring the potential to increase private sector participation.
Due to resource and data limitations, the three analyses were conducted separately, with differing underlying assumptions. The cost estimates, macroeconomic modelling, and funding analysis are therefore not directly comparable with one another. Each is intended as a broad exploratory assessment, and further integrated analysis would be needed to draw firm conclusions across all three components.
Throughout, developing robust estimates also required identifying which SNAP3 targets and objectives are relevant to each sector and considering wider socio-economic context beyond climate risk alone. The detailed steps are shown below.
Step 1: Adaptation costing
Adaptation objective setting
We adopted 14 of the 23 objectives set out in SNAP3 (Scottish Government, 2024a). The selected objectives covered four of the five broader SNAP3 outcome areas identified by the Scottish Government: Public Services (PS), Economy, Business & Industry (B), Nature Connects (NC), and Communities (C) (Scottish Government, 2024a). Objectives relevant to the fifth SNAP3 outcome area, Connected and Engaged Society (CE), were not included in the scope of this analysis. The specific sectors, objectives and corresponding outcome explored within our analysis area are summarised in Table 5.
Table 5: Climate change adaptation outcome area and objectives from SNAP3 that align with the five sectors considered in our work were selected and, where relevant, amended. Sectors not explored – due to resource constraints – are crossed through in the objectives below.
Sector
SNAP3 outcome area and objectives
Agriculture
B2: Farming, forestry, fishing, and aquaculture businesses are supported to adapt production and operations in a way that benefits livelihoods, resilience, and the economy in a changing climate.
Communities
C1: Regional collaborations are driving inclusive, effective and place-based adaptation across all of Scotland.
C2: Communities and individuals are supported, informed, and able to take locally led adaptation action, supporting local priorities and resilient, healthy, and equitable places.
C3: Communities and individuals are able to prepare for, respond to and recover from emergencies in a way that builds future climate resilience, complements the work of emergency responders and protects those with vulnerabilities to multiple risks.
C4: New buildings are designed for a future climate, and opportunities for adaptation in existing buildings are taken during maintenance or retrofit.
C6: Coastal communities are preparing for and adapting to coastal erosion and sea level rise.
PS2: People can access the public services they need, and critical assets, systems and networks are resilient to the impacts of the changing climate.
Natural environment
B2:Farming, forestry, fishing, and aquaculture businesses are supported to adapt production and operations in a way that benefits livelihoods, resilience, and the economy in a changing climate.
Nature-based solutions are protected and enhanced to enable healthier, cooler, water resilient and nature-rich places.
NC1: Landscape scale solutions are implemented for sustainable and collaborative land use including protecting and enhancing Scotland’s soils.
NC3: Development planning (including Local Development Plans and associated delivery programmes) takes current and future climate risks into account and is a key lever in enabling places to adapt.
NC4: Nature networks across every local authority area are improving ecological connectivity and climate resilience, alongside other transformative national actions to halt biodiversity loss by 2030.
NC6: Resilient natural carbon stores and sinks (such as peatland, forests and blue carbon) are supporting Scotland’s net zero pathway, alongside timber production, biodiversity gains, flood resilience and the priorities of local communities.
Transport
PS4: The transport system (trunk roads, rail, aviation, ferries, ports and canals) is prepared for current and future impacts of climate change and is safe for all users, reliable for everyday journeys and resilient to weather-related disruption.
PS2: People can access the public services they need, and critical assets, systems and networks are resilient to the impacts of the changing climate.
Water
PS2: People can access the public services they need, and critical assets, systems and networks are resilient to the impacts of the changing climate.
PS3: Partnerships for water resource planning and rainwater drainage networks are active in prioritised catchments to support climate resilient places and drought and flooding resilience.
The sectors and sub-sectors included in our study are defined as follows:
Table 6 Sectors and sub-sectors explored within this analysis
Sector
Sub-sector
Agriculture
N/A.
Communities
Flood protection schemes.
Property flood resilience.
Wider capacity building.
Natural environment
Woodland creation.
Peatland restoration.
Nature restoration.
Transport
Trunk roads and motorways.
Rail network.
Water
Scottish Water – water and wastewater services
Note that, due to resource constraints, a range of other key sectors – for example, energy, telecommunications, and health – have not been explored in this report. Furthermore, even within the sectors we have examined, we have not conducted full sectoral analyses. For example, within transport, adapting ferries, aviation, and canals was not included in the analysis due to resource constraints. Consequently, the results should be interpreted accordingly.
Context setting
To estimate the uplift or scaling factors for adaptation investment needs to 2040, we considered how wider socio‑economic conditions, such as population change, economic growth and sectoral investment trends, might evolve over time. These factors can be important. For example, estimating future flood defence needs can require assumptions about future population distribution, while economic growth and inflation trajectories influence both the cost of adaptation measures and the scale of potential economic losses.
In practice, this broader socioeconomic context was only relevant to a limited part of our analysis. Most estimates relied on sector specific data and updated risk information – such as SEPA’s revised flood risk mapping or current housing stock – rather than the national socioeconomic scenarios developed for CCRA3. As a result, although we originally intended to use the central CCRA3 socioeconomic scenarios to inform investment scaling, these were largely not required in the final workflow.
If needed for future updates, this contextual information can be revisited, but for the purposes of this assessment it played only a minor supporting role.
Apportioning adaptation spend
Following the MDB taxonomy introduced in Section 2.2, this study applied different cost attribution approaches across the five sectors depending on the type of adaptation investment and available evidence. The specific methods used for each sector are detailed below and further elaborated in the sector-specific analyses (Section 4).
Climate-Proofing (Incremental Costs)
For infrastructure investments where adaptation is integrated into planned programmes but not the primary objective, we estimated incremental costs above baseline investment, for example:
Transport (trunk roads and motorways): We applied relevant climate-proofing uplifts from the literature to Scottish Government 2026/27 budget lines for road maintenance and renewal. These uplifts reflect the additional investment required to design infrastructure for future climate conditions rather than historical baselines. For example, upgraded drainage capacity to handle more intense rainfall, enhanced slope stabilisation for increased landslide risk, or heat-resistant surfacing materials. The baseline represents the investment that would proceed regardless of climate change; the uplift captures the incremental adaptation cost.
Mixed Objectives (Apportioned Costs)
For investments delivering multiple benefits including adaptation, we apportioned costs based on expert judgment in consultation with Paul Watkiss Associates, who have extensive experience applying the MDB taxonomy internationally. For example:
Woodland creation: Forestry investment delivers multiple benefits including timber production, carbon sequestration (mitigation), biodiversity, recreation, and climate adaptation (ecosystem resilience, water regulation, reducing downstream flood risk). We reviewed stated objectives in Scottish Government forestry programmes and applied expert judgment from Paul Watkiss Associates, aligned with on-going UK level adaptation investment need research, to determine what proportion of woodland creation costs should be attributed to adaptation.
Peatland restoration: Peatland restoration similarly delivers carbon sequestration, biodiversity recovery, water quality improvements, and adaptation benefits (enhanced water storage and flow regulation reducing flood peaks, maintaining ecosystem function under climate stress). We assessed the relative emphasis on these objectives in Scotland’s peatland restoration programmes and apportioned costs, accordingly. These apportionments were cross-checked through expert review with Paul Watkiss Associates.
Nature restoration: We applied similar logic to wider nature restoration funding, examining whether investments prioritise climate resilience objectives (e.g., creating ecological corridors to enable species migration under climate change, restoring coastal habitats for natural flood defence) or primarily target biodiversity and ecosystem health goals, and attributed costs proportionally.
Different analysts might reasonably apply different attribution percentages to the same mixed-objective investments, as there is no objectively correct answer to how investment should be apportioned across multiple objectives, including the distinction between climate adaptation and mitigation. The percentages applied in this study are therefore documented transparently in the sector-specific analyses (Section 4) and supplementary data.
Targeted adaptation (pure adaptation)
For dedicated adaptation investments where climate risk reduction is the primary or sole objective, we counted total programme costs:
Flood protection schemes: We examined historic budget allocations from Scottish Government expenditure data and uplifted these to current construction prices using appropriate indices. Estimates drew on SEPA’s updated flood risk mapping and UK-wide research on flood defence costs, scaled to Scotland’s exposure and asset base.
Property-level flood resilience (PFR): We scaled recent UK research on PFR costs and uptake rates in proportion to Scotland’s residential and non-residential building stock at flood risk, using SEPA flood risk data to estimate the exposed population.
Capacity building (communities): We engaged with Scottish Government policy teams to identify planned and potential future investment in community-level adaptation capacity, resilience planning, and climate literacy programmes where adaptation is the primary objective.
Sector-specific considerations
A pragmatic, multi method strategy was adopted that used the most appropriate costing approach for each sector, determined by data availability and evidence maturity. The core approaches drawn upon were:
Drawing on existing sectoral analysis of initial adaptation investment estimates for specific plausible future scenarios (e.g., water and rail).
Applying relevant climate proofing uplifts from the literature to relevant Scottish Government 2026/27 budget lines (Scottish Government 2026b), reflecting changing climate risks (e.g., trunk roads and motorways).
For each plan or budget line, including the Scottish Government Draft Climate Change Plan (CCP) (2025) and the Scottish Government 2026/27 budget (Scottish Government, 2026b), the multiple objectives were examined to identify the proportion of investment directly related to adaptation (e.g., agriculture, woodland creation, peatland restoration, and nature restoration).
Examining and uplifting historic budget allocations to current construction index prices (e.g., flood protection schemes).
Drawing on wider UK research and scaling estimates in proportion to Scotland’s building stock or relevant assets (e.g., flood-protection schemes and property level flood resilience).
Engaging with Scottish Government policy teams to discuss likely investment changes for spending with adaptation relevance (capacity building within communities).
Applying value transfer methods by exploring how adaptation cost estimates compare when scaled to the Scottish context, drawing on Neumann et al. (2025) as an international benchmark for agriculture and transport infrastructure, and on UK Government (2025) analysis for flood protection schemes.
Undertaking expert review to cross-check estimates against parallel analysis being undertaken for the Climate Change Committee’s Well Adapted UK report, due for publication in Spring 2026.
For further detail on methodological approach used, please see the sector-specific analyses, the appendices B and C (for additional information on Network Rail Scotland and Scottish Water’s analysis respectively), and supplementary data.
Step 2: Estimating macro-economic effects of spending
Macro-economic effects
Fully modelling the costs and benefits of adaptation, including all potential avoided damages, productivity improvements, health gains, and environmental co-benefits, is extremely resource intensive and was beyond the scope of this project. Instead, the Centre for Energy Policy at the University of Strathclyde used a Computable General Equilibrium (CGE) model of the Scottish economy to explore one deliberately narrow but important question: what are the direct economic effects of additional climate adaptation investment in Scotland, and what economic activity does this spending stimulate?
CGE models are widely used by governments and research institutions, including HM Treasury and the Scottish Government, to understand how changes in one part of the economy ripple through the rest. For this study, a model was used that represents the Scottish economy across 30 broad sectors and is built on Scottish Government Input-Output tables from 2019, chosen to reflect the structure of the economy before the disruptions of Covid-19 and the war in Ukraine. The model traces how adaptation spending affects prices, production, employment, and incomes across sectors, and how these effects in turn influence government revenues and public finances. It also accounts for how wages and employment interact. It allows for migration in and out of Scotland depending on relative economic conditions. Finally, it divides households into five income groups to understand how different parts of society might be affected.
For this research, we assumed that climate change adaptation is a form of capital spending that does not create additional production capital for production sectors. Instead, it allows them to maintain the same production capacity, which would be at risk in the face of climate change.
Understanding the modelling approach: spending and cost recovery
To make the modelling approach clearer, it is helpful to think of adaptation in two phases:
Phase 1: Sectoral spending for climate adaptation measures In Phase 1 the scope of the work is to model how the spending flows through the Scottish supply chains. We model how the sector makes additional purchases of goods and services to deliver adaptation measures (for example, construction materials, engineering services, flood defences, or restoration work). This spending initially flows through Scottish supply chains, creating economic activity in the sectors that deliver the work and in households that benefit from the associated wages and employment.
Phase 2: Cost recovery Over time, the sectors and/or government need to recover the costs of adaptation. Each sector may have a different cost recovery approach, depending on its business models and economic structure. We modelled three stylised approaches to illustrate the broad channels through which different funding choices affect the economy:
(1) “Government pays, funded through income tax” (used for Communities, Rail and Trunk roads) may have the following implications:
Income tax rates rise to cover adaptation costs.
Household disposable incomes fall, especially for higher earners.
Consumer spending is dampened across society.
This approach is typically progressive, as those earning more pay a larger share.
Government spending in other areas (health, education, etc.) is preserved.
(2) “Government pays, funded through government spending cuts” (used for Natural environment) may have the following implications:
Public spending declines towards all sectors to cover adaptation costs.
Public administration/defence, education, and tertiary sectors suffer most.
This approach tends to be mixed.
(3) “Industry pays, funded through higher prices” (used for Agriculture and Water) may have the following implications:
The adapting sector faces a cost they have to cover, which firms pass on to consumers through higher prices.
Higher prices reduce export competitiveness (assuming similar price increases are not also happening abroad), which reduces demand for Scottish goods.
This approach tends to be regressive, as lower-income households spend a relatively larger share of their budgets on essential goods and services.
Important caveats All approaches are highly stylised and are used to illustrate the broad economic channels and trade-offs that different funding choices create. In reality, adaptation funding is likely to involve a blend of government and industry contributions, as well as other mechanisms such as borrowing, grants, or targeted levies. The scenarios presented here should be treated as illustrative, helping to understand the direction and scale of potential impacts rather than precise forecasts.
More detail on the methodological approach and more detailed analysis of selected sectors can be found in Appendix D.
Note: The macroeconomic modelling cannot be taken as an assessment of the costs and benefits of adaptation. While the modelling captures the direct economic stimulus of adaptation spending and the effects of cost recovery, it does not model residual damages. Neither does it quantify the full range of avoided climate damages, increased resilience, reduced disruption to businesses and households, improved business continuity, health gains, long-term productivity benefits, or environmental co-benefits that underpin the wider “triple dividend” of adaptation. The results should therefore be interpreted as a conservative and partial estimate, representing only one dimension of the economic effects – the demand-side impacts of the spending and its financing – rather than the full spectrum of costs and benefits of adaptation.
Steps 3 and 4: Estimating current and future private sector contributions
In each of the sectors represented in the report, there are existing models which are being used to cover the costs of adaptation today. To explore the current and future potential splits, the project documented the broad governance models of each sector today. We then carried out a qualitative evaluation of the potential use of blended finance, regulation and policy and innovative models. We note that these vary significantly based on the broad structure of the sector, and appetite for change.
Our focus has been on the theoretical potential to increase private sector contributions (noting that this may not be ultimately desirable). This is based on the need to prioritise public sector expenditure on those areas which cannot be met by private sector or households directly. The range of models explored includes:
Innovative models using private finance to provide upfront capital
Models which increase private sector funding for adaptation
Provision of adaptation goods and services (which ultimately reduce costs for public and private sector activities
To identify potential innovations, we drew on the Paul Watkiss Associate database of innovative accelerators (England et al., 2023; United Nations Environment Programme, 2024), as well as recent wider work exploring financing options (Watkiss and England, 2025). Further supplemental models were identified through desk-based searches during this project. We undertook a rapid review and used expert judgement to extract innovative approaches that they felt were potentially relevant in a Scottish context.
Due to the limited resources available for the project, the review has inevitably been ‘light touch’ but serves as the basis for further exploration and discussion to inform the development of SNAP4, as well as the future business models of public bodies such as Scottish Water or Network Rail.
Prices
All prices in the report are presented in 2026/27 prices. For the period 2025/26 to 2026/27, a nominal growth rate of 2% per annum has been applied, consistent with the Bank of England’s long-run inflation target. See the supplementary data for further detail.
Sector-specific analysis
The results derived are detailed below. For each sector – agriculture, communities (flooding), transport, water and natural environment – we highlight (1) key risks and adaptation opportunities, (2) information regarding current investment in climate adaptation, (3) the estimates of adaptation investment need, (4) the wider (co)-benefits of such spend, (5) the current governance, and (6) funding and financing arrangements.
Agriculture
Key climate risks and adaptation opportunities
Agriculture in Scotland faces a complex and intensifying range of climate-driven pressures. More frequent extreme rainfall events are already causing excess waterlogging, which has been shown to be a greater current risk to wheat yields than heat or water stress (risk N6 in CCRA3). Hotter, drier summers are reducing the suitability of high-quality arable land due to drought risk. The 2018 drought illustrated how quickly these pressures cascade through supply chains, with reduced malt barley yields and distilleries halting production due to low river flows. Fluvial flooding on major river catchments such as the Tay and Tweed continue to damage agricultural land, and projections suggest the area of Scotland’s best-quality farmland at risk from flooding could rise by over 30% by the 2080s under a +2°C scenario. Warmer conditions are also driving increases in pests, pathogens and invasive species (CCRA3 risk N7), from potato blight and cyst nematodes to Bluetongue virus, posing escalating threats to crops, livestock and soil health (Sniffer, 2021). Together, these pressures are expected to push agricultural climate risk, as stated in the CCRA3, from medium to high in the coming decades (Sniffer, 2021).
Addressing these risks requires an integrated, forward-looking approach to land-use planning and farm management. Key priorities identified by CCRA3 (2021) include updated land capability assessments using UKCP18 data to guide decisions on where agricultural systems remain viable, alongside improved skills and knowledge exchange, crop diversification, and better soil and water management. Expanded pest and disease monitoring, stronger biosecurity, and wider uptake of integrated pest management are also highlighted, as is the need to align adaptation with net zero strategies to avoid introducing new vulnerabilities. Stronger research, improved coordination between government and land managers, and a more strategic cross-sector approach will be essential to safeguard Scotland’s long-term agricultural productivity as climate pressures intensify (Sniffer, 2021).
Current spending and context
It is not possible to outline how much capital the Scottish Government currently allocates specifically toward climate adaptation of agriculture. This is because climate adaptation investment is currently folded into budget lines with multiple other objectives such as emissions reductions, increased biodiversity and wider farm support. However, the Scottish Government 2026/27 Climate Taxonomy highlights that £221m worth of allocated budget within agriculture have a positive impact on adaptation. Similarly, to our knowledge, there is no available evidence on private sector investment for adaptation of agriculture within Scotland.
Adaptation investment need
Budget lines from the Scottish Government’s 2026/27 Climate Taxonomy with a positive impact on adaptation were used as the primary basis for estimating mixed-objective investment need for agriculture (Table 7). Spending was assumed to continue in nominal terms to 2040, with no uplift applied for increasing climate risk over the period. It should also be noted that some budget lines with positive adaptation impacts may not have been captured, for example, the Farm Advisory Service and Knowledge Transfer and Innovation Service sits under ‘Business Development’ in the Scottish Budget and has not been included, despite likely supporting adaptation through improved uptake of resilient practices.
It is important to note that these budget lines deliver multiple benefits alongside adaptation, including climate mitigation, soil health improvements, biodiversity gains, and wider farm business productivity. Disentangling the proportion of each line attributable specifically to adaptation is particularly challenging in agriculture, where weather and climate resilience – and therefore adaptation – are integral to sectoral success. For this reason, no specific proportion of any budget line was allocated to adaptation in isolation; instead, the whole budget line was included. Estimated costs should therefore be understood as representing a bundle of co-benefits of which adaptation is one component.
Table 7: Budget lines from the Scottish Government Climate Taxonomy 2026/27 that were included in adaptation investment need analysis for agriculture, and associated adaptation rating (Positive – High or Positive – Low) which represents the likely impact (and extent of impact) of the budget line on adaptation, e.g. ‘Positive – High’ is a positive impact that is likely to be highly beneficial.
Budget lines included in analysis
2026/27 budget (£m)
Adaptation rating
Pillar 1 – Greening Payments
£142m
Positive – High
Agricultural Modernisation Fund
£26m
Positive – Low
Scottish Rural Network
£0.87m
Positive – Low
Agri Environmental Measures Resources
£21m
Positive – High
Agri Environmental Measures Capital
£4.7m
Positive – High
Public Good Advice
£2m
Positive – Low
Veterinary Grants
£0.8m
Positive – Low
Animal Diseases
£23.5m
Positive – Low
Table 8 outlines our estimate of mixed objective investment need – including adaptation – for agriculture. This estimate ranges from £168m/yr for budget lines associated with a high positive impact on adaptation to £221m/yr where budget lines with a low positive impact on adaptation are also included.
We cannot give an estimate of adaptation investment need for agriculture in isolation. However, if the current level of spend is maintained out to 2040, total investment in budget lines associated with a positive impact on adaptation in agriculture would amount to between £2,347m – £3,091m, or equivalent to £167.6m – £221m per year over the period 2026–2040 (Table 8).
Table 8: Lower and upper estimates of the mixed-objective investment need (including climate adaptation) for agriculture, based on budget lines in the Climate Taxonomy 2026/27 with a positive impact on adaptation. Values are in 2026/27 prices.
Lower estimate
Upper estimate
Cost p.a. (£m/yr)
Total up to 2039/40 (£m)
Cost p.a. (£m/yr)
Total up to 2039/40 (£m)
£167.6m/yr
£2,347m
£221m/yr
£3,091m
These estimates were triangulated by scaling adaptation cost estimates from Neumann et al. (2025) to the Scottish context as an international benchmark. Neumann et al. (2025) estimated EU agricultural adaptation costs at approximately 0.04% – 0.06% of GDP per year under moderate to high emissions scenarios. Applying this range to Scotland’s GDP yields an indicative figure of £90m – 142m/yr (2026/27 prices). Scotland’s agricultural GVA (approximately £2.2bn, around 1% of GDP) is broadly comparable to the EU average (approximately 1.2% of EU GDP), supporting the plausibility of this transfer as a cross-check (Scottish Government, 2025c; Eurostat, 2026). However, this comparison should be treated with caution: the nature and projected intensification of climate hazards vary considerably across EU member states and diverges from Scotland’s risk profile in important respects. These figures were therefore used as an indicative benchmark to assess how our estimates compare at an international level, and are not included in our reported adaptation investment need figures.
We also conducted separate exploratory research to highlight the challenges and opportunities of using bottom-up analysis to cost climate change adaptation investment need for specific agriculture actions (see Case study 1).
Case study 1: Exploratory bottom-up analysis of agricultural adaptation actions
While budget tagging reveals how much is being spent, it does not indicate what this delivers for climate resilience or whether current levels are sufficient. As an exploratory supplement to the primary budget-line estimates, indicative cost estimates were developed for 33 adaptation actions identified in a Scottish Government RESAS report, to showcase how investment need estimates could iteratively improve to become asset- and action-based going forward. This analysis should be regarded as a proof-of-concept; further data collection and expert elicitation would be needed to improve future estimates and develop associated adaptation pathways.
Costs were sourced from academic and grey literature, with confidence ratings assigned to each source, and scaled to Scotland’s agricultural land area using land-use archetypes from the CCC’s Rural Land Use Types report (Thomson et al., 2025). Complete scaled cost estimates were produced for 19 of the 33 actions. Where data permitted, an exploratory cost-benefit analysis was undertaken for selected actions, including diversified crop rotations, examining potential impacts on yields, soil erosion, and fertiliser use.
The exploratory CBA for diversified crop rotations suggests potential monetised benefits totalling £856m–1.1bn between 2026 and 2040 for reduced soil erosion, increased crop yields and reduced fertiliser usage. Relative to an estimated total action cost of £3.5bn, this represents 25–31% of the potential investment directly benefiting agricultural productivity. Furthermore, other public good benefits not explored from diversified crop rotations could include other benefits such as increased biodiversity and improved water retention that were not explored here.
These figures assume each action is applied across all eligible land, which is an over estimation. Further information on the results, assumptions made, confidence ratings, and recommended further research steps are provided in Appendix E and the supplementary data.
Macroeconomic effects and wider impacts
Macro-economic impacts
We assumed the agriculture sector requires approximately £2.3bn of adaptation investment between 2026 and 2040, around £150m/yr (based on rounding down the analysis in Section 4.1.3). This spending is distributed across construction, the agriculture sector itself, all other manufacturing, and wholesale/retail (vehicles).
Without cost recovery (a modelling device to isolate the spending effect): The programme generates GDP and employment gains during the spending period, with around 80% concentrated in the sectors directly delivering the works – construction, all other manufacturing, wholesale/retail (vehicles), and agriculture itself. Positive spillovers reach consumer services as household incomes rise. Employment and GDP impacts track each other closely because the agriculture adaptation supply chain involves relatively capital-intensive activities such as specialised equipment and infrastructure. As with other sectors, these benefits fade after spending concludes.
With “industry pays” cost recovery (a stylised scenario): When farmers bear adaptation costs and pass them to consumers via higher food prices, the effects are regressive. By 2040, the lowest-income households face price increases of 0.09%, compared with 0.07% for the highest-income households, because food represents a much larger share of poor households’ budgets. Higher food prices erode real incomes and household consumption across all income groups, while reduced export competitiveness further dampens GDP and employment. Because agriculture is one of Scotland’s most labour-intensive sectors – employing 8.5 workers per £1m of output, well above the economy-wide average of 6.6 – the concentrated negative impacts trigger significant job losses that spill across the wider economy. Scotland’s labour mobility means workers leave rather than accept wage cuts, prolonging the employment losses.
Policy implications: An “industry pays” approach financed through higher food prices risks regressive impacts on low-income households and substantial employment losses. While adaptation spending itself stimulates construction and manufacturing, the method of cost recovery determines whether these gains are preserved or eroded, and which parts of society bear the burden.
Current governance, funding and financing arrangements
Agriculture is a market sector but is heavily supported by the public sector (Figure 6). See Appendix F for further information on how this support is planned to change.
A key challenge in the agriculture sector is disentangling the adaptation costs from the other objectives, as the sector involves a mix of activities. There are some dedicated adaptation activities, but other agri-environment objectives include actions to improve productivity, with private costs and benefits, but supported by public activities. Furthermore, it is also challenging to differentiate adaptation actions from wider activities to boost yields or achieve other objectives.
Therefore, rather than looking at activities, the study took an alternative approach which explored the relative income sources for farms. Scottish Government produces estimates on the annual income from farms, including their makeup (Scottish Government, 2025d) shown in Appendix F. These show that agricultural activity in Scotland is typically lossmaking, except for dairy and general cropping, and that agricultural support payments make up a significant share of all farm income. The survey excludes sectors which do not receive support, such as pigs, poultry and horticulture.
The results suggest that loss-making farms may struggle to invest in adaptation measures and that the majority of the ability to invest in adaptation is likely to come through support payment income. We assume that adaptation action is mainstreamed into general agricultural support.
To derive estimates of private sector contribution we started by assuming that for farm types where agriculture is not profitable, all agricultural adaptation is paid for by the public sector. For those sectors where agricultural income is profitable, we assume 50% co-investment, assuming farmers can contribute to those areas which support adaptation. For those sectors excluded for support payments, we assume adaptation costs are 100% private. These assumptions were then applied to output of holdings by farm type from the 2025 Scottish Agricultural Survey. The results suggests that 33% of investment in adaptation is likely to be from the private sector. However, given the overlap with many other objectives and activities (including flood management), the uncertainty on the types of interventions and how they vary by farm type, as well as the fact that many of the grant schemes require co-investment from farmers. the confidence in such apportionment is low.
Figure 6 Financing, funding, and delivery arrangements for adaptation in agriculture.
Innovation that could boost private sector participation
Agriculture is one of the sectors where there is the greatest amount of innovation. There are a range of opportunities to leverage private finance for agriculture adaptation – especially as part of the wider agricultural reform programme. In general, blended finance offers a significant opportunity to incentivise further opportunities for investment in adaptation. For example, it can mainstream adaptation into loan requirements for agricultural investment, or support investment in dedicated adaptation activities. In Scotland, elements of nature restoration on farmland could be financed through biodiversity credits. Blended public-private models such as the Scottish Government £1m Agritourism Investment Scheme – offering grants of up to £50,000 covering 40% of eligible capital costs – can support farm diversification and rural resilience (Savills, 2026).
These can also be complemented by other models which support investment, including from suppliers interested in value chain resilience, or using offtaker agreements.
There are also specific models for investment that target particular activities or parts of the supply chain. For example, use of Public Private Partnership (PPPs) for climate resilient seeds, or the use of digital platforms to provide weather and advisory services) to support farm activities. In addition, parametric insurance offers faster, more transparent cover for systemic risks including drought, flooding, frost and yield shortfalls. It pays out automatically when pre-agreed environmental thresholds are met, rather than requiring loss assessment (Descartes, 2026). Parameters must be carefully designed to avoid leaving farmers exposed to events that fall outside agreed trigger conditions.
Shared rural infrastructure offers a further avenue for cost-effective private investment. Co-operative models – for example, shared grain stores and drying equipment – spread capital costs across multiple businesses while building collective resilience to weather-related yield losses. Similarly, investment in commercial deer carcass processing infrastructure, including improved Approved Game Handling Establishments (AGHEs), could support the economic viability of deer management, which delivers biodiversity, habitat restoration, and natural flood risk management benefits alongside commercial returns. Where shared infrastructure generates both adaptation outcomes and commercial revenues across multiple beneficiaries, blended public-private financing is well suited and could be supported through existing rural development funding mechanisms (World Bank, 2019).
Finally, there are newer and more experimental models being developed, such as the use of Resilience Credits; summarised in Table 9. While conceptually similar to carbon credits, they are more challenging to operationalise due to the conceptual challenges of adaptation, such as avoided future losses and the local place-based context of adaptation and resilience.
Table 9: Examples of innovative models for private participation in agriculture, with cost recovery model. Source: Updated from Watkiss and England (2025).
Model
Examples
Cost recovery model
Blended finance
Many examples of public and private investment, e.g. World Bank (2019), Scottish Government Agri-Environment schemes
User pays but can generate value addition through financial return (adaptation goods and services)
Concessional Credit Lines (e.g. SNIB)
Many examples of below-market loans and guarantees
Offtaker agreements / Supply chain finance
AMRU Rice (McNally et al., 2024)
Ex-post proof sharing
Warehouse receipt financing
Value chain integration
International Finance Corporation’s (IFC’s) Global Warehouse Finance Program (IFC, n.d.)
Digital platforms (weather and advisory
GeoKrishi (GeoKrishi, n.d.)
Resilience credits (reward investment in adaptation)
Flooding is the largest climate-driven threats to communities and the built environment in Scotland, with exposure increasing across riverine, coastal and surface water systems (SEPA, 2025). Surface water flooding is the most widespread form of flooding as more frequent extreme rainfall events are overwhelming drainage networks and intensifying surface water flooding. Approximately 400,000 properties are currently at risk from a 1-in-200-year flood event (SEPA, 2025). Flooding already costs Scotland an estimated £500m every year – and that figure will likely grow (SEPA, 2025). Beyond physical damage, flood events trigger persistent mental health impacts, particularly where households face prolonged displacement or repeated flooding. In addition, the burden falls disproportionately on socially vulnerable coastal, urban and rural communities (Sayers et al., 2018; Song et al., 2025). As climate change and population growth converge, exposure is projected to extend into areas with no historical flooding experience.
Addressing these risks requires a coordinated, forward-looking approach to spatial planning, infrastructure design and community-level adaptation. Key priorities identified by CCRA3 (2021) include stricter controls on development in flood-exposed areas, greater enforcement of Sustainable Drainage Systems (SuDS), wider uptake of Property Flood Resilience (PFR) measures, and better integration of natural flood management alongside traditional defences. CCRA3 (2021) also highlight improved flood forecasting, public warning systems and more targeted investment in vulnerable communities, alongside updated planning policies that embed climate-ready design principles. As surface water flooding is projected to increase under all climate scenarios, a strategic approach combining planning, infrastructure, social policy and community engagement will be critical to safeguarding people and places (Sniffer, 2021).
Current spending and context
Flood protection schemes
The Scottish Government has maintained a long-term baseline of £42m/yr for flood protection schemes since at least 2015/16, supplemented by a one-off top-up of £150m. Together this totals £570m invested in flood resilience over 2016–2026 (Scottish Government, 2024a; Scottish Government, 2025e). Local authorities also contribute to the cost of building major flood schemes. In the national ‘cycle 1’ scheme, it is estimated that the Scottish Government pays for 80% of the costs and local authorities pay for the remaining 20% of the costs. If costs increase after a specific point in the process, local authorities must pay for those increases. Local authorities also pay for ongoing maintenance once the flood schemes have been built (Audit Scotland, 2025).
Of the 40 flood protection schemes in ‘cycle 1’ (2016–2021) originally deemed eligible for funding, eight were subsequently abandoned and one was separated into a dedicated taskforce, leaving 31 viable schemes. As of early 2026, 21 of these have been completed. One is currently under construction, and a further six schemes are expected to have main construction contracts in place by March 2026. Three remain eligible for funding. However, projected costs across the programme have escalated significantly. For example, the Hawick scheme rose from £37.4m to £78.6m, Musselburgh from £8.9m to £106m, and Dumfries Whitesands from £18.9m to £68.6m (Internal Scottish Government Data – collected from local authorities in November 2024).
On average this investment has protected approximately 600 additional homes per year from flooding between 2016–2026 (Scottish Government, 2025e). However, climate change is exposing an estimated additional 3,000 properties to flood risk each year (SEPA, 2025), meaning that even if the flood protection scheme cycle was fully delivered, it would struggle to keep pace with the scale of need.
Property flood resilience
Property flood resilience (PFR) measures are an important complement to wider flood protection schemes, with particular suitability for managing surface water flooding (Pettit et al., 2020). PFR measures include resistance measures that prevent water entry and resilience measures that reduce damage and speed recovery. Currently, only a small share of Scotland’s flood protection budget is directed towards PFR, despite its potential to provide cost-effective protection for properties exposed to frequent flooding. JBA Risk Management (2025) identifies 4,679 PFR-eligible properties in Scotland with a payback period of 3–5 years, drawn from a wider total of 116,073 properties considering Great Britain, England, Wales and Scotland. However, this represents only a fraction of the likely need – at least 81,000 homes have been identified as suitable for PFR more broadly (Petitt et al., 2020). This figure predates SEPA’s updated flood risk assessment and may therefore underestimate current exposure. This suggests that the near-term investment requirement for properties where PFR is highly cost-effective is relatively modest and well-defined. However, the investment need across the broader pool of suitable properties is considerably less certain, requiring further research.
Capacity building
Climate Action Hubs, Adaptation Scotland, and Climate Ready Regions are the three main Scottish Government programmes delivering systemic capacity building for adaptation beyond infrastructure interventions. These programmes are intended to support communities, businesses, and public bodies to understand and respond to a wide range of climate hazards including flooding, heat, drought, sea level rise, and storms. The Adaptation Scotland Programme works across a broad range of sectors beyond communities. A proportion of Climate Action Hubs activity relates to mitigation rather than adaptation. In both cases, full budget allocations have been retained as spending cannot be reliably disaggregated between adaptation, mitigation, and other functions.
Drainage partnership funding – representing important capacity building at the catchment level – is included within adaptation cost estimates for the water sector and is not included here to avoid double-counting.
Adaptation investment need
This analysis focuses on flood risk management to assess climate adaptation investment needs for communities, covering flood protection schemes, property flood resilience (PFR), natural flood risk management, and wider capacity building. Some flood adaptation measures, such as improved hydrological modelling and early warning systems, have not been costed here and would add to the overall investment need. Other hazards affecting communities – including coastal erosion, drought, heatwaves and wind – fall outside the scope of this analysis and could be explored in further work.
Flood risk management entails a wide range of activities. Our research sought to cover expenditure across four main spending lines: (a) flood protection schemes, (b) property flood resilience (PFR), (c) natural flood risk management (implicitly included in the natural environment budget), and (d) wider capacity building.
This was challenging for two reasons: firstly, it was difficult to establish how Scotland’s current budget is allocated across these spending lines. Secondly, there was an absence of quantified targets or risk-tolerance levels against which investment needs could be scaled. For example, if the Scottish Government were to commit to protecting all high flood risk social housing, it would be possible to identify the number of eligible properties and estimate protection costs accordingly, but without such targets, scaling investment needs requires assumptions that introduce additional uncertainty. As a result, multiple complementary methods were used to assess investment need, with the caveat that there may be a small degree of double-counting between individual estimates. Estimating potential avoided losses from flood risk investment was also particularly challenging in this sector.
Flood protection schemes
To estimate future investment requirements for flood protection schemes, we take two approaches:
We uplift the historic baseline funding of £42m/yr, in place from at least 2015/16 (Audit Scotland, 2025), using the ONS construction price index. This yields an estimated £63m/yr and a total projected requirement of £882m for the period 2026 to 2040 (Table 5).
We take DEFRA flood protection commitments of £7.9bn for England between 2025 and 2035 (UK Government, 2025) and scale to Scotland based on dwelling stock. This yields an equivalent figure of £79m/yr, or £1,102m over 2026–2040. This value-transfer approach rests on assumptions of comparable housing stock, property type, and flood risk exposure with the wider UK and should be treated with appropriate caution.
Both figures are presented in Table 10 to reflect the inherent uncertainty in projecting long-term flood protection expenditure. Together, these approaches indicate anadaptation investment need for communities via flood protection schemes of £885m – £1,102m over the period 2026–2040.
Table 10: Property flood protection scheme climate adaptation estimates 2026–2040, assuming uplift of Scotland’s historic £42m/yr guaranteed spend for the historic Scottish budget scaled, and 10% of wider UK pledge to be proportionate to Scottish dwellings.
Flood protection schemes
Historic Scottish budget scaled
DEFRA pledge (Scotland equivalent)
Cost p.a. (£m/yr)
Total up to 2039/40 (£m)
Cost p.a. (£m/yr)
Total up to 2039/40 (£m)
£63.2m/yr
£885m
£78.7m/yr
£1,102m
This estimate is likely conservative, as it captures only Scottish Government central funding. Local authorities also contribute toward flood protection investment. For example, within ‘cycle 1’ local authorities contributed an estimated 20% of the investment need and the cost of maintenance (Audit Scotland, 2025).
Property flood resilience
Investment need for property flood resilience (PFR) was estimated by applying unit costs from JBA Risk Management (2025) to the 4,679 PFR-eligible properties in Scotland identified as having a payback period of approximately 3–5 years. This focus on properties with the strongest return on investment reduces the risk of double-counting with the wider flood protection budget, while reflecting the economic case for targeted intervention. Unit costs of approximately £2,250 per property for limited PFR measures (e.g., temporary flood barriers for doors, air brick covers, toilet bungs) and £11,000 for standard measures (e.g., permanent flood doors, extensive waterproofing / re-pointing of external walls) were applied accordingly.
By multiplying the average cost per property for limited measures (£2,250) and for standard measures (£11,000) by properties eligible with a short payback period (4,679 properties), calculations indicate an adaptation investment need for communities via property flood resilience measures of £10.5m – £51.5m over the period 2026–2040, equivalent to £0.75m/yr – £3.68m/yr (Table 11).
Table 11: Property flood resilience climate adaptation investment need where payback time is likely approximately 5 years, using JBA Risk Management (2025) data
Property flood resilience
Limited measures
Standard measures
Cost p.a. (£m/yr)
Total up to 2039/40 (£m)
Cost p.a. (£m/yr)
Total up to 2039/40 (£m)
£0.75m/yr
£10.5m
£3.68m/yr
£51.5m
The economic case for investment is reinforced by JBA Risk Management (2025) analysis of Annual Average Losses (AAL), which indicates that delivering standard PFR measures across all 4,679 eligible properties could reduce AAL from £22.8m to £11.1m – a saving of £11.7m per year, suggesting the full cost of standard intervention would be recovered through avoided flood damages within approximately five years.
Capacity building activities
Capacity building investment need was estimated by reviewing expected funding pathways for three programmes, in consultation with Scottish Government policy teams. Climate Action Hubs are estimated at £6m/yr (£84m to 2039/40); Adaptation Scotland at £0.4m/yr (£6m to 2039/40); and Climate Ready Regions at £0.55m/yr rising to £0.9m/yr between 2026 and 2029, remaining at £0.9m/yr through to 2039/40 (£12m to 2039/40). Case study 2 highlights one of the Climate Ready regions funded initiatives. Furthermore, it should be noted that capacity building investment need spans risks beyond flooding – including storms, drought, wildfires, and heatwaves – and encompasses some capacity building for climate mitigation that could not be disentangled from adaptation spend. Together, our calculations indicate adaptation investment need for communities via capacity building amount to £102m between 2026–2040 (Table 12).
Table 12: Estimated climate adaptation investment need for capacity building activities within the communities’ sector between 2026–2040. Costs in 2026/27 prices.
Capacity building activities
Standard measures
Action
Cost p.a. (£m/yr)
Total up to 2039/40 (£m)
Climate action hubs
£6m/yr
£84m
Adaptation Scotland
£0.4m/yr
£6m
Climate ready regions
£0.55m – £0.9m/yr
£12m
Total:
£102m
These figures assume current spending levels, increasing nominally, are sufficient to meet future adaptation capacity building needs – an assumption that may warrant revisiting as Scotland’s adaptation requirements become better understood.
Case Study 2: University of Strathclyde Raingarden Parklet Case Study
The Raingarden Parklet, led by Hope in Place CIC and supported by Civic, is an innovative piece of green urban infrastructure designed, created, and built in Glasgow. It represents a new approach to sustainable urban drainage systems (SuDs). It aims to reduce peak run off during intense rainfall. while simultaneously creating social value through education, training, and pathways into green jobs.
The modular unit measures 4.5m × 1.5m × 1.2m and costs approximately £10,000 to design and manufacture. The University of Strathclyde secured £15,000 through Climate Ready Regions funding via Climate Ready Clyde, covering the parklet and a proportion of the £15,000 – £20,000 installation costs.
The final location outside the Andersonian Library was selected through stakeholder consultation against criteria including flood risk, footfall, and connection to local drainage infrastructure. It demonstrates what can be achieved in a single car parking space and offering a visible symbol of Glasgow’s shift towards greener, healthier streets.
Beyond flood resilience, the pilot delivers co-benefits across public realm enhancement, green skills and employment, and justice system reform. The parklet was constructed in HMP Barlinnie using recycled materials, with profits funding a training pathway towards a ‘Green Skills Factory’ at the new HMP Glasgow and the project fostering broader community-university collaboration. This has the potential to act as a catalyst for further investment in modular, scalable adaptation solutions that deliver integrated benefits for society, the environment, and the economy.
Example of a raingarden parklet. Image credit: Ben Raw.
Total adaptation investment need for communities through flood measures.
In total, the adaptation investment need estimate for communities – focusing predominantly on flood management – is £997.5m – £1,256m between 2026–2040, equivalent to £71.2m/yr – £89.7m/yr (Table 13).
Table 13: Estimated climate adaptation investment need for flood protection schemes, property flood resilience and capacity building between 2026 – 2040. 2026/27 prices.
Sub-sector
Cost p.a. (£m/yr)
Total up to 2039/40 (£m)
Flood protection schemes
£63.2 – £78.7m/yr
£885 – £1,102m
Property flood resilience
£0.75 – £3.68m/yr
£10.5 – £52m
Capacity building
Approx. £7.29m/yr
£102m
Total
£71.2 – £89.7m/yr
£997.5 – £1,256m
Macroeconomic effects and wider impacts
Macroeconomic impacts
The communities sector adaptation package, covering regional hubs, property flood resilience and flood protection schemes, amounts to around £978m between 2026 and 2040, approximately £65m/yr. This is slightly lower than the figures quoted in section 4.2.3.4 because of rounding and the pricing being in different years.
Without cost recovery (a modelling device to isolate the spending effect): By 2040, Construction records an output gain of £38m and roughly 575 jobs, while architectural services and “all other services” add £9m in output and 120 jobs. Modest positive impacts appear in wholesale and retail trade, fabricated metals, manufacturing and primary sectors, reflecting supply-chain linkages. The overall effect is a modest but broadly positive local economic boost centred on construction, professional services and local services.
With “government pays” cost recovery (a stylised scenario): When the Scottish Government recovers costs through higher income tax, construction retains most of its gains, recording £35m in output and around 530 jobs. Architectural services and supply-chain activities such as fabricated metals and steel also remain positive. However, consumer-facing sectors reverse direction. Retail (excluding vehicles) shifts from a £1.7m gain and 36 jobs in the no-recovery case to a £2.8m loss and 59 fewer jobs once taxes rise. Similarly, “all other services” flips from an £8.6m gain and 114 jobs to a £15m loss and 187 fewer jobs. Financial services, travel, transport, manufacturing and energy sectors also turn negative as squeezed household incomes reduce demand. In simple terms, higher income taxes reduce disposable incomes, which reduces consumer spending, putting pressure on retail, hospitality and service jobs.
Policy implications: Even relatively modest adaptation programmes provide meaningful local benefits in construction and professional services. However, income-tax recovery dampens broader gains: it is more progressive than raising prices for essential goods, but it still reduces household budgets and activity in consumer-facing sectors. Policymakers need to weigh these short-term sectoral effects against the long-term flood protection and community resilience benefits.
Wider impacts
The economic case for adaptation investment in flood resilience for communities is strong. Defra estimates that every £1 spent on flood defences prevents around £8 in economic damage (UK Government, 2025). Furthermore, the expected annual cost of flooding impacts in Scotland is now approximately £260m/yr (Scottish Government, 2025e), with multi-hazard events, such as the associated flooding from 11 named storms between November 2015 and March 2016, negatively impacting the UK economy by 0.08% of GDP (Office for Budget Responsibility, 2024). Consequently, the potential avoided losses from sustained investment in flood protection schemes remain substantial. Note, further research is required to develop a full understanding of the wider co-benefits associated with investing in flood protection schemes, PFR and wider capacity building.
Current governance, funding and financing arrangements
Flood risk management is currently predominantly funded by the public sector as illustrated in Figure 7. This includes direct funding from Scottish government for schemes. Responsibilities are set out under the Flood Risk Management (Scotland) Act 2009. Most flood investment is provided by Scottish Government, who provide £42m/yr. However, this is provided at an intervention rate of 80%, with an additional 20% from local authorities from general ringfenced funding. Assuming this is spent, an additional £8.4m a year is provided by local authorities. Allocating the same percentage of private sector contribution (37%) as for transport, suggests that around £3.1m (37% of £8.4m) a year is contributed by households and businesses.
Some levels of PFR are funded by households, both domestically and through Flood Re’s Build Back Better scheme (a joint initiative between the UK insurance industry, see Innovation section, below), but this is relatively low. Details of the number of properties ceded to flood Re, or properties provided with PFR, are not publicly available. The Flood Re market study assumes around 500 – 550 residential properties a year going through (Borio and Kassian, 2023). This suggests around £540,000 a year in contributions, though both the Borio and Kassian (2023) study and Pettit et al. (2020) highlight most of these schemes are publicly funded or subsidised. Therefore, for the purposes of the study, we assume the total contribution to floods indirectly via Council Tax and Non-Domestic Rates to be roughly 7%.
Figure 7: Financing, funding, and delivery arrangements for adaptation in flood protection schemes and property flood resilience.
Innovation that could boost private sector participation
Opportunities to leverage private investment in adapting to changing flood risk in Scotland could include:
Scotland Bond Issuance programme: Scottish Government is in the process of putting in place the mechanisms to facilitate the issuance of bonds, having obtained a credit rating and appointing banks and legal advisors (Scottish Government, 2026a). This has been used in the UK to provide upfront financing for Flood and Coastal Erosion Risk Management, with UK Government reporting on use of proceeds. Similar mechanisms could be used to provide a significant boost to available capital investment.
The FloodRe ‘build back better’ scheme: For communities impacted by flooding, it is likely their properties will be eligible for the FloodRe ‘build back better’ scheme, a joint initiative between the UK insurance industry and the UK Government, which offers householders the chance to install property flood resilience measures up to the value of £10,000 when repairing their properties after a flood (FloodRe, 2023). No data is currently published on use, but uptake is thought to be low.
Scotland’s current resilience organisations: These span Regional and Local Resilience Partnerships, Community Resilience Committees, and Category 1 and 2 responders (Brett et al., 2026). They represent a cost-effective foundation for building adaptation capacity without requiring entirely new delivery structures. Embedding adaptation within local authority contingency planners, local resilience partnerships, and community councils offers a pragmatic route to scaling capacity building across Scotland’s communities and institutions. Private sector organisations, particularly utility and transport operators operating as Category 2 responders, are well positioned to potentially contribute co-funding and expertise to this capacity building as part of their existing statutory obligations and business continuity responsibilities.
There are multiple opportunities to increase both private sector funding and financing. Financing opportunities relate to the use of a range of debt financing instruments, such as green bonds, to support adaptation. There have also been examples where development banks have provided commercial funds to help local authorities address fiscal space constraints. In addition, there have been some examples in England where the use of PPPs has been used to unlock private sector financing for flood defences. In a similar vein, Land Value Capture and Tax Increment Financing provides an option to unlock future revenue streams through increases in land value or development through investment in flood defences. Parametric insurance has also been used to provide upfront protection for coral reefs which serve as flood defences as well as payouts for recovery.
There are also schemes which encourage private sector funding (summarised in Table 14), such as direct contributions to flood risk management schemes. Evidence from the National Audit Office suggests that around 9% of total contributions to flood defences in England came from businesses (National Audit Office, 2023) – but also from more local schemes, such as the use of climate resilience districts or water funds. There is also the potential for the use of tourism taxes and levies, as well as dedicated levies for climate resilience, such as those in Greece or Italy (Venice). There are also models which leverage revenue streams from co-investment such as in the Netherlands where revenues from wind turbines have been used to partially fund dikes.
Table 14: Examples of innovative models for private participation in flood protection, with cost recovery model. Source: Authors, updated from Watkiss and England, 2025.
Model
Examples
Cost recovery model
Green bonds / resilience bonds
UK green bonds (gilts) include coastal projects (UK Debt Management Office, n.d.) European Bank for Reconstruction and Development climate resilience bonds (Bennett, 2019)
Government pays
Public Private Partnership (PPPs)
UK Broadlands (Jacobs, n.d.) / US Fargo
Mixed
Parametric insurance
Quintana Roo (Green Finance Institute, 2024a)
User pays (public and private sources)
Local water use charges or taxes
Copenhagen Cloudburst (City of Copenhagen, 2012)
User pays (local public and private)
Land Value Capture / Tax Increment Financing
Mission Rock Bhutan Phuentsholing Township Development (ADB, 2018)
User pays
Mitigation co-benefits
RWE wind turbines on dikes, Netherlands (Windpowernl, 2022)
Co-benefit streams – energy sales
Private co-funding of flood defences
UK Flood and Coastal Erosion Risk Management Strategy
Business pays
Increased private contribution to PFR
UK assessment (Wood Environment & Infrastructure Solutions UK Limited, 2019)
User pays (private) (Possible insurance benefit).
Climate resilience districts
US (California, Connetticut),
Businesses pay
Tourist taxes / Levies
Hawaii (Jacobo, 2025), Venice, Greece
User pays
Concessional Finance
National Wealth Fund, Wales
Government pays
Natural environment
Key climate risks and adaptation opportunities
Peatland
Scotland’s peatlands face serious and accelerating degradation from multiple climate pressures. Heavier rainfall increases erosion and carbon-rich sediment loss, while warmer, drier summers accelerate oxidation and peat loss – with degraded lowland peatlands already losing 1–2 cm of soil depth annually. Heightened wildfire risk adds further pressure, and many peatlands remain inadequately monitored, meaning the true extent of degradation may be underestimated. Climate risk is projected to rise from medium to high, with the potential for irreversible loss of peatland functions including carbon storage, biodiversity support and water regulation (Sniffer, 2021).
Reversing this degradation requires more comprehensive monitoring of peat condition, integrated land-use policies prioritising protection and restoration, and targeted guidance for land managers on re-wetting, water management and erosion prevention. Peatland adaptation must also align closely with mitigation strategies. For example, directing woodland expansion onto mineral soils rather than peat, and stress-testing net zero measures against future climate risks. Better research on climate impacts to carbon stores, more systematic soil carbon monitoring, and strategic cross-sector land-use planning across agriculture, forestry and coastal zones will be essential to safeguard water quality, flood regulation and the reliability of Scotland’s greenhouse gas projections as the climate shifts (Sniffer, 2021).
Forestry
Scotland’s forestry sector faces serious and interconnected climate threats (risks N6, N8 and N9 in CCRA3). Rising temperatures and increasing drought, particularly in central and eastern regions, are reducing growth rates, affecting timber quality and shifting species viability. Commercially important species such as Sitka spruce are losing ground to more drought-tolerant alternatives. Broadleaved species face severe stress from more frequent extreme weather. Warmer conditions are also accelerating the arrival and spread of pests, pathogens and invasive species, including Phytophthora ramorum, Dothistroma needle blight and bark beetles, compounded by increasing deer damage. Overall risk is projected to rise from medium to high under future warming, while potential opportunities from longer growing seasons and expanded species suitability remain largely unrealised due to adaptation barriers (Sniffer, 2021).
Building forestry resilience requires integrated action across several fronts. Strategic land-use planning must embed both adaptation and mitigation objectives, with clearer decisions about which forest types and locations remain viable as conditions change. Improved surveillance and biosecurity at ports of entry, better soil and water management, strengthened wildfire preparedness, and diversified woodland species and structures will all help spread risk and improve long-term productivity. Warmer temperatures do create opportunities for previously unsuitable species such as Douglas fir and fast-growing bioenergy trees, but realising these benefits requires deliberate research and field trials. Enhanced cross-sector coordination, better knowledge exchange with land managers, and targeted research into future-adapted management systems will be essential to maintain carbon storage, support Net Zero transitions, and preserve the ecological and economic value of Scotland’s woodlands as the climate shifts (Sniffer, 2021).
Nature restoration
There are also multiple adaptation opportunities within the nature restoration that align with wider biodiversity and carbon mitigation targets. Case study 3 outlines on-going research NatureScot is conducting to explore catchment scale nature restoration cost estimates.
Case study 3: Catchment scale nature restoration, NatureScot
Context
NatureScot is working with SEPA, Scottish Water, FLS and Scottish Forestry to review and prioritise landscape / catchment scale nature restoration projects across Scotland (Scottish Biodiversity Strategy Action 2.1) and align this with SNAP3 objective NC2 on landscape scale approaches to climate adaptation and river basin management planning.
Preliminary cost estimates
NatureScot have started to estimate the costs of restoring catchments across Scotland and work is underway to refine these. Early in financial year 2026/27 they hope to have indicative costs for catchment scale restoration across Scotland, likely to be in the region of £5bn. Through 2026/27 they will develop a costed pipeline of projects out to 2045, refining the cost estimates at project scale to inform an Investment Plan for delivery.
Current methods use GIS analysis and cost assumptions based on existing projects. During 2026/27, the projects themselves will estimate costs to inform a more accurate cost estimate.
Key challenges and opportunities for climate adaptation at a catchment scale:
Lack of evidence on the costs of natural flood management
Lack of evidence to support quantification of benefits and to inform a business case
Lack of long-term commitments to the funding streams that currently pay for restoration and insufficient funding for the scale of the challenge
Immature nature finance market which is not yet delivering private investment at the scale required.
Current spending and context
Current Scottish Government spending includes specific investment in nature based climate solutions. For 2026/27, the Scottish Budget allocates £28m for peatland restoration, supporting the restoration of over 10,000 hectares of degraded peatland. A further £37m is committed to woodland creation, aimed at delivering more than 12,000 hectares of new woodland (Scottish Government, 2026b). In addition, £26m is allocated through the Climate Taxonomy for nature restoration activities, supporting wider ecological recovery and contributing to long-term climate adaptation and resilience objectives (Scottish Government, 2026c).
Adaptation investment need
Cost estimates for the natural environment draw on the Scottish Government’s draft Climate Change Plan (CCP) and Scottish Budget Climate Taxonomy (2026/27), with expert-elicited proportions assigned to reflect the share of costs attributable to adaptation. These proportions, 25% for peatland restoration, 6.25% for woodland creation, and 20% for wider nature restoration, were derived by examining the mixed objectives of each budget line and assigning a share to adaptation relative to co-benefits such as carbon mitigation, biodiversity gain, and flood alleviation. For peatland restoration, for example, carbon mitigation is the primary objective of the CCP spend, with flood reduction and biodiversity functioning as secondary objectives; the adaptation proportion reflects this hierarchy. These proportions were cross-checked through expert review with Paul Watkiss Associates, drawing on comparable apportionment approaches used in parallel Climate Change Committee analysis for England (Watkiss et al., 2026a). No uplift for increasing climate risk was applied to these estimates up to 2040. It should be noted that other relevant actions – including wildfire management and enhanced monitoring of peatland and woodland restoration – have not been costed here and would add to the overall investment need.
Peatland
Scotland’s draft CCP projects peatland restoration ramping up from approximately 15,400 ha/yr in 2026 to just over 22,500 ha/yr from 2030 onwards, totalling 319,489 ha by 2040, contributing toward the wider Scottish Government target of 400,000 ha of peatland restoration by 2040. Total peatland restoration costs were estimated using the draft CCP central estimate of £2,894/ha (capital and resource combined), assuming a mix of peat types restored across 2026 – 2040, with capital costs derived from Glenk et al. (2025) using 2022 grant data uplifted to current prices using ONS GDP deflators. Applied to the CCP’s restoration target, this yields a total cost of £925m (£66m/yr) in 2025/26 prices for 2026–2040. A 25% adaptation apportionment was applied on the basis that, while the off-site adaptation benefits of peatland restoration represent a relatively modest share of overall benefits, there are also meaningful on-site benefits to the peatlands themselves. The UK National Adaptation Plan similarly cites climate resilience as one of four core benefits of restoration (Watkiss et al., 2026a).
We estimate climate adaptation investment need for peatland restoration at £236m to 2040, equivalent to £16.8m/yr. It is important to note that peatland restoration costs are subject to considerable uncertainty, varying significantly by peat type, depth, location, site accessibility, and contracting arrangements. Okumah et al. (2019) report a median restoration cost of £1,009/ha, with a range of £3,707 between minimum and maximum estimates. Glenk et al. (2025) report costs ranging from £191/ha at the 5th percentile to £4,483/ha at the 95th percentile. This wide cost distribution means peatland restoration estimates should be treated with particular caution. Further research to better constrain unit costs would meaningfully improve the robustness of future investment needs assessments.
Woodland creation
Scotland’s draft CCP projects woodland creation ramping up from 12000 ha/yr in 2026 to 18,000 ha/yr from 2029 onwards, totalling 258,000 ha between 2026–2040. For woodland the study used the central estimates of total costs provided by the Scottish Government. These estimates include the total capital, maintenance and administration costs between Scottish Government and businesses at a total of £1,799m to 2040.
Apportioning a share of this expenditure to climate adaptation is not straightforward. The primary objective of woodland creation is carbon mitigation, and woodlands can in some cases increase certain climate risks. For example, this can be through disease spread, fallen trees from storms, and increased vegetation growth affecting critical infrastructure (e.g., Bebber et al., 2025; Network Rail Scotland, 2024). Identifying the adaptation-specific component therefore required an evidence-based approach.
To apportion a share of expenditure, we drew on the Economic and Natural Capital Assessment (ENCA) database to compare the economic value of flood control benefits delivered by woodland creation and peatland restoration, expressed in £/ha/yr. Flood control was the only comparable adaptation benefit available to us in consistent monetary terms across both habitat types. The evidence indicates that flood control benefits from woodland creation are approximately four times lower than those from peatland restoration per hectare (Broadmeadow et al., 2023; Morris and Camino, 2011). Having assigned a 25% adaptation apportionment to peatland restoration on this basis, we therefore applied a proportionally scaled figure of 6.25% to woodland creation. This apportionment was cross-checked through expert review with Paul Watkiss Associates.
We recognise that this approach captures only one dimension of adaptation value – flood control – and that other potential adaptation benefits of woodland creation, such as shade provision, slope stabilisation, and reduced surface runoff, are not reflected in the apportionment. This figure should therefore be treated as a conservative estimate and is identified as a priority area for further research and methodological development.
We estimate climate adaptation investment need for woodland creation at £8.2m per year or £115m between 2026–2040.
Nature restoration
Finally, there is an additional budget line in the Scottish Budget 2026/27 (Scottish Government, 2026b) relating to nature restoration. The Climate Taxonomy identifies a nature restoration budget line of £26m/year, relating to policy development and implementation to manage and restore Scotland’s biodiversity and landscapes. This also includes provision of the Nature Restoration Fund and continued commitment to the Central Scotland Green Network (Scottish Government, 2026c), at a consistent level of funding. By assessing the multiple objectives of nature restoration, we assume 20% of these benefits are related to adaptation. We estimate climate adaptation investment need for nature restoration at £5.2m/yr for a total of £73m between 2026–2040.
Total adaptation investment need for natural environment
We estimate climate adaptation investment need for peatland restoration, woodland creation and nature restoration at £16.8m/yr, £8.2m/yr and £5.3m/yr respectively, totalling £30.2m/yr, or approximately £423.8m between 2026–2040 (Table 15).
Table 15: Estimated climate adaptation investment need for peatland restoration, woodland creation and nature restoration between 2026–2040. These costs represent a proportion of the total spend from the Climate Change Plan or the Scottish Budget that is related to adaptation for woodland creation (6.25%), peatland restoration (25%) and nature restoration (20%) accordingly. In 2026/27 prices.
Sector
% Apportionment
Cost p.a. (£m/yr)
Total up to 2039/40 (£m)
Peatland restoration
25%
£16.8m/yr
£236m
Woodland creation
6.25%
£8.2m/yr
£114.7m
Nature restoration
20%
£5.2m/yr
£73.1m
Total
£30.2m/yr
£423.8m
Macroeconomic effects and wider impacts
Macroeconomic impacts
For natural environment, we’ve modelled the total spending outlined in the Climate Change Plan and nature restoration budget (as opposed to the adaptation portion of £423.8m – see Section 4.3.3.4). This totals just over £3bn between 2026–2040, around £200m/yr.
Without cost recovery (a modelling device to isolate the spending effect): The programme generates substantial gains in “other primary” activities – forestry and land-use sectors – where output rises by around £92m and employment by roughly 1,050 jobs by 2040. Agriculture adds £1m in output and 14 jobs. Construction gains £11m in output and 170 jobs, while “all other services” contributes around £29m and 380 jobs. The overall effect is a broad-based but especially land-focused expansion, reflecting the labour-intensive and locally embedded nature of restoration activities.
With “government pays” via expenditure cuts in all areas (a stylised scenario): When costs are recovered through public spending cuts, widespread reversals occur, particularly in service sectors. “All other services” shifts from a gain of £29m and nearly 380 jobs to a loss of roughly £102m and around 1,300 jobs. Education moves from a gain of £2.8m and 60 jobs to a loss of nearly £25m and over 520 jobs. Public administration records a decline of about £43m and nearly 480 jobs. Retail, financial services and transport flip from modest gains to losses. Even the core land-use sectors are affected: “Other primary” moves from a gain of around £92m to a small loss, and construction swings from a gain of £11m and 170 jobs to a loss of around £14m and 200 jobs. Manufacturing gains are largely erased. The aggregate effect under income-tax funding is contractionary by 2040, meaning that while restoration work still channels activity into land-use sectors, the broader economic impact turns negative once cost recovery is factored in.
Policy implications: Land-based adaptation can boost rural employment and supply chains significantly, but spending-cut recovery creates widespread service-sector losses that outweigh the direct stimulus. This highlights an acute trade-off between using spending cut and preserving activity in consumption-dependent and public-service sectors. The results exclude long-term ecosystem, carbon sequestration, flood risk reduction and recreation benefits, which are particularly important for Scotland’s climate and biodiversity goals.
Wider impacts
Woodland creation and peatland restoration generate multiple co-benefits beyond direct climate adaptation. These include carbon storage, biodiversity gain, water quality improvement, air quality, temperature regulation, flood regulation, recreation, and physical health. Resource constraints prevented a comprehensive review of all co-benefits; however, we have estimated the value of a selected range, assuming that the peatland restoration and woodland creation targets for 2026 –2040 set out in the draft CCP (see section 4.3.3) are successfully completed, to current climate resilience standards, and established by 2050.
Should the 319,488 ha of peatland targeted under the draft CCP be successfully restored between 2026 and 2040, this could generate approximately £267m/yr in flood control and storm buffering benefits, £191m/yr in water quality benefits, and £199m/yr in biodiversity benefits (Table 16).
Should the 258,000 ha of woodland targeted for creation between 2026 and 2040 be successfully established to climate-resilient standards, a range of co-benefits could be realised by 2050, once the woodland has had time to develop. These include flood storage (£29m/yr–£54m/yr), recreation and health benefits (£383m/yr), biodiversity benefits (£46m/yr), and avoided mental health costs (£48m/yr) (Table 16).
These figures carry considerable uncertainty, reflecting both the pace of establishment and the assumptions underpinning each co-benefit category. They nonetheless demonstrate that the economic case for woodland creation as a climate adaptation investment strengthens substantially when co-benefits are considered. It also demonstrates that the investment need estimates presented above likely understate the full economic value of this expenditure.
Table 16 Estimated value of a range of co-benefits (£m/yr) for 258,000ha of established woodland, and 319,488ha of established peatland restoration in 2026/27 prices.
Sub-sector
Co-benefit
Total benefits (£m/yr)
Source
Woodland creation
Flood storage
£29m/yr – £54m/yr
Broadmeadow et al. 2023
Additional recreation and health
£391m/yr
Scarpa, 2003
Biodiversity
£46m/yr
Willis et al., 2003
Avoided mental health costs
£50m/yr
Shanahan et al., 2016
Peatland restoration
Flood control and storm buffering
£267m/yr
Morris and Camino, 2011
Water quality
£191m/yr
Morris and Camino, 2011
Biodiversity
£199m/yr
Morris and Camino, 2011
Current governance, funding and financing arrangements
Peatland restoration
To deliver the Scottish Government targets for peatland restoration, Scottish Government funds five delivery partners to undertake peatland restoration to meet these targets: NatureScot, Loch Lomond and Trossachs National Park Authority, Cairngorms National Park Authority, Forestry and Land Scotland and Scottish Water seen in Figure 8 (Scottish Government 2023a). There have been some elements to crowd fund in private sector finance but for now this investment is presumed to be purely public. Beyond public funding, there has been minimal investment in peatland restoration from private sources to date, including through voluntary carbon markets (Scottish Government, 2023a).
Figure 8: Financing, funding, and delivery arrangements for adaptation in peatland restoration. Adapted from Paul Watkiss Associates.
Woodland creation
The governance landscape for woodland creation is complicated, summarised in Figure 9. It is overseen and delivered by two executive agencies – Scottish Forestry and Forest and Land Scotland. Scottish Forestry is the government agency responsible for forestry policy, regulation and grant schemes. Forestry and Land Scotland are the operational land-management agency for the forest estate. However, much planting occurs on private land and for commercial purposes. Investment in new woodland creation is supported by grants through the Forestry Grant Scheme. This supports the creation of new woodland, as well as management of existing woodlands and investments in forest infrastructure such as protection.
An evaluation of the previous phase of the Forestry Grant Scheme for Scotland highlighted that the grants are unlikely to cover the total cost of the investment (Scottish Forestry, 2025). This means there will be residual costs associated with long term management and felling that will need to be met by the private sector. However, there is no data on the proportion of this investment. Given this, we have not been able to generate reliable investments in the split of public and private sector investment in adaptation. The governance arrangements for nature restoration more broadly have not been mapped in detail due to the limited resources for the study.
Figure 9: Financing, funding, and delivery arrangements for adaptation in woodland creation.
Innovation that could boost private sector participation
While nature and ecosystems have broadly public characteristics, there are a range of mechanisms (see Table 17) that can support private sector involvement in adaptation and provision of ecosystem services.
The first cluster relate to the benefits derived from ecosystems. These include dedicated payment for ecosystem services schemes, but also carbon and biodiversity credits, or for loss reduction, noting that these are co-benefits and that the locations of planting need to coincide with those needed for risk reduction, and that in such schemes the revenues are too small and benefits arise (Watkiss and Hunt, 2024; England et al., 2025). The Scottish Government, NatureScot and SEPA are supporting CreditNature, selected through the CivTech innovation accelerator, to develop a voluntary biodiversity credit market for Scotland. This will be guided by the British Standards Institute’s Nature Investment Standards programme and the Scottish Government’s Natural Capital Markets Framework (Scottish Government, 2023b; Scottish Government, 2024b; NatureScot, 2026). Similarly, in England, the introduction of Biodiversity net gain is also supporting the development of a market and is beginning to unlock new investment in ecosystem restoration (e.g. Avon Needs Trees).
There are some examples of private and corporate investment. Philanthropic investment has included around £50m over three years for rewilding across privately managed Scottish estates (BBC, 2019). Diageo has committed up to £5m over five years to restore up to 3,000 hectares of degraded peatland by 2030 – illustrating how businesses with supply chain dependencies on healthy ecosystems can become adaptation co-funders (Diageo, 2026). However, these are likely to be relatively modest and opportunistic.
A second cluster relates to investment based on sustainability outcomes, whereby the terms of financing are preferential based on the impact. This includes payment for ecosystem services, sustainability linked loans, as well as direct investments in nature-positive businesses and redeemable equity. There have been efforts by the Scottish National Investment Bank to provide concessional credit lines to support. For example, the SNIB recently provided a £50m cornerstone investment to the Gresham House Forestry Fund, 60% of which will be invested in Scotland, and which includes commitment to climate resilience (Scottish National Investment Bank, 2026).
Finally, there are also a cluster of insurance-based innovations. For example, in Colombia, the City of Bogota has extended previous work by The Nature Conservancy (TNC) on Water Funds. This provides a proactive fund where beneficiaries pay into funds which support proactive risk reduction as well as offering parametric insurance for response and recovery. In Mexico, the Quintana Roo coral reef scheme sees local businesses and tourists paying in alongside government to support reef protection and receive parametric insurance. In addition, the NATURANCE and PIISA Horizon Europe projects examining how disaster risk financing can be combined with nature-based solutions to develop scalable insurance products (Climate-ADAPT, 2026).
Table 17: Examples of innovative models for private participation in natural environment, with cost recovery model. Source: Authors, updated from Watkiss and England, 2025.
Model
Examples
Cost recovery model
Anticipatory parametric insurance for damage reduction
Paramos Wildfire Facility, Colombia
User pays
Blockchain carbon credits for ecosystem services
AirEco (Indonesia) (SEED, n.d.)
User pays
Online platform with blockchain tokens, and enhanced Monitoring, Reporting, and Verification
Global Mangrove Trust (Thailand) (SEED, 2018)
User pays
Voluntary carbon markets (with NbS projects)
REDD+ examples, such as Mai Ndombe REDD+ project (Democratic Republic of Congo) and Lariba REDD+ project (Zimbabwe) Reforestation/afforestation projects such as CommuniTree Carbon Program (Nicaragua) Regenerative agriculture projects such as Nature Carbon (Cerrado Biome) (Brazil)
Private sector pays
Biodiversity credits/offsets
Ambatovy Minerals Project (Madagascar) (World Bank Group, 2016) Lom Pangar Hydropower Project (Cameroon) Savimbo (Colombia, Colombian Amazon) (Dasgupta, 2024) WWF Pilot Projects (Tanzania) (WWF, n.d.)
Private sector pays but can generate value addition through financial return
Payment for Loss Reduction
Restoration Insurance Service Company (RISCO) (Philippines, Mexico, Brazil, Malaysia) – mangroves (CPI, n.d.)
User pays
Sustainability premium and traceability app
Monsoon Tea Company (Thailand) (GSMA, 2024)
User pays
Investment fund for nature-positive businesses
Tropical Resilience Fund (Africa, Latin America, East/Southeast Asia) (Global Innovation Lab for Climate Finance, n.d., a)
Private sector pays
Payment for ecosystem services
The Nature Conservancy (TNC) Water Funds Portfolio (TNC, 2024) BIOFIN – capacity building in identifying and implementing relevant ecosystem services payments (BIOFIN, 2024a) Forest Resilience Bond (California, US) (Green Finance Institute, 2024b) UN-REDD Programme Initiatives
User pays
Sustainability Linked Loans
ING’s Nature Framework and SLLs (Europe) (ING, 2025)
User pays
Direct investment in NbS-generating businesses/ projects (equity-based)
Cacao Oro de Nicaragua (sustainable agroforestry for cacao production) (GIZ, 2023) African Conservation and Communities Tourism (ACCT) Fund (eco-tourism supporting conservation) (GIZ, 2023)
User pays
Impact bonds (e.g. conservation impact bonds)
Deshkan Ziibi Conservation Impact Bond (DZCIB) (Canada) (Arjaliès, 2024)
Consumers pay via tourism, and taxpayers via government, while benefiting from public goods – tourism assets, reduced disaster risk, and ecosystem health.
Platform / ecosystem development
SCALE (global)
Government pays
Transport
Key climate risks and adaptation opportunities
Road networks
Scotland’s road network faces a complex and intensifying set of climate-driven pressures threatening long-term reliability, safety and connectivity. More intense rainfall is accelerating surface water flooding, overwhelming drainage systems and causing recurring closures on trunk and local roads alike. In upland and rural areas, where single-access routes are common, even short-lived disruptions can isolate communities and disrupt supply chains. Saturated soils and steep topography are heightening landslide risk, most visible along routes such as the A83 at the Rest and Be Thankful, where repeated slope failures have led to long detours and escalating maintenance costs. Extreme temperatures add further stress, damaging pavements and bridges in summer while winter storms bring wind hazards, fallen debris and ice-related disruption (Sniffer, 2021).
Strengthening resilience will require a more strategic, forward-looking approach to maintenance, planning and design. Key priorities include identifying road corridors most vulnerable to flooding and slope failure, scaling up green-blue infrastructure and Sustainable Drainage Systems, improving drainage capacity, and applying soft-engineering approaches such as vegetation management to stabilise slopes. Better condition monitoring, data sharing and early-warning systems for rainfall, wind and landslide risk can support more proactive hazard management. For new infrastructure, mainstreaming climate adaptation into design standards will be essential to avoid costly retrofits, while stronger resilience indicators and more consistent climate risk assessment across local road authorities will be critical to closing Scotland’s current adaptation gap (Sniffer, 2021).
Rail networks
Scotland’s rail network, spanning over 1,700 miles and 360 stations across diverse and challenging terrain, is already experiencing the impacts of a changing climate, with risks projected to intensify over the coming decades (Network Rail Scotland, 2024). Observed changes include warmer average temperatures, altered rainfall patterns, and an increase in the frequency and severity of extreme weather events.
More intense and prolonged rainfall increases the likelihood of surface water and river flooding, as well as saturated ground conditions, contributing to earthwork instability. Embankments and cuttings, many of which are Victorian era assets, are becoming increasingly vulnerable to failure, leading to disruption, safety risk and higher maintenance demand. Storms and high winds continue to cause disruption through fallen trees, debris and damage to exposed assets, while coastal routes face longer term risks from erosion, sea level rise and increased wave action (Network Rail Scotland, 2024).
Higher temperatures are an emerging and growing risk, with hotter and more frequent heat events increasing the incidence of rail buckling, overhead line sag and emergency speed restrictions, affecting network performance and reliability (Network Rail Scotland, 2024).
Wind, flooding and snow are consistently the most disruptive and costly weather hazards on the Scottish network, with weather related disruption incurring significant Schedule 8 compensation costs (payments made to train operators following unplanned disruption) over the past decade (Network Rail, 2024). Around 90% of Network Rail assets are as they were when installed before the year 2000 and were not designed to contend with the more aggressive weather conditions now being experienced or forecast for the future under climate change (Network Rail, 2024).
Network Rail Scotland’s key adaptation priorities include delivering revised climate change risk assessments to identify future vulnerable locations, developing a long-term adaptation strategy using an adaptation pathways approach, and enhancing monitoring and assurance of resilience actions across the network (Network Rail Scotland, 2024).
In addition to spending on infrastructure, there may be some spending being undertaken on rolling stock companies (ROSCOs), but this is not available and therefore excluded from estimates of adaptation investment need.
Current spending and context
Specific information on the cost of climate proofing trunk roads and motorways within Scotland is currently not available. However, the Scottish Budget 2026/27 allocates approximately £82m to adaptation and resilience for trunk roads and motorways (Scottish Government, 2026c). This budget line covers trunk road adaptation schemes to improve network resilience to climate change and severe weather, casualty reduction measures, and Traffic Scotland operational commitments.
Furthermore, Network Rail Scotland has already spent £103.1m of primary resilience interventions to date in control period 7 2024–2029 (CP7). The largest shares have been directed at earthworks (£59.8m) and drainage (£27.7m), reflecting the priority placed on managing slope instability and flood risk across the network.
Adaptation investment need
Transport adaptation investment need was assessed across two sub-sectors: trunk roads and motorways, and rail. Other transport modes, including ferries, canals, aviation, and active travel, have not been included in this analysis and would add to the overall investment need.
Road networks
There is limited information regarding future investment need for climate adaptation on the road network. Strategic Transport Projects Review 2 (STPR2) estimates indicate a capital cost banding of £1bn – £2.5bn over the life of the review from 2022–2042 (Jacobs & AECOM, 2022), reflecting the anticipated scale of investment required to adapt the trunk road and motorway network to climate change. However, this figure was explicitly indicative rather than a precise cost estimate, based primarily on adaptation to flooding at highly exposed locations and not accounting for the full range of relevant climate hazards, including landslides, high winds, scour, and high temperatures. Transport Scotland anticipated that a dedicated Trunk Roads Climate Change Adaptation Plan would establish more robust costs in due course and does not consider the STPR2 figures sufficiently reliable for planning purposes.
To estimate adaptation investment need for trunk roads and motorways, we explored current Scottish Government budget lines with a neutral or positive adaptation influence were identified from the Scottish Budget 2026/27 and associated Climate Taxonomy (Scottish Government, 2026b; 2026c). The Transport Portfolio contains 15 budget lines associated with the Trunk Road Network, of which four, relating to network depreciation and PPP payments, were excluded as not relevant to climate adaptation, leaving 11 budget lines for analysis (Table 18).
Table 18: Budget lines from the Scottish Government Climate Taxonomy 2026/27 that we included in adaptation investment need analysis via exploring the additional ‘climate proofing’ spend or the whole budget.
Budget lines included in analysis
2026/27 budget (£m)
Climate proofing / whole budget
Capital Land and works
£223.26m
Climate proofing
Tay Road Bridge Capital Grant
£3.09m
Climate proofing
Tay Road Bridge Resource Grant
£2.2m
Climate proofing
Adaptation and resilience
£82.32m
Whole budget
Bridge Strengthening and Repairs
£149m
Climate proofing
Woodside Viaduct
£23.7m
Climate proofing
Trunk Roads Structural Repairs
£142m
Climate proofing
Routine and Winter Maintenance
£172.34m
Climate proofing
Safety Camera
£8.2m
Climate proofing
Other Trunk Road Expenditure
£14.28m
Climate proofing
Road Safety
£19.36m
Climate proofing
Two approaches were applied to these budget lines. For ten of the eleven lines, a climate-proofing uplift was applied to estimate the additional investment required to maintain network resilience under a changing climate. Uplift factors of 2.5% and 10%, representing the lower and upper bounds of the additional cost of climate-proofing infrastructure, were drawn from scaling factors in the Asian Development Bank (2014) and World Bank (2019). Crucially, the uplift itself – that is, the difference between the original and uplifted budget – represents the estimated additional spend attributable to climate-proofing, rather than the total uplifted budget. For the adaptation and resilience budget line, the full budget allocation was retained, as this line is wholly directed at adaptation activity.
Applying the climate proofing approach and budget lines outlined in Table 17, the estimated adaptation investment needed for trunk roads and motorways is between £101.2m–£158.06m/yr, amounting to approximately £1,417.52m–£2,212.82m over the period 2026–2040 (Table 19).
Table 19: Climate change adaptation investment need for trunk roads and motorways between 2026-2040. Presented in 2026/27 prices.
Transport (road)
Period
Lower estimate (2.5% uplift) (£m)
Upper estimate (10% uplift) (£m)
Total (2026– 2040) (£m)
£1,417.52m
£2,212.82m
Total (2026–2040 p.a.) (£m/yr)
£101.25m
£158.06m
Local road networks, maintained by local authorities rather than Transport Scotland, are not captured in this analysis. These represent an additional and likely material cost that is expected to grow as climate risk intensifies but fell beyond the scope of the present study. Several methodological limitations are also worth noting. Some budget line descriptions overlap, introducing a degree of potential double-counting (see supplementary data for more detail). The 2.5% and 10% uplift range is derived from international infrastructure literature and may not fully capture the specific risk profile of Scotland’s trunk road network. Applying a larger uplift – as some international studies have suggested may be appropriate for higher emissions scenarios – would yield considerably higher estimates, suggesting the figures presented here may be conservative.
These estimates were triangulated by scaling adaptation cost estimates from Neumann et al. (2025) to the Scottish context as an international benchmark. Neumann et al. (2025) estimated EU transport adaptation costs at approximately 0.04%–0.06% of GDP per year under moderate to high emissions scenarios. Applying this range to Scotland’s GDP yields an indicative figure of £90m – £142m/yr (2026/27 prices), which is broadly consistent with the trunk roads and motorways estimate presented above. However, this comparison should be treated with caution: the nature and projected intensification of climate hazards vary considerably across EU member states and diverges from Scotland’s risk profile in important respects. Furthermore, Neumann et al. (2025) does not provide a breakdown between road and rail spending, limiting the precision of this transfer. These figures were therefore used as an indicative benchmark to assess how our estimates compare at an international level, and are not included in our reported adaptation investment need figures.
Transport Scotland is also actively working to better understand the scale of investment needed for adapting trunk roads to be resilient to climate change. For example, they are developing the Vulnerable Locations Operational Group (VLOG) prioritisation tool to identify climate-vulnerable locations across the trunk road network and better constrain the costs of necessary upgrades and renewals (see case study 4). Consequently, the indicative adaptation investment estimates outlined in this report are expected to be further refined as this ongoing analysis matures.
Case Study 4: Vulnerable Locations Operational Group (VLOG) prioritisation tool
The Vulnerable Locations Operational Group (VLOG) prioritisation tool, developed by Transport Scotland, identifies which parts of Scotland’s trunk road network are most vulnerable to climate change and where investment is most needed. By bringing together asset information to assess exposure, sensitivity, and adaptive capacity, the tool provides a consistent, evidence-based approach to understanding climate risks and prioritising funding across the wide range of geotechnical and geometric challenges throughout Scotland’s network.
The tool uses a scoring and ranking system that evaluates locations against a range of factors including whole-life asset costs, effectiveness of risk reduction, environmental benefits, social impacts, and economic consequences of route disruption. This allows different locations and interventions to be compared fairly and transparently, with quality checks, peer review, and alignment with existing appraisal and business case processes built in to ensure decisions can be reviewed and approved through established governance structures.
Over time, the VLOG tool will help Transport Scotland baseline and monitor how climate-related risks evolve as projects progress and conditions change. For adaptation planning specifically, understanding which locations are most vulnerable and what interventions deliver the greatest risk reduction is essential for ensuring investment is targeted where it will have most impact – moving beyond reactive maintenance towards proactive, planned adaptation. Critically, the tool will enable more asset-based adaptation investment need estimates, moving beyond the indicative budget-line approach used in this report towards a robust, location-specific evidence base for future climate resilience planning across Scotland’s trunk road network.
Image: Example of VLOG prioritisation tool dashboard outlining climate-vulnerable sites.
Rail networks
Interpretation of Network Rail Scotland Investment estimates
The rail investment figures presented here represent indicative, scenario‑based estimates developed by Network Rail Scotland to explore the potential scale of climate adaptation investment required to maintain current levels of service and safety under future climate conditions.
The upper end of the range reflects a plausible future pathway that includes what are currently hypothetical transformational capital interventions at particularly vulnerable locations, which may or may not be required depending on how climate risks evolve over time, and how Network Rail chooses to sequence interventions that are required based on its adaptation pathways programme.
As with other sectors, the absence of agreed levels of service and climate risk‑tolerance targets means these figures are best understood as order‑of‑magnitude planning assumptions, intended to inform strategic discussion rather than define investment requirements.
Investment need estimates
Investment need estimates for the Scottish rail network were drawn directly from high-level analysis Network Rail Scotland’s internal climate adaptation assessment. This draws on climate-based modelling, expert judgement, and current spending patterns to project costs across two categories of spend: (a) operations, support, maintenance and renewals (OSMR), which covers the ongoing costs of maintaining a climate-resilient network; and (b) major capital interventions (MCI), which covers larger-scale infrastructure investment at vulnerable locations. Full details of the underlying methods, assumptions, and calculations are provided in Appendix B.
Total potential adaptation investment requirements for the Scottish rail network are estimated at between £113m–£338.1m/yr, amounting to £1,581.8m–£4,733.6m when operations, support, maintenance and renewals (OSMR) and major capital interventions (MCI) are included over the period 2026–2040 (all figures in 2026/27 prices) (Table 20). This spend would cover increased operational and maintenance activity in response to more frequent severe weather. Such activity includes additional seasonal treatment trains, emergency speed restrictions, and reactive repairs following weather-induced failures, targeted renewals to address accelerated asset degradation across drainage, earthworks, and track. At the upper end, it includes hypothetical transformational capital schemes at locations where incremental intervention alone cannot sustain current service levels, such as infrastructure re-alignment in response to coastal erosion.
The wide range between lower and upper bounds, particularly for MCI, reflects the inherent difficulty of projecting major capital requirements over long time horizons. Network Rail Scotland note that ongoing work under their Adaptation Pathways Programme is expected to narrow these ranges as vulnerable locations become better characterised. These figures represent one plausible investment scenario focused on continued service delivery; alternative investment scenarios could reasonably be explored.
Table 20: Estimated climate change adaptation investment need for Network Rail Scotland, 2026–2040, based on CP7 remaining spend, CP8 and CP9 allocations under a continued service scenario, and pro-rated 2039/40 spend. All figures uplifted to 2026/27 prices (assuming 2% nominal growth per annum) from 2023/24 base prices provided by Network Rail Scotland.
Transport (rail)
Operations, support, maintenance and renewals (OSMR)
Operations, support, maintenance and renewals (OSMR) + major capital interventions (MCI)
Period
Lower estimate (£m)
Upper estimate (£m)
Lower estimate (£m)
Upper estimate (£m)
Total (£m)
£998.2m
£1,815.3m
£1,581.8m
£4,733.6m
Total (£m/yr)
£71.3m/yr
£129.7m/yr
£113m/yr
£338.1m/yr
Case Study 5: Extreme rainfall and landslides at the Falls of Cruachan
The Oban branch of the West Highland Line plays a vital role connecting rural communities around Oban with the rest of Scotland, running alongside the A85 trunk road through mountainous terrain with limited diversionary routes when disruption occurs. The Northwest Highlands are the wettest area of Great Britain. Parts of the railway line – particularly near the Falls of Cruachan – are highly susceptible to landslides due to prolonged heavy rainfall, steep topography, and proximity to unstable slopes. In December 2022, approximately 100 tonnes of material moved down Ben Cruachan’s slopes onto the railway and A85, caused by a blocked culvert overtopped during adverse weather.
Temporary repairs to reopen the railway, including slope stabilisation, signalling repairs, and new track, cost approximately £0.5m. A more permanent fix is now underway at a cost of £3m, encompassing drainage renewal, soil nailing, erosion protection, and lightweight catch fences. Control period 7* plans also include approximately £5m for ongoing vegetation removal and maintenance of the line’s stone signals, which date to 1882 and are approaching life expiry.
Further investment will be required in later years to provide a longer-term solution as increasing frequency of adverse weather events heightens landslide risk. Network Rail Scotland’s current view is that resilience work will combine low-to-medium capacity catch fences with modern instrumented barrier technology along the four-mile length. This is at an estimated cost of circa. £5m in CP8, alongside continued improvement of drainage asset maintenance to better manage water movement during heavy rainfall events. Longer-term options under consideration through Network Rail Scotland’s climate change adaptation pathways programme include a combination of nature-based solutions, such as enhanced vegetation management to stabilise slopes, alongside engineered interventions, reflecting a broader shift towards integrated, pathway-based approaches to managing climate risk on vulnerable parts of the network.
*A control period is Network Rail’s fixed five-year funding and planning cycle that sets budgets and outputs for the railway (e.g., CP7 1 April 2024 – 31 Mar 2029).
Image: Landslide over railway at Falls of Cruachan.
Macroeconomic effects and wider impacts
Macro-economic impacts
Trunk roads and motorways
For macroeconomic modelling we assume trunk roads and motorways require the adaptation investment between 2026–2040 of approximately £90m/yr. These have differing pricing years compared to section 4.4.3.1. This spending flows primarily to construction and wholesale/retail (vehicles), with significant additional activity in public administration, architectural services and a wide range of supply-chain sectors.
Without cost recovery (a modelling device to isolate the spending effect): By 2040, construction gains £12.7m in output and 191 jobs, while wholesale/retail (vehicles) adds £29m in output and 516 jobs. Supply-chain effects spread to fabricated metals, manufacturing, energy and primary sectors, and household consumption spillovers boost retail, financial and travel services. No major sector is worse off during the construction period; the programme delivers broad-based increases in output and employment across the economy.
With “government pays” cost recovery (a stylised scenario): When costs are recovered through higher income tax, the core delivery sectors retain net gains. Construction still adds £3.6m in output and 43 jobs, wholesale/retail (vehicles) retains £26.6m in output and 472 jobs, and public administration adds £5.5m and 55 jobs – because they remain central to the works. However, many consumer-facing sectors flip to losses. Retail (excluding vehicles) loses £3.7m in output and 88 jobs, while “all other services” records a loss of £24.3m and 385 jobs. Manufacturing and primary sectors similarly shift from gains to losses as higher income tax squeezes household spending and raises labour costs, reducing demand and competitiveness.
Policy implications: Without cost recovery, roads adaptation delivers a strong temporary stimulus across the economy. With income-tax funding, construction and vehicle-related sectors still gain, but many consumer and trade-exposed sectors lose activity and jobs. Policymakers must balance fiscal sustainability against these short-term economic effects and against the long-term resilience benefits of climate-ready road infrastructure.
Rail Network
Using the lower estimate for investment in operations, support, maintenance and renewals (OSMR) and major capital interventions (MCI), rail network climate adaptation requires approximately £100m/yr of investment from 2026–2040. The spending flows primarily to wholesale/retail (vehicles) for rolling stock maintenance and replacement, construction for network reinforcement, and public administration for programme management.
Without cost recovery (a modelling device to isolate the spending effect): The programme creates a demand stimulus that peaks at 0.5% GDP growth (around £100m) and 1,500 FTE jobs by 2040. The sectors delivering the works experience the largest gains, with positive spillovers to consumer services as higher household incomes boost spending. Prices rise only modestly as workers migrate to Scotland to meet labour demand, easing wage pressures. All sectors benefit or remain unaffected during the investment period, though these impacts fade roughly 15 years after spending ends.
With “government pays” cost recovery (a stylised scenario): When the Scottish Government recovers costs through higher income tax, the GDP and employment gains are largely eroded and turn temporarily negative in many sectors. Higher income tax reduces household disposable incomes, particularly for higher earners, dampening the consumption that drove much of the initial stimulus. At the same time, employers partly absorb the tax rise through wage bargaining, raising their production costs and pushing prices higher for longer, which weakens Scotland’s export competitiveness. The core delivery sectors – wholesale/retail (vehicles), construction, and public administration – retain smaller gains because they remain central to the works, but consumer-facing services such as “all other services” experience significant job and output losses.
Policy implications: Income-tax funding can protect long-term rail resilience, but it imposes short- to medium-term costs in terms of growth, employment and real incomes, particularly for higher-income households. Policymakers need to weigh these costs against the avoided disruption and economic losses from climate-damaged rail infrastructure.
Current governance, funding and financing arrangements
Road networks
Delivery arrangements for road infrastructure investment are shown in Figure 10, the majority of which is funded through the public sector. Transport Scotland pays for investment on the trunk road network and contracts a range of companies to ensure Scottish trunk roads are safe, efficient and well management (Transport Scotland n.d). This includes both maintenance contracts (provided by Amey and Bear Scotland), but also a range of Design, Build, Finance and Operations (DBFO) contracts. Local roads are managed by local authorities, who pay for investment in the local road network. Scottish Government (including Transport Scotland) spent £3bn on transport in 2023/24. Local Authorities spent £1.17bn in 2023/24 (Transport Scotland, 2025).
While all adaptation costs for the trunk road network are met from government, local costs are met by local government from a mix of sources. Local Government spent £27bn in 2024/25 from four sources of income. Excluding service income (which is ringfenced for uses such as early learning and childcare but not transport) the remaining £16bn came from Scottish Government grant (63%), council tax (18%) and non-domestic rates (19%) (Scottish Government, 2026d). Assuming that adaptation costs are evenly apportioned across funding sources, applying these shares to the relative share of the total investment, we estimate that private sector contributes around 10% of the costs of adaptation, split evenly between households and businesses.
Figure 10: Financing, funding, and delivery arrangements for adaptation in road networks.
Rail networks
The rail sector is a complicated set of governance arrangements (summarised in Figure 11), since rail infrastructure, services and rolling stock are managed by separate organisations. Network Rail manages railway infrastructure. It generates a range of income from access charges, commercial income and an electricity for traction programme. The majority of rail services in Scotland are publicly provided by ScotRail through Scottish Rail Holdings Ltd (SRH Limited), an arm’s length company owned and controlled by Scottish Government (Transport Scotland, n.d), though other franchise operators (e.g. Avanti) run services serving the wider UK.
Whilst the study has not generated estimates of required adaptation spend for rolling stock, this is also important. Rolling stock is privately owned and leased from Rolling Stock Operating Companies (ROSCOs), who have invested over £20bn in rolling stock since 1995 (Mather, 2025). Payments are made from the train operating companies to ROSCOs for the lease of the stock – in 2024/25 these totalled about £2.7bn in the UK (Office of Road and Rail, 2025). Scotland intends to also continue securing financing for the stock, and a lease model (Scotrail, 2026).
Figure 11: Financing, funding, and delivery arrangements for adaptation in the Scottish rail sector.
There are already significant efforts ongoing to consolidate the sector. The UK Government is bringing franchises into public ownership as contracts expire, it is consolidating track management and rail services under Great British Rail to provide overall coordination of track and timetable franchising under one guiding arm. All franchises are expected to be due back in public ownership by the end of 2027. Under this model, Scottish ministers will set a rail strategy for Scotland and fund GBR to provide Infrastructure in Scotland (Department for Transport, 2025), while ScotRail will continue to deliver services. The government expects the leasing of rolling stock from ROSCOs to continue where such investments offer value for money (Mather, K., 2025). Figure 11 represents the funding arrangements following this transition.
To provide an initial view on the split of funding for adaptation, the study used the aggregate income and expenditure for the UK Rail Sector for Scotland (ORR, 2025). This breaks down the relative total income from different sources for the overall sector, and the expenditure, excluding internal money flows. This shows that in 2024/25, government funding made up 66% of all rail sector income, with the remainder coming from passenger income (29.6%) and the remainder coming from industry (1.8%) and freight industry (2.8%). However, looking over time, there has been significant variation in this split, with 50% of income at one point coming from private income. At present, it is assumed Network Rail does not apportion or ringfence income, meaning that adaptation costs are assumed to be split between public and private sector in the same proportions.
Innovation that could boost private sector participation
For transport, road user charging, including city centre congestion charging and expanded parking zones, could generate revenues to help fund climate-resilient infrastructure upgrades. Toll financing on major road networks or adaptation projects offers a further avenue, with potential for private operators to contribute to or co-finance expensive resilience interventions in exchange for revenue streams from infrastructure users. Similarly, there is the potential to mainstream adaptation costs into rail ticket prices. This could be to fund maintenance but can also be blended into PPPs to provide support to capital investment.
There is also the potential to leverage wider infrastructure investment. SSEN Transmission’s commitment of over £200m to Highland roads and bridges demonstrates how major private infrastructure developers can contribute meaningfully to transport resilience as a condition of their wider operations (SSE, 2026).
Finally, there are a typical spread of debt financing models which could be used, such as the use of green bonds or sustainability linked loans. There also more innovative investment approaches such as Collective Investment Vehicles (CIVs), which enable diversification of risk and attract private capital for adaptation investments. One prominent example is the Urban Resilience Fund. Managed by Meridiam and supported by the Rockefeller Foundation, this is a €500m investment fund, split between Africa and OECD countries, and includes a €20m catalytic capital fund for project preparation. Other examples are given in Table 21.
Table 21: Examples of innovative models for private participation in Transport, with cost recovery model. Source: Authors, updated from Watkiss and England, 2025.
Model
Examples
Cost recovery model
Collective Investment Vehicles
Urban Resilience Fund, Meridam
Government pays
Climate-smart PPPs for Roads
Kuala Lumpur Smart Tunnel, Malaysia
Government pays
Tolls
World Bank PPP guidance
User pays
Hypothecated taxes (e.g. Congestion charging, road user charging)
Climate resilience districts / Business Improvement districts
US (California and Connetticut)
Local businesses and households pay
Water
Key climate risks and adaptation opportunities
Scotland’s water supply systems face increasing climate-driven pressures. Rising temperatures, shifting rainfall patterns and growing demand are placing new stresses on water resources (Sniffer, 2021). Projections indicate that under +2°C and +4°C scenarios, several regions could experience supply-demand deficits by mid-century (Scottish Water, 2024). Reservoirs in Scotland are increasingly vulnerable to extreme rainfall, high inflows and warmer temperatures, which can erode embankment integrity and reduce water quality. While current adaptation measures keep public water supply risk in the low category, more than half of Scotland’s population could be at risk of water scarcity by 2050 during very dry periods (Scottish Government, 2023c). River flooding currently affects 279 Scottish Water assets during frequent storm conditions, with a further 11 Scottish Water assets projected to face increased fluvial exposure beyond 2050. Surface water flood risk is also set to grow, with 8 Scottish Water assets at increased risk by 2050, rising to 171 by 2080 (Scottish Water, 2024).
The wastewater system faces similar pressures, with more intense rainfall driving sewer overflows, inundating treatment works and raising pollution risk (Sniffer, 2021). River flooding already affects 720 of Scottish Water’s wastewater assets during frequent storm conditions, with a further 194 projected to face increased fluvial exposure beyond 2050 (Scottish Water, 2024). Surface water flood risk is set to escalate further, from 65 wastewater assets at increased risk by 2050 to 463 by 2080 (Scottish Water, 2024).
Reducing these risks requires maintaining and strengthening Scotland’s proactive approach to water management through long-term, evidence-based investment. Future resilience will depend on integrating climate projections into reservoir inspection regimes, infrastructure planning and risk assessments, ensuring systems are designed for higher peak flows and more volatile conditions. Demand-side measures, including leakage control, metering and behavioural change, will be increasingly critical, as CCRA3 shows that only scenarios incorporating additional adaptation result in sustained supply-demand surpluses. For wastewater, targeted investment in flood-exposed sites, expansion of green-blue infrastructure, and upgrades integrating SUDs and nature-based solutions will be essential. A more systematic approach aligning water resource planning with climate risk modelling, alongside strategic catchment-wide thinking, will be critical to ensuring Scotland’s water systems remain robust and secure as climate pressures intensify (Sniffer, 2021).
Private water supplies (Lawson and Davies, 2025) serve approximately 3.5% of Scotland’s population, mostly in more remote rural areas. Risk to private supplies is less well understood, but they are likely to be particularly vulnerable to water scarcity events (DWQR, 2024). Requirements and effective measures to support climate resilient private water supplies are far less understood than public water systems, even though private water supplies are more vulnerable. At a supply-level, private water supply owners are responsible for investment to upgrade the system – and they are responsible for reporting issues such as water availability to their local authority. Private water supply owners may be eligible for a Scottish Government grant of up to £800 to improve their existing private water supply (mygov.scot, 2025), though this initiative is not focused on climate resilience. For example, a switch from surface to bore supply is considered to offer climate resilience (Rivington et al., 2020).
Climate adaptation in the water sector can also overlap with initiatives in the natural environment, particularly nature-based solutions aiming to slow run-off and increase water quality like the Loch Katrine programme (see case study 6).
Case Study 6: Loch Katrine Catchment Management, Scottish Water
Loch Katrine, located within the Loch Lomond and Trossachs National Park, is the primary source of drinking water for Glasgow. Climate modelling of key water quality parameters, under 2050 and 2080 scenarios, projects a deterioration in raw water quality beyond the treatment capacity of existing works, driven by the warmer, drier summers and more intense rainfall events associated with climate change. Without intervention, this trajectory would necessitate significant capital upgrades to Glasgow’s water treatment infrastructure.
Scottish Water, in partnership with long-term tenant Forestry and Land Scotland (FLS), has developed a 10-year Land Management Plan (LMP) for the 9,500-hectare Loch Katrine catchment, approved by Scottish Forestry in 2024 (Forestry and Land Scotland, 2023). Scottish Water will invest £11m across multiple investment periods in two core programmes: (1) 4,600 hectares of native woodland creation, largely through rewilding and natural regeneration, expanding woodland from the loch shores into higher elevations; (2) up to 2,000 hectares of peatland restoration and management – through rewetting, reprofiling, and encouraging sphagnum moss to restore the peatland’s capacity to retain water and slow surface runoff.
Peatland restoration receives co-funding through Peatland ACTION, the Scottish Government’s national programme backed by a £250m commitment to restore 250,000 hectares of peatland by 2030.
By stabilising soils and locking carbon into the landscape rather than allowing it to run off into the water environment, the catchment management measures aim to halt the modelled deterioration in raw water quality. Healthy woodland and functioning peatland slow surface runoff, reduce the volume of organic matter reaching the loch, and improve the resilience of the catchment to both drought and extreme rainfall. In doing so, the LMP is expected to offset the need for significant capital investment in treatment process upgrades that would otherwise be required, making it a proactive, nature-based alternative to reactive infrastructure expenditure. Beyond the water quality rationale, the LMP is projected to deliver over 700,000 tonnes of CO₂e sequestered over 60 years and a 40% improvement in biodiversity across the site (Scottish Water, 2026d).
Loch Katrine illustrates how proactive catchment management can function as a cost-effective climate adaptation strategy, deferring capital infrastructure costs while delivering carbon, biodiversity, and water quality co-benefits.
Current spending and context
We do not have specific information on Scottish Water’s current climate adaptation investment. However, several ongoing programmes demonstrate adaptation relevant investment. For example, Scottish Water is developing a major demand reduction programme in response to projected summer water shortages, including an estimated 260Ml/d deficit by 2050 under a 1-in-150-year drought scenario. A £1.8m domestic smart monitoring trial launched in Dundee in 2025 (2,300 monitors) is testing whether providing households with real time usage data can reduce consumption, with results expected in 2028 (Scottish Water, 2026b). This builds on a successful pilot with 3,000 business users in Inverness and Orkney and underpins a planned £60m national rollout of smart meters for 130,000 business customers (Scottish Water, 2026a). The rollout aims to achieve an 80Ml/d reduction by 2039 through reduced customer side leakage, improved network leakage detection, and behaviour change. These initiatives help reduce pressure on water resources during hotter, drier summers and strengthen overall system resilience.
Adaptation investment need
Investment need estimates were drawn from Scottish Water’s Strategic Review (SR)27 of Charges Business Plan (2027/28–2032/33) and associated technical appendix, combined with their longer-term indicative adaptation investment estimate of £2 – 5bn to 2050 (Scottish Water, 2026a; Scottish Water, 2026c). The portion of the longer-term estimate falling within the 2033–2040 research window was incorporated alongside the SR27 allocation. Note that 2026/27 is not included as these data were not available. Full details of these underlying methods, assumptions, and calculations can be found in Appendix C.
Total climate change adaptation investment requirements for Scottish Water over 2027– 2040 are estimated at between £82.1m – £189.7m per year, equivalent to £1,067.3m –£2,465.9m in 2026/27 prices (Table 22). We do not include 2026/27 as this information is not available. For SR27 (2027/28 – 2032/33), the lower estimate is £357.9m and upper estimate is £471.3m. This SR27 investment spans operational resilience (including standby generators at 52 sites to guard against storm-related power outages); asset resilience measures to address drought pressure on water supply and sewer flood risk from increasingly extreme rainfall; and catchment-scale transformation through pioneer catchment pilots and drainage partnerships. The upper estimate for SR27 also includes retained risks such as water quality and the water environment (Scottish Water, 2026a). Scottish Water has developed a long-term indicative adaptation investment estimate of £2 – 5bn to 2050. Deducting the SR27 allocation, the remaining estimate of required investment is distributed equally across annual periods from 2033/34 to 2049/50, with the portion falling within the research window (2033/34–2039/40) incorporated here.
The widening range between lower and upper adaptation estimates in later periods reflects the inherent uncertainty in projecting long-term adaptation investment need as climate risks intensify. It should also be noted that there is potential for some double counting with peatland-related climate adaptation grants for Scottish Water catchments possibly also included elsewhere in this analysis.
Table 22: Climate change adaptation investment need estimate for Scottish Water 2027– 2040 using the information from the draft SR27 business plan (including the technical annex on adaptation). All figures uplifted to 2026/27 prices (assuming 2% nominal growth per annum) from 2024/25 base prices provided by Scottish Water.
Period
Lower estimate (£m)
Upper estimate (£m)
2026/27
Not included in analysis
Not included in analysis
2027/28 – 2032/33
£357.9m
£471.3m
2033/34 – 2039/40
£709.4m
£1,994.6m
Total (£m)
£1,067.3m
£2,465.9m
Total (£m/yr)
£82.1m/yr
£189.7m/yr
Macroeconomic effects and wider impacts
Macro-economic stimulus
For macroeconomic modelling, we assumed there is £1bn adaptation investment between 2026 and 2040, approximately £67m/yr. The spending flows primarily to construction for infrastructure upgrades, with additional demand for engineering services, fabricated materials manufacturing and equipment suppliers. Note, this modelling was developed by Centre for Energy Policy at the University of Strathclyde, Scottish Water have not provided these figures.
Without cost recovery (a modelling device to isolate the spending effect): By 2040, construction gains £36m in output and 536 jobs, while architectural services add £1.8m and 27 jobs. Fabricated metals, manufacturing and wholesale/retail (vehicles) see modest supply-chain gains. The water/sewerage sector itself records a small direct gain of £1.1m and 5 jobs, and “all other services” benefits from household income spillovers, adding £10.5m and 140 jobs. The overall effect is a modest but broadly positive stimulus centred on construction and engineering supply chains.
With “industry pays” cost recovery (a stylised scenario): When Scottish Water recovers costs through higher water charges, the water/sewerage sector experiences the largest proportional loss across all scenarios examined. It shifts from a gain of £1.1m and 5 jobs to a loss of £37.5m and 156 jobs. Construction retains a reduced gain of £22m and 332 jobs because it remains central to delivering the infrastructure works, but most other sectors flip to negative impacts. “All other services” loses £24m and 345 jobs, while retail (excluding vehicles), financial services, education, manufacturing and electricity all record output and employment losses. In the CGE model, higher water charges raise business costs economy-wide, reducing competitiveness, while also acting as a regressive consumption tax on households since water is an essential service that low-income households cannot avoid.
Policy implications: An “industry pays” approach via water charges concentrates severe impacts on the water/sewerage sector itself and raises costs across all businesses and households, with regressive effects. Alternative or blended funding approaches merit serious consideration to avoid undermining both the sector and the broader economy, while recognising that these results exclude the substantial avoided benefits in terms of water security, public health and climate resilience.
Wider impacts
The economic case for adaptation investment in the water sector is strong. Evidence reviewed as part of the third UK Climate Change Risk Assessment (CCRA3) finds high benefit-to-cost ratios (BCRs) across a range of water sector measures (Watkiss, 2022). Water efficiency measures deliver the highest returns, with an average BCR of just over 10:1. So every £1 invested in water efficiency measures returns over £10 in net economic benefits. Upland peatland restoration shows similarly high but more variable returns, reflecting the site-specific nature of these investments. This is directly relevant to catchment management approaches such as the Loch Katrine Land Management Plan outlined in Case Study 6. Furthermore, flood preparedness and protection average a BCR of around 5:1, while making new infrastructure resilient averages 4:1 (Watkiss, 2022). Beyond these direct economic returns, adaptation investments frequently generate important co benefits. As well as reducing potential losses from climate change, they often deliver direct economic gains and social or environmental benefits. It is important to note that these BCRs are indicative. Actual returns are highly site and context specific, and uncertainty around the future scale of climate change means quantification of benefits remains challenging.
Current governance, funding and financing arrangements
Water provision in Scotland is in public ownership, Scottish Water is a public corporation providing potable water to 97% of households and businesses in Scotland and wastewater services to 93% (Scottish Government, 2026e). The Scottish Water business plan indicates that around 90% of all the cost of providing water and wastewater services is met by customer charges, with the remainder (£170m a year) met by Scottish Government (Scottish Water, 2025a).
Scottish Water’s regulated business supplies water and wastewater services to households and is also the wholesaler to the water retail market for businesses in Scotland. For the financial year 2024/25, around 73% of the total income was from households, with the remainder from wholesale businesses (Scottish Water, 2025b). See Table 23 for recent regulated business revenue.
Table 23: Scottish Water regulated business revenue. Decreases shown in brackets. Source: Scottish Water (2025b)
FY25 (£m)
FY24 (£m)
Increase/(decrease) (£m)
Household
£1,154m
£1,050m
£104m
Wholesale
£410m
£382m
£28m
Other
£15m
£17m
£(2)m
Total revenue
£1,579m
£1,449m
£130m
Beyond its core regulated business, Business Stream, Scottish Water’s retail subsidiary, competes as a licensed provider in both the Scottish and English markets, holding around a 20% share of the English market. It operates under a Governance Code agreed with the Water Industry Commission for Scotland and has its own independent board and management team. Non-regulated commercial activities, including renewable energy and innovative water technologies, are undertaken separately through Scottish Water Horizons (Scottish Water, 2025b).
The organisation has previously used Private Finance Initiative (PFI) models to finance infrastructure investment. However, these have run their course and over the next SR period, all but one of the PFI contracts will return to public ownership. The intention in the business plan is to keep all lending the same, and for additional investments in the network to be covered by user charges.
For the purposes of this study, we assume that the majority of the costs of adaptation are paid through Scottish Households and businesses, since the relative surplus from the other activities are relatively low (Business stream group had an £18m surplus before tax). The arrangements are set out Figure 12.
Going forward, Scottish Water expects the nominal borrowing from Scottish Government to stay the same, and the increased expenditure to be funded through households and businesses. The current business plan projects the proportion of expenditure to rise from 90% to 94% (Scottish Water, 2026c).
Figure 12: Financing, funding, and delivery arrangements for water and wastewater adaptation investment in Scotland.
Innovation that could boost private sector participation
In the water sector, options to boost private sector participation are more constrained given that Scottish Water operates as a publicly owned utility and the majority of investment is already funded through consumer bills.
There are also a spectrum of options relating to private financing (Table 24). The first is a basket of financing arrangements (Sustainability linked finance, Collective Investment Vehicles) that can be used but require long-term commitments to repayment or creation of revenue streams. However, in reality, their potential is likely to be limited since borrowing terms from Scottish Government are likely to be highly attractive, and future investment may also be linked to the plans for a new Scottish government bond. Full privatisation, while theoretically a financing option, is not considered a realistic or desirable pathway in the Scottish context.
There are also models which support private financing of specific assets, such as Public private partnerships (PPPs). However, while PPPs have previously been used to finance investment in Scottish Water infrastructure, the current direction of travel, bringing such infrastructure into public use, suggests limited appetite in practice.
Finally, there are alternatives which enhance contributions from businesses and consumers due to water-related benefits. In relation to billing, there are also alternative options for enhancing cost recovery through water tariffs. Many households in Scotland do not have water meters and are charged for installation, so such a programme could incentivise use and more accurately reflect usage. There is also the potential to enhance contributions from large businesses and landowners. For example, in Scotland, Diageo are already investing in upstream peatland restoration for flood management at their distillery. These may be able to be extended to cover akin to water funds which co-invest to improve efficiency and costs. It also noted that the hydrogen and digital sectors are also likely to increase water demand, and so may offer further potential. Developing clearer frameworks for how such investments are valued and attributed across multiple beneficiaries would help unlock this potential at greater scale.
Table 24: Examples of innovative models for private participation in water with cost recovery model. Source: authors, updated from Watkiss and England (2025).
Model
Examples
Cost recovery model
PFI/ PPP
Kigali Bulk Water Project (Rwanda) (Blended Finance Taskforce and Systemiq, n.d.)
User pays and government pays
Water Funds
Norfolk Water Fund TNC
User pays
Collective Investment Vehicles
Water Equity Global Access Fund IV (Heading For Change, n.d.)
User pays
Sustainability-linked finance
Pennon Group Green Finance Framework (UK) (Pennon, 2024)
User pays
Syndicated Loans
Enhancing Water and Sanitation Resilience with IDB Invest and partners (Brazil) (IDB Invest, 2025
User pays
Securitization, Guarantees and Credit Enhancement
Water Finance Facility (Kenya) Pooled Water Fund (Blended Finance Taskforce and Systemiq, n.d.)
User pays
Project aggregation
Climate Adaptation Notes
User pays
Micro finance
Water Credit Initiative (Water.org, n.d.)
User pays
Supply chain finance
Sanivation (Africa) (Sanivation, n.d.)
Government pays and private sector pays / new revenue model
Metering
CityTaps (Kenya) (The Global Innovation Fun, n.d.)
User pays through more accurate charging
Summary of findings
The evidence base on the cost of climate adaption in Scotland -and how this will change with time – is limited.
This study aimed to develop and test a preliminary approach that could be used to inform the potential indicative costs of climate adaptation across a range of sectors in Scotland.
We use a multi method approach to explore four dimensions: investment needs, the macroeconomic effects of such needs, public-private funding splits, and scope to mobilise private capital. Here, we present the key findings from the work which focussed on areas within five sectors: agriculture, communities (flooding), natural environment (woodland creation, peatland restoration and nature restoration), transport (trunk roads and motorways and railways), and water (public water and wastewater services).
Investigating climate change adaptation investment need
Investment needs were estimated using a pragmatic, multi-method approach tailored to the data availability and evidence maturity of each sector. Methods included drawing on existing sectoral analyses, applying climate-proofing uplifts to Scottish Government budget lines, scaling from UK-wide research, and using expert judgement to apportion investment with mixed objectives directly to adaptation.
We find that climate adaptation investment need for the five analysed sectors totals £7.8–£14.2 billion for 2026–2040, or £566–£1,027 million per year (Table 25).
Table 25: Summary of estimated climate change adaptation investment need for areas within the five sectors included in our study, for the period 2026 – 2040 (2026/27 prices). Where available, current budget (or estimates) are presented alongside estimated investment need, with a RAG rating indicating whether current spend meets the estimated need (green), falls within 20% below it (amber), or is more than 20% below it (red). An expert-elicited investment need estimate confidence rating is assigned to each sector/sub-sector estimate, alongside the primary source from which it was derived. *Note Scottish Water estimates are for 13 years from 2027– 2040.
The macroeconomic effects of investing in climate adaptation
While a full assessment of the macroeconomic costs and benefits of adaptation was beyond the scope of this report, the study used a Computable General Equilibrium (CGE) model of the Scottish economy to explore the direct economic effects of adaptation spending across sectors and consider how different approaches to cost recovery affect economic activity, employment, and household incomes.
The modelling shows that adaptation spending can generate a positive economic stimulus during the investment period across all sectors studied. However, the way costs are recovered matters considerably, with effects varying by sector and recovery mechanism:
Agriculture: Adaptation spending would stimulate construction, manufacturing, and agricultural supply chains. However, recovering costs through higher food prices would disproportionately affect lower-income households and risk significant job losses given agriculture’s labour-intensive nature.
Communities: Flood adaptation would generate meaningful local gains in construction and professional services. If costs were recovered through income tax, broader consumer spending would be dampened, with retail and service sectors potentially flipping from gains to losses.
Natural environment: Land-based restoration would generate substantial rural employment gains, particularly in forestry and land-use sectors. Recovery through public spending cuts could produce widespread losses across service, education, and public administration sectors that outweigh the direct stimulus.
Transport (roads and rail): Adaptation spending would deliver broad-based construction and supply-chain gains. Income-tax recovery could erode much of this stimulus, particularly affecting consumer-facing sectors and export competitiveness.
Water: Recovering costs through higher water charges would concentrate severe impacts on the water sector itself and could act as a regressive tax on households and businesses for whom water is an unavoidable essential service.
These results should not be interpreted as a full cost-benefit assessment of adaptation. The modelling captures the demand-side effects of spending and cost recovery, but does not account for avoided climate damages, residual risks, or the broader triple dividend of adaptation.
Current funding and financing arrangements
For each of the areas within the five sectors included in our study, we calculated indicative estimates of the current and future contributions from the private sector towards adaptation investment. These are highly speculative and represent a first pass attempt at quantifying the current and potential contributions of the private sector to adaptation costs.
We find that currently investment is predominantly public across most sectors and sub-sectors. Private contributions range from negligible (peatland restoration) to around a third (agriculture). Water represents a notable exception where approximately 90% of costs are met through household and business customer charges. These are shown below, alongside the typical levels of financial returns for the activities (Table 26).
Table 26: Current and future maximum potential of private sector contributions to adaptation. Private sector contributions include households, businesses and financial institutions. Source: Updated from Watkiss and England, 2025.
Sector
Nature of Investment in baseline (Scotland)
Typical level of financial returns without innovation
Private sector contributions (funding and finance)
Public
Below-market
Commercial Returns
Current
Future (Potential)
Agriculture
Mixed
X
X
X
33%
35%
Communities – Flood protection.
Mixed (Public for protection, early warning and NBS, private for household measures)
X
7%
15%
Natural environment – Peatland
Public
X
0%
5 – 10%
Natural environment – Forestry
Mixed
X
X
x
Not quantified
Not quantified
Natural environment – Nature restoration
Public
X
0%
10%
Transport – Rail
Mixed
X
X
40%
45%
Transport – Road
Mixed
X
X
10%
15%
Water
Private
X
X
90%
100%
Innovations that could boost private sector participation
Opportunities to increase private sector contributions vary considerably by sector (Table 25). They include blended finance and parametric insurance in agriculture; green bonds, land value capture, and property-level flood resilience schemes for flooding; biodiversity and carbon credits alongside payment for ecosystem services in the natural environment; road user charging, tolls, and collective investment vehicles in transport; and water funds and sustainability-linked finance in the water sector, though options here are more constrained given Scottish Water’s public ownership model.
It was not possible to apply these estimates to the total figures for adaptation spend due to methodological differences in scope. However, the results suggest that for the five sectors explored, there is modest potential to boost private sector participation in adaptation funding and financing. While the numbers are modest in percentage terms, this nonetheless highlights real opportunity to increase private contributions, which will become increasingly important as costs are projected to rise significantly. Scottish Government and associated non-departmental public bodies should therefore consider this as part of the development of SNAP4.
Who pays for adaptation?
A clear structural tension running through all five sectors is the question of who pays for adaptation. Private finance can help meet upfront costs but rarely reduces the underlying funding burden. Costs are frequently transferred back to government or consumers, meaning private sector participation should be understood as complementary to, rather than a substitute for, public funding. This is reinforced by the nature of Scotland’s adaptation priorities. The majority of these fall within Type A and B categories (see Section 2.2 and Figure 3), implying that approximately three-quarters of investment needs must be publicly funded. Scaling private participation will therefore require active policy intervention, enabling conditions, and public co-financing to de-risk investment – it will not emerge through market forces alone.
How adaptation costs are ultimately recovered also has significant distributional consequences: income-tax funding spreads cost progressively but suppresses household consumption, while price-based approaches risk being regressive in essential sectors such as agriculture. Funding design is therefore as consequential as investment scale.
Across all sectors, the co-benefits of adaptation investment – avoided losses, economic stimulus, and socio-environmental gains – can substantially strengthen the economic rationale for action, particularly from a public sector perspective. However, these benefits are rarely fully monetised, meaning investment cases are systematically understated. Crucially, while co-benefits reinforce the public sector case for sustained funding, they do not necessarily translate into financial returns for private investors. This distinction helps explain the persistent gap between headline benefit-cost ratios and the limited appetite of private capital for adaptation investment.
Uncertainties and challenges
Our findings are a first attempt to quantify Scotland’s climate adaptation investment need across five sectors and should be interpreted accordingly. Significant uncertainties and methodological limitations attach to each dimension of the analysis.
Adaptation investment need estimates
Costing approaches vary considerably, from detailed sector/subsector assessments (rail, water), to climate-proofing uplifts on budget lines (roads), to apportionment of mixed-objective spend (natural environment), to value transfer approaches (communities – flood protection schemes). The breadth of approaches limits comparability across sectors and introduces varying degrees of uncertainty, as reflected in the confidence ratings in Table 23. The investment estimates presented in this report are indicative and order-of-magnitude in nature.
Key challenges and wider sources of uncertainty include:
Undefined risk tolerance thresholds
Without agreed adaptation objectives or acceptable risk levels for each sector, investment need cannot be scaled against a definitive end-goal. The figures we present reflect assumptions about continued or modestly scaled-up spending rather than what might be required to meet specific resilience outcomes.
Partial sectoral coverage
Many sectors such as energy, telecommunications, and health were not included in our analysis due to resource constraints. Furthermore, the sectors included in our analysis are only partially covered. For example, for transport, we included only rail infrastructure and motorway and trunk roads, we did not include local road networks, ferries, aviation, canals, and active travel. The communities sectoral analysis focused on flood risk management only. Adaptation investment needs for storm, drought, coastal erosion, heat risks and other factors that will affect communities were not considered.
Deep uncertainty in underlying drivers
Future climate trajectories, socio-economic and geopolitical change all remain uncertain.
Mixed objective apportionment
Apportionment fractions, (for example, the adaptation share attached to peatland restoration, woodland creation, and agricultural support) carry considerable uncertainty. They were derived through exploring the listed multiple objectives of each investment area and then using expert elicitation to attach an estimate apportionment, rather than empirical evidence.
Risk of double-counting
In some areas, the same expenditure may be captured under more than one sector. For example, peatland grants administered through Scottish Water catchment programmes may overlap with peatland restoration budgets counted within the natural environment sector.
Public-private investment split
The estimates of current and potential private sector contributions to adaptation funding are highly speculative and should be treated as illustrative rather than definitive. This relates to the following challenges:
Limited baseline data
Private sector adaptation expenditure is largely unrecorded across all five sectors. In agriculture, it is folded into support payment income streams; in transport, it is estimated from aggregate local government finance data; in water, it reflects consumer billing structures rather than genuine private risk-bearing. These limitations make cross-sector comparisons unreliable.
Definitional ambiguity between financing and funding
Instruments such as green bonds, sustainability-linked loans, or PPP arrangements can mobilise upfront private capital, but costs are typically repaid through public budgets, regulated consumer charges, or government guarantees. Private participation therefore tends to alter the timing and vehicle of finance without necessarily reducing the public funding burden.
Rapidly shifting governance landscape
The consolidation of rail services under Great British Rail, development of Scottish Government bond issuance mechanisms, and evolving frameworks for biodiversity and carbon credits could all materially alter funding arrangements over the period to 2040, making future contribution estimates uncertain.
Structural limits on private participation
Most of Scotland’s adaptation priorities fall within Type A or B categories (public goods or mixed-benefit activities with below-market returns). This means the majority of climate adaptation investment needs are likely to require public funding regardless of innovation in finance mechanisms.
Capturing wider co-benefits
The economic case for adaptation investment is substantially strengthened when the full triple dividend is considered. However, this report’s treatment of co-benefits is partial:
Limited co-benefits quantification in several sectors
Across all sectors, we have not explored the avoided losses of adaptation due to resource constraints.
Excluding economic stimulus, we have provided minimal evidence for the wider social, economic and environmental co-benefits of adaptation.
Where estimates are provided, notably for peatland restoration and woodland creation, these draw on literature values that carry their own uncertainty ranges and depend heavily on the pace and scale of successful delivery. More research is needed to capture the co-benefits of adaptation investment across Scotland.
Attribution challenges
Where adaptation investment delivers multiple outcomes, assigning economic value to the adaptation-specific component requires further subjective apportionment. The same hectare of restored peatland contributes to carbon sequestration, biodiversity gain, flood management, and water quality improvement simultaneously, making clean attribution inherently imprecise.
Conflation of societal and financial returns
High benefit-cost ratios in the literature typically reflect economic and environmental returns measured at a societal level, including non-market values that generate no cash flow. Private investors assess financial returns, incremental revenues and recoverable costs, which are considerably lower. Consequently, treating strong societal co-benefit ratios as evidence of private investment attractiveness risks overstating the potential for private finance mobilisation.
Recommended priorities
Recommended research priorities
While this project provides a first estimate of Scotland’s adaptation investment needs, it has identified significant gaps that require further data, research and analysis.
Adaptation objectives and risk tolerance
Develop specific, quantified adaptation targets and sector-specific risk tolerance thresholds aligned with climate scenarios and socioeconomic assumptions.
Use these objectives to enable meaningful gap analysis between current spending and investment need, and to support the development of SNAP4.
Asset-level vulnerability and investment pipelines
Develop comprehensive, spatially referenced vulnerability inventories across all five sectors included in this analysis.
Move from broad climate vulnerability assessments to spatially specific prioritisation of sites, assets, and interventions, building on existing work such as the Transport Scotland VLOG prioritisation tool and the Network Rail Scotland Adaptation Pathways Programme.
Integrate existing data sources, including Coastal Climate Adaptation Plans, SEPA flood risk assessments, and emerging sectoral tools, into the development of future adaptation investment plans.
Financial transparency and attribution
Improve the granularity in public budget reporting, including clearer disaggregation of adaptation spend from mitigation, and other objectives.
Undertake dedicated methodological work in agriculture to isolate the adaptation-specific component of spending and assess whether current budgets levels are appropriate for changing climate risks.
Triple dividend
Avoided losses: build the evidence base on avoided losses associated with adaptation investment across all sectors in Scotland, drawing on top-down modelling approaches and/or sector-specific data sources where available.
Economic stimulus: quantify the economic stimulus effects of adaptation investment, including employment, supply chain, and distributional impacts. CGE modelling offers a promising approach for capturing these macroeconomic and regional effects.
Social and environmental co-benefits: assess the wider social and environmental co-benefits of adaptation investment across sectors. This research could include a combination of reviewing existing literature and associated data, wider stakeholder engagement and/or practical field-based research for sectors such as natural environment and agriculture.
Distributional impacts
Conduct targeted research on the distributional consequences of different financing approaches – income-tax, price-based, and charge-based – and on compensating policy measures to support more equitable funding design.
Cross-sector collaboration
Develop mechanisms and spaces to share adaptation research and delivery across sectors, building on existing forums such as the Climate Ready Infrastructure Scotland (CRIS) Forum.
Further explore efficiency gains from catchment-scale management approaches, where investment simultaneously delivers water quality, biodiversity, flood management, and carbon sequestration benefits.
Map how adaptation priorities can be embedded within existing cross-cutting frameworks spanning civil contingencies, biodiversity governance, spatial planning, and infrastructure regulation, with Local Resilience Partnerships and the Scottish Wildfire Forum as existing entry points.
Prioritisation
A further challenge that cuts across all sectors is how to prioritise adaptation investment when resources are constrained. Standard cost-benefit frameworks tend to favour investment in areas of dense population, maximising the number of beneficiaries per pound spent, for example directing flood protection spending towards urban centres. However, several of the sectors and sub-sectors assessed in this report are most acutely exposed to climate risk in rural and remote areas. This includes transport routes, agricultural land, peatland, and water supplies serving dispersed communities. This creates a structural tension between economic efficiency and equity and raises important questions about who adaptation investment is designed to protect. Future work should explore how prioritisation frameworks can be developed that explicitly account for rural vulnerability, social equity, and Just Transition principles alongside conventional cost-benefit criteria ensuring that investment decisions do not systematically disadvantage the people and environment that face the greatest climate exposure.
Recommended strategic priorities for adaptation investment
A national strategy for adaptation investment must begin by recognising that different sectors are at different stages of the adaptation investment cycle. For example, in communities, the priority is shifting from capacity building towards delivery, mobilising resources for property flood resilience and scaling flood protection schemes at pace. In transport, the immediate need is moving from risk assessment and vulnerability mapping towards robust costing and prioritised investment programmes. In the natural environment, the strategic focus could be to further develop the private finance ecosystem, accelerating the maturity of biodiversity credit and voluntary carbon markets to draw in private capital at scale.
Across all sectors, there is value in ensuring that adaptation objectives are embedded within existing spending programmes. For example, infrastructure maintenance, rural development funding, housing retrofit, and land management schemes. This requires improved budget tagging, clearer apportionment guidance, and stronger policy levers to ensure that co-funded programmes deliver credible adaptation outcomes alongside their primary objectives.
Private finance mobilisation also requires a more coherent national approach. While opportunities exist across all five sectors, they are currently fragmented, small-scale, and unevenly distributed. A clearer national strategy should identify which mechanisms are most appropriate for each sector, what enabling conditions are required, and how public co-financing can be used most effectively to de-risk private investment. This could include drawing on international experience with blended finance, green bonds, and nature finance markets, while remaining realistic about the fundamental limits of private capital in funding what are, in most cases, public goods. Underpinning all of this is the need for an improved monitoring and evaluation framework for adaptation investment specifically. As adaptation investment programmes scale up, a consistent and transparent approach to tracking expenditure, outputs, and outcomes across sectors will be essential for accountability, learning, and iterative improvement, aligned with the SNAP3 requirements but going further to capture financial flows and asset-level progress.
A summary of the recommended strategic priorities for adaptation investment is provided in Box 2 below.
Box 2: Summary of strategic priorities for adaptation investment
The development of quantified adaptation targets and asset-level vulnerability inventories are the most important near-term research priorities, providing the foundations for robust investment need estimates and long-term adaptation pathways.
The improvement of financial attribution through improved budget tagging, clearer disaggregation of adaptation from co-objectives, and fuller quantification of the triple dividend, is important for making a credible and comprehensive economic case for sustained public investment.
Cross-sector collaboration, both in sharing research and delivery costs and in embedding adaptation within existing governance networks, offers significant efficiency gains that are currently underexploited.
Investment strategies must be sector-differentiated, reflecting where each sector sits in the adaptation cycle, and focused on building investment-ready pipelines capable of attracting both public and private finance at scale.
A shared monitoring and evaluation framework, specifically focused on adaptation investment, aligned with SNAP3, but capturing financial flows and asset-level outcomes, is a precondition for accountability and iterative improvement as the Scottish adaptation programme expands.
Acknowledgements
We would firstly like to thank the Scottish Government and ClimateXChange for their continued support with this project.
We would also like to thank the organisations and individuals that contributed information and/or case studies to this report, including: Scottish Water, Network Rail Scotland, Transport Scotland, FloodRe, University of Strathclyde, Hope in Place CIC and NatureScot.
Additionally, we would like to thank the individuals that contributed to preparing this report and analysis, including David Sturgess and Adam Hughes-Buchanan (both University of Strathclyde) and Andrew Moxey and Paul Watkiss (both Paul Watkiss Associates).
Finally, we would like to acknowledge the support from ATTENUATE project for their contributions on the conceptual framing, costing and financing (funded by UK Research & Innovation; grant number UKRI282). ATTENUATE is a collaborative project focused on unlocking private sector funding for climate adaptation, building the case for greater public sector investment, and addressing governance barriers to investment and is supported by the UKRI-Defra ‘Maximising UK Adaptation to Climate Change’ programme. For more information, see www.lse.ac.uk/granthaminstitute/projects/attenuate.
References
Asian Development Bank (2026) Climate Adaptation Investment Plan for the Water Sector in Bhutan.
Bebber, D. P., Maclean, I. M., Mosedale, J. R., & Youngman, B. D. (2025). Potential impacts of plant pests and diseases on trees and forests in the United Kingdom. Plants, People, Planet, 7(5), 1538-1550.
Bosello, F., Standardi, G., Parrado, R., Dasgupta, S., Guastella, G., Rizzati, M., Pareglio, S., Schleypen, J., Boere, E., Batka, M., Valin, H., Bodirsky, B., Lincke, D., Tiggeloven, T., & van Ginkel, K. (2020). D2.7: Macroeconomic, spatially‑resolved impact assessment (Version 0.6, revised March 2022). COACCH Project, Horizon 2020 Grant Agreement No. 776479. https://www.coacch.eu/wp-content/uploads/2018/03/D2.7_revMAR2022.pdf
Brett, L., Cha, Y., & White, C. J. (2026). Impactful Weather and Multi‐Hazard Events: Lived Experiences From Rural Scotland. Climate Resilience and Sustainability, 5(1), e70035.
Climate Change Committee (CCC) (2022). The just transition and climate change adaptation. Available at: https://www.theccc.org.uk/wp-content/uploads/2022/03/CCC-The-just-transition-and-climate-change-adaptation.pdf (Accessed: 09/03/2026).
Climate Ready Clyde (2021). Glasgow City Region Climate Adaptation Strategy and Action Plan: Finance Adaptation Gap Estimates 2018/19. Climate Ready Clyde Secretariat, supported by Paul Watkiss Associates. Available at: https://climatereadyclyde.org.uk/wp-content/uploads/2021/06/15-Finance-Adaptation-Gap-Estimates.pdf
Climate Policy Initiative (CPI) (2025) ‘Global Landscape of Climate Finance 2024. Insights for COP29’. Available at: https://www.climatepolicyinitiative. org/publication/global-landscape-of-climate-finance-2024/
Croatian Parliament (2020) Strategy for Adaptation to Climate Change in the Republic of Croatia for the Period up to 2040 with a View to 2070. Zagreb: Hrvatski sabor. Available at: https://narodne-novine.nn.hr/clanci/sluzbeni/2020_04_46_921.html (Accessed: 10/11/25, 15:00).
Greenhill, S., Hsiang, S., Balboni, C., Barrage, Bolliger I. W., , Boomhower, J., Diaz, D., Hannah Druckenmiller, Teevrat Garg, Miyuki Hino, Harrison Hong, Carolyn Kousky, Jeremy Martinich, Ishan Nath, Kimberly L. Oremus, R. Jisung Park, Toan Phan, Jonathan Proctor, Will Rafey, Marcus C. Sarofim, Schlenker, W., and Simon, B. (2026) Using markets to adapt to climate change. Science 391,662-664.DOI:10.1126/science.aea7431https://www.science.org/doi/10.1126/science.aea7431
Multilateral Development Bank (2023). 2022 Joint Report on Multilateral Development Banks’ Climate Finance. Available at: https://doi.org/10.18235/0005182
Morris, J., & Camino, M. (2011). Economic assessment of freshwater, wetland and floodplain (FWF) ecosystem services. UK National Ecosystem Assessment Working Paper, Cranfield University.
Neumann, T., Martinez Botia, L., de Goër de Herve, M., Zink, V., Tröltzsch, J. & Tarpey, J. (2025). Knowledge development and application concerning costs of adaptation compared to costs of inaction: Final report. European Environment Agency. Available at: https://www.ecologic.eu/sites/default/files/publication/2026/Knowledge-adaptation-costs-70812.pdf (Accessed: 07/01/2026).
OECD (2023) ‘Scaling Up Adaptation Finance in Developing Countries: Challenges and Opportunities for International Providers, Green Finance and Investment’, OECD Publishing, Paris, https://doi.org/10.1787/b0878862-en.
Sayers, P., Penning-Rowsell, E. C., & Horritt, M. (2018). Flood vulnerability, risk, and social disadvantage: current and future patterns in the UK. Regional environmental change, 18(2), 339-352.
Rivington, M., Akoumianaki, I and Coull, M. (2020). Private Water Supplies and Climate Change The likely impacts of climate change (amount, frequency and distribution of precipitation), and the resilience of private water supplies. CRW2018_05. Scotland’s Centre of Expertise for Waters (CREW). Available online at: crew.ac.uk/publications.
Shanahan, D., Bush, R., Gaston, K. et al. (2016) Health Benefits from Nature Experiences Depend on Dose. Sci Rep 6, 28551. Available at: https://doi.org/10.1038/srep28551.
Song, C., Atun, F., Blanford, J. I., & Anthony, C. (2025). Impact of flooding on the social and mental health of older adults-A scoping review. Water Security, 25, 100190.
Taylor, R., England, K. and Eggert, A. L. (2025) Developing an Adaptation Investment Plan. Guidance for facilitators. Deliverable 3.1 of the CLIMATEFIT project.
United Nations Environment Programme (2024). Adaptation Gap Report 2024: Come hell and high water — As fires and floods hit the poor hardest, it is time for the world to step up adaptation actions. Nairobi. Available at: https://doi.org/10.59117 /20.500.11822/46497.
Watkiss, P., England., K., Hunt, A., Watkiss, O and Sayer. P. (2026a) The Costs of Adaptation: Analysis of the National Adaptation Programme 3. Supporting research to the Climate Change Committee. March 2026
Watkiss, P., England., K., Hunt, A., Watkiss, O and Sayer. P. (2026b) The Costs of Adaptation for UK Transport and Land Systems. Supporting research to the Climate Change Committee. March 2026
Westerhof, S. G., Booij, M. J., Van den Berg, M. C. J., Huting, R. J. M., & Warmink, J. J. (2023). Uncertainty analysis of risk-based flood safety standards in the Netherlands through a scenario-based approach. International Journal of River Basin Management, 21(3), 559–574. https://doi.org/10.1080/15715124.2022.2060243
Woodland Carbon Code (2026) The Quality Assurance Standard for UK Woodland Carbon Projects. Available at: https://www.woodlandcarboncode.org.uk/ (Accessed: 09/12/26, 10:00)
World Bank (2019). Bangladesh Climate-Smart Agriculture Investment Plan: Investment Opportunities in the Agriculture Sector’s Transition to a Climate Resilient Growth Path. World Bank. Available at: http://hdl.handle.net/10986/32742
Decision tree for assessing private sector potential in adaptation. Image source: ADB, 2026.
Detailed methods: Network Rail Scotland
Network Rail Scotland calculated future adaptation investment needs using UKCP18 climate projections under two scenarios: RCP 6.0 (medium emissions, ~2°C warming by c.2055) and RCP 8.5 (high emissions, ~2°C by c.2045, ~4°C by c.2080). The analysis assumed maintaining current service levels and asset condition at Control Period 7 (CP7) * exit levels, aligned with CCC guidance from October 2025. However, it is important to note that this represents just one potential ‘investment future’. Ultimately there are multiple other plausible futures (including changes to service provision targets, transport modal shift, prioritisation of investment in rail, changes to safety tolerance levels, or other external factors) that would all likely have different adaptation investment needs associated with them.
Currently, Network Rail Scotland uses two complementary approaches to track weather and climate resilience investment for CP7. The top-down approach assesses standardised intervention types and applies nationally agreed percentages to reflect their contribution to resilience (e.g., 100% of cost attributed to drainage renewals would count towards ‘resilience’, recognising that this type of intervention is fundamentally about the management of water on their infrastructure. Whereas only 50% of the cost associated with overhead line renewals would contribute to resilience, recognising that the driver of renewal is likely condition of asset, but that the renewed asset is inherently more resilient to hot weather). A bottom-up approach uses expert-led qualitative engineering assessment to identify specific schemes contributing to network resilience. Together, the two approaches established a CP7 baseline of £400m total in asset interventions that deliver a weather and/or climate resilience benefit (2024/25–2028/29).
Network Rail Scotland’s future potential adaptation investment calculations are structured across multiple cost categories: operations and support (operational response to extreme weather, seasonal treatment trains, emergency speed restrictions); maintenance (preventative and reactive maintenance, inspections, monitoring); network resilience renewals catch-up (addressing current renewal backlog); network resilience renewals additional (business-as-usual renewals responding to enhanced asset degradation from climate change); and location-specific renewals (targeted interventions at sites with specific weather and climate challenges). Furthermore, estimates for major capital interventions – large-scale transformational schemes where continued operations would otherwise be impossible as a result of changing climate – are also calculated, though with a large uncertainty range.
For each category, subject matter experts developed cost ranges based on considerations such as historical data, operational experience, climate projections, asset models maintained by Network Rail Technical Authority, and anticipated increases in weather event frequency and severity. Estimates were produced for both operations, support, maintenance, and renewals (OSMR), as well as OSMR combined with the additional inclusion of major capital interventions. The estimates produced represent additional investment required in each of CP8 (2029/30–2033/34) and CP9 (2034/35–2038/39) above CP7 baseline levels.
For our research period 2026/27–2039/40, we assumed the following: CP7 remaining spend from 2026/27 onwards; full CP8 investment estimates; full CP9 investment estimates; and, a pro-rated single year for 2039/40 (one-fifth of CP9 costs). All figures from Network Rail Scotland were quoted in 2023/24 prices and uplifted to 2026/27 prices. These figures assume maintaining a broadly similar service level and asset condition to that of CP7 and should be interpreted as one plausible investment future only.
Network Rail Scotland are undertaking active work to refine and improve these cost estimates. As part of their Adaptation Pathways Programme, they are working at pace to understand what potentially vulnerable locations may require future adaptation investment – the outputs of this work will allow them to narrow the indicative investment cost ranges included in this study.
* A Control Period is Network Rail’s fixed five‑year funding and planning cycle that sets budgets and outputs for the railway (e.g., CP7: 1 Apr 2024 – 31 Mar 2029).
Detailed methods: Scottish Water
Scottish Water uses a wide range of climate and operational models to understand how future weather will affect its services in the Strategic Review (SR) SR27. This includes UKCP18 climate projections, water-resource models to assess drought impacts, catchment-deterioration models to understand future water-quality risks, rainfall-uplift and flood-modelling tools developed with UKWIR, Newcastle University and the Met Office, and mapping of flood and coastal-erosion exposure using SEPA flood maps and Dynamic Coast. Together, these tools allow Scottish Water to test resilience under both +2°C and +4°C global-warming scenarios.
Using these models, Scottish Water assessed 126 climate-related risks. Each risk was evaluated for both likelihood and impact, covering potential effects on customers, compliance, finances, health and the environment. This structured assessment helps the organisation prioritise where adaptation is most urgent and where investment will deliver the greatest resilience benefits.
Scottish Water’s adaptation actions fall into three categories: operational resilience, asset resilience, and service transformation. Most adaptation is embedded within core investment programmes, for example upgrading water-supply systems, wastewater networks and treatment works to cope with future rainfall and drought conditions. Some actions are key-driver investments where climate change is the primary reason for action, while others are retained risks where climate impacts are recognised but investment is not yet justified. A smaller set of actions are transformational, such as blue-green infrastructure, catchment-scale nature-based solutions and customer behaviour-change programmes.
For long-term planning, Scottish Water planning experts and technical consultants used early qualitative risk assessments to develop an indicative £2–5bn investment estimate for climate adaptation up to 2050. For the research period 2027/28–2039/40, SR27 spend (2027/28–2032/33) is taken directly from Scottish Water’s draft SR27 business plan. For the period 2033/34 onwards, the remaining budget — calculated by deducting the SR27 allocation from the lower and upper bounds of the £2–5bn long-term estimate — is distributed equally across annual periods from 2033/34 to 2049/50, with only the portion falling within the research window (2033/34–2039/40) included in the totals presented here. All figures provided by Scottish Water in 2024/25 prices have been uplifted to 2026/27 prices assuming 2% nominal growth per annum
Detailed methods and analysis: Modelling the economy-wide impacts of climate change adaptation spending.
Methodology:
For this work we have used the AMOSENVI, computable general equilibrium (CGE) model of the Scottish economy. The model captures all the sectors of the Scottish economy, aggregated into 30 broader sectors to allow us to trace the interactions between sectors and identify the drivers behind the results we observe. This is one of the key strengths of CGE modelling; it allows us to capture how the spending of different sectors to adapt to climate change affect prices and through that the wider Scottish economy.
Our model uses the 2019 edition of the Scottish Input-Output (IO) tables, published annually by the Scottish Government. This version is the latest currently available, where the Scottish economy is not affected by the Covid-19 pandemic or the Russian invasion of Ukraine and the impact it had on international energy prices. This way, 2019 data allow us to study how climate change adaptation spending might impact a version of the Scottish economy unaffected by major international incidents.
In our model, we assume that Scottish workers have the power to bargain for their wages, which is inversely related to the unemployment rate in the Scottish economy. This way, when unemployment is low, workers have the ability to bargain for higher wages and vice versa. However, we also assume that Scotland is an open economy, meaning that workers can freely migrate in and out of Scotland. When Scottish unemployment is lower and real wages are higher compared to the rest of UK (RUK) and the rest of the world (ROW), workers migrate to Scotland, increasing the labour supply. The opposite is true when Scotland experiences high unemployment and low real wages.
Wages are mostly important for the consumption of households. In this version of AMOSENVI, households are disaggregated to quintiles based on their gross income, with HG1 including 20% of the lowest income households and HG5 including 20% of the highest income households. Not all households are affected in the same way from changes in the economy, such as the climate adaptation spending, so this disaggregation allows us to capture the distributional impacts across the different household income groups. Households consume based on their disposable income, which is affected, apart from the wage and employment levels, from taxation such as income tax.
Income tax is a key, but not the only, source of revenue for the Scottish Government, which our model also includes. The income tax rate is normally fixed, but we also include scenarios where the income tax rate is adjusted to cover the cost of climate change adaptations in different sectors. Apart from raising revenue, the government also purchases goods and services from Scotland, RUK and abroad. Typically, government spending is fixed in real terms. However, for this work we use the government spending as a mechanism to model the adaptation spending.
Modelling adaptation spending
For the purpose of this work, we assume that climate change adaptation is a form of capital spending that does not create additional production capital for production sectors. Instead, it allows them to maintain the same production capacity, which would be at risk in the face of climate change.
This assumption has two main implications:
The breakdown of each sector’s spending matches where they would spend their investments to create new capital or to maintain their existing capital.
Climate change adaptation is a one-off spending. Once it is concluded and the associated cost is recovered, there is not further impact to the Scottish economy, which is gradually returning to its pre-spending level.
The latter assumption can be altered to assume the need for recurring spendings to address the challenges of climate change on an ongoing basis. However, to model the ongoing spending, more information is necessary to estimate how the adaptation cost might change over time and as climate change intensifies. Hence, we have opted to model a one-off spending based on the information currently available to us.
In terms of the spending, we model it as additional government purchases by the Scottish Government. Subsequently, we model the cost recovery in two main ways, depending on the sector that is adapting to climate change. We model a ‘government pays’ approach, where government covers the adaptation cost and raises the income tax to raise the necessary funds. Alternatively, we model an ‘industry pays’ approach, where the government still makes the necessary purchases of goods and services and then increases the indirect business tax rate of the adapting sectors so that they cover the adaptation cost.
Table D1: Climate adaptation spending in different parts of the Scottish economy (in 2025 prices).
Sector
Sub-sector
Investment estimate 2026-2040 (£m)
Investment estimate 2026-2040 (£m/yr)
Agriculture
£2,269m
£151m/yr
Communities
Regional hubs
£98m
£6.6m/yr
Property flood resilience
£867m
£58m/yr
Flood protection schemes
£578m
£39m/yr
Natural environment c
Woodland creation
£1,769m
£118m/yr
Peatland restoration
£909m
£61m
Nature restoration
£358m
£24m/yr
Transport
Rail
£1,538m
£103m/yr
Trunk roads and motorways
£8,170m
£545m/yr
Water
Scottish Water
£1,009m
£67m/yr
We model the adaptation cost for 5 production sectors, as well as some more generic adaptation spending that is not linked to any specific production sector. The sectors, as well as the cost and who pays for it are reflected on Table D1. Please note that our original information included estimates in different price years. To improve the comparability between the different results, we adjust all the values in Table 1 and the values reported in our results to 2025 prices, using the UK GDP deflators.
Adaptation of Rail transportation
Constantly exposed to the elements, transportation services and their necessary equipment are facing the implications of climate change more than other sectors in the Scottish economy. Updates in different parts of the network and the trains themselves will be necessary to ensure that disruptions and safety concerns are kept to a minimum. Figure D1 presents how the adaptation spending of ‘Rail transportation’ is distributed across different Scottish sectors.
Figure D1. Breakdown of ‘Rail transportation’ adaptation spending
As we can see in Figure D1, ‘Rail transportation’ needs to spend a significant amount on construction services, to maintain and reinforce the rail network to cope with the effects of climate change. The most significant share of the spending though is directed to ‘Wholesale & Retail – vehicles’. This sector is most focused on the sales, maintenance and repair of vehicles, including trains and carriages, which is obviously crucially important for the expansion of the and maintenance of the trains. It is reasonable to expect then that similarly large spendings will be required in adapting to climate change. Besides those two sectors, some spending on engineering and relevant specialised services is expected, currently included in ‘All other services’.
The impacts in the absence of cost recovery
Climate adaptation spending introduces a demand shock to the Scottish economy that leads to gross domestic product (GDP) and employment gains. The gains are originally observed in the sectors delivering the rail adaptation activity. Shortly after, the additional employment required to deliver the adaptation and the wage gains that this employment requirements drive, trigger an increase in household consumption that fuels further GDP and employment gains. See Figure D2.
Figure D2. Scottish GDP, employment and CPI impacts from climate change adaptation spending in Rail Transportation
The GDP gains peak at the end of the spending period in 2040[5], as are the employment gains. By 2040, the Scottish GDP grows by 0.54% (£99m in 2025 prices) along with the creation of 1,490 full-time equivalent (FTE) jobs (0.063% employment gains). Interestingly, the economy-wide prices, reflected by the consumer price index (CPI) are peaking in the first year of the adaptation spending, when we observe the Scottish CPI increasing by 0.026%. This price increase is fuelled by the demand for workers, which pushes the cost of workers upwards. Subsequently, more workers migrate to Scotland to benefit from the increased employment opportunities and the higher wages. The expansion of the labour force eases the pressures on wages, so we observe smaller price increases despite the increased employment and household consumption.
The gross value added (GVA) and employment impacts are not distributed uniformly across all the sectors. As shown in Figure D3 for 2040, most GVA is generated in sectors heavily involved in delivering the climate adaptation of ‘Rail transportation’. Further gains are achieved in sectors where households spend their additional income, such as ‘All other services’. In all other sectors the gains are negligible.
Figure D3. 2040 gross value-added impacts per sector due to climate adaptation spending in Rail Transportation
We observe a similar picture in relation to employment (see Figure D4). Some small differences are present, depending on the labour intensity of each sector, but broadly the picture resembles what we see for GVA. An important thing to point out is that in the absence of cost recovery considerations, all Scottish sectors benefit, or at least are unaffected, by the climate adaptation spending for ‘Rail transportation’.
However, all these impacts are temporary. Figure D2 indicates that shortly after the end of the climate adaptation spending, the gains are eroded with the economy returning to the original levels[6]. Approximately 15 years after the end of the spending period, almost none of the benefits from the adaptation spending can be observed.
Figure D4. 2040 employment impacts per sector due to climate adaptation spending in Rail Transportation
The effect of cost recovery via the income tax
The results change both qualitatively and quantitatively if we also consider how the costs will be recovered. For ‘Rail transportation’, because of the nature of the infrastructure that will need to be adjusted, we assume that it will be the government paying for the adaptation and therefore recovering the cost. We have considered the adjustment of the income tax rate as a mechanism to raise the funds required to deliver climate change adaptation in ‘Rail transportation’.
Figure D2 demonstrates that when the adaptation costs are recovered via increases in the income tax, the GDP and employment gains are reversed and the Scottish economy is, temporarily, negatively affected. Income tax increases affect the economy in two main ways. First, a higher income tax restricts the disposable income of households. The lowest income quintile, HG1, is largely unaffected by the income tax increase, while the highest income households of HG5 are observing the highest, in both percentage and absolute terms, real income losses. This reduction in households’ real disposable income, erodes any potential gains emerging from increased household consumption.
Second, the income tax increase is to some extent internalised by the employers as part of the wage bargaining process. Therefore, even though the real take home wage of employees decreases due to increased unemployment, the labour cost to businesses increases, pushing their production cost upwards. This is reflected in the higher, and longer-lasting, CPI impacts when the costs are recovered via the income tax. The higher economy-wide prices further erode household consumption, while also reducing the competitiveness, and by extension the exports, of Scottish sectors, further contributing to the negative economy-wide outcomes.
Of course, similarly to the ‘no recovery’ case, the impacts are not distributed evenly across all the sectors (see Figure D3 and Figure D4). The heavy involvement of ‘Wholesale/Retail – vehicles’, ‘Construction’ and ‘Public admin/defence’ in delivering the adaptation spending, somewhat insulates them against the effects of the income tax increases and allows them to still achieve, smaller scale, GVA and employment gains. Other sectors like ‘All other services’ experience a radical reversal of their GVA and employment impacts, reflecting the combined effects of higher labour costs and lower household consumption.
Adaptation of the Agriculture sector
Undoubtedly, one of the sectors that are most likely to be affected by climate change, and therefore requiring significant spending to adapt to the potential changes, is agriculture. However, it is an umbrella sector encompassing a wide range of products, farming techniques and technologies. Hence, the range sectors involved in adapting agriculture production to the challenges of climate change is expected to be broad. Figure D5 demonstrates this wide range of sectors.
Figure D5. Breakdown of ‘Agriculture’ adaptation spending
The breakdown for ‘Agriculture’ adaptation spending is quite different to the spending for ‘Rail transportation’. Here, ‘Construction’ is expected to play a more significant role, which is to be expected as new infrastructure will be required to ensure the ongoing agricultural production. Other large spendings are expected in part of the ‘Agriculture’ sector itself, as well as on ‘All other manufacturing’ and ‘Wholesale/Retail – vehicles’.
Agriculture adaptation without cost recovery
In may ways, the climate adaptation spending for ‘Agriculture’ leads, qualitatively, to the same impacts as in the ‘Rail transportation’ case, in the absence of cost recovery. Quantitatively though the impacts are different, driven in part by the large spending required for the adaptation of ‘Agriculture’ and the different composition of sectors involved. The qualitative similarities of the two adaptation cases can be visually confirmed by comparing Figure D6 to Figure D2.
Figure D6. Scottish GDP, employment and CPI impacts from climate change adaptation spending in Agriculture
One notable difference between the two cases is that employment more closely tracks the GDP impacts, both time-wise and as a percentage change. The smaller gap between the employment and GDP impacts in the ‘Agriculture’ case suggests that the sectors involved in the adaptation spending of this sector are more capital- and less labour-intensive compared to the sectors involved in the adaptation of ‘Rail transportation’.
Furthermore, the distribution of the GVA and employment gains across the different sectors is also different to the ‘Rail transportation’ case (see Figure D7 and Figure D8), as is greatly influenced by the breakdown of the sectors that deliver the ‘Agriculture’ adaptation (shown in Figure D5). Despite the differences in the distribution, some qualitative characteristics remain the same, in that a small number of sectors contribute around 80% of the total GDP gains and that again 80% of the employment gains are concentrated in the same small number of sectors.
Figure D7. 2040 gross value-added impacts per sector due to climate adaptation spending in Agriculture
Figure D8. 2040 employment impacts per sector due to climate adaptation spending in Agriculture
Accounting for ‘who pays’ for the ‘Agriculture’ adaptation
In the ‘Rail transportation’ case we assumed that the sector itself, and the infrastructure developments that may be required, meant that the government was likely to pay the adaptation cost and recover it via fiscal instruments, such as changes in the income tax rate.
‘Agriculture’ though is different, with many small producers contributing to the sector rather than consisting of a handful of firms. This being the case, it is very likely that the farmers themselves will have to cover the adaptation cost and subsequently pass it to the consumers via the price of their farming goods. This ‘industry pays’ approach leads to different impacts across the wider economy. A key difference is that an ‘industry pays’ approach is regressive in nature. Indeed, looking at the CPI for each household group we can see that, by 2040, the lowest income households in HG1 experience broader price increases of 0.088%, while the highest income households in HG5 experience price increases of 0.073%. The difference is driven in part by the spending in agricultural produce, which is a larger share of the total consumption of low-income households; hence, any price increases in agriculture products leads to greater CPI pressures to this specific income quintile.
Generally, agriculture products are an important component of the consumption of all households and a price increase to recover the adaptation spending can trigger the significant economy-wide CPI pressures observed in Figure D6. These economy-wide price increases erode the purchasing power of all households and lead to reduced household consumption, reduced GDP and employment. Coupled with the export losses that increased prices trigger, lead to the negative picture presented in dashes in Figure D6.
A further important implication of the ‘industry pays’ approach here is that it affects one of the most labour-intensive sectors in the Scottish economy, employing 8.5 FTE workers per £m of output. With concentrated impacts on the sector, we see in Figure D8 that significant employment losses are triggered, contributing to the larger net employment losses across the Scottish economy.
In an economy where movement of labour in and out of the economy is challenging, the unemployment increase associated with job losses would trigger labour cost reduction processes that would help cushion the negative impacts to the economy. However, we assume that workers can move freely in and out of Scotland. Increased unemployment and reductions in the real wage, fuelled by the CPI increase, incentivise workers to leave Scotland, ultimately easing the changes in the unemployment rate. But this prevents the cushioning labour cost reductions from materialising, leading to reduced employment, reduced purchasing power per worker, but also higher labour costs for the businesses. The combination of all these effects leads to the significant economy-wide losses, throughout the cost recovery period.
This case study presents an exploratory analysis of the costs associated with climate adaptation actions for Scottish agriculture. It draws on thirty-three actions identified as suitable for the Scottish context in a report published for the Scottish Government’s Rural and Environment Science and Analytical Services (RESAS). Available evidence, targets, and contextual information – see supplementary data – were used to estimate the potential deployment of each action across Scotland. Costs were scaled using land use archetypes from the Climate Change Committee’s Rural Land Use Types report (Thomson et al., 2025). The resulting estimates should be regarded as first-pass figures requiring further expert elicitation to be refined. Where the scope of the analysis permitted, an exploratory cost-benefit analysis was undertaken for selected actions, examining potential impacts on yields, soil erosion, disease risk, productivity, and biodiversity.
Action Identification
The thirty-three adaptation actions drawn from the RESAS report span arable, pastoral, and universal categories, and carry ratings for both impact and complexity across three levels: low, medium, and high. Prior to costing, two actions were excluded on the grounds that they are implicitly captured within the overarching action ‘diversifying Ccrop rotations’: namely, ‘crop introductions and diversification’ and ‘use of more resistant crop varieties’.
Cost information
Cost information was sourced from academic and grey literature, with a confidence rating (low, medium, or high) assigned to each source. Of the thirty-three actions, cost estimates were successfully obtained for twenty-one. The remaining twelve could not be costed due to an absence of relevant literature with associated expenditure data. In addition, two further actions identified during the literature review process — biocontrol and organic conversion — were incorporated into the analysis on the basis that sufficient cost data were available. Both were considered of material relevance to Scottish agriculture. All costs were adjusted to 2026/27 prices and converted to pound sterling where necessary. Further detail regarding the specific assumptions underpinning individual cost estimates is provided in the supplementary data.
Scaling costs
To scale unit adaptation costs (typically expressed in £/ha) to the applicable Scottish agricultural land area, the Climate Change Committee’s Rural Land Use Types report was employed (Thomson et al., 2025). This report disaggregates Scotland’s total agricultural land stock into ten archetypes, of which the six largest were selected for this analysis, together accounting for 97.9% of Scottish agricultural land: highly degraded lowland organic soils (117,300 ha); degraded upland grazing land and forest on organic soils (619,900 ha); hilly farmland on improved and semi-natural grassland on non-organic soils (106,400 ha); open pasture on the upland fringe (814,300 ha); acid grasslands on hilly uplands (767,400 ha); and arable on sandy soils (511,900 ha).
The report further disaggregates each archetype by land cover, as illustrated in Figure E1, across categories including arable and horticulture, acidic grassland, and coniferous woodland. These breakdowns were used to delineate the proportion of each archetype applicable to the scaling of adaptation action categories: arable, livestock, grassland, and universal.
Where data on the current extent of action deployment were available, this was deducted from the target area prior to scaling, ensuring that cost estimates reflect remaining deployment requirements rather than total potential coverage. The general scaling methodology proceeded as follows: the per-hectare cost of each action was multiplied by the applicable target area and, where actions were costed on an annual basis, further multiplied by the fourteen-year adaptation period to produce a total cost estimate covering 2026/27 to 2039/40. In certain cases, e.g., the application of green pesticides, the number of applications per year was incorporated into the calculation before extrapolation across the full period. Full details of the assumptions and methodologies applied to individual actions are provided in the supplementary data.
Figure E1: Land Cover Map categories in 2021 by archetype. The percentage of the archetype covered by organic soil is given above each bar – fig.4 from Thomson et al. (2025) – used to assist adaptation action cost scaling.
Complete scaled exploratory cost estimates for the fourteen-year period were produced for nineteen adaptation actions in total, presented in full in Supplementary Table X with associated confidence ratings and contextual information. A subset of six illustrative actions is excerpted in Table E1.
Table E1: Six example adaptation actions with associated scaled costs.
Enhanced production on marginal land – Impact: LOW, complexity: HIGH
Grassland
Government budget for LFA is £65.5M for 2026/27 [11]LFA is 86% of total agricultural land (5.16M ha12]) = 4.44M haCost per hectare of LFA: £14.76/ha/yr13
1419739.6
£293,374,991
Agrivoltaics – Impacts: MEDIUM, Complexity: HIGH
Universal
Capital expenditure £7950/ha AND operational expenditure: £4300.96/ha/yr
Exploratory cost-benefit analysis (CBA) was undertaken for the adaptation action ‘diversified crop rotations’, examining potential monetary benefits resulting from this action. These included increased crop yields of between 10% and 25%; reduced losses from soil erosion of up to 90%; and fertililser usage savings of 30%.
The result, shown in Table E2,outlines the potential monetised benefits between 2026 and 2040 of £1.1bn- £856M. This means that 24.7% to 31.4% of the total could be returned by increased crop yields, reduced losses and reduced fertiliser cost.
This is not an exhaustive CBA but indicative of the potential of these actions relative to a do-nothing scenario.
Table E2: Exploratory cost benefit analysis for diversified crop rotation
Cost benefit description
+25% yield value
+10% yield value
Crop yield increase of 10-25% [15]1.53B total crop output (2024) [16]
£382,500,000.00
£153,000,000.00
Reduced losses of up to 90% in yield value from soil erosion (calculated using +10% and +25% yield value)Approx 19.2% of Scottish arable land at risk of soil erosion[17]Assume therefore, that 19.2% of crop output value (1.53B) at risk consequently.Soil erosion causes losses in crop productivity of 0.43% [18]
£19,894,896.00
£17,507,508.48
30% fertilizer cost saving relative to cost of fertilizers currently widely in use.19Total UK spend on fertilizer 2023 = £1.36 Billion 20Scotland share of UK agricultural land = ~12%
£685,440,000.00
£685,440,000.00
Total monetised benefits
£1,087,834,896.00
£855,947,508.48
Diversified crop rotations scaled cost (base)
£3,462,939,440.00
NET COST of diversified crop rotations after accounting for savings in fertilizer usage, reduced losses from soil erosion and increased yield value, all as a direct result of this action (= Base cost – Total monetised benefits)
£2,375,104,544.00
£2,606,991,931.52
Several important limitations should be noted when interpreting these results:
Cost estimates assume that each action is applied across all land eligible for that measure, which is likely to overestimate real-world uptake; results should therefore be interpreted as upper-bound estimates.
In practice, interventions would be carefully selected and targeted, and not all actions would necessarily be deployed across the full eligible area.
Limited data on the current extent of adaptation adoption makes it difficult to accurately determine the remaining deployment gap for individual actions.
Cost data were unavailable for several actions that are nonetheless considered significant for Scottish agricultural adaptation; these would benefit from dedicated expert costing exercises.
The analysis does not account for the potential impact of increasing climate risk on the cost or effectiveness of adaptation actions over the period.
Scaling was not feasible for certain actions due to data limitations. Costing shelterbelts, for example, would require data on the total perimeter of agricultural land. Costing enhanced livestock housing design would require detailed information on existing infrastructure and the degree of upgrade required. In the latter case, the only cost data identified were sourced from European literature, providing a range of €5,000 to €100,000 per unit — figures that may not be directly transferable to the Scottish context.
Wider policy and economic context for agriculture:
Policy context
The Agricultural and Rural Communities (Scotland) Act 2024 set out the legal framework for transforming Scotland’s farm support system, replacing former Common Agricultural Policy (CAP) schemes with a four‑tier framework by 2027. The reforms aim to shift agricultural support toward delivering environmental and climate outcomes while still underpinning food production and rural livelihoods. Central to this shift is the Whole Farm Plan, which requires farmers to baseline their environmental performance and adopt practices that reduce emissions, restore nature, and improve efficiency. Implementation will be gradual: initial changes begin in 2025, consolidation of payments and “Enhanced Greening” follow in 2026, and by 2027-28 the full framework, alongside new agri‑environment, forestry, and capital support measures, will be in place.
Overall, the new system moves from unconditional payments to support linked to specific outcomes across Tiers 1–4, balancing farm productivity with climate adaptation, mitigation, and biodiversity goals. Tier 1 provides core direct income support, evolving from the Basic Payment Scheme but tied to meeting baseline environmental and regulatory standards. Tier 2 rewards enhanced environmental delivery, including greening measures and likely future integration of the Less Favourable Area Support Scheme (LFASS). Tier 3 offers elective, targeted support for specific environmental or land‑management actions, replacing schemes like AECS and FGS. Tier 4 delivers complementary capital grants, skills development, and advisory services to help businesses adopt new practices. While the approach builds on what many farms already do, Tier 2 and Tier 3 are expected to drive the greatest climate‑adaptation impacts – though separating adaptation from mitigation remains a challenge in practice. The subsidy landscape is likely to continue evolving as budgets and schemes consolidate under the new structure. More information available at: 0624 Future Support Briefing.pdf
Economic context
Figure F1: Breakdown of contributions to farm income by farm type, 2023-24. Source: Scottish Government, 2025d.
How to cite this publication:
Brett, L., White, C.J., England, K., Calvillo Munoz, C., Roberts, J.J. (2026) ‘Investigating climate change adaptation investment need across five sectors in Scotland (2026 – 2040)’, ClimateXChange. DOI: https://doi.org/10.7488/era/7087
While every effort is made to ensure the information in this report is accurate as at the date of the report, no legal responsibility is accepted for any errors, omissions or misleading statements. The views expressed represent those of the author(s), and do not necessarily represent those of the host institutions or funders.
This work was supported by the Rural and Environment Science and Analytical Services Division of the Scottish Government (CoE – CXC).
The figures represent one scenario-based estimate of potential adaptation-related spend required to maintain current service levels under future climate conditions – there are many potential future scenarios, each returning different potential investment requirements. ↑
Note Scottish Water estimates are for 13 years from 2027/28 – 2039/40. ↑
We have modelled the impacts based on the available estimates on adaptation spending over the next 15 years, until 2040. If further adaptation spending is required then the economy-wide impacts will continue. In that case more analyses will be needed to explore the implications of extended adaptation spending. ↑
The modelled shock to the economy has completed, so in the absence of a shock the economy returns back to the baseline. ↑
Scotland faces a rapidly changing climate, with rising temperatures, shifting precipitation patterns and more frequent extreme weather events already affecting communities, infrastructure and ecosystems. These climate change impacts are projected to intensify over the coming decades, placing growing pressure on public services, natural systems and populations. As Scotland continues to strengthen its national response, effective adaptation planning has become an essential part of long-term climate resilience.
Scotland’s third Scottish National Adaptation Plan (SNAP3) introduced, for the first time, a national monitoring and evaluation (M&E) framework designed to track progress in building climate resilience. However, while this framework includes indicators linked to adaptation outcomes and objectives, it does not yet define quantified resilience targets. The UK Climate Change Committee (CCC) has recommended that Scotland develop specific and measurable targets to strengthen accountability, support monitoring and clarify the level of resilience being sought.
This study draws on a structured review of international literature and adaptation plans, interviews with policymakers and technical experts from seven jurisdictions and a two-round modified Delphi process with Scottish experts, primarily from relevant policy and analytical areas within Scottish Government. The Delphi method is a structured, iterative method designed to gather informed judgement from experts to identify both areas of consensus and disagreement.
Together these sources provide practical evidence about:
how adaptation targets are currently being used internationally;
what credible and useful adaptation targets look like;
how they can be governed, monitored and reviewed;
and how stakeholder engagement contributes to the development of legitimate and workable targets.
The research was not intended to prescribe specific targets for Scotland, but to identify the conditions, structures and processes required to develop robust adaptation targets in a complex and evolving risk landscape.
Key findings
The evidence shows that adaptation targets work best when they are clearly defined, built into delivery systems, aligned with institutional capacity, and supported by strong governance and monitoring.
Clarity and quality of adaptation targets
The international review and results from the Delphi study consistently show that high-quality adaptation targets are most effective when they:
drive action, not simply record activities;
reflect a layered structure, with long-term resilience outcomes supported by near-term delivery or output targets;
differentiate between process, output, outcome and impact targets, using each type appropriately; and
be supported by an explicit Theory of Change that explains how actions lead to outcomes and impacts.
Governance, decision-making and institutions
Evidence consistently shows that credible and deliverable target systems require a hybrid governance model that combines:
central coordination to maintain ambition, coherence and transparency;
distributed sectoral responsibility for developing and delivering targets; and
independent scrutiny to reinforce credibility and political discipline.
Stakeholder engagement
Evidence shows that while engagement is valuable, it does not guarantee influence. Target design is often led by governments and technical experts with authority to implement, while broader stakeholders shape outcomes mainly when there is genuine co-design, iteration and decision-making power. Delphi participants supported a differentiated approach in which:
Citizens and communities shape the early, value-based stages of problem framing—what matters, whose risks count, and what fairness requires.
Experts and technical specialists play a sustained role throughout target-setting, including interpreting evidence, prioritising risks, and designing metrics.
Government retains final accountability.
Capacity, resources and feasibility
Capacity constraints emerged as one of the most significant limiting factors in effective adaptation target-setting. Participants in the Delphi study emphasised:
limited analytical and modelling capacity;
uneven sectoral readiness;
significant evidence and data gaps;
overstretched delivery bodies and competing statutory demands;
insufficient and unstable funding to support planning, delivery and monitoring.
Integration, coherence and implementation pathways
Targets are most credible and deliverable when embedded into established planning, budgeting and delivery systems. The evidence shows that targets must:
align with SNAP3 cycles, statutory reporting processes and cross-government planning;
be coherent with related strategies (climate, nature, water, land, health, infrastructure) to avoid fragmentation and ensure clarity for delivery bodies;
sit within a clear implementation pathway with milestones, roles, assumptions and review points; and
be supported by functioning monitoring, evaluation and learning systems that provide the evidence required to assess progress.
These findings show that adaptation target-setting is as much a governance challenge as a technical one, shaped by institutional capacity, political incentives and delivery systems.
Design principles for setting adaptation targets in Scotland
The evidence base points to nine practical design principles:
Design targets to drive action;
Embed scientific and hazard-based evidence at the core of target design;
Balance ambition with feasibility through phased development;
Use mixed measurement approaches where evidence is incomplete;
Integrate equity directly into ambition-setting and evaluation;
Ensure targets remain interpretable and usable, avoiding unnecessary complexity;
Provide clear and predictable review processes;
Design within system capacity;
Align targets with wider policy systems.
Policy implications for setting adaptation targets in Scotland
The study highlights several actions that would support an effective adaptation target setting system:
Establish a phased, layered adaptation target framework.
Integrate hazard- and risk-based evidence into all stages of target development.
Anchor revision processes in statutory cycles with tightly governed flexibility.
Embed equity within target ambition and delivery.
Strengthen analytical, modelling and monitoring capability across government.
Adopt mixed-method assessment frameworks.
Prioritise simplicity and usability in target system design.
Strengthen cross-government coordination and coherence.
Develop transparent engagement pathways.
Provide stable, multi-year funding for implementation.
Glossary and Abbreviations
Glossary
adaptive management
A cyclical approach where decisions are revisited and adjusted as new evidence, learning and conditions emerge. Central to iterative target-setting.
attribution
Proving that an observed impact (e.g. reduced losses) is caused by a specific action. Often impossible in complex systems.
baseline
The starting point against which progress is measured. In adaptation, baselines may be dynamic rather than fixed, because climate risks continue to evolve.
climate risk
The potential for adverse impacts resulting from climate-related hazards (such as heatwaves, flooding or drought), interacting with the exposure and vulnerability of people, infrastructure, ecosystems or assets (adapted from IPCC, 2022).
co-design
A participatory approach where stakeholders, including communities and delivery partners, are directly involved in shaping targets, metrics and implementation pathways.
contribution
Demonstrating that an action plausibly supports resilience, even if causality cannot be isolated.
enablers
The capacities, resources, data systems, governance structures and institutional arrangements required for targets to be credible and deliverable.
evaluation
The periodic and structured assessment of the performance, effectiveness and efficiency of an intervention, typically asking what worked, what didn’t and why.
impacts
The longer-term, higher-level changes to systems, vulnerability or resilience (e.g. reduced heat-related illness, fewer properties at high flood risk).
indicators
Measurable variables used to track progress, performance or change over time.
implementation pathway
The processes, institutions, funding routes and operational systems through which adaptation targets are delivered in practice.
learning
The deliberate process of reflecting on monitoring and evaluation findings, and new evidence more broadly, to improve decisions, practice, design and delivery over time.
mainstreaming
Embedding adaptation targets and actions within existing planning, budgeting, regulatory and delivery systems (e.g. procurement, land-use planning, asset management). Integration increases feasibility and accountability.
maladaptation
Adaptation actions that increase risk or cost or exacerbate ineffectiveness or inequity. For example, protecting valuable assets in ways that heighten risk for neighbouring communities.
milestones
Intermediate steps or checkpoints within a longer-term adaptation pathway. Milestones help maintain momentum and enable course-correction.
monitoring
The ongoing and systematic collection of data to track whether activities are being delivered as planned and whether interim changes are occurring.
Monitoring and Evaluation (M&E)
A combined approach that links monitoring and evaluation activities to track implementation and assess effectiveness. Often used where learning processes are present but not formalised into MEL.
Monitoring, Evaluation and Learning (MEL)
A set of integrated processes that bring together monitoring, evaluation and learning to track implementation, assess results and effectiveness, and iteratively improve the design and delivery of adaptation actions. Although MEL is often supported by frameworks or systems, the core emphasis is on the underlying processes and activities.
outputs
The tangible, immediate products or services delivered by an intervention (e.g. flood maps produced, cooling centres established).
outcomes
The short- to medium-term changes resulting from the outputs (e.g. improved access to heat refuges, better-informed land-use planning).
risk
The potential for adverse consequences where something of value is at stake and the outcome is uncertain. In climate adaptation, risk is commonly understood as arising from the interaction of hazard, exposure and vulnerability.
risk thresholds
Points at which increasing climate risk signals unacceptable conditions or triggers action. For example, maximum tolerable heat levels in classrooms.
targets
Specified level of performance, threshold or outcome to be achieved, often assessed using one or more indicators.
Theory of Change
A structured explanation of how actions and investments are expected to lead to desired outcomes and impacts. A ToC clarifies assumptions and supports coherent target design.
uncertainty
The inherent difficulty in predicting climate hazards, impacts and system responses. Managing uncertainty requires adaptive pathways, scenario modelling and iterative revision.
Abbreviations
CCC
Climate Change Committee (UK)
CXC
ClimateXChange (Scotland)
GGA
Global Goal on Adaptation
IPCC
Intergovernmental Panel on Climate Change
MEL
Monitoring, Evaluation and Learning
NAP
National Adaptation Plan
OECD
Organisation for Economic Co-operation and Development
SIDS
Small Island Developing States
SNAP
Scottish National Adaptation Programme
ToC
Theory of Change
UNEP
United Nations Environment Programme
UNFCCC
United Nations Framework Convention on Climate Change
Introduction
Context for the study
Scotland faces a rapidly changing climate, with rising temperatures, shifting precipitation patterns and more frequent extreme weather events already affecting communities, infrastructure and ecosystems. These climate change impacts are projected to intensify over the coming decades, placing growing pressure on public services, natural systems and populations. As Scotland continues to strengthen its national response, effective adaptation planning has become an essential part of long-term climate resilience.
Scotland’s climate adaptation policy is guided by the third Scottish National Adaptation Plan (SNAP3), which sets out actions to address climate change impacts from 2024 to 2029. Compared to previous plans, SNAP3 has significantly strengthened its monitoring and evaluation (M&E) framework (discussed in Section 3.5 below), introducing directional indicators, improving data quality and placing greater emphasis on understanding the link between actions and outcomes.
However, quantifiable adaptation targets have not yet been established. In its November 2023 report Adapting to Climate Change: Progress in Scotland, the UK Climate Change Committee (CCC) recommended that future adaptation plans include quantified resilience targets to provide clear benchmarks, clarify responsibility for delivery and strengthen monitoring by highlighting evidence gaps. In its response to the draft SNAP3 in April 2024, the CCC reiterated that specific and measurable targets for resilience across Scottish society would support appropriate budgeting, enable progress tracking and increase accountability for delivery.
International experience is beginning to demonstrate what effective adaptation target-setting may require. For example, Germany became the first country to introduce measurable adaptation targets in its 2024 Climate Adaptation Strategy, developed over two years through extensive engagement with ministries, stakeholders and citizens. Early reflections highlight improved inter-ministerial coordination and stronger governance links. Approaches in Kenya and Chile similarly show that aligning targets with risk and vulnerability assessments helps prioritise action and reduce social and geographical inequities. However, because national efforts to set adaptation targets are still in their early stages, detailed examples of emerging practice remain limited. The Scottish Government is therefore looking to understand what effective, workable adaptation targets could look like in practice, and how they might be developed and applied in ways that are grounded in evidence and aligned with national priorities. This forms the basis for the study.
Research aims
The Scottish Government recognises the value of quantifiable adaptation targets and is looking to learn from international practice. This includes identifying core principles for effective target setting, understanding what well-designed targets should encompass, and examining the processes through which they are developed, reviewed and evaluated. Therefore, a key aim of this study is to draw practical lessons from international approaches that can inform the process of developing measurable, context-appropriate adaptation targets for Scotland.
To achieve this the study addresses five research questions:
Which approaches have been taken internationally in setting adaptation targets?
What are the key challenges in setting robust, measurable and practical adaptation targets?
What can be learned from examples where targets have been set and are being used to monitor adaptation action?
How can adaptation targets best be monitored successfully?
How could principles identified for setting adaptation targets be applied to Scotland’s national adaptation plans in the future?
The research explores the key enablers and challenges in developing adaption targets, including the role of government, stakeholder and citizen engagement, technical capacity and governance arrangements required to track long-term outcomes in complex, dynamic systems. It also considers how adaptation targets can be embedded within institutions in ways that support long-term learning, responsiveness and continuous improvement. By drawing on lessons from comparable jurisdictions, the research provides practical recommendations to inform the development of measurable, context-specific adaptation targets to strengthen SNAP3, shape future SNAPs and support Scotland’s ambition to show leadership in climate adaptation.
Methodology
Setting adaptation targets is complex and highly context specific. There is no single standard approach, and the processes through which targets are developed are often poorly documented. To address this challenge, we used a clear, three-phase methodology designed to generate practical insights for policy and to inform future adaptation target setting in Scotland. The research was carried out between June 2025 and April 2026 and combined three strands of evidence:
a structured international review of literature and policy documents;
qualitative interviews with selected jurisdictions; and
a consensus-based process to test relevance for Scotland.
Together, these phases addressed the five research questions described in the research aims.
Phase 1: Structured review of international practice
Phase 1 established the evidence base for the study through a structured review of academic literature, grey literature and international adaptation plans. The review was guided throughout by the common enquiry framework developed for this project (Appendix B). This framework was built from the research questions, established policy-analysis methods, prior adaptation knowledge and iterative refinement with the steering group and shaped how all sources were identified, coded and analysed.
We undertook systematic searches across academic databases and key grey-literature sources, focusing on recent peer-reviewed work and high-quality reports, particularly those produced after the Paris Agreement 2015. This included research publications, assessments by international organisations and policy think-tank reports accessed through platforms such as Google Scholar. The initial search returned 84 references. Nine were excluded as not relevant, leaving 75 core sources. Each reference was logged in an Excel database and coded against the themes and sub-questions in the enquiry framework. Findings were then synthesised across 11 thematic evidence summaries.
In parallel, we conducted a structured review of national and sub-national adaptation plans and associated monitoring and evaluation (M&E) or monitoring, evaluation and learning (MEL) frameworks. Jurisdictions were selected using a multi-step sampling strategy (Appendix A) that prioritised countries with relatively mature adaptation systems and broad comparability with Scotland. We reviewed national adaptation plans from 22 countries. Because very few included explicit quantitative targets—and following discussion with the steering group—the sample was expanded to include nine sub-national jurisdictions with more developed or innovative target-setting practice.
All literature and documents were analysed using the same enquiry framework, enabling consistent assessment of key issues including the purpose of setting adaptation targets, governance and institutional arrangements, stakeholder engagement, use of evidence, resource and capacity constraints, timelines and the technical quality of targets. This structured approach provided a transparent and comparable evidence base for the analysis presented in Section 4.
Phase 2: Interviews with selected jurisdictions
To complement the evidence from the document and literature reviews, we carried out semi-structured interviews with policymakers and technical experts from seven jurisdictions (four national and three sub-national jurisdictions) that had developed, were developing, or demonstrated an innovative approach to adaptation targets. Short case summaries of these jurisdictions are provided in Appendix E.
Interviews lasted 45–60 minutes and followed a topic guide based on the enquiry framework (Appendix C), ensuring consistency while allowing exploration of context-specific issues. Interview data were analysed thematically and compared with findings from Phase 1. The findings from this integrated analysis are presented in Section 4.
Phase 3: Assessing relevance for Scotland
Phase 3 examined how the international lessons identified in Phases 1 and 2 could be applied in Scotland. To do this, we used a modified Delphi process. This is a structured, iterative method designed to gather informed judgement from people with relevant experience, particularly in areas where evidence is incomplete and decisions involve interpretation, trade-offs and practical considerations. It is designed to identify both areas of convergence and areas where views legitimately diverge, without aiming for unanimity or forcing consensus. The approach is well suited to adaptation target-setting, where uncertainty is inherent, evidence alone cannot provide definitive answers and operational feasibility needs to be understood from those working within the system. Participants respond independently and anonymously, reducing the influence of hierarchy or dominant voices. Views are gathered over successive rounds with controlled feedback, to allow for reflection and refinement.
We adapted this approach to the Scottish context, inviting a diverse panel of experts, primarily from within Scottish Government, with practical, policy and system-level experience identified by ClimateXChange and the steering group. An initial online survey was sent to approximately 30 stakeholders and produced eleven responses. The findings from this first round informed the design of a second survey, which focused on areas of uncertainty and divergence particularly relating to feasibility, fit and practical application. The second survey was sent to the same group and received thirteen responses. This level of participation is appropriate for a Delphi-style process, where the strength of the method lies in the quality and relevance of expert insight rather than in achieving a statistically representative sample. Insights from both stages informed the Scotland-focused analysis in Section 5 and the policy implications in Section 6.
Limitations of the study
We drew on structured and transparent research procedures across all three phases of the study. However, given the breadth of the research questions, the volume and variability of potentially relevant material and the time available, this work does not constitute a comprehensive or systematic assessment of all adaptation target-setting practice internationally. As a result, it remains possible that some relevant approaches or evidence were not captured through our search and review procedures. The international review focused on English-language and publicly accessible documents, and although we sought to prioritise jurisdictions broadly comparable to Scotland, findings inevitably draw on material produced in a range of institutional and geographic contexts. While this was appropriate for the aims of the research, some of the practices identified may not be fully transferable to the Scottish context. Documentation quality also varied considerably across jurisdictions, which limited the depth of analysis possible in some cases.
The qualitative evidence base was necessarily limited in scope. Interviews were conducted with a small number of selected policymakers and technical experts available during the interview period and findings therefore reflect the perspectives of those individuals rather than the full range of institutional or stakeholder views. Similarly, the modified Delphi process was deliberately expert focused in order to elicit informed judgement on issues where evidence is incomplete. However, this means that citizen and community perspectives were not included at this stage.
The modified Delphi process also has methodological limitations. Delphi approaches are not designed to be statistically representative; their purpose is to gather informed judgement from experts rather than to produce results that reflect a wider population. For this reason, the smaller number of responses in each round does not undermine the validity of the method. However, it does mean that the findings reflect the perspectives of those experts who took part, rather than capturing the full range of views across the wider system. This should be kept in mind when interpreting areas of agreement or divergence.
Integration of findings across the three phases required researcher interpretation, although this was mitigated through the use of a common analytical framework, triangulation across data sources and iterative engagement with the steering group. As the research was conducted within a defined timeframe, the findings should be understood as a snapshot of practice in a rapidly evolving policy area.
The SNAP3 Monitoring, Evaluation and Learning (MEL) system
Scotland’s third Climate Change Adaptation Programme (SNAP3) is supported by a Monitoring and Evaluation (M&E) framework designed to assess progress in building climate resilience across four themes: nature, communities, public services, and economy and industry. The framework provides a structured way of linking the Plan’s activities and delivery mechanisms to short-, medium- and long-term changes in resilience. The SNAP3 M&E framework was published in September 2024 by the Scottish Government. It is notable that a report on monitoring outcomes of SNAP3 using indicators representing the four themes, published by ClimateXChange in August 2024, widens this scope by discussing monitoring, evaluation, and learning (MEL) of SNAP3. In this report, we will refer to MEL, except where referring specifically to the published SNAP3 M&E framework. This approach reflects the relevance of learning to target setting, particularly in relation to the updating of targets in the light of evolving and uncertain risks and new information.
Structure of the SNAP3 M&E framework
SNAP3 is organised around five core elements: the strategic aim, outcomes, objectives, enablers and activities. These elements form the basis of the monitoring maps used in the SNAP3 M&E framework, which illustrate how actions are expected to create enabling conditions, deliver objectives and contribute to outcomes over time. The M&E framework is then structured around these monitoring maps and incorporates: (i) five-yearly outcome-level indicators linked to the four themes; (ii) annual objective-level indicators that track nearer-term progress; and (iii) policy evaluation and learning components that support improvement over successive cycles.
The five elements of SNAP3 can be summarised as follows, with brief examples to illustrate the distinction between levels:
Strategic aim: the overarching ambition of SNAP3—to build Scotland’s resilience to climate change aligned with national outcomes.
Outcomes: the long-term changes SNAP3 intends to achieve within each theme (one per theme, each split into 2–4 areas) e.g. under Communities: ‘Communities are prepared for and adapt to climate change impacts.’
Objectives: what policy actions are expected to achieve during the Plan period (3–6 per theme) e.g. under Public Services: ‘Strengthen climate risk management across health and social care systems.’
Enablers: the conditions and capacities that must be in place for objectives and outcomes to be achieved—such as resources, governance arrangements and system capabilities (21–30 per theme, grouped into 6–7 areas) e.g. ‘Improved availability of climate risk data and guidance for local authorities.’
Activities: the delivery actions and mechanisms set out in SNAP3 that are intended to create enabling conditions and deliver the objectives (12–21 per theme, grouped into 4–6 areas) e.g. ‘Provide flood risk management training for local planners’ or ‘Update sectoral guidance to reflect new climate projections.’
Together, these elements structure the SNAP3 monitoring maps and provide the architecture for tracking progress through outcome indicators, objective indicators, evaluation processes and learning mechanisms.
Positioning targets in the SNAP3 M&E framework
Adaptation MEL frameworks often distinguish between outputs, outcomes and impacts, as defined by OECD (2023). This three-tier model provides a useful way of understanding the different levels at which adaptation targets could be developed in future national plans.
Outputs reflect the immediate deliverables of adaptation activities — for example, kilometres of drainage upgraded, numbers of properties retrofitted, or guidance documents produced.
Outcomes capture changes in capacities, behaviours or system characteristics that contribute to resilience — for example, increased public awareness of climate risks, improved ecological condition, or greater uptake of adaptive land-use practices.
Impacts relate to long-term reductions in climate-related harm, losses and damages, or improvements in climate-sensitive wellbeing — for example, reductions in heat-related illness, fewer properties experiencing repeat flood damage, or lower financial losses associated with extreme events.
All the outcome indicators defined in the SNAP3 M&E framework align with outcome-level indicators in this model. The objective indicators in SNAP3 represent a mixture of output- and outcome-level metrics. For example, indicators tracking public awareness, ecosystem condition, or the adoption of resilience-enhancing practices function as outcome-level indicators because they reflect changes that contribute to long-term resilience and are influenced by the outputs delivered under SNAP3. These types of indicators are essentially predictive, in that they relate to system characteristics that should, in principle, enable populations and services to withstand, recover from and adapt to climate hazards.
SNAP3 does not currently define impact-level indicators. However, some existing monitoring data relevant to climate risks, for example information on properties affected by flooding, heat-related health impacts, or economic losses from severe weather, illustrate the types of evidence that could inform future impact-level indicators framed around reductions in, or avoided, losses and damages over time. Indicators that track actual losses can provide evidence of whether improvements observed at the outcome level translate into reductions in climate-related harm. Considering the MEL system in this way helps identify where different types of targets might be positioned in future adaptation plans, including the potential for longer-term targets related to reducing measurable losses and damages. This framing is intended to support thinking for SNAP4 and subsequent plans, recognising that future iterations are likely to retain a broadly similar outcome–objective structure but should not be constrained by the architecture of SNAP3.
Implications for adaptation target setting
The current SNAP3 M&E framework already includes numerous quantitative indicators that could support the development of adaptation targets or milestones. A subset of objective indicators could underpin targets related to the delivery of specific outputs or initial changes necessary during the Plan period. Outcome indicators could support targets linked to more substantive improvements in resilience. This could include for example, increases in access to key services, adoption of adaptive management practices, or agreed tolerances for specific climate hazards.
There is also scope to introduce impact-level indicators and targets to assess longer-term adaptation performance, particularly where reduced losses, damages or harm would signal progress towards SNAP3’s strategic aim of Scotland having increased resilience to the impacts of climate change. Because climate risks will evolve, such impact-level targets may be most useful as benchmarks for learning and policy refinement rather than fixed commitments. Where targets are based on avoided losses or damages, baselines or no-adaptation counterfactuals would need to be established using emerging methodological approaches.
Theories of change that link outputs, outcomes and impacts, and that reflect the monitoring maps in the SNAP3 M&E framework, might be used to refine and update targets. For example, where desired reductions in losses and damages are not being achieved, a theory of change might be used to interrogate assumptions about the pathways via which outcomes that are assumed to enhance resilience at the outcome level translate into reduced losses and damages at the impact level. A better understanding of these pathways might result in revisions to targets associated with resilience indicators at the outcome level, for example where the importance of certain ‘resilience capacities’ is found to have been over- or under-estimated.
A more detailed analysis of the SNAP3 M&E framework in relation to target setting is provided at the end of this report (Appendix D). This analysis informed the design of Phase 3 (the modified Delphi exercise), helping shape questions about how adaptation targets might best be framed and structured within the SNAP3 system.
Report structure
The report is structured around the study’s five research questions.
Section 4 addresses Research Questions 1–4 by presenting findings from the international literature review, document analysis and interviews. It examines how adaptation targets are currently defined, governed, supported, delivered and integrated in national and sub-national contexts.
Section 5 addresses Research Question 5, applying the international lessons to Scotland and drawing on insights from the modified Delphi process to assess what forms of adaptation targets may be feasible, appropriate and useful within the Scottish policy system.
Section 6 provides the overall conclusions of the study and outlines the policy implications for future development of adaptation targets in Scotland.
Findings from the literature, document review and interviews
Introduction
Adaptation targets are shaped by a wide range of technical, institutional and political factors. To understand how effective target systems are developed, this chapter synthesises evidence from three sources: (i) the international academic and grey literature, (ii) the review of national, sub-national and sectoral adaptation frameworks, and (iii) interviews with policymakers, practitioners and experts. Together, these sources address Research Questions 1–4 by examining how adaptation targets are defined, governed, supported and implemented across different jurisdictions.
The chapter begins with a review of current practice in selected jurisdictions (Section 4.2), summarising how national, sub-national and sectoral governments are currently using quantified, time-bound and directional targets in their adaptation strategies. This overview draws on the synthesis of evidence from both the literature and document review and the interview findings. It is presented at the start of the chapter because it offers a concise picture of the existing landscape of adaptation target-setting, which helps contextualise and orient the more detailed thematic analysis that follows. For clarity and coherence, the remainder of the chapter is divided into two parts.
Part A presents findings from the literature and document review, outlining the characteristics of high-quality targets and the governance, capacity and integration conditions that support credible and deliverable target systems.
Part B summarises insights from stakeholder interviews, highlighting how jurisdictions interpret and navigate the practical realities of designing, negotiating, implementing and revising adaptation targets in practice.
Current practice in selected jurisdictions
A review of adaptation plans from 22 national and nine subnational jurisdictions found that explicit, quantified and time-bound adaptation targets remain relatively uncommon at national level. Eight of the 22 national jurisdictions reviewed included at least some quantified, time-bound targets, although their scope, level and governance function varied considerably. In some cases, a single quantified target was embedded within a broader framework of largely directional objectives. In others, multiple quantified targets were adopted and framed as part of an iterative process of refinement. Only a small number of jurisdictions developed more comprehensive approaches that spanned multiple sectors and levels. Among the nine subnational jurisdictions reviewed, three articulated at least some quantitative, time-bound adaptation targets. Adaptation targets have largely been developed though experimentation, selective quantification and incremental refinement. Table 2 summarises the eight national jurisdictions and three subnational jurisdictions identified as having at least some quantified, time-bound adaptation targets. Semi-structured interviews were conducted with policymakers and technical experts from seven jurisdictions (four national and three sub-national) that had developed, were developing, or demonstrated innovative approaches to adaptation targets. Short case summaries of these jurisdictions are provided in Appendix E.
Emerging patterns in target design
Several broad patterns emerge from the international review. First, quantified targets are most commonly found at the output level. These typically relate to implementation milestones, infrastructure delivery, restoration areas (e.g. hectares restored), or institutional and capacity-building actions. Such targets are generally easier to measure and tend to fall within clearer administrative control. As a result, quantification is most common where delivery levers are established and data systems are mature.
Second, a smaller group of jurisdictions have begun to articulate outcome-level targets focused on the conditions and capacities that contribute to resilience and reduce risk, such as improved preparedness and reduced exposure. These targets attempt to define what success looks like in terms of vulnerability or risk reduction. However, they are more methodologically complex and often influenced by external variables, including climatic variability and demographic change.
Third, explicitly framed impact-level targets, defined as quantified reductions in realised climate-related losses, damages or residual risk, remain rare. When included, they tend to take the form of long-term and aspirational goals that signal the desired direction of travel, rather than targets linked to clearly defined pathways or accountability mechanisms. Interviewees and document analysis suggest that attribution challenges, shifting climate baselines and political caution limit the adoption of quantified impact targets where delivery pathways are uncertain.
At subnational scale, cities were more likely than national governments to adopt spatially explicit or hazard-specific quantified targets, such as urban heat reduction or green infrastructure coverage. This may reflect more direct control over land-use planning and infrastructure delivery. However, even at city level, quantified targets tend to focus on outputs rather than demonstrable reductions in risk exposure. While Table 2 illustrates how jurisdictions structure adaptation targets, document review alone cannot fully explain how these targets function within governance systems in practice. These issues are explored further through the interview evidence presented later in this section.
How adaptation targets are embedded in governance systems
Interview findings show that adaptation frameworks often combine numeric, directional and indicator-based targets within the same system. Interviews examined how these different forms are used, what governance roles they serve, and what strengths and limitations have emerged in implementation. Table 1 presents examples drawn from interviewed jurisdictions to show how adaptation targets serve different governance functions depending on what they are intended to influence. Some focus on institutional capacity and integration, others on delivery of measures, others on the conditions and capacities that contribute to resilience and reduce risk (such as improved preparedness and reduced exposure), and a small number on reductions in realised losses.
Table : Observed Governance Functions of Adaptation Targets Across Jurisdictions
Target type
What they do
Example
Observations from the review
Input and capacity
Input or capacity targets focus on embedding climate risk within institutional systems and decision-making processes.
Percentage of organisations integrating climate risk into planning.
Interviewees described such targets as important for mainstreaming adaptation and reducing reliance on isolated initiatives. They are often within direct administrative control and can be reported consistently across sectors. However, they primarily track institutional behaviour rather than changes in exposure or vulnerability and, on their own, do not demonstrate whether resilience conditions are improving.
Output
Output targets focus on the delivery of tangible adaptation measures.
Kilometres of drainage infrastructure upgraded or numbers of retrofits completed.
These targets are frequently quantified, linked to budgets and implementation programmes, and are easily understood by stakeholders. They provide clear evidence of activity and enable transparent reporting of progress. However, they do not show whether vulnerability or risk exposure is declining. Approaches dominated by output targets therefore demonstrate activity without clear evidence of reduced vulnerability.
Outcome
Outcome targets capture changes in vulnerability, exposure, preparedness or acceptable levels of risk.
Reducing the proportion of properties at high flood risk or establishing probabilistic flood protection standards.
These targets clarify what resilience means in practical terms and link policy action to changes in risk conditions. Where modelling capacity and governance frameworks are well established, outcome-level or risk tolerance standards can provide stable benchmarks for long-term planning. However, because they are influenced by many external factors including climate variability and socio-economic changes, it can be difficult to attribute observed changes to specific interventions.
Impact
Impact targets aim to reduce climate-related harm, losses or damages.
Eliminating heat-related deaths.
Such targets articulate the ultimate purpose of adaptation policy and send a clear signal of long-term ambition. However, avoided losses are difficult to measure because they depend on estimating what would have happened in the absence of adaptation, and outcomes may also be influenced by external factors such as climate variability and socio-economic change. In addition, delivery pathways are often uncertain, meaning that impact-level targets are rarely embedded within formal monitoring frameworks.
Table . How Selected Jurisdictions Structure Adaptation Targets
Structured around five interconnected systems (e.g. disaster resilience, health and well-being, nature and biodiversity, infrastructure, economy and workers), alongside cross-cutting foundational themes (knowledge, tools and governance), with system-level goals, medium-term objectives, key milestones and near-term targets aligned to objectives, including instances where multiple targets relate to a single objective.
Extensive
Output and emerging outcome
National strategy with defined monitoring framework
Demonstrates how quantified targets can be layered across interconnected systems and aligned with strategic objectives
Quantification concentrated in the water domain, notably through clearly defined probabilistic flood protection standards (e.g. 1:100,000 annual exceedance probability), while the broader national adaptation strategy includes comparatively fewer quantified, time-bound targets across sectors.
Limited
Outcome (risk tolerance standard)
Flood protection standards legally embedded within the Delta Programme; broader strategy primarily strategic in orientation
Illustrates how quantified risk standards may be well developed in technically mature domains, while broader cross-sector quantification can evolve more gradually.
Adaptation-relevant quantified targets embedded within broader climate action plan including multiple sectoral actions.
Moderate
Predominantly output
Municipal climate action plan
Demonstrates integration of adaptation-related targets within wider climate strategies, though adaptation and mitigation targets are not always clearly distinguished
Table 2 provides illustrative examples of how different target types operate in selected jurisdictions and is not intended to be exhaustive.
Evidence from the literature and document review
Characteristics of high-quality adaptation targets
Across the literature and international document review, a consistent conclusion emerges: the quality of adaptation targets depends on clarity of intent, structure and measurability. Well-designed targets specify the risk addressed, the population or system concerned, the geographic scope, and the intended change over time (Magnan, 2016; Leiter et al., 2019). They distinguish between different types of targets and identify indicators (Berrang-Ford et al., 2019; UNEP, 2022), embed review mechanisms (Leiter et al., 2019; UNEP, 2022) and incorporate safeguards against maladaptation (UNEP, 2022; OECD, 2023). Where these elements are absent, targets risk becoming vague, symbolic or difficult to evaluate. This section synthesises the core characteristics of high-quality adaptation targets identified in the literature and observed in practice.
Defining target types improves clarity
Adaptation targets generally fall into four categories: process, output, outcome and impact (Berrang-Ford et al., 2019; UNEP, 2022). Process targets relate to institutional steps, outputs to actions delivered, outcomes to measurable changes in vulnerability or system performance, and impacts to reductions in climate-related loss or harm. These categories differ in measurability, attribution and time horizon. In practice, frameworks often blur these distinctions. Activities such as publishing plans or launching programmes may be reported as adaptation progress without clear evidence of risk reduction (Buntaine et al., 2017; Dzebo, 2019; Canosa et al., 2020). Distinguishing short-term process milestones from longer-term outcome and impact targets helps prevent administrative activity from being conflated with substantive adaptation (Magnan, 2016; UNEP, 2022).
Many jurisdictions therefore adopt layered structures in which near-term process and output targets support delivery, while outcome and impact targets provide strategic direction. Canada’s National Adaptation Strategy and Japan’s Climate Change Adaptation Plan illustrate how measurable near-term commitments can be aligned with longer-term objectives (UNEP, 2022; OECD, 2023).
High-quality targets define hazard, exposure, location and intended change
High-quality targets make the “unit of success” explicit. Generic formulations such as “increase resilience” lack the specificity required for implementation or evaluation (Magnan, 2016). Clear targets identify the hazard, the exposed people or assets, the relevant system or location, and the measurable change sought over a defined timeframe (Magnan, 2016; Berrang-Ford et al., 2019; Adaptation Scotland, 2022). For example, the Netherlands’ statutory flood protection standard requires that by 2050 every resident behind a primary flood defence faces an annual individual mortality risk from flooding of no more than 1 in 100,000. This specifies the hazard, the protected population, the infrastructure system and a quantified risk threshold within a defined timeframe, providing a concrete benchmark for engineering standards and investment decisions.
Where strong technical evidence exists, targets tend to be similarly precise. Belize’s mangrove restoration commitments specify hectares to be protected or restored by a defined year (Arkema et al., 2023). Other examples include hazard-specific ecological thresholds (Matthews et al., 2014; Bino et al., 2021), spatially bounded restoration targets (Goyette et al., 2023) and sectoral performance outcomes (Judd et al., 2022). Specificity strengthens clarity, monitoring, and integration into delivery systems.
Adaptive, revisable targets perform better under climate uncertainty
Static targets risk becoming misaligned as climate risks evolve. The literature emphasises designing targets that can be revised as evidence and policy priorities change (Hallegatte, 2009; Wise et al., 2014). Adaptive pathways approaches frame targets as part of staged decision processes rather than fixed end points. They incorporate thresholds signalling when existing measures become insufficient, triggers for alternative actions, and scheduled review cycles to reassess risk and performance (Haasnoot et al., 2013). Embedding review and revision into target design should therefore be understood as good governance rather than policy failure, supporting long-term resilience and learning (Hallegatte 2009; Biesbroek et al., 2018; UNEP, 2024).
Measurement systems should be defined at adoption
Target clarity depends on measurability. A consistent principle is that targets should be accompanied by a defined measurement plan specifying baselines, indicators, data sources, institutional responsibilities and reporting cycles (Leiter et al., 2019; UNEP, 2020; Essex et al., 2020). Many jurisdictions adopt targets before indicators or baselines are fully established, deferring measurement to later cycles and weakening accountability (UNEP, 2022; Mongelli et al., 2024). Strengthening monitoring and data systems is therefore fundamental to credible target-setting (UNEP, 2022; World Bank, 2023).
Tiered indicator systems, structured around a theory of change, improve coherence and link actions to impacts
Outcome indicators provide forward-looking evidence of improvements in vulnerability or system performance, while impact indicators capture reductions in loss or harm. Because outcome data mature slowly and attribution is complex, many jurisdictions rely initially on process and output indicators, even though these do not demonstrate risk reduction on their own (Berrang-Ford et al., 2019). Recent guidance and reviews encourage tiered systems that link process, output, outcome and (where possible) impact metrics along a coherent results chain (UNEP, 2022; OECD, 2023). In such systems, outputs represent actions delivered, outcomes reflect measurable changes in exposure or vulnerability, and impacts capture ultimate reductions in harm. Making these causal links explicit prevents delivery indicators from substituting for substantive progress and clarifies how near-term actions contribute to long-term resilience (Magnan, 2016). For example, an urban heat strategy might link tree planting outputs to increased canopy cover outcomes and, ultimately, to reductions in heat-related mortality. Although multiple interventions typically contribute to impact reduction and attribution is rarely linear, articulating these pathways improves coherence and review (Hallegatte, 2009; Wise et al., 2014; Watkiss and Hunt, 2019).
Embedding equity into target design strengthens distributive accountability
Equity is widely recognised as central to adaptation (Eriksen et al., 2015; Dilling et al., 2019; Biesbroek et al., 2025). Adaptation targets are inherently distributive, shaping whose risks are reduced and who benefits first. Yet equity is often expressed as principle rather than measurable commitment. High-quality targets identify intended beneficiaries and require that progress be tracked through disaggregated indicators across relevant dimensions of vulnerability (Ziervogel and Taylor, 2008; Adaptation Scotland, 2022).
Although equity is rarely framed as a standalone quantified target, some jurisdictions operationalise it through disaggregated monitoring, spatial prioritisation or beneficiary-specific commitments. For example, Canada’s National Adaptation Strategy tracks climate-related health outcomes across defined vulnerable populations, while several European cities prioritise adaptation investment in socially vulnerable neighbourhoods (Reckien et al., 2018; EEA, 2015). Belize’s mangrove targets are framed in relation to protecting coastal communities and livelihoods (Arkema et al., 2023). Where clearly specified, such mechanisms strengthen accountability by clarifying intended beneficiaries and preventing aggregate improvements from obscuring persistent inequalities.
Safeguards are needed to prevent maladaptation
Poorly designed targets can shift risks across sectors, locations or social groups (Magnan, 2016; UNEP, 2022). Targets framed narrowly around visible outputs, such as hectares restored or flood defences constructed, may generate ecological pressures or downstream impacts if system interactions are not assessed. In such cases, adaptation can redistribute risk rather than reduce it. The literature therefore emphasises integrating maladaptation screening and cross-sector assessment into target design rather than treating these as afterthoughts (OECD, 2023). This is particularly important where land use, water management and infrastructure systems interact closely. Ensuring that targets deliver net resilience gains and avoid locking in future vulnerabilities is central to long-term effectiveness (Bino et al., 2021; OECD, 2023).
Governance, decision-making and institutions
Adaptation target-setting is shaped not only by technical considerations but also by governance structures, institutional capacity and political incentives. The literature consistently shows that targets operate as political-administrative tools serving multiple functions: signalling ambition, guiding delivery, supporting learning and structuring accountability.
Targets serve multiple institutional and political purposes.
The literature shows that adaptation targets are often designed to perform several roles simultaneously, rather than fulfilling one primary purpose. For example:
Agenda-setting. Targets often use broad or aspirational language to raise the visibility of adaptation, communicate political commitment and align with international expectations—even when operational detail remains limited (Magnan 2016; UNEP 2020, 2022, 2024; Buntaine et al. 2017).
Guiding institutional effort. Targets help structure planning, justify budget allocations, and prioritise sectors or measures (Berrang-Ford et al. 2019). Documentary evidence from Canada and Japan emphasises that indicators and measurement frameworks are essential for steering investment and monitoring delivery (UNEP 2022; OECD 2023).
Accountability benchmarks. Even when non-binding, targets create reference points for public, parliamentary or peer scrutiny. However, the literature documents widespread weaknesses in baselines, indicators and monitoring systems, which often make accountability symbolic rather than enforceable (Buntaine et al. 2017; Dzebo 2019; EEA 2015).
Engagementand shared responsibility Adaptation targets can help communicate urgency and engage citizens, businesses and institutions (Magnan 2016). National adaptation strategies—for example in Japan—explicitly use KPIs and indicators to embed adaptation across administrative levels and to promote public recognition (Japan Climate Adaptation Plan, 2021).
International alignment and legitimacy. Targets also help countries signal their alignment with global processes such as UNFCCC reporting, NDC commitments and regional frameworks (Biagini et al. 2014; England et al. 2018; UNEP 2022). This alignment role can encourage the use of broad, aspirational statements rather than operationally specific targets.
Governance typically follows a central coordination–distributed ownership model
The literature identifies a dominant governance pattern in which central government provides coordination and strategic direction, while sectoral ministries and subnational authorities design and deliver operational targets. This arrangement balances cross-government coherence with the flexibility needed for sector-specific and place-based implementation.
Central government as coordinator: National environment or climate ministries most commonly lead the development of adaptation targets and UNFCCC reporting (Berrang-Ford et al. 2014, 2019). In practice, they convene cross-government actors, align priorities and embed adaptation targets within national strategies and regulatory frameworks.
Inter-ministerial coordination is essential but variable: Because adaptation spans multiple policy areas, coordination bodies, such as climate secretariats and inter-ministerial committees, are mentioned as important for coherence (England et al. 2018). Their role is primarily to facilitate across sectors, resolve competing priorities and translate high-level objectives into measurable targets. Zambia’s Interim Climate Change Secretariat uses this approach to align agriculture, water and environment ministries around shared goals (England et al. 2018).
Finance ministries are essential enablers: A recurring finding is that without the involvement of finance ministries, adaptation targets remain underfunded and weakly implemented (Arkema et al. 2023; OECD 2023; UNEP 2022). Sectoral cases such as Belize show how evidence-based targets can be aligned with national development and finance structures (Arkema et al. 2023). Embedding adaptation in budgetary processes e.g. through expenditure tracking, multi-year financing plans or integration into routine budgeting, significantly improves deliverability. The literature notes emerging examples where adaptation spending is linked to national development budgets or public financial management reforms, for example Belize’s integration of adaptation targets into its Nationally Determined Contribution (NDC) and associated finance structures, though most reviews conclude that systematic budget integration is still limited and uneven.
Independent advisory bodies strengthen transparency: Although they cannot enforce compliance, climate change committees, audit institutions and scientific advisory bodies enhance transparency by monitoring progress, assessing evidence and advising governments (Arkema et al. 2023; Berrang-Ford et al. 2019). Their presence can reinforce the credibility of centrally coordinated processes.
Sectoral and subnational actors develop and deliver operational targets: More specific and measurable targets often emerge at sectoral or local levels, where governance structures and technical capacity support detailed implementation. Examples include environmental flows in water management (Bino et al. 2021; Judd et al. 2022), wetland and habitat restoration (Goyette et al. 2023), and urban and regional adaptation planning (Reckien et al. 2018). These cases demonstrate how distributed ownership enables targets to reflect local risks, regulatory responsibilities and operational capacities, while remaining aligned with a central coordination framework.
Accountability is often indirect and non-binding
Across the literature, accountability for adaptation targets is generally weak, operating through political and procedural channels rather than legal or enforceable mechanisms. Most targets are embedded in policy frameworks rather than legislation, meaning governments face no formal penalties for underperformance (Berrang-Ford et al. 2019). As a result, accountability relies heavily on internal reporting, periodic strategy updates and peer scrutiny within government rather than external assessment (EEA 2015). This is particularly the case where adaptation strategies rely on directional policy commitments or recommended actions rather than quantified targets. Austria’s national adaptation strategy provides one example. The strategy sets out sectoral objectives and recommended actions across government rather than binding performance benchmarks, with implementation coordinated across ministries and federal states and reviewed through periodic progress reporting. While this approach supports coordination and shared ownership, it offers limited mechanisms for corrective action if progress is insufficient. Independent oversight bodies such as climate change committees, audit institutions and scientific advisory panels can strengthen transparency by tracking progress and advising governments (Arkema et al. 2023; Berrang-Ford et al. 2019), but their role is advisory and they cannot compel revisions to targets or reallocation of resources. Some countries do have more structured oversight architectures, for example, Canada combines interdepartmental reporting, scrutiny by the Auditor General and oversight from the Commissioner for Environment and Sustainable Development, yet even these mechanisms stop short of creating legally enforceable obligations.
A recurring finding is that meaningful accountability depends on the availability of clear indicators, baselines and monitoring, evaluation and learning (MEL) systems. Where these measurement systems are incomplete or disconnected from target-setting, it becomes difficult to assess progress, ensure comparability or initiate revisions (Bino et al. 2021; Ford et al. 2013; UNEP 2022). Without robust indicators and MEL frameworks, accountability remains largely symbolic because there is no consistent basis for evaluating performance or signalling when targets require adjustment.
Adaptation targets are political constructs shaped by feasibility and institutional constraints
The literature shows that adaptation targets are shaped less by what would most effectively reduce climate risk and more by what is politically, financially and institutionally viable. Several issues recur in how targets are designed. Short political cycles create strong incentives for visible, near-term outputs, making measurable actions more attractive than longer-term or transformational investments (Geden 2016; Hallegatte 2009; Zhang et al. 2023). Standardised or symbolic indicators such as plans produced or hectares restored, are often chosen because they are easier to implement and compare, even when they align only loosely with ecological thresholds or system dynamics (Bino et al. 2021; Goyette et al. 2023; Ford et al. 2013).
Budgetary constraints also limit ambition as targets usually need to fit within existing budgets, fragmented funding streams and limited administrative capacity, which encourages incremental approaches rather than more substantial or transformational shifts (UNEP 2020, 2022, 2024; OECD 2023). Data availability also influences target design. What can be measured is often prioritised, and in data-poor contexts targets tend to default to process indicators rather than vulnerability-reduction outcomes (Leiter et al. 2019; Berrang-Ford et al. 2019).
Equity and justice are widely acknowledged but rarely embedded in target design
Although Section 4.3 highlighted the importance of embedding equity within the design of adaptation targets, the literature shows that only a limited number of adaptation frameworks operationalise equity directly within target systems. Across the literature, equity is frequently cited as a core principle in adaptation planning, yet in practice it is more often addressed through consultation processes, participation mechanisms or high-level principles rather than through measurable or enforceable commitments (Magnan 2016; Dilling et al. 2019; Biesbroek et al. 2025). As a result, distributional accountability remains limited and the intended beneficiaries of adaptation measures are often left unspecified. Some national strategies reference equity through methodological guidance, for example by encouraging vulnerability assessments and distributional considerations in countries such as Bangladesh, as well as through wider international guidance promoting social and vulnerability-based criteria when selecting measures. These tools influence how targets are developed but typically stop short of generating explicit equity-focused targets or disaggregated indicators.
The literature also shows that technocratic, indicator-driven approaches to adaptation can inadvertently marginalise lived experience and Indigenous knowledge. Studies of ecosystem and land-use indicators demonstrate that standardised metrics, such as hectares restored or protected, often overlook Indigenous land management practices and locally defined wellbeing outcomes, privileging what is easy to quantify over what communities value (Ford et al. 2013; Bino et al. 2021; Eriksen et al. 2015). Similar issues arise in urban adaptation research, where vulnerability metrics based largely on available administrative data can exclude informal settlements or undocumented populations, thereby underrepresenting those who are most at risk (Reckien et al. 2018).
Stakeholder Engagement
Stakeholder engagement is broad but influence over target design remains concentrated
Across the literature, stakeholder engagement in adaptation target-setting is described as broad in scope but uneven in influence. Environment or climate ministries typically lead and coordinate these processes, supported by expert groups responsible for modelling, indicator development and technical assessment (Judd et al. 2022; Arkema et al. 2023; Matthews et al. 2014). Other participants commonly include scientific institutions, sectoral agencies such as water or forestry authorities, non-governmental organisations and, in some cases, private-sector actors involved in infrastructure delivery or risk management.
Although these processes often include civil society organisations and community groups, studies highlight that decision-making authority over target ambition, metrics and thresholds largely remains with government and technical experts (Magnan 2016; Eriksen et al. 2015; Canosa et al. 2020; Biesbroek and Delaney 2020). Consistent with this, Ziervogel and Taylor (2008) show that participation frequently informs agenda-setting or problem framing but rarely shifts the underlying power dynamics that determine formal decision authority. As a result, pathways from participation to decision rights are typically weak, and engagement tends to focus on shaping priorities rather than influencing the technical specification of targets.
Engagement improves relevance, legitimacy and feasibility even when formal influence is limited
Despite these limitations, the literature emphasises significant benefits associated with well-structured stakeholder and community level engagement. Participatory processes can improve the relevance of targets by surfacing granular insights into local vulnerabilities, lived experience and sector-specific constraints (Dilling et al. 2019; Leiter et al. 2019). Ziervogel and Taylor (2008) similarly highlight how community knowledge can illuminate risk dynamics that formal assessments overlook, particularly in contexts where administrative data is limited or uneven.
Citizen engagement also enhances legitimacy, especially where affected communities understand how decisions were made and how their input shaped the process. These legitimacy effects can strengthen public support and reduce resistance during implementation. Moreover, wider engagement can help refine feasibility assessments, identify implementation barriers early, and highlight where quantitative targets may conflict with social or distributional priorities. Even when technical parameters remain expert-defined, wider engagement, including citizen engagement, contributes to a more grounded and socially informed design process.
Trade-offs are handled most effectively when engagement is deliberative and co-productive
The literature also shows that stakeholder engagement is most effective when trade-offs are surfaced and negotiated transparently rather than resolved internally by technical teams (Arkema et al. 2023; Matthews et al. 2014; Yule et al. 2025). Trade-offs arise when decisions require balancing competing priorities, for example, distributing resources across sectors, reconciling environmental and economic objectives, or determining which populations are prioritised for risk reduction.
Structured deliberation, iterative workshops and co-production approaches help clarify these competing interests and can improve both the robustness and legitimacy of decisions. In Austria’s national adaptation strategy, for example, multi-stakeholder workshops were used to negotiate priorities across sectors such as agriculture, environment and regional development, reflecting a governance model that relies on consensus-building rather than quantified targets. Similar deliberative processes were used in Germany when developing measurable adaptation targets under the Climate Adaptation Act, where ministries, experts and stakeholders contributed to refining targets and resolving overlaps across thematic clusters. These examples illustrate how explicit negotiation can build shared understanding even when government retains responsibility for final decisions.
Several studies of participatory adaptation processes warn, however, that insufficient or superficial engagement can lead to tokenism, privileging technical or administrative perspectives over lived experience (Eriksen et al. 2015; Dilling et al. 2019; Biesbroek et al. 2025; Kythreotis et al. 2020). Ziervogel & Taylor (2008) reinforce this concern, showing that without meaningful deliberation, engagement processes risk reproducing existing inequalities, with marginalised voices heard but not acted upon. This underscores the need for engagement approaches that not only solicit input but also address underlying power dynamics.
Capacity, Resources and Feasibility
Across the literature and documents reviewed, capacity, resources and feasibility consistently emerge as the foundations of credible adaptation targets. Where evidence systems, institutional mandates, finance and monitoring capabilities are strong, targets become clearer, more measurable and more actionable. Where these enabling conditions are weak, targets tend to be symbolic, vague or unrealistic, regardless of political intent (UNEP 2020; UNEP 2022; OECD 2023; World Bank 2023; Magnan 2016). Developing robust targets therefore requires investing in the analytical, financial, institutional and delivery systems that shape both the form and ambition of adaptation targets before they are integrated into wider planning and implementation frameworks (Biagini et al. 2014; Adaptation Scotland 2022; Leiter et al. 2019).
Strong evidence systems enable credible and actionable adaptation targets
The strength of a government’s evidence base is a key predictor of its ability to set credible and measurable adaptation targets. Jurisdictions with robust risk assessments, climate projections, modelling capacity and exposure analysis are better able to translate scenarios into quantitative or threshold-aligned targets, such as hydrological modelling used to define environmental flow requirements, biodiversity thresholds, or city-scale heat and flood analyses that inform spatial commitments (Matthews et al. 2014; Bino et al. 2021; Judd et al. 2022; Goyette et al. 2023; Arkema et al. 2023; Mongelli et al. 2024; Neocleous et al. 2023).
The literature review emphasised the importance of downscaled models, local indicators and practical monitoring tools in supporting targets that can guide real-world decisions (Adaptation Scotland 2022; UNEP 2020; UNEP 2022; UNEP 2024; World Bank 2023; OECD 2023; Tompkins et al. 2018; Berrang-Ford et al. 2014; Berrang-Ford et al. 2019; Arfanuzzaman 2024; Canosa et al. 2020; Yule et al. 2025). However, capability is uneven: some sectors maintain strong in-house analytical expertise, while others lack tools or rely heavily on external consultants, resulting in significant variation in what different parts of government can credibly commit to (Biesbroek & Delaney 2020; Reckien et al. 2018; UNEP 2022; World Bank 2023). This variation means that jurisdictions with strong evidence systems tend to set time-bound, quantitative or threshold-based targets, while those with weaker evidence bases may set directional, qualitative or process-based targets (Magnan 2016; Leiter et al. 2019; Biesbroek et al. 2018). Effective target-setting requires evidence systems capable of supporting the level of specificity sought. Outcome- and impact-level targets require data, modelling and clear baselines to establish thresholds and plausible pathways for change, whereas many process and output targets can be developed with more limited analytical foundations.
Technical capacity shapes both the form and specificity of adaptation targets
Capacity strongly influences both what governments target and how precisely they do so. Where technical systems and data infrastructures are strong, targets tend to be quantitative, time-bound and aligned with thresholds (Berrang-Ford et al. 2014; Arkema et al. 2023; Goyette et al. 2023). Where capacity is weaker, targets remain qualitative, directional or process-based (Berrang-Ford et al. 2019; Tompkins et al. 2018; UNEP 2020, 2022, 2024). Many strategies express high ambition but lack measurable values, with quantification occurring only in sectors where statutory levers or long-established delivery systems exist. In these contexts, the form of targets reflects analytical constraints as much as political ambition (Biagini et al. 2014; Adaptation Scotland 2022; OECD 2023; Magnan 2016).
Financial feasibility is essential but rarely integrated into target-setting
Across the literature, few national or local strategies link target levels to costed delivery plans, budget lines or long-term finance pathways. Global and national reviews consistently identify chronic underfunding and the absence of clear financing pipelines, often resulting in strategies that list desirable actions without showing how they will be delivered (UNEP 2020, 2022, 2024; World Bank 2023; OECD 2023; Arfanuzzaman 2024). While appraisal tools exist (Watkiss and Hunt 2019), they are seldom applied systematically. This disconnect means that targets may formally commit governments to outcomes that are financially unviable, creating expectations that exceed available resources. In such cases, targets become barriers to implementation because they absorb administrative effort without generating deliverable pathways. Embedding financial realism at the design stage is therefore essential (UNEP 2020, 2022; World Bank 2023).
Clear mandates and governance structures enable feasible and deliverable targets
Strong evidence does not guarantee feasibility. Governance arrangements, including clear mandates, coordination mechanisms, and structured monitoring systems, are decisive in determining whether targets can be delivered. Jurisdictions with well-defined responsibilities and coordination structures tend to set more specific and actionable targets (EEA 2015; England et al. 2018; Reckien et al. 2018; Dzebo 2019; Leiter et al. 2019; OECD 2023). Where responsibilities are fragmented, targets remain vague or become confined to sectors with strong statutory levers such as water management (Berrang-Ford et al. 2014; Berrang-Ford et al. 2019; Tompkins et al. 2018; Ziervogel and Taylor 2008; Roggero and Thiel 2021). Feasible targets therefore require clarity on ownership, delivery partners and the legislative or regulatory frameworks that enable implementation (Magnan 2016; OECD 2023; World Bank 2023).
Monitoring capacity and attribution limits what targets can realistically track or revise
Monitoring, evaluation and learning (MEL) systems determine whether targets can be tracked or adjusted over time. Many governments lack stable indicators, consistent data or clear reporting responsibilities, forcing reliance on process indicators that are easy to measure but weak proxies for vulnerability reduction (Magnan 2016; Leiter et al. 2019; Biesbroek et al. 2018; UNEP 2022; OECD 2023). Because strict attribution is rarely possible in complex systems, feasible targets focus on contribution, system performance and functional improvements rather than direct causal claims (Hallegatte 2009; Moser and Ekstrom 2010). The literature also highlights the importance of staging through interim milestones and scheduled reviews to keep long-term targets on track (Biesbroek et al. 2018; UNEP 2024; Matthews et al. 2014; Bino et al. 2021). Approaches grounded in a theory of change are increasingly recommended because they help clarify causal pathways, intermediate outcomes and realistic expectations of progress.
Targets are more deliverable when aligned to sectoral and local implementation capacity
Targets are most feasible when aligned with the practical capabilities of the institutions responsible for delivery. The literature highlights persistent scale mismatches between national ambitions and local authority capacity, with many local governments lacking the staff, data systems or operational tools required to implement targets consistently (Berrang-Ford et al. 2014; Berrang-Ford et al. 2019; Reckien et al. 2018; England et al. 2018; Ziervogel and Taylor 2008; Yule et al. 2025). Feasible targets therefore need to be co-designed with delivery systems, tailored to available capacity and grounded in realistic assessments of what can be operationalised at different scales (Biagini et al. 2014; Adaptation Scotland 2022; OECD 2023; World Bank 2023).
Political framing strongly influences whether governments quantify adaptation targets
Target-setting is also shaped by how adaptation is politically and conceptually understood. Concepts such as acceptable risk, resilience thresholds and success criteria are inherently political (Tompkins et al. 2018; Magnan 2016; Geden 2016). Some jurisdictions avoid quantification because adaptation is understood as an iterative, learning-oriented process that cannot easily be captured by fixed numerical values. Others quantify only where delivery levers and accountability mechanisms are clear (Biesbroek and Delaney 2020; Canosa et al. 2020; World Bank 2023). The literature warns that arguments about “feasibility” can limit ambition, especially when budgets are tight or when tasks are shifted to organisations that lack the capacity to deliver them. (Eriksen et al. 2015; Biesbroek et al. 2025; Puig et al. 2025; Kythreotis et al. 2020). Feasibility is ultimately determined by the mix of analytical capacity, governance arrangements and how willing governments are to define what success looks like.
Integration, Coherence and Implementation Pathways
Across the literature, a consistent message is that the credibility and deliverability of adaptation targets depend on how well they are integrated into existing planning, governance and monitoring systems (UNEP 2020, 2022; OECD 2023; World Bank 2023; Berrang-Ford et al. 2014, 2019). Targets aligned with sectoral programmes, statutory duties and cross-government processes have clearer delivery pathways, while targets that sit outside these systems struggle to influence decisions (Adaptation Scotland 2022; Arkema et al. 2023; Bino et al. 2021; Judd et al. 2022). Integration concerns how targets connect to mandates, planning cycles, investment processes and review mechanisms (OECD 2023; Magnan 2016; Leiter et al. 2019). When governance is coherent and supported by functioning review systems, targets can shape policy and investment decisions; when governance is fragmented, targets tend to remain aspirational rather than actionable (Berrang-Ford et al. 2019; Arfanuzzaman 2024; Roggero and Thiel 2021).
Targets are most effective when embedded within established planning and delivery systems
Evidence shows that targets are more influential when they are integrated into established planning and delivery systems such as procurement, regulatory standards, spatial planning, asset management and service delivery (UNEP 2020, 2022; OECD 2023; World Bank 2023; Adaptation Scotland 2022; Reckien et al. 2018). Documented examples include Japan and Canada, where targets are embedded within sectoral strategies and statutory frameworks, and European ecological commitments, which are most enforceable when connected to water and biodiversity legislation (Bino et al. 2021; Judd et al. 2022; Goyette et al. 2023; Biesbroek and Delaney 2020). In contrast, plans that lack linkages to statutory or sectoral systems tend to exert limited influence on decisions (Reckien et al. 2018; Lyytimäki et al. 2021; England et al. 2018). Integrated targets therefore sit within delivery architectures that support enforceability, accountability and political traction (Arkema et al. 2023; OECD 2023; World Bank 2023).
Fragmentation across sectors and levels of government undermines coherent target delivery
The literature consistently identifies fragmentation across sectors and governance levels as a barrier to effective implementation of adaptation targets. National plans often contain overlapping frameworks or differing definitions of what constitutes a target (Berrang-Ford et al. 2014, 2019; Arfanuzzaman 2024). Document reviews show that Germany, Finland and the Netherlands use the term ‘target’ inconsistently across sectors. While the literature does not identify this inconsistency as a direct barrier to implementation in these specific jurisdictions, studies of European national and urban adaptation plans show that inconsistent terminology, weak indicator frameworks and unclear links between actions and outcomes are common challenges that contribute to fragmented governance and make it harder to track progress (Reckien et al. 2018; Lyytimäki et al. 2021; Sietsma et al. 2021). Research also suggests that local authorities struggle to align with national ambition because of unclear linkages between governance systems and reporting requirements (Kythreotis et al. 2020; Yule et al. 2025). As a result, coherence that appears strong in documentation often proves difficult to operationalise in practice. Fragmentation therefore limits alignment, coordination and the translation of targets into operational action (Roggero and Thiel 2021; World Bank 2023). The literature suggests that coherence can be strengthened through clearer vertical alignment between national and subnational targets, shared indicator frameworks, and coordinated monitoring and reporting systems that link sectoral and territorial levels of governance (Berrang-Ford et al. 2019; Reckien et al. 2018; Wise et al. 2014).
Global and regional frameworks support integration, but domestic revision remains inconsistent
Global and regional frameworks, including the Paris Agreement and Global Stocktake, provide regular points for reviewing adaptation targets (UNEP 2020, 2022, 2024; Magnan 2016; Tompkins et al. 2018). Donor and multilateral funding cycles also create external rhythms for reporting and revision (World Bank 2023; OECD 2023). Several countries, including Canada and Germany, align their monitoring and reporting systems with these external processes (Berrang-Ford et al. 2019; Reckien et al. 2018; Yule et al. 2025). However, international cycles rarely ensure domestic revision. Long-term targets often remain unchanged because revision entails political costs, such as reputational risk or perceptions of failure (Geden 2016; Raiser et al. 2020). The literature emphasises that while global processes structure reporting, domestic political commitment, institutional authority and internal governance mechanisms determine whether targets are updated. External frameworks can facilitate integration, but domestic political incentives and institutional arrangements are the primary drivers of change (UNEP 2022; World Bank 2023).
Iterative revision mechanisms are necessary but politically sensitive and inconsistently used
The literature distinguishes between formal revision mechanisms (monitoring and reporting systems, donor requirements) and informal mechanisms (political leadership, new evidence, interdepartmental negotiation) (UNEP 2020, 2022, 2024; Berrang-Ford et al. 2019). Structured revision processes are documented in Canada and Japan, but many countries lack clear pathways for updating targets (Leiter et al. 2019; Sietsma et al. 2021). Revision is politically sensitive because altering a target can be interpreted as lowering ambition or admitting inadequate progress (Biesbroek et al. 2025; Dilling et al. 2019). Revision is more likely where monitoring systems are well institutionalised and have senior-level support (Matthews et al. 2014; Bino et al. 2021; Judd et al. 2022). Where responsibilities are unclear or indicator systems are weak, targets tend to remain static (Magnan 2016; UNEP 2022). Iterative revision therefore depends as much on political culture and institutional support as on technical mechanisms (Hallegatte 2009; Moser and Ekstrom 2010; Wise et al. 2014).
Meaningful integration must align with political, social and contextual realities as well as technical systems
The literature cautions that integration cannot be treated solely as a technical exercise (Eriksen et al. 2015; Dilling et al. 2019; Biesbroek et al. 2025). Aligning targets with global frameworks may overlook local knowledge or equity concerns, and ecological studies warn against generic targets that lack regional grounding (Goyette et al. 2023; Matthews et al. 2014). Document reviews show that resistance to quantification in cases such as Austria reflects deeper political and conceptual understandings of adaptation, including the belief that adaptation is iterative and cannot be meaningfully expressed through fixed values (Reckien et al. 2018; Lyytimäki et al. 2021). Integration also requires legitimacy, communication and narratives that resonate with institutions and communities (Garvey et al. 2023; Kythreotis et al. 2020). Equity considerations remain central to meaningful alignment (Eriksen et al. 2015; OECD 2023). Integration is therefore shaped by values, political priorities and authority, not only by technical frameworks (Magnan 2016; World Bank 2023)
Deliverability depends on embedding targets in the operational systems responsible for implementation
For targets to influence real-world outcomes, they must align national ambition with the operational systems responsible for implementation, including land-use planning, water management, infrastructure investment, biodiversity management and economic development (OECD 2023; World Bank 2023). Targets influence outcomes most effectively when they are embedded in regulatory systems, investment cycles and sectoral delivery pathways (Arkema et al. 2023; Bino et al. 2021; Judd et al. 2022; Goyette et al. 2023).
Document reviews show that cities such as Barcelona, Paris and Lisbon incorporate adaptation into spatial planning, procurement and infrastructure programmes, integrating targets directly into the delivery systems responsible for implementation. This reflects a broader pattern observed in the literature, where local and regional authorities are often better positioned to operationalise adaptation commitments because they control land-use planning, infrastructure investment and service delivery (Reckien et al. 2018; Sietsma et al. 2021; Lyytimäki et al. 2021). By contrast, national strategies more commonly establish strategic direction while relying on sectoral ministries and subnational authorities to translate targets into operational action. Where targets sit outside these operational systems, they tend to remain disconnected from implementation and have limited influence on investment decisions or sectoral practice (Berrang-Ford et al. 2014, 2019; Adaptation Scotland 2022; Garvey et al. 2023).
Evidence from Interviews
Part A has examined what the international literature and national strategies reveal about effective adaptation target-setting, the characteristics of high-quality targets, the systems that support them, and the governance and feasibility conditions that shape their credibility. Part B now turns to the interview evidence. Semi-structured interviews were conducted with policymakers and technical experts from seven jurisdictions: Canada, Germany, Kenya and the Netherlands, and the cities of Barcelona, Lisbon and Paris. In responding to interview questions, practitioners described their experiences in terms of drivers, negotiation, institutional culture and iterative learning. For this reason, the interview findings are presented as a narrative account of how jurisdictions actually agree, design, operationalise and revise adaptation targets in practice.
Although structured differently, the interview findings reinforce and add nuance to the five analytical themes identified in Part A by illustrating how these dynamics play out in practice within government institutions. They illuminate how constraints and opportunities are interpreted within government, how ambition is negotiated, and how targets evolve over time within real institutional settings.
What Jurisdictions Have Learned About Setting Adaptation Targets
The seven jurisdictions examined, four national governments and three cities, took different approaches to setting adaptation targets. Some set clear numeric targets. Others used broader goals supported by indicators. Some wrote targets into law, while others relied on reporting and coordination. Despite these differences, common lessons emerged about how targets are introduced, defined and maintained over time.
The sections that follow examine five themes. First, what prompts governments to move from general adaptation goals to measurable targets. Second, how targets are negotiated with the departments responsible for delivering them. Third, what “measurable” means in practice, including how governments deal with outcomes influenced by multiple factors. Fourth, how monitoring and review affect whether targets remain visible and are updated over time. Fifth, how the way government is organised, and the data and staff capacity it has, shape the type of targets that are set.
The interviews largely reinforced the literature finding that targets tend to be introduced at moments when climate evidence converges with political or institutional triggers, such as legal changes, external reporting pressures or recent climate impacts that heighten the need for clearer commitments. Interviewees described targets as useful for setting direction and tracking progress. They did not identify a single model that works in all contexts, although targets were seen as most effective when they align with how government is organised, the data available and the actors responsible for delivery. Further detail on the interview approach and case study findings is provided in the appendices, including the interview topic guide (Appendix C) and jurisdictional case summaries (Appendix E).
Why targets are introduced
Climate risk assessments shaped what targets looked like, but they did not by themselves lead governments to introduce measurable targets. In Germany, the trigger was legal. The Climate Adaptation Act required the national strategy to include measurable targets, indicators and measures. Interviewees suggested that without this change, targets would not have been developed in such a structured way. In Canada, measurable targets were added late in drafting the National Adaptation Strategy. Interviewees described pressure to demonstrate tangible progress on resilience, alongside sustained advocacy from the insurance sector for clearer national benchmarks. Austria has debated SMART targets for more than a decade but has chosen not to adopt them. Interviewees cited concerns about attribution, shifting climate baselines, and the risk that numeric targets could imply more certainty than exists.
At city level, recently experienced climate impacts sharpened the case for targets. In Barcelona, drought made water-related targets more urgent and specific. In Paris, repeated heatwaves increased pressure for measurable commitments on cooling and greening. In Lisbon, adaptation plans were produced, but interviewees noted that the metropolitan strategy does not clearly consolidate headline numeric targets. Some quantitative figures appear in sectoral initiatives or supporting documents, but they are not presented as a unified set of strategic targets in the main plan. Across these cases, clearer adaptation targets tended to emerge when climate risk evidence was reinforced by legal requirements, external pressure or recent impacts that increased demand for measurable commitments.
Ownership and negotiated ambition
In all jurisdictions, ambition was shaped through negotiation with those responsible for delivery. In Germany, each ministry drafted its own targets within a shared structure. The Environment Ministry coordinated the process but did not set target levels. Interviewees emphasised that ministries should commit only to targets they are willing and able to implement. In Canada, responsibility is organised around five thematic “systems” (such as health and infrastructure), each led by a designated federal department. These lead departments developed targets within their area, aligned with existing programmes and funding. Interviewees were clear that limited resources constrained ambition and departments avoided commitments that were not backed by secured budgets.
Austria provides a contrasting example of how ambition is negotiated where formal targets have not been adopted. Rather than adopting formal SMART or quantified adaptation targets, the national adaptation strategy relies on sectoral goals and collaborative monitoring processes developed through workshops and dialogue across ministries, provinces and experts. Interviewees explained that concerns about attribution, shifting climate baselines and the risk of overpromising led policymakers to favour consensus-based coordination over formal targets.
A similar pattern appeared at city level. In Barcelona, delivery departments own their targets, while the climate office coordinates reporting. In Paris, sector departments define commitments within their mandates. In Lisbon, fragmented responsibilities across municipalities made it harder to consolidate and track targets consistently. Across the interviews, targets were more likely to be implemented when the actors responsible for delivery helped define them.
What “measurable” means in practice
The interviews show that “measurable” is understood differently across jurisdictions and sectors. In Germany, some targets include clear quantitative values and timeframes. Others are framed as directional goals, supported by indicators that are still being developed. Interviewees described this as a pragmatic approach: i.e. start with measurable commitments and refine them over time. Canada’s targets also vary. Some targets set clear numerical milestones. Others focus on ensuring that climate risk is built into planning, investment and decision-making processes. Interviewees explained that many early targets are near-term milestones intended to build momentum and support monitoring.
Austria tracks more than 100 quantitative indicators but has not adopted formal SMART targets[3]. Interviewees explained that the strategy emphasises monitoring progress and learning across sectors rather than defining fixed numerical thresholds for performance. There is also ongoing debate about whether numeric thresholds can capture adaptation outcomes, particularly where attribution is complex.
The city cases show similar variation. Barcelona’s water targets are clearly quantified, reflecting strong technical capacity. However, interviewees noted that greening targets are more difficult to deliver in a dense city where space is limited and drought places additional pressure on vegetation, meaning that targets in this area are often more contested and harder to achieve in practice. In Lisbon, quantitative figures tend to appear within individual measures or sectoral initiatives rather than as clearly defined strategic targets. Interviewees noted that the metropolitan adaptation plan does not present a consolidated set of overarching numeric targets in the main strategy document.
Across cases, interviewees questioned how far changes in outcomes can be directly linked to policy or their interaction with other social-economic factors. For example, heat-related deaths depend not only on government action but also on population age, individual behaviour and the severity of heat events. Drought can reduce water use, but it can also damage trees and green space. Because these outcomes are influenced by many factors, some jurisdictions use indirect indicators, for example measures such as tree canopy cover, access to cooling centres, or reductions in potable water consumption, to track progress, rather than trying to measure final impacts alone. In practice, what counted as “measurable” depended on the data available, the nature of the sector and the practical limits on delivery.
Monitoring, revision and accountability
How targets are monitored affects whether they remain useful over time. In Germany, targets sit within a formal cycle linking climate risk assessment, strategy, monitoring and revision. Progress is reviewed through the monitoring process and feeds into a formal policy cycle in which the strategy is revised every four years and the national climate risk assessment is updated every eight years. Monitoring results inform public reporting and subsequent revisions to targets. There are no sanctions for missing targets, but ministries are expected to explain gaps and propose further action. Canada’s monitoring framework is still being developed. Each lead department reports on progress within its system. Interviewees described this as an evolving process that is expected to strengthen over time. Austria provides a different model. Although the national adaptation strategy does not include formal SMART or quantified targets, progress is monitored through a combination of indicator tracking and sector workshops. Experts from ministries, provinces and academia review progress through structured discussion alongside more than 100 quantitative indicators.
At city level, Barcelona has an established reporting process. Departments report on implementation and indicators, and the climate office compiles this information for senior leadership. Targets are not legally binding, but regular reporting creates visibility and follow-up. In Lisbon, interviewees described monitoring as uneven. Where reporting systems are fragmented, it becomes difficult to track targets consistently. Across all the cases we looked at, formal penalties for missing a target were rare. Accountability operated mainly through reporting, political scrutiny and periodic strategy updates. Interviewees suggested this reflects the difficulty of attributing outcomes directly to policy action, as well as the need to maintain departmental ownership and flexibility when climate risks, data and implementation capacity are still evolving. Where regular review cycles exist, they allow targets to be adjusted rather than fixed permanently.
Institutional culture and capacity
Interviewees often explained differences in how adaptation targets are designed and used across jurisdictions and sectors by referring to how their governance systems are organised and what kinds of commitments are considered credible within them. In sectors with strong engineering traditions, such as water management, numeric targets were described as more straightforward to define and monitor. These sectors often already work with technical standards and routine monitoring, making quantified thresholds more familiar and defensible. In Austria, where a decision has been made not to develop quantified targets, interviewees emphasised a culture of coordination and consensus, which supports dialogue and qualitative assessment rather than rigid national thresholds. In Germany, a formal legal framework and established inter-ministerial structures shaped the cluster-based organisation and regular review cycle. In Canada, the federal system means responsibility for adaptation is shared across federal departments, provinces and territories. National targets therefore need to reflect what different actors are willing and able to implement, which can limit how prescriptive or ambitious they are at national level. In Lisbon, detailed planning documents are common, but fragmented responsibilities across municipalities make consistent tracking more difficult.
Interviewees also pointed to differences in capacity. Data availability, technical expertise and staff resources influence what can realistically be measured and reported. Where monitoring systems are already established, targets can be more precise; where data systems are still developing, targets tend to begin as milestones or directional commitments. These factors help explain why jurisdictions facing similar climate risks have adopted different approaches to setting and monitoring targets.
Iteration and learning
Across the interviews, setting adaptation targets was described as an iterative process shaped by practical constraints. Governments faced trade-offs between precision and credibility, ambition and deliverability and outcome measurement and system-level change. Rather than resolving these tensions upfront, jurisdictions adjusted their targets over time, refining indicators, strengthening monitoring systems and aligning ambition with available resources. In many cases, revisions were triggered by scheduled strategy review cycles, new climate risk assessments, monitoring results, or major climate events that revealed gaps in existing approaches. Target-setting was therefore described not as a one-off design exercise, but as part of a broader process of institutional learning.
Balancing targets across the results chain
Interview evidence suggests that adaptation target systems are most effective when targets at different levels of the results chain, inputs, outputs, outcomes and impacts, are designed to work together. Jurisdictions that rely predominantly on input or output targets can demonstrate activity but often struggle to show whether resilience conditions are improving. Conversely, jurisdictions that focus solely on high-level outcome ambitions may find it difficult to evidence delivery progress, maintain operational accountability or secure sustained political support.
Interviewees emphasised that greater clarity and coherence tend to emerge where institutional integration, delivery actions and resilience outcomes are aligned within a single framework. This alignment helps ensure that shorter-term milestones support, rather than compete with, longer-term resilience objectives. While impact-level targets remain the most challenging to operationalise, given attribution difficulties, shifting climate baselines and long time horizons, interviewees noted that linking deliverables to broader resilience ambitions can strengthen strategic coherence. Across jurisdictions, interviewees described effective target systems as those that provide complementary performance signals: inputs and outputs that track delivery and institutional capacity, and outcomes that articulate changes in vulnerability, exposure or preparedness. The interviews therefore suggest that the effectiveness of adaptation target-setting depends less on uniform quantification across all levels and more on whether different target types are combined to form a coherent and mutually reinforcing results chain.
Summary and implications for Section 5
Across all evidence sources, a consistent picture emerges. Adaptation target-setting is not a purely technical exercise; it is shaped by institutional capacity, political incentives, governance structures and social context. High-quality targets are clear, measurable and embedded in credible delivery pathways, yet few jurisdictions achieve this fully. Many rely on process or output indicators because data, modelling capability or attribution methods remain limited. Governance arrangements that combine central coordination with distributed ownership appear most common and support alignment, but accountability usually remains political rather than legal. Stakeholder engagement improves relevance and legitimacy but rarely shifts technical parameter-setting unless deliberation is structured and power imbalances are explicitly managed.
The interview evidence reinforces the literature by showing how target-setting unfolds in practice: through negotiation with delivery actors, iterative refinement, and pragmatic interpretation of what counts as “measurable.” Targets are seen to be most effective when supported by established monitoring systems, clear ownership, and alignment with operational delivery structures. Practitioners emphasised that building such systems takes time and that targets often mature across successive strategy cycles.
These insights provide the foundation for Section 5, which examines how the lessons from international experience can inform the development of adaptation targets tailored to Scotland’s governance system, evidence base and delivery landscape. The findings presented here set out the enabling conditions and design choices that underpin credible, feasible and context-appropriate adaptation targets.
Applying lessons of adaptation target setting and monitoring to Scotland
Introduction
This section applies the international lessons from Section 4 to the Scottish context. It draws on insights from a two-round expert elicitation process (using a modified Delphi approach), which explored the credibility, feasibility and practical implications of different approaches to adaptation target-setting in Scotland. The process was designed to identify where expert perspectives converge, where they diverge, and how issues such as equity, uncertainty, governance and revision cycles should shape the development of future targets.
The analysis synthesises views expressed across both rounds and is organised around five core dimensions of adaptation target-setting: target design, governance, stakeholder engagement, system capacity and policy integration. These dimensions reflect the themes used in Section 4 while focusing specifically on their implications for Scotland.
Section 5.2 examines how adaptation targets should be designed, including their purpose, structure and measurement approaches. Section 5.3 considers governance arrangements required to ensure accountability and stability over time. Section 5.4 explores the roles of citizens, experts and government in shaping and legitimising targets. Section 5.5 examines the institutional capacity, resources and evidence systems required to support implementation. Finally, Section 5.6 considers how targets should be embedded within wider policy systems, including the role of scientific evidence, ambition and equity in guiding long-term adaptation pathways.
Designing adaptation targets for Scotland
Please note: quotes from Delphi survey participants are included in italics throughout Sections 5.2–5.6.
Targets should primarily function as tools to drive action and enable delivery
Across both survey rounds, participants consistently emphasised that adaptation targets should function first and foremost as mechanisms that trigger and support practical adaptation action. As one participant put it, “Targets should drive action on the ground and enable the conditions to make things happen – process, people, funding.” Targets were viewed as tools to clarify priorities, direct resources and strengthen enabling conditions for delivery, such as skills, funding processes and long-term planning. Accountability was seen as an essential mechanism for encouraging timely action and enabling early corrective intervention when progress falls short. One participant noted that “being held to account is the overall motivator that will likely drive a lot of the other aspects.”
Participants also stressed that high-quality targets must be designed with a clear understanding of their intended users. Targets aimed at ministers, public bodies or regulators require clarity and operational relevance that directly supports decision-making, resource allocation and compliance. As one participant explained, the “key purpose of [a] target should be to motivate action: by signalling to ministers and policy makers what needs to happen by when.” These responses reinforce the view that adaptation targets should primarily guide behaviour and decision-making within government, rather than serving only to signal policy ambition or communicate priorities.
A layered, time-bound structure is preferred, in which long-term outcomes guide ambition and near-term delivery targets drive implementation.
There was strong support for an adaptation target framework operating across multiple time horizons. Long-term outcome or impact targets were seen as essential for articulating Scotland’s resilience objectives and providing coherence across sectors and policy cycles. Near-term delivery or output targets were viewed as equally important for maintaining urgency, supporting accountability and making implementation progress visible. As one participant observed, “[it is] really important to have a mix of short, medium and long term focus for targets.”
Views on medium-term stepping-stone or outcome targets were more tentative. While participants recognised their potential value for mapping adaptation pathways, they also highlighted challenges in defining and evidencing them at present. Participants therefore favoured a phased structure, beginning with long-term outcomes and near-term delivery targets before expanding into more detailed pathway milestones over time. Several participants cautioned against over-specifying interim milestones prematurely, with one noting the importance of “don’t pretend to know what you don’t know.”
A system-level Theory of Change is viewed as the most effective organising framework
Across both rounds, participants expressed strong support for using a system-level Theory of Change (ToC) to structure adaptation targets. A well-developed ToC was seen as an effective way to explain how near-term actions contribute to long-term outcomes, articulate causal pathways and make underlying assumptions explicit. As one participant explained, “A theory of change is a familiar tool… It would make clear the contribution of each output target to outcomes and impacts.”
Participants emphasised that the ToC should be treated as a living tool that can evolve as evidence develops. They cautioned against overly linear models that risk creating false certainty within complex climate systems and highlighted the importance of focusing on contribution rather than strict attribution when assessing progress. Participants also noted that the assumptions underpinning the ToC are as important as the targets themselves and should be explicitly documented and revisited as learning accumulates. However, a minority cautioned that ToCs risk becoming symbolic or procedural exercises if they are not actively integrated into monitoring and evaluation processes.
“Clear and measurable” targets require a mixed-method approach rather than reliance on numbers alone
Participants demonstrated a nuanced understanding of what constitutes a clear and measurable adaptation target. While quantitative thresholds and indicators were valued where robust and meaningful, participants strongly rejected the idea that clarity depends solely on numerical precision. As one respondent noted, “Quantitative is always preferred… but qualitative measures can be used where appropriate and can be equally as informative if done robustly.” This reflects the complexity and uncertainty inherent in adaptation and a desire to avoid false precision. Participants argued that clarity should derive from agreed criteria for assessing progress, consistent use of evidence and clear documentation of uncertainty, rather than from numerical targets alone.
Several participants also highlighted that numeric indicators can fluctuate in response to external shocks, such as extreme weather events, emphasising the importance of clear interpretive guidance when assessing progress. Qualitative tools such as narrative assessments were viewed as potentially valuable complements to quantitative indicators, provided they are structured using agreed rubrics and shared evidence standards.
Alignment with SNAP3 is essential, but targets should not be constrained by current indicators
Participants agreed that adaptation targets should be aligned with the SNAP3 monitoring, evaluation and learning framework in order to ensure coherence and continuity across policy cycles. However, they were equally clear that target development should not be constrained by the existing indicator set. As one participant commented, “regarding SNAP indicators, my view is we shouldn’t restrict target development using current indicators.”
Participants therefore supported using SNAP3 as an organising frame while allowing flexibility to develop new indicators, fill measurement gaps and update monitoring approaches as the evidence base evolves. In this view, targets should be driven primarily by desired outcomes and actions rather than by what is currently easiest to measure.
Simplicity, manageability and phased development are critical for a credible target system
Finally, participants emphasised the importance of designing a target system that is simple, usable and manageable in practice. Overly complex frameworks risk obscuring priorities and making it harder for delivery bodies to engage meaningfully with the system.
Participants therefore recommended starting with a minimum viable set of targets focused on the most significant outcomes and actions and expanding the framework over time as evidence and monitoring approaches develop. As one participant cautioned, attempts to construct highly detailed target hierarchies too early risk producing “a complicated system of targets that is full of holes and compromises and doesn’t really work.” Keeping the system focused and proportionate was therefore seen as an important safeguard against excessive complexity and a way of ensuring that targets support, rather than distract from, practical adaptation delivery.
Governance and accountability
Review cycles should be stable, statutory and tightly governed, with only narrowly defined exceptions
Participants strongly favoured a tightly bounded governance model in which fixed statutory review cycles provide the core accountability framework for adaptation targets. These cycles were valued for providing stability and predictability, helping ensure that adaptation commitments remain visible and are not displaced by competing policy priorities. Several participants highlighted the practical importance of fixed review schedules, noting that “continuous / ad hoc updating of targets will undermine confidence so better to operate on a transparent fixed review period.”
Similarly, respondents emphasised that stable review cycles allow sufficient time and resources for meaningful evaluation and delivery. As one participant observed, “fixed timescales are easier to plan for.” Another noted that “rolling and evidence-triggered updates sounds fraught… and vulnerable to being ignored / kicked into the long grass.”
While most participants accepted that reviews outside the statutory cycle could be justified in exceptional circumstances, they emphasised that such triggers should be narrowly defined and externally driven. For example, one respondent noted that “external conditions should also include climate disasters.” However, participants were generally resistant to revisiting targets routinely or in response to short-term performance issues. One participant argued that “[there is] not much point having targets if we are to simply adjust them to fit current (under) performance.”
Across both Delphi rounds, respondents drew a clear distinction between adapting delivery in response to learning and revising the targets themselves. Participants emphasised that learning processes should strengthen implementation rather than weaken ambition. As one participant noted, “revising targets downward is not something I like at all… it allows the underperformance to continue.”
Round 2 responses also highlighted the need for safeguards to maintain credibility when out-of-cycle reviews occur. Transparency and independent scrutiny were widely viewed as essential. One participant emphasised the value of “independent QA and publishing reviews… to ensure full transparency of the reasoning behind any changes.” Another highlighted that independence is important “to mitigate against the risk of political influence on targets.” Participants also stressed that criteria for exceptional review should be clearly defined. As one respondent noted, “the definition of exceptional circumstances should be extremely strict – financial restraints… should not be considered exceptional circumstances.”
Learning and monitoring should be continuous, while formal target revision remains infrequent
Across both rounds, participants emphasised that monitoring and learning should occur continuously even when formal revision of targets takes place only at fixed statutory intervals. Respondents highlighted the importance of routine assessment processes to track progress, identify emerging risks and support implementation. One participant commented that “there is a role… for continued (annual) assessments… we can’t wait 5 years.”
Such processes were seen as important for improving delivery and strengthening accountability between formal review cycles. However, participants emphasised that learning-driven adjustments should primarily influence implementation decisions rather than the targets themselves. This reflects a widely shared view that flexibility in delivery is appropriate, whereas flexibility in target ambition risks weakening the accountability function of the system.
Governance should combine central coordination with distributed delivery responsibility
The Delphi findings indicate strong support for governance arrangements that combine central coordination with distributed responsibility for delivery. Adaptation was widely understood as a cross-cutting policy challenge involving multiple sectors and institutions, making purely centralised or purely decentralised governance models difficult to sustain. As one participant explained, “required action is so varied and spread across multiple agents. Responsibility has to fall to those actively involved in delivery… though coordination within a central team [is] also necessary.” Similarly, another respondent described the preferred model as “somewhere in between central authority with distributed delivery autonomy.”
Across responses, participants emphasised that central coordination is important for maintaining coherence, transparency and momentum across the adaptation system, while sector-specific actors remain best placed to understand risks, operational constraints and delivery pathways within their respective domains. Participants therefore emphasised that central authority should focus primarily on coordination, oversight and accountability rather than direct operational control. As one respondent noted, “coordination is important to ensure consistency, transparency and timeliness. However individual areas will be best placed to understand what appropriate targets would look like and how to manage progress.”
Stakeholder engagement
Citizens and communities should shape early problem-framing and value-based decisions
Participants emphasised that citizens and communities have an important role in the early, value-based stages of adaptation target setting. Engagement was seen as particularly valuable when defining the problem, articulating what resilience should mean for Scotland and identifying whose risks and needs should be prioritised. Participants viewed lived experience as important for informing societal trade-offs and considerations of fairness in decisions about who benefits from adaptation and who bears the costs. Several respondents emphasised that citizen engagement is most meaningful during early scoping stages. As one participant noted, “I think citizens should be engaged at the start to scope the targets needed.”
Participants were more cautious about citizen influence in technically complex stages of the process, such as defining acceptable levels of climate risk or determining detailed implementation pathways. Some respondents emphasised the technical nature of these decisions, with one commenting on the risk of “the tyranny of participation… this strikes me as extremely technical work.” Citizen and community engagement was therefore widely viewed as most valuable where societal values and lived experience are central to decision-making, rather than across every stage of target design.
Experts and technical specialists should have sustained influence across all stages
Across both Delphi rounds, participants consistently supported a strong role for experts and technical specialists throughout the adaptation target-setting process. Expert involvement was seen as particularly important when interpreting complex evidence, assessing climate risks, understanding system interdependencies and identifying feasible pathways for adaptation. As one participant observed, “Co-creation with experts will make better, evidence based targets. Co-creation with the public will make them participatory and more socially acceptable.” At the same time, respondents emphasised that expert influence should complement rather than replace societal perspectives. As one participant explained, “experts and communities can and should have a role, but these are also political decisions and choices that ministers need to own.” Participants also noted that meaningful engagement requires time and facilitation skills. One respondent commented that while community perspectives are important, “few are well enough informed to do so meaningfully at the current time.”
Engagement should be meaningful, proportionate and focused where it adds the most value
Participants emphasised that engagement processes should be purposeful, proportionate and clearly designed. Meaningful participation was valued more highly than broad but superficial engagement. Poorly designed processes were seen as risks to trust and legitimacy, while excessive consultation could lead to stakeholder fatigue.
Several participants highlighted the technical complexity of adaptation decision-making, noting that individuals may struggle to engage meaningfully with highly specialised policy discussions. One respondent noted that “individuals in isolation will have little concept of the big picture or be able to weigh trades offs objectively.” Participants therefore emphasised the importance of focusing engagement where it adds the most value, particularly when decisions involve social trade-offs or distributive impacts.
Government must retain final decision-making authority
Participants were clear that engagement should inform, rather than replace, democratic accountability. Adaptation targets were widely understood as political choices that require ministerial ownership and responsibility.
As one participant stated, “Scottish Government needs to take responsibility for targets, with ongoing engagement with technical experts.” In this view, engagement processes should help inform decisions and improve legitimacy but should not replace the formal accountability of government institutions.
Transparency about roles, purpose and influence is essential for legitimacy and trust
Finally, participants emphasised the importance of transparency about who participates in target-setting processes and how their input influences decisions. Clear communication about the purpose and scope of engagement was seen as essential for maintaining trust and avoiding unrealistic expectations about the role of different actors. Without clarity about roles and influence, engagement processes risk creating confusion or undermining confidence in the legitimacy of the target-setting process. Ensuring transparency about how citizen, expert and government roles interact was therefore viewed as an important element of credible governance for adaptation targets.
System capacity, resources and feasibility
Limited institutional capacity and uneven system readiness constrain delivery
Participants repeatedly highlighted that Scotland’s adaptation system faces significant capacity constraints across central government, agencies and delivery partners. These constraints include shortages of specialist expertise, limited analytical and modelling capability, restricted staff time and competing statutory obligations. As one participant noted, “capacity in many organisations [is too limited] to allow things to be done differently rather than just continuing as normal because that’s all people have time to do.”
Participants also observed that levels of readiness vary significantly across sectors. Some areas of policy and practice already have clearer evidence bases and established delivery pathways, while others remain at earlier stages of development. This uneven readiness creates challenges for implementing consistent target frameworks across the adaptation system.
Resourcing gaps and uncertain funding undermine delivery and monitoring
Adaptation was widely perceived as under-resourced relative to the scale of climate risk. Many also emphasised that credible targets require sustained financial and institutional support for planning, delivery and monitoring activities. Several respondents highlighted the importance of stable funding to support long-term capability building. As one participant observed, “near term funding and high ambition gives confidence to stakeholders.”
However, participants stressed that resource constraints should not be used to justify weakening adaptation ambition. One respondent argued that “[we] can’t just weaken the target because we have underdelivered otherwise no accountability and makes the targets meaningless.” These responses highlight the tension between the scale of adaptation ambition and the current level of resources available to support implementation.
Evidence gaps and weak baselines limit what can be targeted at present
Participants identified substantial evidence gaps across many areas of adaptation monitoring and evaluation. In particular, respondents highlighted challenges associated with defining robust baselines, identifying appropriate indicators and measuring long-term adaptation outcomes. Several respondents cautioned against creating false precision when evidence remains limited. Participants emphasised that attempts to set precise quantitative targets without adequate evidence could produce misleading performance signals or unintended consequences. External shocks, such as extreme weather events, may also affect measured outcomes in ways that do not directly reflect progress in adaptation.
These challenges reinforce the importance of developing stronger data systems and analytical capabilities over time. Brooks et al. (2019) highlight emerging approaches within adaptation monitoring frameworks, including anomaly-based indicators, climate-adjusted baselines and counterfactual methods that estimate losses relative to expected climate conditions[4]. However, their operational application remains limited by data availability and modelling uncertainty. Participants therefore emphasised the need for measurement approaches that combine different types of evidence. As one respondent noted, “ideally we want a mix of unambiguous numeric targets and more qualitative assessments to bring depth and nuance.”
Over-complex target systems risk overwhelming delivery organisations
Participants consistently warned that overly complex target architectures could place excessive administrative burdens on delivery organisations. Risks identified included increased reporting requirements, fragmentation across sectors and diversion of staff time away from practical implementation. Several respondents highlighted the risk that complex frameworks could undermine usability. Participants therefore emphasised the importance of simplicity and clarity in target system design so that institutions responsible for delivery can engage effectively with the framework.
Feasible implementation requires prioritisation and phased development
Participants emphasised that a credible target system must reflect the current level of institutional capacity and evidence availability within Scotland’s adaptation system. Several respondents noted that meaningful implementation would require changes in organisational practices and capabilities.
A phased approach to target development was widely supported. Participants suggested beginning with a limited number of high-priority targets and expanding the framework as analytical capabilities, monitoring systems and evidence bases improve. Breaking longer-term objectives into manageable steps was also viewed as important for sustaining delivery momentum. As one participant observed, “breaking the required action… down into achievable blocks.”
Participants also noted that medium-term milestones may remain difficult to define in the near term. One respondent commented that “medium-term targets are less important than doing short and long term targets well.” Together, these responses suggest that prioritisation, sequencing and iterative development will be essential for implementing a credible adaptation target system under current institutional conditions.
Embedding targets in policy systems
Scientific evidence should actively structure adaptation targets, with hazard- and risk-based approaches strongly preferred
Across the Delphi process, participants emphasised that scientific evidence should play a central role in structuring adaptation targets. Several respondents stressed that “scientific evidence must feature to ensure targets remain up to date as new evidence of risks emerges.” Participants highlighted the importance of linking targets directly to climate risks, including through the use of climate projections, hazard modelling and risk assessments. Hazard-based framing was seen as particularly valuable because it connects climate science with concrete policy outcomes. As one participant explained, hazard-based approaches help demonstrate the need to invest in resilience measures that address climate hazards and their impacts on people and infrastructure.
Participants also emphasised that targets must be sufficiently precise to guide action and accountability. As one respondent noted, “a target should be a target, not a rough idea.” At the same time, respondents recognised that some aspects of adaptation cannot be captured through single numerical indicators. As discussed in earlier sections, qualitative or proxy-based measures may sometimes be necessary, provided they are embedded within a broader risk-based framework and accompanied by clear criteria for assessing progress.
Targets should evolve with new evidence through orderly and transparent processes
Participants widely agreed that adaptation targets must be able to respond to significant developments in scientific knowledge. As one respondent noted, “we need to adapt as new evidence comes to light.” However, participants were equally clear that constant or ad hoc revision of targets could undermine credibility and create uncertainty. One respondent observed that even evidence-triggered revisions can generate instability because “nobody knows when new evidence will arise.”
Participants therefore favoured an approach in which scientific evidence is continuously monitored, while formal revision of targets occurs through established governance processes. Stability was widely seen as an important feature of credible target systems. As one participant commented, “five years isn’t that long… stability is important.” In this approach, scientific evidence plays an ongoing role in informing implementation and interpretation of targets, while formal revisions occur through predictable and transparent review processes.
Ambition should lead, even where evidence and delivery capacity are still developing
Participants consistently emphasised the importance of maintaining ambitious adaptation targets, even where evidence and delivery systems are still evolving. Respondents frequently described ambition as necessary for signalling long-term direction and driving policy momentum. As one participant noted, “there needs to be long term ambition… based around the desire for a resilient society.” At the same time, participants emphasised that ambition should be structured in ways that support credible implementation. Near-term targets should remain achievable in order to build confidence and sustain delivery momentum. As one respondent explained, “targets must be achievable in the short term to build engagement and trust.” Participants also emphasised that uncertainty in the evidence base should not prevent action.
Several respondents argued that adaptation policy should follow precautionary principles when knowledge is incomplete. One participant stated directly that Scotland should “abide by precautionary principle when evidence is lacking.”
Ambition must be differentiated across sectors
Participants emphasised that adaptation risks, evidence bases and delivery systems vary substantially across sectors. As one respondent noted, “assuming all sectors have similar levels of risk, capacity or resource is not realistic.” A uniform approach to ambition was therefore widely viewed as impractical. Participants highlighted the diversity of adaptation challenges across sectors and the need to tailor targets to different contexts. As one participant explained, “it may be hard to have a consistent level of ambition when dealing with different contexts and complexities.” Participants therefore supported maintaining high overall ambition while allowing sector-specific targets to reflect differing risks, knowledge bases and delivery pathways.
Equity should shape adaptation ambition rather than being treated as a separate objective
Participants emphasised that equity and justice considerations should be embedded within adaptation targets rather than addressed through separate or stand-alone objectives. As one respondent explained, “equity/justice are inherent in becoming more climate resilience – so aren’t at odds with being very ambitious.”
In practice, participants suggested that equity considerations should influence how adaptation ambition is applied across sectors and communities. This could involve prioritising protection for groups facing higher vulnerability or exposure to climate risks or evaluating whether adaptation efforts reduce or reinforce existing inequalities.
Participants also emphasised the importance of transparency in how equity considerations are applied. One respondent highlighted the need for “central monitoring that equity is covered.” Embedding equity within adaptation targets was therefore seen as an important way of ensuring that resilience-building efforts contribute to broader social outcomes.
Conclusions and forward directions
The evidence from the literature, international practice and stakeholder engagement points to a clear conclusion. Effective adaptation target-setting depends as much on governance, capacity and delivery systems as on technical design. Across jurisdictions, targets work best when they are clearly defined, aligned with institutional responsibilities, embedded in delivery systems and supported by robust monitoring and review. The challenge for Scotland is not whether to set adaptation targets, but how to design them so they are credible, deliverable and aligned with how government operates.
This study combined evidence from international literature, policy review, stakeholder interviews and a two-round Delphi process to identify how adaptation targets can be designed and implemented in practice. This process identified areas of convergence and divergence in how these findings could be applied to adaptation target-setting in Scotland.
There was strong consensus across the evidence on several core features of effective adaptation targets. Agreement was particularly clear on the purpose of targets (to drive action), the value of a layered structure linking long-term outcomes with near-term delivery actions, the importance of hazard- and risk-based evidence and the role of hybrid governance combining central coordination with sectoral delivery responsibility. Participants also agreed on the use of statutory cycles for regular review, the rejection of continuous or ad-hoc revision, the use of mixed quantitative and qualitative evidence and the importance of proportionality and phased development. There was also agreement that equity should shape target ambition rather than sit in stand-alone targets.
Where views diverged, this was usually due to practical constraints rather than differences in principle. For example, participants broadly recognised the potential value of medium-term stepping-stone targets and more sophisticated risk-based metrics, but many emphasised evidence gaps, data limitations and uneven sectoral readiness that make them difficult to implement immediately. Several therefore favoured prioritising long-term outcomes and near-term delivery targets initially, with medium-term milestones introduced as monitoring systems and evidence bases mature. Similarly, while participants broadly supported public engagement in value-based questions, views varied on how far citizens should be involved in technically complex or ongoing decision-making processes.
These findings indicate that adaptation target-setting is constrained less by conceptual disagreement and more by limitations in data, capacity and institutional readiness. In several areas, views were conditional or context-specific rather than reflecting full agreement. Participants generally shared similar underlying principles but differed in how these should be applied in practice depending on institutional capacity, sectoral context or the stage of framework development. The clearest examples of context-dependent consensus related to:
The degree of central authority. Although a fully distributed model was widely rejected, participants differed in how strong central coordination should be. Many responses emphasised that the appropriate balance between central oversight and sectoral autonomy would depend on the policy area, delivery responsibilities and existing governance arrangements.
The balance between simplicity and completeness. Participants broadly agreed that target systems should remain usable and manageable. However, views differed on how streamlined the initial architecture should be. Some favoured a minimal set of high-priority targets to maintain clarity and reduce administrative burden, while others supported more detailed structures provided they remained practical for delivery institutions.
The design and timing of medium-term stepping-stone targets. While their potential value for mapping adaptation pathways was widely recognised, participants differed in their views on when and how such milestones should be introduced. Many emphasised that their feasibility would depend on improvements in monitoring systems, baselines and analytical capability.
On Design principles for setting adaptation targets
These findings translate into a set of nine practical principles for designing adaptation targets that are credible, deliverable and aligned with Scotland’s institutional context.
Target design:
Design targets to drive action. Targets should clearly specify who must act, by when, and on what basis. A layered structure should link long-term outcomes with near-term delivery actions.
Embed scientific and hazard-based evidence at the core of target design. Climate projections, hazard modelling and risk assessments should inform ambition-setting and prioritisation, with mechanisms to manage evolving evidence and uncertainty.
Balance ambition with feasibility through phased development. Initial frameworks should focus on a limited number of high-value targets and expand as data, analytical capability and monitoring systems mature.
Use mixed measurement approaches where evidence is incomplete. Structured qualitative, proxy or provisional indicators can be used where data are limited, provided they are applied transparently and embedded within a wider science-led framework.
Governance and review:
Integrate equity directly into ambition-setting and evaluation. Adaptation targets should reflect differences in vulnerability and exposure, including higher protection standards or accelerated timelines for communities facing greater risk.
Ensure targets remain interpretable and usable, avoiding unnecessary complexity. Target systems should be simple enough to guide decision-making while robust enough to support meaningful assessment of progress.
Provide clear and predictable review processes. Continuous monitoring of evidence should be combined with formal revisions tied to statutory review cycles and narrowly defined exceptional triggers.
Implementation feasibility
Design within system capacity. Target frameworks should reflect current institutional capability and develop incrementally so that targets remain actionable rather than symbolic.
Align targets with wider policy systems. Adaptation targets should be coherent with strategies across climate, nature, land, water, health and infrastructure, supported by central stewardship and sectoral delivery roles.
Together, these principles define the conditions under which adaptation targets can move beyond aspiration to shape decisions, investment and delivery across Scotland’s adaptation system.
Policy implications for adaptation target-setting in Scotland
The findings suggest that effective target-setting depends not only on technical design choices but also on strengthening institutional capability, governance arrangements and cross-sector coordination. The following actions highlight priority areas where policy development and institutional investment would support the creation of credible, ambitious and implementable adaptation targets.
Establish a phased, layered adaptation target framework.
Begin with a small number of high-value targets linking long-term outcomes with near-term delivery actions, supported by a Theory of Change that clarifies pathways, assumptions and cross-sector linkages. Expand into medium-term milestones as evidence, baselines and monitoring systems mature.
Integrate hazard- and risk-based evidence into target development.
Strengthen the use of climate projections, hazard modelling and national risk assessments to provide a consistent scientific basis for ambition-setting, prioritisation and evaluation.
Anchor revision processes in statutory cycles with tightly governed flexibility.
Maintain five-year statutory review points as the primary mechanism for updating targets, with exceptional revisions permitted only when predefined, transparent and evidence-based triggers are met.
Embed equity within target ambition and delivery.
Ensure that vulnerability and exposure influence the level of ambition, timelines and resource allocation. Central oversight can help maintain consistency while allowing sectoral and local tailoring.
Strengthen analytical, modelling and monitoring capability.
Investment is needed to improve baselines, close evidence gaps, strengthen climate information and support the development of risk-based and mixed-method indicators.
Adopt mixed-method assessment frameworks.
Develop clear success criteria, interpretive guidance and structured qualitative tools so that progress can be assessed fairly, particularly where metrics are influenced by climate variability.
Prioritise simplicity and usability in target system design.
Avoid overly complex architectures or reporting burdens. Focus on the most material risks and outcomes so the framework remains manageable within existing capacity.
Strengthen cross-government coordination and coherence.
Ensure adaptation targets align with related strategies across climate, nature, land, water, health and infrastructure, supported by central stewardship and sectoral delivery responsibilities.
Develop transparent engagement pathways.
Clarify the roles of citizens, experts and delivery partners in shaping and implementing targets, while ensuring government retains accountability for final decisions.
Provide stable, multi-year funding for implementation.
Long-term investment will be required to support capacity building, data systems, analytical functions and the practical delivery of adaptation targets across sectors.
In practice, developing effective adaptation targets in Scotland will require sustained institutional investment, clear governance arrangements and a phased approach that aligns ambition with delivery capacity.
2021. Eindevaluatie van het Nationale Adaptatie Plan [Final evaluation of the National Adaptation Plan] (2017-2020) (google translated). Reports | National Climate Commission
Ministério da Saúde. 2013. Plano Setorial Da Saúde Para Mitigação E Adaptação À Mudança Do Clima/ [Sectoral Health Plan for Mitigation and Adaptation to Climate Change]. Plano Setorial de Sáude.pdf
Canada
Environment and Climate Change Canada. 2023. Canada’s National Adaptation Strategy Building Resilient Communities and a Strong Economy. En4-544-2023-eng.pdf
Chile
Departamento de Cambio Climático del Ministerio del Medio Ambiente. 2014. Plan Nacional de Adaptación al Cambio Climático Elaborado en el marco del Plan de Acción Nacional de Cambio Climático [National Adaptation Plan for Climate Change Developed within the framework of the National Climate Change Action Plan]. (google translated). unfccc.int/sites/default/files/resource/NAP_Chile_2017.pdf
Czechia
Ministerstvo životního prostředí v meziresortní spolupráci s využitím klimatologických podkladů Českého hydrometeorologického ústavu . 2021. Strategie přizpůsobení se změně klimatu v podmínkách ČR. 1. aktualizace pro období 2021 – 2030. [Strategy for Adapting to Climate Change in the Conditions of the Czech Republic. 1st update for the period 2021 – 2030] (google translated). OAZK_Narodni_adaptacni_strategie-aktualizace_20211026.pdf
Finnish Environment Institute, Natural Resources Institute Finland, Finnish Meteorological Institute, University of Helsinki, Tyrsky Consulting, Finnish institute for health and welfare. 2022. Adaptation to climate change in Finland Current state and future prospects. Publications of the Government´s analysis, assessment and research activities. Adaptation to climate change in Finland : Current state and future prospects
Stratégie nationale d’adaptation au changement climatique. [National adaptation strategy 2006]. (google translated). Stratégie_Nationale.vp
2025. 3rd French National Adaptation Plan (PNACC-3). PNACC_EN_VF_2.pdf
Germany
Federal Ministry for the Environment, Nature Conservation, Nuclear Safety and Consumer Protection. 2024 German Strategy for Adaptation to Climate Change Shaping precautionary action together. German Strategy for Adaptation to Climate Change
Climate Change Adaptation Plan. October 22, 2021 Cabinet Approval. 000081210.pdf
KPIs for the sectoral measures set in the Climate Change Adaptation Plan (approved by the Cabinet on October 22, 2021). 000081212.pdf
KPIs for the fundamental measures set in the Climate Change Adaptation Plan (approved by the Cabinet on October 22, 2021). 000081213.pdf
Kenya
Ministry of Environment and Natural Resources. 2016. Kenya National Adaptation Plan 2015-2030 Enhanced climate resilience towards the attainment of Vision 2030 and beyond. NAP_Final-Signed_22022017.pdf
Climate Change Directorade, Ministry of Environment and Forestry. 2023. National Climate Change Action Plan (NCCAP) III. faolex.fao.org/docs/pdf/ken229355.pdf
Norwegian Ministry of Climate and Environment. Meld. St. 26 (2022–2023) Report to the Storting (white paper) A changing climate – united for a climate-resilient society. Meld. St. 26 (2022–2023)
Ministerio para la Transicion Ecologica y el Retro Demgrafico. Programa de Trabajo 2021-2025 Plan Nacional de Adaptación al Cambio Climático. Climate Change Adaptation: Work Programme 2021-2025 (google translated). pt1-pnacc_tcm30-535273.pdf
Strategie des Bundesrates, herausgegeben vom Bundesamt für Umwelt (BAFU). Anpassung an den Klimawandel in der Schweiz: Aktionsplan 2020–2025 [Adaptation to climate change in Switzerland: Action Plan 2020-2025]. (Google translated). Anpassung an den Klimawandel in der Schweiz: Aktionsplan 2020–2025
South Korea
환경정책] 제3차 국가 기후변화 적응대책(’21~’25) [Third National Climate Change Adaptation] (google translated). 공지사항 – 온실가스종합정보센터
책소개_영문_브로슈어. [An Introduction to the third round of Korea’s national climate change adaptation plan] (google translated). 공지사항 – 온실가스종합정보센터
Rwanda
NDC Support Facility. 2020. Revising Nationally Determined Contribution (NDC) mitigation and adaptation priorities for Rwanda Final Report 24 March 2020. Carbon Counts Report
Sub-national jurisdictions
Barcelona
Direcció de Serveis de l’Oficina de Canvi Climàtic i Sostenibilitat, Gerència de Serveis Urbans i Manteniment de l’Espai Públic, Gerència d’Àrea de Mobilitat, Infraestructures i Serveis Urbans, 2024. Pla Clima : mesura de govern (2018–2030). http://hdl.handle.net/11703/138564
CML-DMAEVCE – Direção Municipal de Ambiente, Estrutura Verde, Clima e Energia, CML-DAEAC – Departamento de Ambiente, Energia e Alterações Climáticas, Lisboa E-Nova – Agência de Energia e Ambiente de Lisboa. 2021. PAC Lisboa 2030. Uma cidade compremetida com o future. Lisbon 2030 Climate Action Plan. PAC Lisboa 2030
Anantharajah, K. (2019) ‘Governing climate finance in Fiji: Barriers, complexity and interconnectedness’, Sustainability, 11(12), 3414.
Arfanuzzaman, M. (2024) ‘Bangladesh’s pathways to climate-resilient development: A methodical review’, World Development Sustainability, 4, 100144.
Arkema, K.K., Delevaux, J.M.S., Silver, J.M., Winder, S.G., Schile-Beers, L.M., Bood, N., Crooks, S. et al. (2023) ‘Evidence-based target setting informs blue carbon strategies for nationally determined contributions’, Nature Ecology and Evolution, 7(7), pp. 1045–1059.
Berrang-Ford, L., Biesbroek, R., Ford, J.D., Lesnikowski, A., Tanabe, A., Wang, F.M., Chen, C., Hsu, A., Hellmann, J.J., Pringle, P., Grecequet, M., Amado, J.C., Huq, S., Lwasa, S. and Heymann, S.J. (2019) ‘Tracking global climate change adaptation among governments’, Nature Climate Change, 9(6), pp. 440–449.
Berrang-Ford, L., Ford, J.D., Lesnikowski, A., Poutiainen, C., Barrera, M. and Heymann, S.J. (2014) ‘How are we adapting to climate change? A global assessment’, Mitigation and Adaptation Strategies for Global Change, 19(3), pp. 383–396.
Biagini, B., Bierbaum, R., Stults, M., Dobardzic, S. and McNeeley, S.M. (2014) ‘A typology of adaptation actions: A global look at climate adaptation actions financed through the Global Environment Facility’, Global Environmental Change, 25, pp. 31–40.
Biesbroek, R. and Delaney, A. (2020) ‘Mapping the evidence of climate change adaptation policy instruments in Europe’, Environmental Research Letters, 15(8), 083005.
Biesbroek, R., Berrang-Ford, L., Ford, J.D., Tanabe, A., Austin, S.E. and Lesnikowski, A. (2018) ‘Data, concepts and methods for large-n comparative climate change adaptation policy research: A systematic literature review’, Wiley Interdisciplinary Reviews: Climate Change, 9(6), e548.
Biesbroek, R., Broek, E., Engbersen, D., van Deursen, M., Agarwal, R., Thomas, A., Mukherji, A. and Njuguna, L. (2025) ‘Navigating the politics of transformational adaptation in international climate negotiations’, npj Climate Action, 4(1), article 3.
Bino, G., Brandis, K., Kingsford, R.T. and Porter, J. (2021) ‘Shifting goalposts: Setting restoration targets for waterbirds in the Murray-Darling Basin under climate change’, Frontiers in Environmental Science, 9, 785903.
Böhringer, C. (2003) ‘The Kyoto Protocol: A review and perspectives’, Oxford Review of Economic Policy, 19(3), pp. 451–466.
Bows-Larkin, A., Anderson, K., Bows, A. and Mander, S. (2008) ‘From long-term targets to cumulative emission pathways: Reframing UK climate policy’, Energy Policy, 36(10), pp. 3714–3722.
Brullo, T., Barnett, J., Waters, E. and Boulter, S. (2024) ‘The enablers of adaptation: A systematic review’, npj Climate Action, 3, article 40.
Buntaine, M.T., Parks, B.C. and Buch, B.P. (2017) ‘Aiming at the wrong targets: The domestic consequences of international efforts to build institutions’, International Studies Quarterly, 61(2), pp. 471–488.
Canosa, I.V., Ford, J.D., McDowell, G., Jones, J. and Pearce, T. (2020) ‘Progress in climate change adaptation in the Arctic’, Environmental Research Letters, 15(9), 093009.
Chandrakumar, C., Malik, A., McLaren, S.J., Owsianiak, M., Ramilan, T., Jayamaha, N.P. and Lenzen, M. (2020) ‘Setting better-informed climate targets for New Zealand: The influence of value and modelling choices’, Environmental Science and Technology, 54(7), pp. 4515–4527.
Chandrakumar, C., McLaren, S.J., Dowdell, D. and Jaques, R. (2019) ‘A top-down approach for setting climate targets for buildings: The case of a New Zealand detached house’, IOP Conference Series: Earth and Environmental Science, 323(1), 012183.
Chen, Y.-L. and Huang, M.-C. (2023) ‘Water usage reduction and CSR committees: Taiwan evidence’, Corporate Social Responsibility and Environmental Management, 30(3), pp. 1070–1081.
Christoff, P. and Eckersley, R. (2021) ‘Convergent evolution: Framework climate legislation in Australia’, Climate Policy, 21(9), pp. 1190–1204.
Dhyani, S., Murthy, I.K., Kadaverugu, R., Dasgupta, R., Kumar, M. and Gadpayle, K.A. (2021) ‘Agroforestry to achieve global climate adaptation and mitigation targets: Are South Asian countries sufficiently prepared?’, Forests, 12(3), 303.
Dilling, L., Prakash, A., Zommers, Z., Ahmad, F., Singh, N., de Wit, S., Nalau, J., Daly, M. and Bowman, K. (2019) ‘Is adaptation success a flawed concept?’, Nature Climate Change, 9(8), pp. 572–574.
Dzebo, A. (2019) ‘Effective governance of transnational adaptation initiatives’, International Environmental Agreements: Politics, Law and Economics, 19(4), pp. 447–466.
England, M.I., Dougill, A.J., Stringer, L.C., Vincent, K.E., Pardoe, J., Kalaba, F.K., Mkwambisi, D.D., Namaganda, E. and Afionis, S. (2018) ‘Climate change adaptation and cross-sectoral policy coherence in southern Africa’, Regional Environmental Change, 18(8), pp. 2349–2361.
Eriksen, S.H., Nightingale, A.J. and Eakin, H. (2015) ‘Reframing adaptation: The political nature of climate change adaptation’, Global Environmental Change, 35, pp. 523–533.
Essex, B., Koop, S.H.A. and van Leeuwen, C.J. (2020) ‘Proposal for a national blueprint framework to monitor progress on water-related Sustainable Development Goals in Europe’, Environmental Management, 65(1), pp. 1–18.
European Environment Agency (2015) National monitoring, reporting and evaluation of climate change adaptation in Europe. EEA Technical Report No. 20/2015. Available at: https://doi.org/10.2800/629559 (Accessed: 16 April 2026).
Feichter, C., Grabner, I. and Moers, F. (2018) ‘Target setting in multi-divisional firms: State of the art and avenues for future research’, Journal of Management Accounting Research, 30(3), pp. 29–54.
Ford, J.D., Berrang-Ford, L., Lesnikowski, A., Barrera, M. and Heymann, S.J. (2013) ‘How to track adaptation to climate change: A typology of approaches for national-level application’, Ecology and Society, 18(3), 40.
Ford, J.D., Tilleard, S.E., Berrang-Ford, L. and Araos, M. (2016) ‘Big data has big potential for applications to climate change adaptation’, npj Climate and Atmospheric Science, 1, article 3.
Garvey, A., Büchs, M., Norman, J.B. and Barrett, J. (2023) ‘Climate ambition and respective capabilities: Are England’s local emissions targets spatially just?’, Climate Policy, 23(8), pp. 989–1003.
Geden, O. (2016) ‘The Paris Agreement and the inherent inconsistency of climate policymaking’, Wiley Interdisciplinary Reviews: Climate Change, 7(6), pp. 790–797.
Goyette, J.-O., Savary, S., Blanchette, M., Rousseau, A.N., Pellerin, S. and Poulin, M. (2023) ‘Setting targets for wetland restoration to mitigate climate change effects on watershed hydrology’, Environmental Management, 71, pp. 365–378.
Hallegatte, S. (2009) ‘Strategies to adapt to an uncertain climate change’, Global Environmental Change, 19(2), pp. 240–247.
Jordan, A., Huitema, D., van Asselt, H. and Forster, J. (2010) ‘Allocation and architecture in climate governance beyond Kyoto: Lessons from interdisciplinary research on target setting’, Global Environmental Change, 20(3), pp. 361–369.
Judd, M., Bond, N. and Horne, A.C. (2022) ‘The challenge of setting “climate ready” ecological targets for environmental flow planning’, Frontiers in Environmental Science, 10, article 714877.
Kythreotis, A.P., Jonas, A.E.G., Mercer, T.G. and Marsden, T.K. (2020) ‘Rethinking urban adaptation as a scalar geopolitics of climate governance: Climate policy in the devolved territories of the UK’, Territory, Politics, Governance, 11(1), pp. 39–59.
Lesnikowski, A., Ford, J.D., Berrang-Ford, L., Barrera, M. and Heymann, S.J. (2015a) ‘Adaptation tracking for a post-2015 climate agreement’, Nature Climate Change, 5(12), pp. 967–969.
Lesnikowski, A., Ford, J.D., Berrang-Ford, L., Barrera, M. and Heymann, S.J. (2015b) ‘National-level factors affecting planned, public adaptation to health impacts of climate change’, Global Environmental Change, 35, pp. 85–97.
Ligozat, A.-L., Brun, C., Demirdjian, B., Gouget, G., Jardé, E., Mialon, A., Mouronval, A.-S., Pagani, L. and Vieu, L. (2024) ‘Setting climate targets: The case of higher education and research’, bioRxiv, preprint.
Luh, J., Ojomo, E., Evans, B. and Bartram, J. (2017) ‘National drinking water targets: Trends and factors associated with target-setting’, Water Policy, 19(5), pp. 851–866.
Lyytimäki, J., Lonkila, K.-M., Furman, E., Korhonen-Kurki, K. and Lähteenoja, S. (2021) ‘Untangling the interactions of sustainability targets: Synergies and trade-offs in the Northern European context’, Environment, Development and Sustainability, 23(3), pp. 3458–3473.
Magnan, A.K. (2016) ‘Metrics needed to track adaptation’, Nature, 530(7589), p. 160.
Maldet, M., Lettner, G., Loschan, C., Schwabeneder, D. and Auer, H. (2023) ‘Creating an indicator system for the United Nations Sustainable Development Goals in communities and municipalities: Application and analysis in an Austrian case study’, Heliyon, 9(8), e19010.
Marinazzo, D. (2025) ‘With behaviors like these in complex systems, who needs mechanisms?’, Physics Magazine, 18(71).
Matthews, J.H., Forslund, A., McClain, M.E. and Tharme, R.E. (2014) ‘More than the fish: Environmental flows for good policy and governance, poverty alleviation and climate adaptation’, Aquatic Procedia, 2, pp. 16–23.
Mazzocchi, F. (2025) ‘An investigation into the notion of complex systems’, Foundations of Science, advance online publication.
Mees, H.L.P. and Driessen, P.P.J. (2019) ‘The roles of residents in climate adaptation: A systematic review in the case of the Netherlands’, Environmental Policy and Governance, 29(4), pp. 198–212.
Mongelli, F.P., Ceglar, A. and Scheid, B.A. (2024) Why do we need to strengthen climate adaptations? Scenarios and financial lines of defence. ECB Working Paper No. 3005. European Central Bank. Available at: https://ideas.repec.org/p/ecb/ecbwps/20243005.html (Accessed: 16 April 2026).
Moser, S.C. and Ekstrom, J.A. (2010) ‘A framework to diagnose barriers to climate change adaptation’, Proceedings of the National Academy of Sciences, 107(51), pp. 22026–22031.
Oberthür, S. and Kelly, C.R. (2008) ‘The European Union in international climate policy: The prospect for leadership’, International Affairs, 84(1), pp. 1–21.
Oberthür, S. and Pallemaerts, M. (eds) (2010) The climate policy of the European Union: Origins, evolution and prospects. Brussels: Institute for European Studies.
OECD (2023a) Funding civil society in partner countries: Toolkit for implementing the DAC recommendation on enabling civil society in development co-operation and humanitarian assistance. Paris: OECD Publishing.
OECD (2023b) A territorial approach to climate action and resilience. OECD Regional Development Studies. Paris: OECD Publishing.
OECD (2023c) Scaling up adaptation finance in developing countries: Challenges and opportunities for international providers. Green Finance and Investment. Paris: OECD Publishing.
OECD (2023d) Glossary of key terms in evaluation and results-based management for sustainable development. 2nd edn. Paris: OECD Publishing.
Oliver, T.H., Benini, L., Borja, A., Dupont, C., Doherty, B., Grodzińska-Jurczak, M., Iglesias, A., Jordan, A., Kass, G., Lung, T., Maguire, C., McGonigle, D., Mickwitz, P., Spangenberg, J.H. and Tarrason, L. (2021) ‘Knowledge architecture for the wise governance of sustainability transitions’, Environmental Science and Policy, 126, pp. 152–163.
Puig, D., Adger, N.W., Barnett, J., Vanhala, L. and Boyd, E. (2025) ‘Improving the effectiveness of climate change adaptation measures’, Climatic Change, 178(7).
Puig, M., Cirera, A., Wooldridge, C., Sakellariadou, F. and Darbra, R.M. (2024) ‘Mega ports’ mitigation response and adaptation to climate change’, Journal of Marine Science and Engineering, 12(7), 1112.
Raiser, K., Kornek, U., Flachsland, C. and Lamb, W.F. (2020) ‘Is the Paris Agreement effective? A systematic map of the evidence’, Environmental Research Letters, 15(8), 083006.
Reckien, D., Salvia, M., Heidrich, O., Church, J.M., Pietrapertosa, F., De Gregorio-Hurtado, S. et al. (2018) ‘How are cities planning to respond to climate change? Assessment of local climate plans from 885 cities in the EU-28’, Journal of Cleaner Production, 191, pp. 207–219.
Robinson, S.A. (2020) ‘Climate change adaptation in SIDS: A systematic review of the literature pre and post the IPCC Fifth Assessment Report’, Wiley Interdisciplinary Reviews: Climate Change, 11(5), e653.
Roggero, M. and Thiel, A. (2021) ‘A policy mixes approach to conceptualizing and measuring climate change adaptation policy’, Environmental Policy and Governance, 31(1), pp. 3–15.
Sietsma, A.J., Ford, J.D., Callaghan, M.W. and Minx, J.C. (2021) ‘Progress in climate change adaptation research’, Environmental Research Letters, 16(5), 054038.
Simonson, W.D., Miller, E., Jones, A., García-Rangel, S., Thornton, H. and McOwen, C. (2021) ‘Enhancing climate change resilience of ecological restoration: A framework for action’, Perspectives in Ecology and Conservation, 19(3), pp. 300–310.
Sulistiawati, L.Y. (2020) ‘Indonesia’s climate change nationally determined contributions: A far-fetched dream or possible reality?’, IOP Conference Series: Earth and Environmental Science, 423, 012022.
Tompkins, E.L., Vincent, K., Nicholls, R.J. and Suckall, N. (2018) ‘Documenting the state of adaptation for the global stocktake of the Paris Agreement’, Wiley Interdisciplinary Reviews: Climate Change, 9(5), e545.
Tsvetkov, P. and Andreichyk, A. (2025) ‘The analysis of goals, results, and trends in global climate policy through the lens of regulatory documents and macroeconomics’, Sustainability, 17(10), 4532.
United Nations Environment Programme (2022) Adaptation gap report 2022: Too little, too slow – climate adaptation failure puts the world at risk. Nairobi: United Nations Environment Programme. Available at: https://www.unep.org/resources/adaptation-gap-report-2022 (Accessed: 16 April 2026).
van de Steeg, J., Kinyangi, J., Notenbaert, A., Thornton, P.K. and Herrero, M. (2009) ‘Using climate information for priority setting and to target risk management and adaptation strategies in Africa’, IOP Conference Series: Earth and Environmental Science, 6, 392031.
van Herten, L.M. and van de Water, H.P.A. (2000) ‘Health policies on target? Review on health target setting in 18 European countries’, European Journal of Public Health, 10(suppl. 4), pp. 11–16.
Watkiss, P. and Hunt, A. (2019) ‘Economic appraisal of adaptation options for the agriculture sector’, in Economic tools and methods for the analysis of global change impacts on agriculture and food security. Cham: Springer, pp. 131–148.
Watts, M. (2022) ‘Deadline 2020: Mayoral leadership on science-based targets – Setting the standard for climate action’, Journal of City Climate Policy and Economy, 1(1), article 0002.
Wise, R.M., Fazey, I., Stafford Smith, M., Park, S.E., Eakin, H.C., Archer van Garderen, E.R.M. and Campbell, B. (2014) ‘Reconceptualising adaptation to climate change as part of pathways of change and response’, Global Environmental Change, 28, pp. 325–336.
Yule, E.L., Kythreotis, A.P., Harcourt, R., Howarth, C., Porter, J., Falloon, P. et al. (2025) ‘The opportunities and challenges of developing and implementing local climate adaptation targets’, PLOS Climate, 4(5), e0000634.
Zhang, P., Liu, D.C. and Lyu, S. (2023) ‘Leadership mobility and target adaptation: Does previous target achievement matter?’, Public Performance and Management Review, 47(1), pp. 204–231.
Ziervogel, G. and Taylor, A. (2008) ‘Feeling stressed: Integrating climate adaptation with other priorities in South Africa’, Environment, 50(2), pp. 32–41.
Zyzak, B. and Farsund, A.A. (2025) ‘Coordination of complex systems: The case of public policy meta-organisations’, European Management Journal, advance online publication.
Appendices
Review Methodology
Sampling methodology for selecting national-level jurisdictions
Estimates suggest that, as of 2024, 171 countries (87%) have at least one national adaptation planning instrument in place (Adaptation Gap Report 2024). However, no single repository provides comprehensive information on which include monitoring, evaluation and learning (MEL) systems, or have established adaptation targets.
To identify the countries that are most likely to have developed adaptation targets, we began from two assumptions:
Planning instruments without a MEL framework are unlikely to have adaptation targets, so we first identified countries with established MEL systems.
The more advanced the MEL system, the more likely it is to include adaptation targets.
Using these assumptions, we developed a four-step process to identify the national jurisdictions with well-developed MEL systems.
Step I: Identify national jurisdictions that submitted a NAP to the UNFCC and developed a MEL framework
Using the NAP Global Network Trends database, we identified:
62 countries that have submitted a National Adaptation Plan (NAP) to the UNFCCC.
Among these, countries that have:
Developed a supporting MEL framework (45 countries)
Established MEL indicators (41 countries)
Committed to progress reporting, indicating advancement of their MEL system (52 countries)
Step II: Identify additional jurisdictions with MEL systems not submitted to UNFCCC
Because many high-income countries do not submit adaptation plans to the UNFCCC, additional sources were required.
Using Leiter et al. (2021)[5], we identified additional countries that have developed a MEL system for their adaptation instrument, even if these instruments were not submitted to the UNFCCC.
We also used the categorisation described in the same source to determine the stage of development of each country’s MEL system i.e.
Starting Intention
Early Stage
Development Stalled
Advanced Stage
NAP M&E System Approved
Progress Report Published
Evaluation Published
Step III: Identify countries that have published NAP progress reports
A published NAP progress report indicates that a country is more likely to have a well-developed and actively used MEL system, recognizing that reporting is only one component of MEL and may not fully reflect the existence of formal MEL frameworks, indicators, or processes. Using the UNEP Adaptation Gap Report (2024), we identified countries that have publicly available NAP progress reports.
Step IV: Select national jurisdictions with well-developed MEL systems and characteristics similar to Scotland
Using the combined results from Steps I–III, we identified 47 jurisdictions with the strongest evidence of well-developed MEL systems.
We then used a Large Language Model (LLM) to compare these jurisdictions with Scotland, assessing the degree of similarity across relevant characteristics specifically governance structures, socio-economic features and institutional arrangements.
Based on this analysis, we selected 22 jurisdictions for further examination.
The 22 national jurisdictions selected for further analysis were:
Austria, Belgium, Brazil, Canada, Chile, Czech Republic, Finland, France, Germany, Ireland, Japan, Kenya, Netherlands, New Zealand, Norway, Philippines, South Africa, Spain, Switzerland, South Korea, Thailand, Rwanda
These jurisdictions were examined in detail to determine whether their adaptation instruments included specific targets.
Limitations
Some countries may have updated their adaptation plans since Leiter et al. (2021) and could therefore have developed new or revised MEL frameworks and targets since then.
Adaptation plans do not always explicitly include a MEL framework. While reasonable effort was made to identify such frameworks, through primary and secondary sources, some may have been overlooked or unavailable publicly.
Sampling methodology for selecting subnational-level jurisdictions
The review of national adaptation plans revealed that few included explicit targets. Following discussion with the project steering committee, the scope of analysis was expanded to include subnational jurisdictions.
Evidence suggests that, while European cities are increasingly developing MEL systems, quantified targets are still uncommon.
The European Environment Agency (EEA) report Urban adaptation in Europe shows that although cities and regions are developing monitoring and evaluation indicators and tools, only 55% of European local climate action plans include metrics that could measure progress. Of these, 72% focus on action outputs rather than targets or outcomes. Only 2% of indicators were linked to specific targets (Ramboll, 2024 in EEA 2024. Urban adaptation in Europe: what works? Implementing climate action in European cities. EEA Report 14/2023). The report also stresses that more tangible local targets are needed to measure progress and enable effective scaling of adaptation efforts.
A 2022 study by Gancheva, Lundberg and Vroom (Climate adaptation: Measuring performance, defining targets and ensuring sustainability European Union) reviewed the adaption plans of three cities (Athens, Kielce and Stockholm) and two regions (Flanders and North Rhine-Westphalia), finding broad objectives but no clear quantitative targets.
Given this context we took a purposeful sampling approach drawing on:
suggestions from within the research team, CXC and the Scottish Government team.
literature from the review in Phase 1 identifying cities with more advanced MEL systems
expert input including informal insight from one of the authors of the Ramboll, 2024 publication (informally) who identified cities known to have set targets.
Based on this process and together with the steering committee we identified 8 cities and 1 region to research further.
Barcelona, Boston, Copenhagen, Hamburg, Helsinki, Lisbon, Paris, Bydgoszcz, and California.
Framework for analysing the development of national climate adaptation targets
What is level or status of development and operationalisation of national/regional/sectoral adaptation targets?
Governance of target development
What governance structures did countries/ regions/ sectors establish to develop targets?
Was there a dedicated coordination body?
Were existing institutions used as a coordination body, or was a new body(ies) created?
Which ministries led the process?
How were subnational governments involved?
Accountability and transparency? E.g. How are targets monitored and reported? Are mechanisms in place to revise targets if circumstances change?
Purpose/motivation
What was the rationale for the establishment of the target?
Did any formal policy mandates or legal frameworks guide target development?
Are targets reactive (addressing existing risks) or proactive (anticipating future risks)?
Political economy and decision-making dynamics
How have political priorities shaped target selection?
How are conflicts between economic priorities and adaptation needs managed?
Are there examples of lobbying or vested interests shaping targets?
How do targets reflect genuine adaptation needs or political feasibility?
What role have donor requirements played (especially for developing countries) in setting targets?
Stakeholder engagement approach
Which sectors, civil society groups, academia, and private sector actors were involved in helping set national adaption targets?
What was the breadth and depth of participation to develop targets?
What consultation methods were used (workshops, surveys, technical committees)?
How were different stakeholder voices weighted in decision-making for setting / developing targets?
Inclusion – Were marginalised or vulnerable populations consulted? How were trade-offs between stakeholder interests resolved?
Technical and scientific foundation
What climate science / vulnerability / risk assessments informed target development and selection?
How were priority risks considered in the development and selection of targets?
How was risk tolerance or risk appetite considered, were accepted levels of risk considered? For example, ‘What level of disruption are we willing to accept’, such as road closures?
Were targets aligned with latest climate scenarios (which? e.g. 1.5°C, 2°C, 4°C pathways low probability worst case (high consequence) scenarios)?
Were adaptation limits considered (what is technically feasible vs. aspirational)?
Resource and capacity considerations
Were implementation capacity, financial resources and technical/institutional capabilities, considered when developing and setting targets?
Were costing exercises carried out as part of the process of developing and setting targets?
Were financing commitments secured as part of the process of developing and setting targets?
Do resource allocations match the scale and ambition of targets? Were trade-offs between achievable vs. aspirational targets assessed?
Timeline and Sequencing
What was the speed and pacing of the target development process?
How did (international) deadlines affect the process?
How did the process allow for iterative refinement?
Was time allowed for target validation?
Can targets be updated based on monitoring and evaluation?
Influences and learning
What role have international frameworks, donor requirements, or peer country experiences played in shaping the approach and selection of targets?
Integration and coherence with existing planning
How did target-setting connect with existing national development planning, sectoral strategies, regional or global targets, risk reduction planning or budgetary processes? Or was the target-setting process carried out in isolation?
Quality and characteristics of targets
What makes a good target?
What are the characteristics of the targets that have been developed?
Outcome targets: Measurable reductions in climate risk or vulnerability (e.g. “reduce flood risk to X% of population by 2030”)
Process targets: Implementation milestones for adaptation measures (e.g. “establish early warning systems in all vulnerable districts by 2028”)
Capacity targets: Building institutional and technical capabilities (e.g. “train 500 agricultural extension workers in climate-smart practices”)
Investment targets: Financial commitments for adaptation infrastructure and programs
How specific, measurable, time-bound are the targets?
Are targets cross-sectoral?
Topic Guide for Key Informant Interviews
We developed a list of interview questions to guide key informant discussions, selecting a tailored subset for each participant based on their role and experience with adaptation target setting. Interviews lasted 45–60 minutes and followed a semi-structured format: each had a customised topic guide to steer the conversation, but interviewers followed participant responses flexibly, meaning not all questions were asked in every case.
Ethical Considerations
Informed written consent was obtained from all participants prior to interview. Each participant received a consent form in advance, which they reviewed, digitally signed and returned. At the start of every interview, verbal consent was also confirmed to ensure participants were fully aware of the purpose of the research and their rights.
Topic Guide with full questions
Thank you for agreeing to take part in this interview. Before we begin, I’d like to briefly remind you of the purpose of our conversation.
This interview is part of research on setting and monitoring adaptation targets, carried out to inform how the Scottish Government measures its progress on adaptation and resilience. We are interested in hearing your perspective on how adaptation targets have, or have not, been developed in your country [or city].
Your participation is voluntary. You can skip any question or stop the interview at any time. With your permission, I would like to take notes and/or record the conversation. Everything you share will be confidential and used only for the purposes of this research. The interview will take around 45–60 minutes.
Before we start:
Do you have any questions about the research?
Can we confirm that you have received, signed, and returned the consent form?
Do you feel comfortable proceeding?
Theme
Possible questions
1.
Introduction
Can you describe your role in [jurisdiction] and your responsibilities for adaptation target-setting?
2.
Defining and framing adaptation targets
In your view, what makes a “good” adaptation target?
How did you come to this view?
3.
Status and development process
What is the current status of adaptation target-setting in your context (e.g. pre-development, in development, implemented, evaluated)?
What steps have been taken so far, and what remains to be done?
How are targets refined over time? (e.g. through monitoring, evaluation, or other mechanisms)
4.
Quality and characteristics of targets
Nature and level of targets
How would you describe the adaptation targets that have been developed for your jurisdiction?
At what level are these targets set (e.g. activity, output, outcome, or impact)?
What type of targets are they (e.g. process, capacity, investment)?
Design of targets
Are the targets measurable and time-bound?
Are they set within individual sectors, or are they designed to be cross-sectoral?
What influenced the decision to set these particular types of targets?
Purpose of targets
Would you describe the targets as:
Milestones (markers of progress along the way), or
End outcomes (specific results to be achieved)?
Why was this approach chosen?
5.
Purpose and motivations
Drivers of target setting
What motivated the development of these targets?
Were they introduced because of policy mandates, legal requirements, or political priorities?
Are any targets required by law?
Agreement and support
To what extent was there shared agreement on the need for targets?
If persuasion was needed, how was buy-in achieved?
Nature of response
Would you say the targets are mainly:
Reactive, responding to existing risks, or
Proactive, anticipating future risks?
Note: some targets, such as those on finance or capacity building, may not directly link to specific risks. In these cases, how would you describe their purpose?
Influence of purpose
Has setting targets helped inform required spending on adaptation (public or public and private)?
How did the purpose and motivation behind target setting influence the types of targets chosen?
6.
Integration and coherence
National and sectoral alignment
How did the process of developing targets take account of existing national plans and sectoral strategies?
International alignment
To what extent are the targets aligned with, or influenced by, international frameworks (e.g. SDGs, Sendai Framework, Convention on Biological Diversity)?
Were indicators or objectives from these frameworks used or adapted to help streamline reporting at the national level?
7.
Governance and institutions
Which government department or team led the target-setting process, and why?
What challenges did this team face, and how were they overcome?
What roles did other ministries, agencies, or subnational governments play?
Were there challenges in coordinating across these actors, and how were they addressed?
Who is responsible for ensuring targets are met?
How often is progress reported, and why was this schedule chosen?
8.
Political economy and decision-making
How have political, economic, or funding considerations influenced the development of targets?
Were there tensions between scientific recommendations and political feasibility? If so, how were these managed?
How were equity, justice, and vulnerable groups considered when developing targets?
Did these considerations affect the design or measurement of targets?
9.
Stakeholder engagement
Process and participation
Can you describe the process of stakeholder engagement (if any) in developing the targets?
Other than government, who was involved (e.g. civil society, academia, private sector)?
Challenges and influence
What challenges arose during stakeholder engagement, and what helped to overcome them?
How influential was stakeholder participation in shaping the targets? (In what areas was their input most significant?)
Balancing priorities
How were trade-offs managed—both between different stakeholder interests and between stakeholder priorities and the need to address future or uncertain climate risks?
10.
Knowledge and technical capacity
Use of evidence
What scientific evidence or risk assessments informed target-setting?
What challenges arose in using this type of evidence, and how were they overcome?
Risk and decision-making
How has the idea of risk tolerance or acceptable risk levels been considered?
How have targets been shaped by the need to balance risk and affordability? (Can you share any examples?)
Given that climate risks evolve in uncertain and sometimes unexpected ways, how has target-setting addressed uncertainty, and what provisions exist to revise targets as risks change?
Technical capacity
How did team capacity or technical expertise influence the types of targets that were set?
Where did the technical expertise come from?
11.
Resources and feasibility
How did financial, technical, or institutional capacities influence target-setting?
Were costing exercises or financing commitments part of the process?
What challenges or trade-offs arose between the level of ambition and available resources?
12.
Timeline and sequencing
What have been the key milestones or steps in setting targets?
Were any steps particularly challenging, and how were these challenges addressed?
How have external deadlines (e.g. international reporting) influenced the pace or design of targets?
Final reflections and closing
Looking back, what would you do differently if you were to go through this process again?
What do you consider the key enablers of success in your approach to setting and managing targets?
Closing Remarks
Thank you for your participation. We are conducting similar interviews with other jurisdictions. Your responses will be anonymised and collated to help inform the Scottish Government’s approach to adaptation target-setting.
Do you have any questions before we finish?
If you think of any questions later, you can contact us at:
Project team – Kate Lonsdale: kate.lonsdale@climatesense.global
Summary review of SNAP3 MEL architecture and indicators
Nick Brooks, for Climate Sense, October 2025
Elements and indicators in the SNAP3 MEL Framework
The SNAP3 MEL framework defines the following five elements across the four SNAP3 themes (nature, communities, public services, and economy and industry):
Strategic aim: to ‘build Scotland’s resilience to climate change’ as part of Scotland’s set of National Outcomes (applies across all four themes)
Outcome: what the policies and activities set out in the Plan expect to accomplish in the longer term to bring about increased resilience to climate change impacts in Scotland (one per theme, broken down into 2-4 areas)
Objectives: the aims of the policies in the plan over its delivery period, which if achieved should lead to progress toward the intended outcomes (3-6 per theme)
Enablers: enabling factors that overcome barriers to achieving outcomes and objectives in SNAP3. Objectives and outcomes will only be achieved if critical enabling factors are in place and barriers removed (21-30, across 6-7 areas per theme)
Activities: the activities occurring from the key policies and delivery mechanisms set out in SNAP3 which will deliver the objectives and outcomes and put in place the necessary enablers for these to be achieved (12-21, across 4-6 areas per theme)
The MEL framework also defines indicators at the level of outcomes (2-6 per theme; 16 in total) and objectives (8-13 per theme; 40 in total). Outcome indicators measure phenomena such as ecological health, public awareness, community action and wellbeing, collaboration across public services, levels of risk assessment and action in the public and private sectors, employment in green jobs, and uptake of grants for specific adaptation actions.
SNAP3 MEL through the lens of outputs, outcomes and impacts
The SNAP3 outcome indicators echo outcome indicators used in other adaptation contexts. Typically, outcomes are defined as short- to medium-term changes resulting from the outputs of adaptation activities (OECD 2023). Outputs are defined as goods and services and short-term changes that are under the control of those implementing adaptation actions (OECD 2023). In adaptation contexts, outcomes are often changes in capacities, capabilities and characteristics that make populations and systems better able to anticipate, plan for, cope with, recover from and adapt to climate related tresses and shocks, i.e. more resilient. Changes in resilience, measured in terms of these capacities, capabilities and characteristics therefore are often measured at the outcome level (e.g. Venable et al. 2022).
Outcomes contribute to longer-term impacts that, in adaptation contexts, can be seen as the ultimate measure of adaptation performance or success. These might include reduced losses and damages and improvements in climate-sensitive aspects of human, ecological and economic wellbeing such as health, poverty and inequality, relative to a historical baseline or ‘no-adaptation’ counterfactual. These measures indicate whether inferred changes in resilience, as measured at the outcome level, have translated into reduced harms from climate change.
The SNAP3 Objective indicators represent a mix of output, outcome, and impact indicators as typically defined in adaptation MEL contexts based on the OECD (2023) definitions. These include indicators of losses and damages in the form of properties flooded and disruptions to transport and supply chains under the Public Services and Economy and Industry themes. Certain activities and enablers in the SNAP3 MEL framework exhibit characteristics of outputs and outcomes and might also be tracked using output and outcome indicators.
Although SNAP3 does not define indicators at the impact level, there is considerable scope to define such indicators. These would measure climate related losses and damages and climate-sensitive aspects of human, ecological and economic wellbeing as indicators of longer-term adaptation performance/ effectiveness at a level above that of the SNAP3 outcomes. As such, they would provide a way of assessing progress towards the SNAP3 strategic aim.
Implications for target setting
The SNAP3 MEL framework already includes numerous quantitative indicators against which targets and milestones might be set. Viewing the framework through the lens of outputs, outcomes and impacts demonstrates that there is scope for identify additional indicators, and by implication targets, at these three levels, linked through a theory of change that relates changes in one level to changes in the next level up. This could be done while retaining the current SNAP3 MEL architecture of activities, enablers, objectives and outcomes.
A subset of SNAP3 objective indicators might be associated with targets for the delivery of certain outputs and the achievement of certain outcomes. The outcomes of most interest in relation to target setting are likely to be those associated with changes that most demonstrably increase resilience. These might include targets for the adoption of certain management regimes and access to key services and resources. They also might include tolerances and coping ranges measured in terms of the severity of a specific hazard that can be accommodated without significant adverse impacts (for which definitions and thresholds need to be agreed) (European Commission 2013, Brooks et al. 2019a).
A set of impact level indicators and targets could be defined to measure success in delivering the SNAP3 strategic aim, based on avoided losses, damages and harm. These might include existing indicators of losses and damages in the SNAP3 framework, for which targets might be developed. Such impact level targets would need to be reviewed and potentially revised in the light of escalating climate risks. Consequently, any such targets might best be used as benchmarks against which adaptation performance is measured for the purpose of learning and policy revision, rather than binding goals. If these targets were based on avoided, rather than actual, losses and damages, baselines would need to be established based on historical data or ‘no-adaptation’ counterfactuals, for which methodologies are emerging and might be further developed (Brooks et al. 2019b).
Questions for consideration when developing adaptation targets
To what extent should targets be linked to existing indicators, the logic of the existing SNAP3 MEL framework, and each other (through a theory of change)?
Is the current SNAP3 MEL architecture appropriate, or would a framework based on outputs, outcomes and impacts be preferable for target setting?
Are new indicators with associated targets required; if so, at what levels?
Are any activities and enablers in the SNAP3 MEL framework useful for target setting?
Should targets be set for delivery/implementation of SNAP3 policies (output level)?
Should targets be set for improvements in the capacities that make people, places and systems more resilient (outcome level)?
Can outcome targets be developed that specify the severity of specific hazards that certain national systems should accommodate to ground targets in climate risk?
Should additional indicators targets be developed based losses and damages, building on existing indicators under SNAP3 themes (impact level)?
How would targets based on losses and damages be operationalised, given the need for baselines and the evolving nature of climate change risks?
Should targets be associated with milestones?
How many targets are appropriate (at each level and in total)?
Case Summaries of Adaptation Target Approaches in Interviewed Jurisdictions
Countries
Austria
Austria’s adaptation governance is collaborative, iterative and consensus driven. Adaptation targets have been shaped primarily through coordination and agreement across ministries, rather than through statutory obligation or central imposition.
Institutional Context
Adaptation competences are spread across several sectors and governance levels. National Adaptation sits within the Ministry for Climate Action, Environment, Forestry, Agriculture, Water and Regions. The National Adaptation Strategy (NAS) and National Adaptation Plan (NAP) are developed in a broad stakeholder process and are now in their third iteration. The cycle involves strategy revision, publication of a progress report, and subsequent updating. The adaptation team does not direct sectoral ministries but plays a coordinating role, convening actors, facilitating dialogue, identifying risks and synergies and working to prevent maladaptation. The strategy is structured around 14 policy areas (e.g. water management, construction and housing, health, tourism) and – complemented by scientific evidence, studies and literature – relies on workshops and expert consultation to ensure interdisciplinary input and co-ownership.
Why Austria Has Not Adopted SMART Targets
SMART (specific, measurable, achievable, relevant, time-bound) adaptation targets have not been formally adopted. Interviewees saw this as a response to the complexity of adaptation. Climate impacts vary across sectors and evolve over time. Attribution is difficult and isolating the effects of specific measures from broader socio-economic change or intensifying climate risks is not easy. Baselines also shift as climate risks intensify, making it unclear whether targets should focus on reducing absolute harm or limiting the rate of increase.
Heat-related morbidity and mortality was cited as an example. Should a target focus on reducing total deaths, while exposure is increasing? Or slow the rate of increase in impacts? Which baseline year should be used? If damages increase despite adaptation efforts, does this indicate policy failure, insufficient ambition, or more severe climate conditions? Interviewees noted that numeric targets could provide a sense of certainty that may not fully reflect this underlying complexity. These challenges, combined with Austria’s coordination-based governance model, have contributed to caution about rigid quantitative thresholds. Instead, the strategy relies on dialogue, quantitative and qualitative assessment and iterative monitoring to balance ambition with realism.
How Target Discussions Take Place
Adaptation goals are developed through sector workshops. Ministries, provinces, academia, social partners, NGOs and practitioners review challenges and goals, assess climate risk and measures’ relevance and discuss progress. This helps define ambition while maintaining cross-sector ownership and ensuring effectiveness as well as inclusion of social aspects. Targets are structured at three levels:
One overarching national goal focused on resilience and synergies.
Sector-level overarching goals.
Sub-targets within sectors.
Vulnerability assessments underpin these discussions by describing expected climate trends and sectoral risks. Rather than planning against a single prescribed climate scenario, the strategy presents a range of projected developments. No specific scenario is embedded as a binding benchmark.
Monitoring Through Structured Dialogue
Monitoring combines quantitative indicators with structured expert review. The process includes:
47 quantitative and qualitative criteria
Workshops across all 14 sectoral areas.
Structured qualitative ratings of progress.
Descriptive feedback from participants.
Experts (from ministries, provinces, academia and practice) review progress towards set goals, sub-targets and recommended activities (over 120 in total), assessing progress using a structured scale and providing contextual explanation. The Environment Agency synthesises indicator data and workshop findings into the progress report, with participants given the opportunity to review interpretations before publication. Although the strategy and reports are not legally binding, influence derives from stock-taking, inter-ministerial coordination, professional networks and sustained dialogue rather than formal enforcement.
Reflections and Lessons
Austria’s approach shows that structured adaptation governance can develop without adopting formal SMART targets. Progress has been driven by collaborative monitoring, sustained networks and regular revision of strategy. Interviewees highlighted the importance of engaging sector experts early, linking monitoring to practical solutions, maintaining trust across institutions and recognising the value of qualitative information, particularly for social dimensions of adaptation.
While international debate around SMART targets continues, Austria’s approach reflects a system in which ambition is shaped through consensus, coordination and realism about measurement challenges. The case demonstrates how institutional culture and governance arrangements influence adaptation target-setting alongside technical considerations.
Germany
Germany’s approach to adaptation target-setting is legally mandated, organised around seven thematic clusters, each led by a responsible ministry and embedded in a formal policy cycle. The Climate Adaptation Act requires the national adaptation strategy to include measurable targets, indicators and measures. Although the law mandates targets, their content and ambition are negotiated between ministries rather than imposed centrally.
Institutional and Legal Context
The Act formalised adaptation target-setting within a structured policy cycle. It introduced a four-year strategy revision cycle and an eight-year national climate risk assessment, embedding targets within a recurring assessment–monitoring–revision process. Before the Act, Germany had an adaptation strategy but no legal requirement to define measurable targets. Interviewees described the legislation as providing both political momentum and an institutional framework that strengthened coordination across ministries. However, the Act does not prescribe specific target levels, nor does it include sanctions for non-compliance. Where targets are not met, ministries are expected to propose corrective measures. In practice, targets function as steering and accountability tools rather than enforceable legal thresholds.
How Targets Were Developed
Target development was coordinated through the Inter-Ministerial Working Group on Adaptation. The Environment Ministry provided overall guidance, but line ministries drafted their own targets within the cluster structure. Advice was given that “good” adaptation targets should:
Align with priority risks identified in the national climate risk assessment
Be influenceable at national level
Focus on outcomes rather than counting measures
Be time-bound where feasible (with at least one 2030 target per cluster)
Each cluster was initially asked to propose three to five targets to ensure manageability. Drafts were reviewed and revised through technical exchanges and formal consultation, with overlaps resolved through facilitated discussion. Decentralised ownership was considered preferable to centrally imposed ambition and ministries were expected to only commit to targets they were prepared to implement.
What “Measurable” Means in Practice
The meaning of “measurable” varies across clusters. Some targets include explicit quantitative values and timelines while others define directional change, supported by developing indicators. In several cases, targets were adopted before appropriate indicators existed. Indicator systems are being refined over each successive cycle, with ministries commissioning research to address data gaps. Interviewees described target-setting as pragmatic, with scientific assessment balanced by political and practical considerations. Not all targets meet ideal criteria but this is accepted as part of institutional learning. The priority was to begin measurable target-setting and improve precision over time.
Stakeholder and Citizen Engagement
Structured stakeholder engagement accompanied target development. This included consultation on draft targets and the draft strategy, online input and a dialogue event involving around 60–70 stakeholders and approximately 40 ministry representatives. Stakeholders contributed expertise and suggested refinements, although final decisions remained with ministries. Separate regional citizen dialogues invited randomly selected participants to articulate visions of a climate-resilient Germany. Their input influenced the strategy’s vision more than the technical design of targets.
Funding, Ownership and Constraints
There is no central adaptation fund; ministries finance measures within existing budgets. Many measures were already underway and were incorporated into the adaptation framework. Fiscal constraints and political feasibility shaped the level of ambition, and not all identified risks are addressed in the first cycle. Targets are anchored in the national climate risk assessment, which prioritises high-risk areas.
Monitoring and Iteration
Germany’s framework operates as a structured policy cycle linking risk assessment, strategy, monitoring and revision. Targets may be refined or made more quantitative in subsequent cycles, and indicator systems are expected to mature over time. This iterative design allows ambition to develop progressively rather than requiring full precision from the outset.
Reflections and Lessons
Germany’s experience shows how a legal mandate can establish adaptation targets while still leaving space for negotiation between ministries. Targets are organised within seven thematic clusters, with each ministry responsible for developing and delivering its own commitments. Although the law requires targets to be set, their ambition and design emerge through discussion rather than central direction. The process combines stakeholder engagement with gradual improvement in measurement, linking targets to a regular cycle of monitoring and revision. In this way, measurable targets operate as practical governance tools, shaped by risk assessments, ministerial ownership and available resources.
Canada
Canada’s approach to adaptation target-setting is driven by national priorities and oriented toward mainstreaming resilience across systems. Targets were introduced through the development of the 2023 National Adaptation Strategy (NAS), rather than through legislation. While not legally mandated, they were intended to introduce measurable commitments to pursue near-term action.
Institutional Context
The NAS is organised around five interconnected “systems” (e.g. health and well-being, infrastructure, disaster resilience, nature and biodiversity, and economy and workers), each led by a responsible federal department. Environment and Climate Change Canada (ECCC) coordinates overall delivery, while central agencies, including Treasury Board and Finance, participate in formal governance structures to provide oversight of federal implementation. In Canada’s federal system, implementation requires collaboration with provinces, territories and Indigenous governments, and the NAS was framed as a shared vision for whole-of-society action rather than a top-down directive. Targets are not enshrined in law, and there are no statutory penalties for non-compliance. Accountability instead relies on public reporting, audit scrutiny and periodic strategy renewal.
Why Targets Were Introduced
Interviewees described the inclusion of targets as both political and strategic. The insurance sector had advocated for measurable national adaptation goals for over a decade, arguing that escalating climate losses required clearer risk reduction benchmarks. At the same time, the federal government sought to secure whole-of-society buy-in and demonstrate progress on resilience. Targets were intended to:
Drive implementation beyond high-level goals.
Focus limited resources on priority risks.
Trigger the development of measurement approaches.
The decision to include measurable targets came relatively late in the policy process. Once confirmed, departments were instructed to develop near-term, realistic targets aligned with existing programs and funding streams.
How Targets Were Developed
Each “system lead” department drafted targets within its domain, coordinated by ECCC. Departments were encouraged to ensure targets were measurable, achievable and aligned with current policy instruments. In the first NAS cycle, many targets focus on mainstreaming i.e. embedding climate risk into planning, investment and service delivery.
As a result, targets often address process and capacity-building outcomes (e.g. integrating risk into decision-making, expanding program participation) alongside longer-term resilience ambitions. Near-term milestones were prioritised to build momentum. Interviewees acknowledged that ambition was shaped by funding constraints and political feasibility. Departments were cautious about committing to targets without guaranteed resources.
What “Measurable” Means in Practice
Canada’s 25 targets vary in specificity. Some include quantitative thresholds and timelines and others combine directional outcomes with supporting indicators. In certain cases, long-term ambitions (e.g. eliminating heat-related deaths by 2040) were included to signal the scale of transformation required, even where pathways remain uncertain.
Interviewees described targets as tools to mobilise action and improve coordination rather than as precise scientific endpoints. Where data gaps exist, monitoring and evaluation frameworks are being developed and expanded. The forthcoming progress report is expected to assess performance towards targets using both qualitative and quantitative assessments.
Funding, Leverage and Iteration
Funding limitations significantly shaped target design. Dedicated adaptation funding was lower than initially requested, leading some departments to align targets with initiatives already underway. A key strategy has been to mainstream resilience into major investment streams such as infrastructure and federal asset management. Through Treasury Board’s Greening Government Strategy and oversight role, resilience requirements are increasingly embedded in federal planning and procurement processes. The NAS will be updated over time, with a next update planned by 2030. Targets are expected to be reviewed and updated in future cycles. Accountability is maintained through public reporting, Auditor General scrutiny and periodic strategy updates informed by evolving climate science and awareness of Canada’s top climate risks.
Reflections and Lessons
Canada’s experience demonstrates how measurable adaptation targets can be introduced through political commitment rather than legislation. The approach is characterised by distributed accountability across system leads, strong horizontal coordination and an emphasis on mainstreaming as a first step. Targets function as coordination and mobilisation tools within Canada’s federated system, shaped by risk assessment, fiscal realities and intergovernmental dynamics.
The Netherlands
The Netherlands approaches adaptation target-setting in two different ways. In flood and water management, clear legal standards and stable funding are already in place. However, in broader adaptation policy, covering sectors such as health, agriculture and infrastructure, target setting has developed more gradually, with targets emerging through dialogue and practical experience rather than fixed national thresholds.
Institutional Context
Dutch adaptation policy is shaped by two main programmes. The Delta Programme, backed by the Delta Act and supported by around €1 billion per year, focuses on flood risk, freshwater supply and spatial adaptation. It operates with clear legal standards, for example flood protection levels of 1:100,000 per year, alongside stable governance and financing. Alongside this sits the National Adaptation Strategy, which addresses sectors beyond water management, including health, agriculture, infrastructure and nature. When first adopted in 2016, the strategy focused less on quantitative targets and more on raising awareness and engaging ministries that were still beginning to see adaptation as part of their responsibilities. Early efforts therefore concentrated on strengthening coordination rather than defining measurable thresholds.
Why Quantitative Targets Are Uneven
The Netherlands has a long history of numerical standards in flood management, supported by established institutions and monitoring systems. Similar standards do not yet exist across other areas of adaptation. Outside the water sector, responsibilities are more fragmented, data and capacity vary and acceptable levels of risk are less clearly defined. Interviewees noted that, unlike mitigation policy, adaptation does not have a single metric such as CO₂ emissions. For hazards such as heat, drought or pluvial flooding, there is less agreement on acceptable risk levels and how ambition should be measured. While flood protection norms are well established, other sectors are still working out how to translate climate risk into concrete targets. One idea discussed was that adaptation policy should at least ‘keep pace’ with climate change. In practice, this means ensuring that as hazards intensify, preparedness and protection increase accordingly so that overall risk does not rise without corresponding action. Rather than eliminating risk entirely, the aim is to prevent the gap between rising climate pressures and adaptive capacity from widening. The focus is therefore on maintaining resilience over time rather than setting a single fixed threshold.
Monitoring as a Driver of Target Clarity
A distinctive feature of the Dutch approach has been experimentation with monitoring as a way of clarifying goals. While formal national monitoring is coordinated centrally, the Climate Adaptation Services (CAS), a boundary organisation operating between government, business and knowledge institutions, established an informal “Monitoring Lab” to support subnational learning. The Monitoring Lab creates a protected space in which provinces, municipalities and water boards can test tools, share experience and reflect on progress without political pressure. Through this process, three monitoring questions emerged: ‘Are we doing what we said we would do?’, ‘What effects are we seeing?’ and ‘Are we on track?’. The third question has proved most influential. Participants recognise that it is difficult to judge whether the system is on track without clearer goals. Monitoring discussions therefore encouraged greater clarity about targets, even where formal quantitative standards were absent.
How Targets Are Developing in Practice
Current work focuses on supporting regional groupings to define more concrete goals for hazards such as heat, pluvial flooding, drought and sea level rise. National government facilitates this process but does not prescribe uniform targets. Given the decentralised nature of spatial adaptation and variation in local capacity, identical national standards are neither feasible nor considered appropriate. Instead, institutions convene dialogue, provide tools and support regions in defining context-specific ambitions.
Adaptive Management and Revision
Target-setting is embedded in a broader tradition of adaptive delta management. Major Delta decisions are reviewed every six years and supported by synthesis documents explaining assumptions and choices. Independent scientific review reinforces transparency and robustness. Revision is treated as a normal feature of governance rather than as evidence of failure. Interviewees also stressed the importance of creating safe spaces where participants can reflect beyond organisational mandates. Such settings are seen as essential for addressing complex questions about acceptable risk and long-term limits.
Reflections and Lessons
The Dutch experience shows how different approaches to adaptation target-setting can coexist within one country. In flood protection, long-established legal standards make quantitative targets straightforward. In other sectors, targets are emerging gradually through dialogue and practical experimentation.
Monitoring, particularly the question ‘Are we on track?’, has helped sharpen thinking about ambition. Rather than imposing uniform thresholds, the approach enables regions to define and revisit their own goals over time. Adaptation target-setting in the Netherlands combines technical expertise with ongoing discussion about acceptable risk, using quantitative standards where they are well established and adaptive management where they are not.
Cities
Paris
Paris has progressively strengthened adaptation targets across successive climate plans, particularly as heatwaves, flood risk and urban overheating became more visible public and political concerns. While earlier plans articulated general resilience goals, experience showed that without measurable targets it was difficult to assess progress or sustain momentum. Targets were therefore introduced to embed adaptation more firmly within municipal governance and to signal commitment to political leadership and residents.
Institutional Context
Adaptation in Paris is embedded across departments rather than managed by a single isolated unit. The climate team coordinates the overall climate plan and aggregates reporting, but operational departments such as urban planning, green spaces, water, public health and education are responsible for delivering sector-specific actions.
The climate plan integrates mitigation, adaptation, resilience, nature-based solutions and social equity considerations. Vulnerability to heat and other risks is unevenly distributed across neighbourhoods, and this shaped both the framing and location of adaptation targets.
Why Introduce Targets
Interviewees described several motivations for introducing measurable targets. First, they were seen as necessary to move beyond broad intentions. Second, they enable monitoring and accountability. Third, they strengthen coordination across departments by clarifying expectations. Finally, they signal seriousness to elected officials and the public.
There was recognition that without quantified goals, adaptation risks remaining aspirational. At the same time, adaptation is inherently multi-sectoral and influenced by external factors, which complicates target design.
How Targets Were Developed
Target-setting drew on climate projections, heatwave mortality data, flood risk assessments, green space analysis and neighbourhood vulnerability mapping. Major heatwave events acted as political catalysts, reinforcing the urgency of adaptation.
Departments reviewed existing sectoral plans and identified where climate considerations could be strengthened. The climate team facilitated coordination but did not impose targets. Each department proposed sector-specific commitments within its mandate and budget. Targets were shaped through internal negotiation to ensure feasibility within the constraints of a dense urban fabric and competing land uses.
Paris has limited opportunities for large-scale green expansion. As a result, targets often involve creative approaches such as greening rooftops, redesigning schoolyards, integrating trees into street redesign and embedding nature-based solutions within existing infrastructure.
Quantitative and Process Targets
There was internal debate about the value and limits of quantification. Quantitative targets are viewed as important for measurement and credibility. Examples include expanding green surface area, increasing shaded spaces, developing cooling facilities during heatwaves and improving access to climate shelters. Many targets are time-bound, often aligned with 2030 milestones.
At the same time, some commitments are process-oriented, such as integrating climate risk into planning regulations and urban design standards. These are harder to measure but essential for long-term resilience.
Reducing heat-related mortality illustrates attribution challenges. Health outcomes depend on demographic factors, public health systems and behavioural responses as well as physical adaptation measures. For this reason, Paris often uses measurable proxies such as cooling infrastructure or shaded space rather than outcome targets alone.
Monitoring and Consequences
Departments report periodically on agreed targets. The climate team consolidates this information and produces monitoring reports that inform political leadership. Some indicators, such as hectares of green space, are straightforward. Others are influenced by external variables.
Targets are not legally binding. However, missing them can lead to political scrutiny, reputational risk and internal accountability discussions. Civil society and media attention following extreme weather events can intensify this scrutiny. Targets also provide leverage for securing funding and prioritising projects.
Reflections and Lessons
Paris demonstrates a politically responsive model of municipal adaptation target-setting. Targets function as steering tools, coordination mechanisms and communication devices as much as technical instruments. They are negotiated within administrative constraints and revised over time as conditions change.
The case shows that measurable adaptation targets can strengthen institutionalisation and accountability in a complex urban administration, even where outcomes are influenced by factors beyond municipal control.
Barcelona
Barcelona introduced adaptation targets within its 2018 Climate Plan, which marked a strategic reset integrating mitigation, adaptation and climate justice. Targets were shaped by strong internal reporting culture, sectoral negotiation and significant spatial and climatic constraints. The process reflects both technical confidence in some sectors and political negotiation in others.
Institutional Context
The 2018 Climate Plan was developed by a core team including the Energy Agency, adaptation and resilience staff, social rights and citizen engagement units. Operational departments such as water, parks, coastal management and urban planning were closely involved. The climate office coordinates and reports on the plan, but departments retain responsibility for delivery.
Before drafting targets, the city undertook downscaled climate projections and vulnerability assessments. These highlighted increasing drought, extreme heat, sea level rise and pluvial flooding risks. Heat and water scarcity were identified as particularly pressing, shaping both the urgency and content of targets. Barcelona is a dense Mediterranean city with limited available land and growing water stress. These structural conditions strongly influence what can realistically be targeted.
Internal Debate on Quantification
There was substantial internal discussion about how far to quantify adaptation. In some sectors, especially water management, numerical targets were relatively straightforward. The water department operates with modelling tools and established engineering standards. For example, reducing potable water consumption to 100 litres per person per day was framed as both technically measurable and publicly communicable. Flood and wastewater systems also use return period thresholds and technical benchmarks. These provided a foundation for measurable targets linked to drainage capacity and infrastructure resilience.
In contrast, green space targets were more contested. Barcelona committed to increasing green surface area by approximately 1.6 square kilometres between 2015 and 2030. Given the city’s density, achieving this requires redevelopment projects, green roofs, pocket parks and greening of schoolyards. However, drought and tree mortality have complicated delivery, illustrating how climate impacts themselves can undermine progress toward adaptation targets.
Why Targets Matter Internally
Within the climate office, there was a clear view that indicators without targets were insufficient. Targets were seen as necessary for meaningful monitoring and internal accountability. However, the climate office does not have authority to impose targets. Each department had to agree to commitments based on its operational capacity and budget. This meant that target-setting involved negotiation rather than instruction. Departments needed to feel confident that they could deliver. In some cases, targets were calibrated to align with existing plans or capital investment cycles.
Targets were also framed in ways that could resonate politically. For example, ensuring access to climate shelters within a five minute walk provides a concrete and socially visible objective, particularly during heatwaves.
Limits of Municipal Control
Many adaptation outcomes depend partly on citizen behaviour and private sector decisions. Water consumption levels depend on household choices. Expansion of green space may require cooperation from private landowners. Heat resilience is influenced by building design and retrofitting decisions beyond direct municipal control. This complicates attribution. If targets are missed, it may not reflect municipal inaction but rather external factors such as drought intensity, demographic change or behavioural trends.
Monitoring and Revision
The climate office collects annual data from departments and tracks implementation rates. Reporting also occurs quarterly at executive level. Targets are not legally binding and there are no statutory penalties. However, they are politically salient. Failure to show progress can generate scrutiny from elected officials, civil society and the media.
Interviewees acknowledged that targets are both necessary and imperfect. Measurement methodologies influence results, and extreme events such as prolonged drought can distort performance indicators. Targets are therefore revisited during plan updates, and adjustments may be made in response to new climate information or political priorities.
Reflections and Lessons
Barcelona illustrates a negotiated municipal model of adaptation target-setting. Engineering-oriented departments were more comfortable with quantification, while land use and greening targets required more political compromise. A strong reporting culture supported measurable commitments, but delivery remains department-led and influenced by external factors.
The case shows that municipal adaptation targets must balance technical feasibility, spatial constraints and political credibility. Targets function as coordination tools and public signals of ambition rather than as legally enforceable guarantees of specific outcomes.
Lisbon Metropolitan Area
Lisbon’s experience highlights the distinction between structured adaptation planning and clearly defined strategic targets. While adaptation planning has expanded significantly across Portugal, explicit metropolitan level quantitative targets are less clearly embedded in the Lisbon plan than might initially appear.
Institutional and Methodological Context
Adaptation planning in Portugal began scaling up around 2010. Early municipal strategies were often broad climate plans, with adaptation framed as sectoral actions. Over time, planning became more structured and methodologically consistent. A key influence was the ADAM methodology, adapted from the UKCIP Adaptation Wizard and applied across more than two dozen municipalities. The ADAM cycle includes preparation, assessment of current and future vulnerabilities, identification and evaluation of adaptation options, integration into territorial planning instruments, monitoring and revision. The methodology became embedded in municipal tenders and metropolitan planning processes. In principle, the cycle anticipates monitoring and target-setting. In practice, interviewees noted that most effort has focused on vulnerability assessment and defining options, while monitoring and measurable targets have received less systematic attention.
How Targets Appear in the Lisbon Plan
The Lisbon Metropolitan Adaptation Plan implemented the early stages of the methodology in depth. It includes baseline analysis, sectoral vulnerability assessment and identification of adaptation measures at multiple scales. Measures are typically framed with assigned responsibility, thematic area and indicative timeframe. However, explicit numeric targets linked to overarching strategic objectives are less visible. Some numbers associated with Lisbon, such as figures related to tree planting or drainage improvements, may originate from individual projects or sectoral initiatives rather than from a consolidated metropolitan target framework. Interviewees cautioned that extracting numbers without understanding their origin risks misrepresenting the strategy. Targets may sit within supporting documents, sector annexes or separate funding programmes rather than within the main strategy text.
Why Targets Are Difficult to Consolidate
Several structural factors limit the consolidation of metropolitan targets. Implementation remains largely municipal. Each municipality has its own leadership, priorities and administrative capacity, while the metropolitan authority has a coordinating role but limited mandate to direct action. Portugal’s 2021 climate law requires municipalities and regions to adopt climate action plans. However, interviewees suggested that enforcement is limited and legal obligation alone does not ensure implementation capacity. National mandates may thus generate compliance in producing plans without guaranteeing delivery or measurable progress. More broadly, interviewees described a national planning culture in which strategy production can become an end in itself. Plans are developed over several years and then replaced by new plans, while systematic monitoring and evaluation receive less sustained attention. This can create a gap between planning activity and implementation outcomes.
Characteristics of Effective Targets
From the interviewee’s perspective, effective adaptation targets require three elements. They should be measurable, time-bound and clearly assigned to a responsible actor. Without these components, targets risk being delayed or overlooked. These principles are particularly relevant in contexts where monitoring systems are fragmented. Unclear responsibility or absent deadlines weakens follow-through.
Monitoring and Midterm Review
Lisbon Metropolitan Area is undertaking a midterm evaluation after five years. However, monitoring remains decentralised and data collection inconsistent across municipalities. There is no single consolidated inventory of progress. Plans are sometimes used to support funding applications or justify projects rather than as active management tools. This reinforces the challenge of moving from structured planning to measurable, coordinated implementation.
Citizen and Stakeholder Engagement
Public consultation is formally required in plan development, but participation levels vary. Citizens are rarely involved in defining numeric targets and target-setting often seen as an administrative function. Stakeholders such as researchers and nongovernmental organisations may provide technical critique, but direct citizen influence on measurable commitments is limited.
Reflections and Lessons
Lisbon’s approach illustrates that comprehensive planning frameworks do not automatically produce clear metropolitan targets. Strong methodologies and widespread plan adoption can coexist with weak consolidation of measurable commitments. However, interviewees also noted a steady increase in interest in adaptation and in the human and institutional resources dedicated to it. This creates greater opportunities to learn from earlier planning processes and gradually improve governance and monitoring systems. The case thus underscores the importance of linking targets to responsibility, timeframes and monitoring systems while also highlighting the limits of top-down legal mandates without capacity-building and coordinated follow-through. For cities considering quantified adaptation targets, Lisbon’s experience suggests that institutional culture and implementation practice are as important as methodological design.
References
Brooks, N., Anderson, S., Aragon, I., Smith, B., Kajumba, T., Beauchamp, E. and Rai, N. (2019a) Framing and tracking 21st century climate adaptation. IIED Working Paper. London: IIED. Accessed 16th April 2026: https://www.iied.org/10202iied
While every effort is made to ensure the information in this report is accurate as at the date of the report, no legal responsibility is accepted for any errors, omissions or misleading statements. The views expressed represent those of the author(s), and do not necessarily represent those of the host institutions or funders.
This work was supported by the Rural and Environment Science and Analytical Services Division of the Scottish Government (CoE – CXC).
If you require the report in an alternative format such as a Word document, please contact info@climatexchange.org.uk or 0131 651 4783.
Complete list of documents reviewed in Section 7.1 ↑
Extent of Quantification reflects the relative number and sectoral coverage of explicit, time-bound numeric or formally measurable targets within the adaptation framework, based on document review. “Limited” indicates isolated or highly selective quantified standards; “Moderate” indicates multiple sectoral quantified or measurable targets; “Extensive” indicates broad cross-sector use of quantified or formally measurable targets embedded within the overall framework. Classifications are comparative rather than absolute. ↑
SMART is a widely used policy framework for designing targets. The acronym stands for Specific, Measurable, Achievable, Relevant and Time-bound. A target described as “SMART” clearly defines what will change, includes a measurable indicator, sets a defined timeframe, and is judged realistic given available capacity and resources. A formal SMART target is explicitly structured in this way in a strategy, often as a clear numeric commitment with a deadline. ↑
Examples of potential methodological approaches discussed in the wider literature (including Brooks et al. 2019) include anomaly-based indicators, climate-adjusted baselines, and counterfactual techniques that estimate losses relative to expected climate conditions. Other strands of work explore identifying thresholds in climate variables above which impacts escalate rapidly (e.g. temperature thresholds associated with heat-related mortality; McMichael et al. 2008; Gasparrini et al. 2015). These approaches remain constrained by data limitations, modelling uncertainty and the need for context-specific calibration. ↑
Leiter, T., Olhoff, A., Al Azar, R., & Barmby, V. (2021). Adaptation Monitoring, Evaluation and Learning (MEL) Systems: Strengthening Climate Resilience Through Evidence-Based Decision-Making. United Nations Development Programme (UNDP) and German Development Cooperation (GIZ). This study systematically reviewed national adaptation monitoring, evaluation, and learning (MEL) systems worldwide. It provides a comparative overview of how different countries design, implement and institutionalise MEL systems for climate change adaptation, whether or not they have submitted a National Adaptation Plan (NAP) to the UNFCCC. It provides a standardised typology of MEL system development stages, allowing for consistent comparison across countries and thus complements the UNFCCC and NAP Global Network data. ↑
These are the set of questions to guide enquiry and analysis of the adaption target development process. They will form the basis of the semi-structured interviews with policymakers and technical experts from selected jurisdictions. All the questions within each framework feature may not be answered. ↑
The Scottish Government has made successive commitments to delivering a just transition to a net zero and climate resilient Scotland. As part of this, it is important to understand, as far as is practicable, the extent to which transition processes and outcomes are just. Recent years have seen proactive efforts by the Scottish Government and others to develop monitoring and evaluation (M&E) frameworks for a just transition in Scotland. These made progress but the Scottish Government found they were not yet ready to be implemented in practice.
ClimateXChange commissioned this research on behalf of the Scottish Government to deliver a proposal for a just transition M&E framework that prioritises rigour and practical applicability. The project was led by the University of Edinburgh and delivered by a ClimateXChange Research Fellow embedded in the Scottish Government.
This report is independent: it is not Scottish Government policy, nor does it reflect Scottish Government policy positions.
Results – The framework
This project developed an M&E framework for a just transition to a net zero and climate resilient Scotland, informed by a Theory of Change approach. The proposed framework is made up of four outcomes, each with a set of indicators (number of indicators in parentheses):
Communities and Places (12),
People and Equity (13),
Jobs, Skills and Economic Opportunities (17),
Environment and Biodiversity (8).
There are 50 outcome indicators in total. The framework also identifies 15 summary indicators which are selected from the 50 outcome indicators. These are intended to provide a high-level overview of progress that can be more easily communicated than the full indicator set.
Figure 1 provides an overview of outcome indicators in the M&E framework. These are categorised by outcome, target population, summary indicators and data availability. Some of the proposed indicators cannot be monitored with existing data.
In addition to outcome indicators, this framework proposes a set of 23 indicators for monitoring key sites of transition, or ‘hotspots’. Hotspots are defined as places directly impacted by industrial change or by net zero developments. This project also examines possible anticipatory approaches for early warning identification and monitoring of hotspots, transition risks and opportunities.
Stakeholder engagement is identified as fundamental for just transition M&E. It is presented as a tool for qualitative data collection, an approach for monitoring and indicator interpretation, a real-time tool for risk mitigation and a method for the anticipation of potential transitions.
Framework limitations
Data availability, timeliness and scale: There are data gaps for some key just transition concerns. Data availability, quality and coverage also vary at local, regional and national scale. In addition, they do not always match the scale of concern (e.g., local authority data does not represent the sub-local authority Grangemouth and Falkirk towns). Most indicators are published with a time delay and will not reflect transition impacts in real time.
Framework structure, design and development: This project provides a detailed approach to monitoring a just transition in Scotland and to interpreting outcome indicators. Further work is needed to support evaluation of why a just transition is / is not being achieved.
The proposed M&E framework emphasises the essential role of regular stakeholder engagement to inform all dimensions of M&E. Effective stakeholder engagement in resource constrained contexts can be challenging and may limit implementation.
Recommendations for just transition M&E
Start now: test and refine the proposed approach through data collection and indicator interpretation across outcome and hotspot indicators. This will enable an assessment of the practical applicability of the framework and its ability to capture just transition concerns in the Scottish context.
Identify the conditions necessary for just transition delivery and develop approaches to evaluation. This will include attention to issues of governance, responsibility and policy responsiveness to just transition M&E.
Develop qualitative engagement tools and analytical approaches as part of just transition M&E, to support the identification of transition risks, indicator interpretation and evaluation.
Implement more integrated approaches to data collation and sharing across Scottish Government and with external stakeholders.
Fill critical data gaps, including but not limited to (i) workforce transitions in high emitting sectors, (ii) business vulnerability and adaptation to climate change and net zero, (iii) household vulnerability and resilience to climate change and (iv) land use change implications for a just transition.
Test and refine anticipatory uses of just transition M&E to identify and monitor sites of transition before transitions are underway. This can support the anticipation of risks and opportunities and inform responsive policymaking.
Use M&E to improve communication with external stakeholders about transition efforts towards net zero and climate resilience, including successes and challenges. Consider the use of data management and visualisation tools such as dashboards, websites and reports for data management, communication and reporting.
Figure 1. Outcome indicators in the just transition M&E framework. Categorised by outcome, target population, summary indicators and data availability.
Glossary
Just Transition
“For the Scottish Government a just transition means becoming a net zero, climate resilient economy in a fair way that seeks to tackle inequality and injustice. Just transition is about both the outcome – a fairer, greener future for all – and the way we get there in partnership with those most likely to be impacted by the change.” (Scottish Government, 2026a, p.32)
Net zero
“A situation in which any greenhouse gas emissions put into the atmosphere are balanced out by the greenhouse gases removed from the atmosphere, so that the “net” effect is zero emissions. Scotland has committed to ‘net zero’ emissions by 2045.” (Scottish Government, 2026a, p.33)
Climate resilience
In this report, climate resilience refers to the results of adapting to a changing climate. “Adaptation to climate change involves the deliberate and systematic adjustment of systems and processes to effectively address both anticipated and actual climate change impacts.” (Scottish Government, 2026a p.32)
Hotspots
Sites of transition identified on the following basis:
Places reliant on a high-emitting industry and undergoing industrial change
Places hosting net zero developments (renewable energy infrastructure and land use change) and their aggregated impacts
Monitoring and evaluation
A practice by which responsible actors can track, measure and assess progress towards identified goals, while analysing the degree to which implemented actions supported the delivery of said goals.
Indicator
An indicator is a specific, measurable variable which can be monitored over time, often to show trends. An indicator should support assessment of progress towards achieving overall aims. Indicators can be qualitative or quantitative and may be tracked at different timeframes (e.g. annually, biannually, every 5 years).
The Scottish Government has made successive commitments to integrating Just Transition (JT) into its policymaking processes and outcomes. JT principles were integrated into the Climate Change Act (Scottish Parliament, 2019) and the Just Transition Commission (JTC) was established with an independent scrutiny role. The Government also published a National JT Planning Framework (2021); draft sectoral JT plans for energy (Scottish Government, 2023), transport (Scottish Government, 2025a) and agriculture and land use (Scottish Government, 2025b); and the Grangemouth Industrial JT Plan (Scottish Government, 2025c). Most recently, JT indicators were included in the Climate Change Plan (CCP) published in March 2026 (Scottish Government, 2026b). The Government also committed support for a JT through the Just Transition Funds for Grangemouth and for the North East and Moray (Scottish Government, 2025c; Scottish Government, 2026c).
JT monitoring and evaluation (M&E) approaches remain in their infancy for various reasons. Defining what is captured within the scope of JT is challenging. In addition, there are difficulties in developing national-level frameworks which also reflect the experiences and needs across people and geographies. There are challenges around the temporal nature of the transition, including the ways in which responsibilities, costs and benefits are spread across generations. The transition to net zero and climate resilience also faces uncertain impacts and unintended consequences, including from unpredictable economic, geopolitical and climatic shocks. From a practical perspective, there are clear data weaknesses and gaps for JT monitoring in Scotland (e.g., Drabble et al. 2024). Finally, there are limited examples of applied frameworks for JT M&E worldwide.
Scotland is embarking on the transition to net zero and climate resilience from a baseline of inequality and existing, legacy injustices (Drabble et al. 2024). The cumulative impacts of climate change, climate adaptation and decarbonisation risk entrenching injustices and creating new ones. At the same time, the systems-wide net zero transition is also an opportunity to correct historical injustices while improving equity, wellbeing and justice in Scotland; goals aligned with the Scottish Government’s JT outcomes in the National JT Planning Framework (2021). It is essential that the Scottish Government can understand, as far as is practicable, how the transition is unfolding, and whether the associated processes and outcomes are just.
Recent years have seen proactive efforts to develop JT M&E approaches in Scotland. Research by the Just Transition Lab in Aberdeen and Aberdeenshire advanced understandings of place-based JT monitoring grounded in local priorities (Shapovalova et al. 2023). The second JTC published various place-based reports (e.g., in Shetland (Voar, 2024), Dumfries and Galloway (2025a) and Aberdeen and the North East (2025b)), showcasing the unique characteristics of net zero transitions in different parts of Scotland. The JTC also published a national JT Theory of Change (ToC) and M&E framework (Drabble et al. 2024). The latter was subsequently translated into the Grangemouth local context (Jenkins et al. 2025). While these works took JT M&E further and provided a broad overview of JT and M&E concerns, the Scottish Government found they were not yet ready to be implemented in practice.
This project was commissioned by ClimateXChange on behalf of the Scottish Government. The aim was to develop a rigorous and pragmatic JT M&E framework that could be made operational by the Scottish Government. As such, it builds on existing work and departs from it, informed by additional empirical stakeholder engagement and a review of the most recent evidence.
The project was led by the University of Edinburgh and delivered by an independent ClimateXChange Research Fellow embedded in the Scottish Government. This report sets out a proposed JT M&E framework and recommendations for JT M&E implementation for the Scottish Government. The report is independent: it not Scottish Government policy, nor does it reflect Scottish Government policy positions.
Conceptualising JT ‘Monitoring and Evaluation’
The term ‘Monitoring and Evaluation’ (M&E) encompasses a range of practices for tracking, measuring and assessing progress towards identified goals. M&E also analyses the degree to which implemented actions supported the delivery of those goals (HM Treasury, 2026; HM Treasury, 2020; Adindu, 2010; Estrella and Gaventa, 1998). The use of M&E frameworks is widespread, often to assess the impact of specific delivery programmes or interventions (e.g., Adindu, 2010).
A ‘JT’ is often not contained to a single policy or project and for some, is an overarching societal goal. Responsibilities and influence over a JT are spread across a variety of stakeholders and its achievement is often conditioned by a broader, shifting context. In this way, it can be comparable to the Sustainable Development Goals (United Nations, n.d.) or aspirational visions of national wellbeing, as reflected in Scotland’s National Performance Framework (currently archived and under revision) (Scottish Government, n.d.).
In Scotland, both Scottish Government policy (e.g., Scottish Government, 2021a) and JTC published reports (e.g., Just Transition Commission, 2024, 2025a, 2025b; Voar, 2024; Drabble et al. 2024; Jenkins et al. 2025) define the JT in expansive terms. This includes a spread of intersecting concerns including employment; community participation and empowerment; the distribution of benefits; industrial change and existing socio-economic inequalities, across scales and sectors. Further increasing complexity, the JT is characterised both as a “process” and “outcome” (Scottish Government, 2021a, p.5; e.g., Jenkins et al. 2025, p.27). So, a JT is as much about the just-ness of how the transition develops, as about the impacts it creates.
In the context of specific delivery programmes, policies or interventions, ‘monitoring’ is the “process of continuously tracking the progress and performance of an intervention, to provide data on whether it is being delivered as intended” (HM Treasury, 2026, p.72). It involves tracking specific data points over time that relate to the overall goal. The cross-cutting, multi-dimensional and multi-stakeholder nature of JT makes such an approach challenging. In the Scottish Government, many policy areas relate to, impact and condition JT delivery, from economic development through to poverty, agriculture, planning or technological development (e.g., Scottish Government, 2021a). Although there is a central JT Unit within the Scottish Government, there is no single, neatly bounded programme for JT delivery.
In a policy context, evaluation can be defined as: “a systematic assessment of the design, implementation and outcomes of an intervention. It involves understanding how an intervention is being, or has been, implemented and what effects it has, for whom and why” (HM Treasury, 2020, p.5). Evaluation is also broader, however, referring to “the process of judging or calculating the quality, importance, amount, or value of something” (Cambridge dictionary, n.d.). It is possible to evaluate what happened, how it happened and/or why it happened. These three types of evaluation are different, require different approaches and all apply in the context of assessing progress towards a JT.
This project understands ‘monitoring’ and ‘evaluation’ as interdependent practices necessary to comprehend the just-ness of the transition to net zero and climate resilience in Scotland. This interdependent approach underpins the conceptualisation and structure of the proposed JT M&E framework. Indicators were selected based on key, monitorable areas related to JT outcomes. Indicator selection was also underpinned by the framework’s evaluation objectives, based on a dual understanding of evaluation as assessing what is happening, and why. Said another way, the framework was designed to enable both an assessment of the just-ness of the transition, and an assessment of why particular impacts have come about.
The framework takes inspiration from ‘Theory of Change’ (ToC). In simple terms, ToC can be defined as “the hypothesis about the way that a program brings about its effects” (Dhillon and Vaca, 2018, p.65). ToC has been identified as a useful tool to design transformational social interventions (Simeone et al. 2023) and has been used by the Scottish Government to inform M&E frameworks for complex, multi-dimensional phenomena. Examples include the third Scottish National Adaptation Plan (SNAP3) M&E framework (Scottish Government, 2024a), and the Grangemouth Industrial JT Plan (Scottish Government, 2025c). Drabble et al. (2024) also used a ToC approach to inform their development of a JT M&E framework for Scotland.
ToC informed M&E frameworks often contain two key dimensions: outcomes and mechanisms. Outcomes are medium term goals, or ‘what success looks like’; while the mechanisms or enablers are the ‘conditions for success’ (Drabble et al. 2024, p. 42). Because mechanisms focus on the conditions for successful delivery of the outcomes, they can support evaluation of why progress is being made.
Drawing on ToC and the JT M&E framework developed by Drabble et al. (2024), the proposed M&E framework is designed to include both outcomes and mechanisms. Within this structure, this project has prioritised (a) outcome identification and refinement and (b) indicator development for monitoring. As currently developed, the framework therefore enables JT monitoring and supports evaluation of what is happening in relation to JT outcomes, but not how or why. The framework’s design enables the future integration of mechanisms to support evaluation of why JT progress is underway. This responds to the project specification to develop:
High-level quantitative metrics for JT M&E in Scotland,
Qualitative evaluation proposals to support indicator monitoring, including attention to place-based activity and the experiences of the most vulnerable to negative transition impacts, and
A proposal for an integrated and practical approach to JT M&E that combines quantitative and qualitative approaches in a coherent theoretical framework.
Project methods and report structure
Methods
The methods used to inform the proposed M&E framework and related recommendations are summarised in Table 1.
Method
Detail
Purpose
Policy review
Including:
Scottish Government policy, prioritising JT policy and related policy areas
M&E frameworks in JT and related policy areas in Scottish Government
Examples of JT M&E approaches across governments worldwide
To increase familiarity with the Scottish Government JT policy landscape and policy M&E approaches and expertise.
To learn from and build on available existing JT M&E, approaches as relevant to the Scottish context.
To inform the shape and language of the final framework, including through the identification of gaps, inconsistencies, and underdeveloped opportunities.
Literature review
Including:
JT M&E approaches by non-government stakeholders for Scotland and further afield
Identified JT M&E academic literature
To provide insight into existing JT M&E work, alongside methods for JT M&E.
To learn from and build on available approaches as relevant in the Scottish context.
Semi-structured and unstructured interviews, exchanges
With external stakeholders and public agencies (Appendix A):
On existing M&E practices and frameworks
On JT priorities and indicators
Total: 16
To gain practical insight into available methods, frameworks and practices to understand, analyse and evaluate impact.
To refine the focus of outcomes and indicators and identify available data sources.
Iterative engagement across Scottish Government areas
Continuous, routine and ad hoc meetings and follow up discussions with team members across government areas.
To support indicator development, data identification and recommendations drawing on cross-government expertise.
Workshop
In-person workshop with purposefully selected stakeholders and Scottish Government team members (held on the 17 November 2025).
To support indicator identification and refinement across outcomes and attention to affected and vulnerable groups in the transition and climate change context.
Internal sessions
Internal sessions with Scottish Government team members responsible for the future direction and implementation of JT M&E (organised in February 2026).
To increase JT M&E framework familiarisation within Scottish Government and inform reflections and recommendations on implementation in a policy context.
Table 1: Methods used in the development of the JT M&E framework.
The Research Fellow was embedded within the Scottish Government Climate Change Analysis Team in close collaboration with members of the JT Unit. This enabled engagement across government teams, attendance at relevant internal webinars and workshops and direct involvement in discussions on a variety of relevant JT topics. It also informed the methods detailed in Table 1, including through access to support on policy and data identification, workshop design and facilitation, or iterative discussions on M&E framework development. A full list of interviewees, workshop attendees and areas engaged across the Scottish Government is included in Appendix A.
Report structure
Section 2 outlines the evidence reviewed, focusing on Scottish Government policy and JT M&E proposals across policy and academia worldwide. Section 3 presents the key findings from this research. Sections 3.1 and 3.2 detail the core of the proposed M&E framework including JT outcomes, indicator and data selection methods, and outcome indicators. Section 3.3 presents a ‘hotspot’ monitoring approach and indicators, integrating place-based JT M&E within a national M&E framework. It also proposes anticipatory approaches to monitoring as part of JT M&E. Section 3.4 includes detail on interpreting framework indicators. Section 4 sets out framework limitations and reflections on JT M&E. Section 5 presents a set of recommendations and concludes this report.
Evidence review
The Scottish Government published a National JT Planning Framework in 2021 (Scottish Government, 2021a). This included eight JT outcomes focused on empowering communities; skills development and fair work; addressing existing socio-economic inequality; supporting a strong and productive economy; supporting climate adaptation; protecting the environment; ensuring decarbonisation, and furthering human rights while avoiding the creation of new injustice (Scottish Government, 2021a, p.31). The Government also committed to developing sector-specific JT plans for four ‘net zero sectors’: energy (2023), transport (2025a), agriculture and land use (2025b) and buildings and construction (not yet published). In tandem, the Grangemouth Industrial JT Plan was published in 2025.
The National JT Planning Framework, draft sectoral JT plans and the Grangemouth Industrial JT Plan are structured differently and vary in detail and level of indicator development. The sectoral plans and Grangemouth industrial plan all refer to four themes which cluster JT concerns in Scotland: Communities and Places; People and Equity; Jobs Skills and Economic Opportunities, and Environment, Biodiversity and Adaptation[1][2].
In parallel, the second JTC has focused on JT M&E, including through recommendations in their Annual Report (2024) and in their final report in 2026 (Just Transition Commission, 2024, 2026a). They have published numerous JT M&E reports, including by Drabble et al. (2024) who developed a ToC for a JT in Scotland and a national JT M&E framework. The authors detailed JT priorities in the Scottish context, articulating both outcomes (what success looks like) and mechanisms (how to get there). They developed indicators, identified data sources and data gaps and provided a baseline assessment of indicator progress on a traffic light scale (improving – maintaining – declining).
The national JT M&E framework by Drabble et al. (2024) was translated into the Grangemouth local context by Jenkins et al. (2025). This reiterates the importance of place-specific transitions and accordingly, contextualised M&E. Shapovalova et al.’s (2023) work on monitoring a JT in Aberdeen and Aberdeenshire also focused on place-based transitions. Through stakeholder engagement, the authors identified four JT themes and an accompanying suite of indicators, which were analysed in relation to the local context.
The Scottish Government has also commissioned ClimateXChange projects to review and learn from the evolving JT M&E landscape and inform sectoral JT plans. These include a summary of existing approaches to JT M&E (Bergseng, 2023) and three reports by SYSTRA (2023a, 2023b, 2023c). The SYSTRA reports provide JT perspectives into sectoral areas of energy, transport and the built environment and construction.
Drawing boundaries around what is/ is not JT policy is an ongoing challenge. Climate change impacts and actions relating to the transition are cross-cutting issues, as are considerations of justice. Beyond explicit JT policy, there are various Scottish Government policy areas directly relevant to issues of JT. Illustrative examples of strategies and monitoring frameworks which overlap with JT considerations include: the National Performance Framework, the CCP (2026), the SNAP3 M&E framework (2024), the Public Engagement Strategy for Climate Change (Scottish Government, 2021b), the draft Environment Strategy (Scottish Government, 2025e), the Biodiversity Strategy M&E framework (Scottish Government, 2024b), the National Transport Strategy 2 (2020) and related M&E frameworks (Transport Scotland, 2021, 2022, 2024), the National Strategy for Economic Transformation (2022) and the Green Industrial Strategy (Scottish Government, 2024c).
Across Scottish Government JT policies, reports and related policy arenas, there is some convergence around ToC informed approaches to M&E. Most clearly, the Grangemouth Industrial JT Plan includes JT outcomes and ‘transition levers’ (the mechanisms), which capture ‘how the Just Transition will be delivered’ (Scottish Government, 2025c, p.11). In the space of climate adaptation, SNAP3’s M&E framework uses a ToC informed approach with outcomes, objectives and indicators, including a monitored annual baseline and identified climate adaptation ‘enablers’. The ToC has also been mobilised in JT M&E efforts beyond Scotland.
Beyond Scotland
Efforts to monitor and evaluate progress towards a JT are emerging worldwide. The diverse models reflect varying interpretations of the JT both conceptually and in a policy context. In the European Union (EU) context, for instance, JT M&E is proposed in relation to environmental policy (Heyen et al. 2021). The authors present a suite of output, result and impact indicators including measures linked to EU social domains and environmental impacts. More broadly, the EU defines ‘JT regions’ as carbon intensive regions currently supported by the Just Transition Fund (EU, 2024). This contrasts with the more expansive understanding of JT by the Scottish Government.
Kelly et al. (2025) developed a JT M&E approach for the Irish government based on JT ‘domains’. These are broadly sector-oriented (electricity; agriculture and land use; buildings; transport and connectivity, and environment) along with two cross-sectoral domains: skills and employment, and participation and community engagement. The sectoral approach echoes sectoral JT plans under development in Scotland. In Kelly et al. (2025), these are integrated into the core structure for a nation-wide JT monitoring framework for Ireland. The framework is funded by the Environment Protection Agency and sits in relation to environmental policy, as per the EU.
The Spanish Government’s understanding of JT is primarily focused on economic and employment aspects of the transition, alongside additional social concerns (Spanish Government, 2020). In addition, Spain takes an ‘at-risk area first’ approach to JT, which prioritises attention to declining coal and emissions-intensive dependent regions through the implementation of place-based ‘Just Transition Agreements’ (Spanish Government, 2020). From an M&E angle, Spain has been reporting on JT progress for circa five years. Their monitoring and reporting approach is output oriented and focuses primarily on whether policy commitments have been delivered (yes/no), and on data such as the amount of funds invested into different projects (Spanish Government, n.d.). There is lesser attention to Spain’s progress towards a JT overall from an outcome-oriented perspective. Their reports provide detailed, qualitative case studies about place-based ‘Just Transition Agreements’ implementation and delivery (Spanish Government, 2023).
Although not specifically a JT framework, the National Wellbeing Framework for Wales provides an applied example of monitoring multi-dimensional, complex phenomena on an outcome basis, as it has been reported against since 2017[3]. This framework is made up of seven high-level goals (or outcomes) and identifies a suite of 50 indicators which map across the different goals. In this framework, a single indicator may be used to monitor progress across various goals. From these 50 indicators, 16 are selected as milestone indicators to provide a high-level overview of how Wales is doing in relation to wellbeing goals (Welsh Government, 2022a, 2022b). The cross-cutting approach to indicator relevance, along with framework visualisations and reporting experience make this a useful example for JT M&E framework development.
The Taranaki region in New Zealand used a ToC approach to identify JT outcomes for a vision of Taranaki in 2050 (Venture Taranaki, 2020). This framework includes monitoring, causality analysis, policy tracking and evaluation. It is conceptualised in detail but appears at an early stage of implementation, with limited indicator development. Tarfa et al.’s (2024) Monitoring, Reporting and Verification framework for a Just and Gender Inclusive Transition in Nigeria also used a ToC approach. The authors present an overarching JT goal, a vision and eight high-level outcomes, the latter of which are broken down into actions, intermediate outcomes and ultimate outcomes. Indicators cover environmental dimensions like emissions or chemical spillage and pollution, and social dimensions ranging from positive community impacts, reducing social inequalities or the redistribution of oil and gas revenues to social projects.
The Monitoring, Evaluation and Learning framework for tracking a JT in South Africa (ICAT, 2024) is also grounded in a ToC. The authors include restorative justice, procedural justice and distributive justice as underpinning their understanding of JT. This framework incorporates enabling conditions, outputs, milestones and outcomes through which to reach overall JT impact. It identifies 54 priority indicators across these categories. Outcome indicators are focused on fossil fuel consumption, emissions reductions, training and employment creation, and participation measures, at times reporting at smaller geographical levels or by demographic groups.
Research by Oliver et al. (2025) into JT M&E in the Welsh context offers a different approach to ToC and outcome-based frameworks. Drawing on concepts of resilience and vulnerability, the authors identify what would affect a person’s ability to prepare for, respond to, benefit from, and recover from different climate change policies and scenarios. On this basis, they conceptualise a composite, weighted vulnerability index focused on vulnerability to climate change mitigation and rank Welsh local authorities accordingly.
JT M&E has also been explored in academia, often in collaboration with policy or industry. Examples include Htitich et al.’s (2024) methodology for developing a Just Transition Score tool in collaboration with the Social Progress Index, or Kelly et al.’s (2020) composite indicator to identify households at risk of energy poverty. From a policy development and evaluation perspective, Bird et al. (2024) developed a tool to assess ‘Just Energy Transition Plans’, while Kaljonen et al. (2024) set out an approach to combine policy mixes to support JT delivery. McCauley et al. (2023) suggested a JT ranking method through a suite of indicators which they related to theoretical justice tenets. Live, industry-based examples of JT monitoring include the World Wildlife Fund’s tool and scorecard to rank national JT plans (World Wildlife Fund, n.d.); the World Benchmarking Alliance’s JT Methodology (2025) which uses a ‘scoring and weighting’ approach that provides a very high-level numerical score on JT; or the Transition Plan Taskforce’s (2024) review of 13 existing disclosure frameworks that are relevant to transition planning and disclosures.
Summary
The evidence reviewed illustrates a variety of approaches, models and frameworks for JT M&E. These emphasise the use of overarching goals/aims/outcomes, and the different types of monitoring approaches available. Monitoring may be focused on outcome/impact, policy delivery or output tracking. Justice theory (e.g. Heyen et al. 2021; Kelly et al. 2025) and conceptual structures like the ToC explicitly and implicitly underpin several of the reviewed examples. Others, like Oliver et al. (2025), take a composite index approach instead.
Various sources highlight the importance of quality data gathering and indicator development (e.g. Kelly et al. 2025; Tarfa et al. 2024) along with attention to demographic data breakdowns and to the distributional implications of the transition (e.g. Hayen et al. 2021; Oliver et al. 2025; Kelly et al. 2025). The evidence also emphasises the value of M&E and reporting for communication with stakeholders (e.g., ICAT, 2024). In this vein, Kelly et al. (2025, p.25) also recommend the development of a dashboard as a ‘suitable destination framework for communicating and presenting indicators and trends’.
Various reports also refer to the dynamic nature of climate change and the transition. They emphasise the importance of reviewing JT M&E frameworks alongside broader contextual trends over time (e.g., ICAT, 2024). Reports also stress the importance of harnessing an M&E framework and tools for prospective analysis (Oliver et al. 2025), equipping JT M&E and policy with foresight – or anticipatory – capacity (Kelly et al. 2025). This includes anticipatory attention to key ‘at risk’ areas (e.g. Hayen et al. 2021; Spain, 2024; Lázaro Touza et al. 2025).
The Framework
The full structure of the proposed M&E framework (‘the framework’) is illustrated in Figure 1. The objectives of the framework, informed by the evidence, Scottish Government and stakeholder input are to:
Monitor impacts of the transition across Scotland and provide a stocktake of how Scotland is doing from the perspective of justice,
Support policy tracing and causality evaluation across mechanisms and policies, in relation to JT outcomes,
Support anticipation of risks and opportunities of the transition before they happen, including in ‘hotspot’ areas,
Through the three objectives detailed above, inform policy development,
Communicate progress in relation to a JT, to (i) hold the government to account and (ii) improve communication of the impacts of the transition.
Figure 1. Structure and parts of the full Just Transition M&E framework.
As illustrated in Figure 1, the framework structure is informed by a ToC approach and includes both outcomes and mechanisms, as well as hotspots. Hotspots are defined as places directly impacted by industrial change or by net zero developments, further detailed in section 3.3.
The remainder of this section focuses on outcomes, hotspots and their indicators, as outlined in section 1.1. Section 3.1 details outcome development, followed by outcome indicators in 3.2. Section 3.3 presents the hotspots approach, anticipatory methodologies for hotspot identification and hotspot indicators, followed by recommendations for indicator interpretation in Section 3.4.
Outcomes
This project understands outcomes as ‘what success looks like’ or what characterises a JT in the Scottish context. Within JT policy in Scotland, the definitions and language surrounding JT (and JT M&E) have iteratively evolved since the publication of the National JT Framework in 2021. There have been varying definitions of what outcomes embody a JT in Scotland and for the Scottish Government, and there are arguably inconsistencies. The Scottish Government’s draft sectoral JT plans, for instance, do not refer to the eight outcomes in the National JT Framework (2021)[4]; and neither does the JT section within the CCP (2026). Draft sectoral JT plans, the Grangemouth Industrial JT Plan and the Draft CCP (2025) all refer to four themes: Communities and Places; People and Equity; Jobs, Skills and Economic Opportunities and Environment, Biodiversity and Adaptation. These themes are described as relating to, or grouping JT outcomes (e.g., Scottish Government, 2023; Scottish Government, 2025a)[5].
This project reviewed and mapped references to outcomes, outcome clusters, proxy outcomes, objectives, themes and priority areas (whichever way defined) within existing JT publications by the Scottish Government and in Drabble et al. (2024). Appendix B summarises the terminology and categorisations used in the documents reviewed. This highlighted clear convergence in JT policy and Drabble et al. (2024) around the four themes outlined above. On this basis, this project developed a refined set of four overarching outcomes characterising a JT to a net zero and climate resilient Scotland. These are named according to the four themes and are introduced in Table 2.
The four outcomes below synthesise the key JT areas of concern in Scotland. They were identified and refined based on the evidence review, stakeholder feedback and internal engagement with Scottish Government teams.
Outcomes
Communities and Places: The transition to net zero and climate resilience increases agency, social cohesion and community wealth across Scotland through collaboration, empowerment and socio-economic benefit.
People and Equity: The transition to net zero and climate resilience addresses existing inequalities across Scotland and avoids creating new ones, supporting a more equal society overall.
Jobs, Skills and Economic Opportunities: Scotland ensures a managed transition away from high-emissions industries and practices and delivers a diversified, prosperous and climate resilient economy grounded in worker participation, fair work, skills development and thriving business.
Environment and Biodiversity: Through the transition to net zero and climate resilience, Scotland acts within planetary boundaries and restores the natural environment for current and future generations of people and planet.
Table 2. Outcomes, M&E framework for a JT to a net zero and climate resilient Scotland.
There is inevitable overlap across outcomes. In this framework they are positioned in relation to each other and with no hierarchy (Figure 2). At the same time, each outcome signifies a distinct focus area which enables the thematic grouping of certain indicators per outcome (for a similar approach, see Shapovalova et al. (2023)).
Figure 2. Visualisation of the four outcomes of a JT to a net zero and climate resilient Scotland.
Outcome indicators
Figure 3 provides a visual overview of proposed outcome indicators grouped by outcome, including their target populations for data monitoring. It also signposts the summary indicators (intended to provide a high-level overview of the transition), and identifies the indicators with no data currently available. The remainder of this section presents the indicator development approach followed by an overview of summary indicators and outcome indicators. Additional information on indicators including their desired trend, data timeframes and a quality assessment can be found in Appendix C.
Figure 3. Outcome indicators in the JT M&E framework. Categorised by outcome, target population, summary indicators and data availability.
Indicator development and data selection
Indicator selection was guided by the following priorities: conceptual rigour, relevance and representativeness of a JT in Scotland, data availability, timeliness and responsiveness to the project specification.
Drawing on the evidence review, outcomes were defined first. This established high level JT priorities in the Scottish context. A long list of indicators was developed from policy, reports and academic literature, with attention to their relevance across the four outcomes. This list was complemented with stakeholder input. The workshop and semi-structured interviews were specifically designed to focus on indicator development. To support discussions during these engagements, the four outcomes were sub-divided into descriptive focus areas (available in Appendix D). Informal conversations and meetings with external stakeholders and the Scottish Government further informed indicator development and data identification. The indicator long list was queried and refined to merge, move and remove indicators based on relevance and data availability[6]. Full indicator details and a quality assessment can be found in Appendix C. Further detail on the indicator selection process is available upon request.
The final list of indicators was also informed by data availability. The search for available data involved desk-based research and stakeholder engagement across government teams and with external stakeholders. Tables 1, 2 and 3 in Appendix A summarise the stakeholders and different government areas engaged throughout. Drawing on Taranaki Venture (2020) and SNAP3 (Scottish Government, 2024a), criteria influencing indicator development and data selection included:
Relevance to the outcomes to be measured,
Timeliness,
Sample sizes for Scotland (when data is collected at UK scale),
Possible breakdowns by socio-economic and geographic scales (where relevant),
Data availability and accessibility.
Reporting for most indicators is recommended at a ‘Scotland-wide’ target population level. Additional target populations are included for some indicators based on an understanding of their relevance for specific geographies or groups. Target populations for data monitoring (relevant across all outcomes and indicator tables) include:
Scotland-wide: Data for Scotland as a whole,
Demographic groups: Age, sex, gender, ethnicity, disability, income (as relevant/ available per data source),
Scottish Index of Multiple Deprivation (SIMD): By SIMD percentile (e.g., locations identified as the 20% most deprived areas of Scotland) (SIMD, 2020),
6-fold urban-rural classification and islands: Geographical data breakdown according to the Scottish Government’s Urban Rural Classification. This distinguishes between large urban areas, other urban areas, accessible small towns, remote small towns, accessible rural and remote rural areas (Scottish Government, 2024d). Alongside the rural-urban classification, this target population group includes monitoring islands separately,
Local Authorities as relevant to the indicator.
Data identification and indicator refinement were undertaken simultaneously. Efforts focused on identifying indicators where data was readily available, to ensure the feasible implementation of the framework and avoid further delays to JT monitoring. The framework also includes some indicators for which data is currently not available, yet which cover key JT areas of concern. Possibilities for indicator refinement and data collection were also explored for these indicators, the details of which can be found in Appendix E.
Finally, indicators within the framework both draw on and at times, depart from existing Scottish Government JT M&E publications. Appendix F details the parallels and differences between this framework and in particular, JT indicators in the CCP (2026).
Summary indicators
The proposed 15 summary indicators provide a high-level overview of the just-ness of Scotland’s transition across the four JT outcomes. As a small set of indicators, they offer cross-cutting insight into the JT. This may also be useful at reporting stage and for JT communication with internal and external stakeholders.
Summary indicators are selected from across the four outcomes and should be reported on at a Scotland-wide level. Additional reporting by demographic groups is also recommended for three indicators in the list: those about policy influence, opportunities for young people in Scotland and about individuals’ ability to adapt to climate change. These three indicators are selected as proxies for issues of participation, recognition and distribution of impacts and opportunities across groups in Scotland, today and in the future. Table 3 sets out the proposed 15 summary indicators.
Outcome
Summary Indicator
(all reported on at Scotland-wide level)
Target population
Communities and Places:
The transition to net zero and climate resilience increases agency, social cohesion and community wealth across Scotland through collaboration, empowerment and socio-economic benefit.
Proportion of people in Scotland reporting satisfaction with opportunities to influence (i) the Scottish Government’s approach to delivering net zero, and (ii) local policy and planning decisions relating to net zero
Demographic groups
Number of community groups involved in climate action/sustainability activities, as recorded by the Climate Action Hubs (and case studies).
Operational capacity of community and locally owned energy installations in Scotland. Include breakdown (i) by type of ownership (ii) by location and (iii) as a proportion of total renewable energy installed (that year/ overall).
People and Equity:
The transition to net zero and climate resilience addresses existing inequalities across Scotland and avoids creating new ones, supporting a more equal society overall.
Percentage of dwellings in Fuel Poverty
Percentage of people reporting that they can afford their individual transport costs
Proportion of people who agree that the transition to net zero and climate resilience will support a more positive future for young people and future generations in Scotland
Demographic groups
Level of adaptation action being taken by people in Scotland
Demographic groups
Premature deaths due to exposure to fine particulate matter (PM2.5)
Demographic groups
Jobs Skills and Economic Opportunities:
Scotland ensures a managed transition away from high-emissions industries and practices and delivers a diversified, prosperous and climate resilient economy grounded in worker participation, fair work, skills development and thriving business.
Employment (full-time equivalent) in the low carbon and renewable energy economy (LCREE) in Scotland
Low Carbon and Renewable Energy Economy (LCREE) estimated direct and indirect turnover
High emitting industry worker participation in decisions affecting them
Sense of uncertainty/ confidence in the transition amongst workers in high emitting industries
Proportion (%) of employees earning less than the Real Living Wage
Environment and Biodiversity:
Through the transition to net zero and climate resilience, Scotland acts within planetary boundaries and restores the natural environment for current and future generations of people and planet.
Emissions of the eight priority Air Quality pollutants (ammonia, carbon monoxide, nitrogen oxides, non-methane volatile organic compounds, particulate matter, sulphur dioxide and lead) for Scotland
Scotland’s carbon footprint expressed in million tonnes of carbon dioxide equivalent per year
Table 3: Summary indicators for the JT M&E framework.
Communities and Places
Table 4 provides an overview of proposed indicators to monitor progress towards the Communities and Places (CP) outcome. This table includes indicator number, indicator, target population (which may include more than one population, indicated as ‘population #2, population #3’) and the data source. Indicators with no currently available data are clustered at the end of the table (CP 9-12). Summary indicators are marked with an asterisk in the CP column (e.g., CP1*). The same approach is used for all outcome tables presented in Sections 3.2.3 – 3.2.6.
Communities and Places (CP)
CP
Indicator
Population
Population #2
Data source
CP1*
Proportion of people in Scotland reporting satisfaction with opportunities to influence (i) the Scottish Government’s approach to delivering net zero, and (ii) local policy and planning decisions relating to net zero
Scotland-wide
[Demographic group breakdown in P&E]
Scottish Climate Survey (proposed addition from Autumn 2026)
CP2
Proportion of people in Scotland reporting satisfaction with opportunities to influence net zero and climate adaptation developments happening in their local area
Scotland-wide
[Demographic group breakdown in P&E]
Scottish Climate Survey (proposed addition from Autumn 2026)
Ad hoc qualitative – with stakeholders
CP3*
Number of community groups involved in climate action/sustainability activities, as recorded by the Climate Action Hubs (and case studies)
Scotland-wide
Local Authorities (qualitative)
Climate Action Hubs quarterly reporting to Scottish Government
Qualitative – with community action stakeholders
CP4
Geographical coverage of regional adaptation collaborations [once full coverage, updates on implementation]
Scotland-wide
Local Authorities not involved in adaptation partnerships
Adaptation Scotland reporting to Scottish Government
CP5
The proportion of people reporting that changes to their local place due to net zero infrastructure and/or land use change[7] have maintained or improved the quality of their local area
Scotland-wide
Scottish Climate Survey (proposed addition from Autumn 2026)
Operational capacity of community and locally owned energy installations in Scotland. Include breakdown (i) by type of ownership (ii) by location and (iii) as a proportion of total renewable energy installed (that year/ overall)
Average value of community benefits committed from renewable energy projects commissioned in the last 36 months, where a community or developer form is attached to a project
Number of woodland creation projects registered with the Woodland Carbon Code (WCC) and peatland restoration projects registered with the Peatland Code (PC) owned by community groups and small landholdings; and as a % of total registered projects
Case studies – qualitative engagement with stakeholders e.g., Scottish Forestry, Peatland Action, Community Land Scotland.
CP12
Socio-economic benefits from woodland creation and peatland restoration
Scotland-wide
Qualitative engagement with key stakeholder groups e.g., Community Land Scotland, Scottish Forestry, Peatland Action, Scottish Land Commission, and with projects under development. The WCC has a benefits self-reporting tool from which data may also be available for the Scottish Government.
Table 4: Communities and Places outcome for the JT M&E framework.
People and Equity
Table 5 provides an overview of proposed indicators to monitor progress towards the People and Equity (PE) outcome. Earlier versions of the framework included absolute poverty, relative poverty and the GINI coefficient as indicators within this outcome (in keeping with Drabble et al. (2024) and the JTC’s Annual Report (2024)). Following discussions with Scottish Government analysts, these were removed from any one outcome. Instead, they are identified as high level, contextual trends against which to analyse JT progress across all four outcomes. Further detail on the value of using poverty and inequality data as contextual trends for indicator interpretation is provided in Section 3.4.2.
People and Equity
PE
Indicator
Population
Population #2
Population #3
Data source
PE1*
Proportion of people in Scotland reporting satisfaction with opportunities to influence (i) the Scottish Government’s approach to delivering net zero, and (ii) local policy and planning decisions relating to net zero
Demographic groups
Scottish Climate Survey (proposed addition from Autumn 2026)
PE2
Proportion of people in Scotland reporting satisfaction with opportunities to influence net zero and climate adaptation developments happening in their local area. Include breakdown by (a) ocean and (b) land projects
Demographic groups
Scottish Climate Survey (proposed addition from Autumn 2026)
Ad hoc qualitative engagement with sectoral stakeholders
PE3*
Percentage of dwellings in Fuel Poverty
Scotland-wide
(ii) 6-fold rural/urban
(iii) Island local authorities
Scottish House Condition Survey
PE4
Housing with EPC C or above across housing/tenure types
Scotland-wide
(ii) 6-fold rural/urban (iii) Island local authorities
Proportion of people who agree that the transition to net zero and climate resilience will support a more positive future for young people and future generations in Scotland
Scotland-wide
Scottish Climate Survey (proposed addition from Autumn 2026)
PE9*
Level of adaptation action being taken by people in Scotland
Proportion of householders with prior flood claims who can receive quotes from 5 or more insurers
Scotland-wide
Flood-Re
PE12
Proportion of people living in a flood risk area who report an inability to implement flood risk measures
Scotland-wide
Scottish Climate Survey (proposed addition from Autumn 2026)
Indicators with no currently available data
Population
Population #2
Population #3
Suggested method/ data source for collection
PE13*
Premature deaths due to exposure to fine particulate matter (PM2.5) (number of premature deaths)
Scotland-wide
Demographic groups
SIMD percentile
Public Health Scotland
Table 5: People and Equity outcome for the JT M&E framework.
Jobs, Skills and Economic Opportunities
Table 6 provides an overview of proposed indicators to monitor progress towards the Jobs, Skills and Economic Opportunities (JSEO) outcome. Indicators dependent on UK Sectoral Industrial Classification (SIC) codes may be subject to change and refinement following the revision of UK SIC codes currently underway (Office for National Statistics, 2026). This may result in new sectoral categorisations and sub-categories by activities directly related to ‘net zero’ (e.g., renewable energy) which could support targeted sectoral breakdowns for indicators such as JSEO8, “proportion [%] of employees earning less than the Real Living Wage”.
Jobs, Skills and Economic Opportunities
JSEO
Indicator
Population
Population #2
Data source
JSEO1*
Employment (full-time equivalent) in the Low Carbon and Renewable Energy Economy (LCREE) in Scotland
Number of people in Modern Apprenticeships reporting that their apprenticeship is in a ‘net zero or green sector’ (i) 3-month and (ii) 15-month after finishing
Proportion (%) of employees earning less than the Real Living Wage
Scotland-wide
Annual Survey of hours and earnings
JSEO9
The difference between male and female full-time hourly earnings in the transport sector[8]. [SIC H: Transportation and storage]
Scotland-wide
Annual Survey of hours and earnings
JSEO10
The difference between male and female full-time hourly earnings in the energy sector. [SIC B: Mining and Quarrying; SIC D: Electricity, Gas, steam and air conditioning supply]
Scotland-wide
Annual Survey of hours and earnings
JSEO11
The difference between male and female full-time hourly earnings in the construction sector. [SIC F: Construction]
Scotland-wide
Annual Survey of hours and earnings
JSEO12
The difference between male and female full-time hourly earnings in the agriculture sector. [SIC A: Agriculture, forestry and fishing]
Scotland-wide
Annual Survey of hours and earnings
Indicators with no currently available data
Population
Population #2
Suggested method/ data source for collection
JSEO13
Number of renewable energy supply chain businesses in Scotland
Interim proxy: £ value of ScotWind projects committed to Scottish-based suppliers
Scotland-wide
Selected industry statistics for business based on pre-identified SIC code sectors.
Number of workers experiencing redundancy in high emitting industries in Scotland receiving support/ reporting that their employers are implementing transition plans for workers
Scotland-wide
Survey and qualitative engagement with key stakeholders.
JSEO16*
High emitting industry worker participation in decisions affecting them
Scotland-wide
Survey and qualitative engagement with key stakeholders.
JSEO17*
Sense of uncertainty/ confidence in the transition amongst workers in high emitting industries
Scotland-wide
Survey and qualitative engagement with key stakeholders.
Table 6: Jobs, Skills and Economic Opportunities outcome for the JT M&E framework.
Environment and Biodiversity
Table 7 provides an overview of proposed indicators to monitor progress towards the Environment and Biodiversity (EB) outcome.
Environment and Biodiversity
EB
Indicator
Population
Data source
EB1*
Emissions of the eight priority Air Quality pollutants (ammonia, carbon monoxide, nitrogen oxides, non-methane volatile organic compounds, particulate matter, sulphur dioxide and lead) for Scotland and by industrial sector
Scotland-wide
National Atmospheric Emissions Inventory
EB2
Improvements to water quality across types in Scotland
Regeneration of vacant / derelict urban land (% of which is regenerated through environmental restoration, for climate adaptation and by net zero initiatives)
Carbon and social footprint of materials used for net zero developments in Scotland
Interim proxy: Carbon Intensity of Materials (Circular Economy Strategy (2026) (Scottish Government, 2026d): indicates whether a nation is consuming more sustainable alternatives, independent of trends in overall GHG impact.
Scotland-wide
Data not available. Developers increasingly conduct project lifecycle assessments during the planning process. This may be a starting point for data collection.
Table 7: Environment and Biodiversity outcome for the JT M&E framework.
Monitoring local transitions: hotspot indicators and anticipating risk
In parallel to monitoring indicators for the four, high-level JT outcomes for Scotland, the proposed framework includes a focus on key locations identified as ‘sites of transition’, or transition ‘hotspots’. This is grounded in the inherently spatial nature of (in)justice (Bouzarovski and Simcock, 2017) and the recognised importance of contextualised, placed-based approaches to transitions (e.g., Jenkins et al. 2025; Shapovalova et al. 2023). The hotspots approach integrates attention to specific places experiencing change because of or influenced by[9] the net zero transition.
The definition of ‘hotspots’ as used throughout this report is as follows:
Places reliant on a high-emitting industry and undergoing industrial change
Places hosting net zero developments and their aggregated impacts
Some hotspots are already known, while others will need to be identified and may become hotspots over time. Examples of identified hotspots include Aberdeen City, Aberdeenshire and Grangemouth in Falkirk from the perspective of industrial change. Shetland, Dumfries and Galloway or Caithness in the Highland Council are examples of hotspots hosting significant net zero developments (e.g. Voar, 2024; Equitable Energy, 2025; Mountain, 2024; Just Transition Commission, 2025). Two additional hotspot criteria have been identified but remain underdeveloped in this report: (i) places of legacy unjust transitions and aggregated effects and (ii) places facing high levels of climate change risk.
Alongside the importance of place-based transition monitoring, there is growing attention to the need for future-facing, anticipatory approaches to justice (e.g. Santos Ayllón et al. 2025; Trueworthy et al. 2024; Rodhouse et al. 2024). This was also mentioned by stakeholders during the workshop, with reference, for instance, to the known closure of Petroineos oil refinery operations at Grangemouth and a perceived failure to act in a timely fashion. The need for anticipatory, or “early warning” indicators and approaches to JT has also been emphasised in letters and consultation responses to the Draft CCP (2025) (e.g., Just Transition Commission, 2026b).
It is intended that anticipatory approaches to hotspot identification and monitoring as part of JT M&E can help mitigate risks of injustice – and pursue opportunities for more just outcomes – before transitions are locked in (Santos Ayllón et al. 2025).
The hotspot approach developed for this framework draws on existing work on place-based JT M&E. It presents an approach to monitoring place-specific sites of transition and proposes methodologies to anticipate potential transitions. In this vein, sections 3.3.1 and 3.3.2 set out approaches for hotspot identification, not monitoring. These approaches are exploratory and untested in practice and require further analytical development and pilot application. They were informed by support from Scottish Government analysts and by insight from stakeholders such as the Scottish Trade Union Congress (STUC).
Section 3.3.3 details the hotspot monitoring approach and a set of indicators. These indicators are proposed to monitor readily identified hotspots or known sites of transition. The development of the hotspots approach and hotspot indicators integrates place-based JT M&E within the proposed national JT M&E framework for Scotland.
Throughout these sections, this report reiterates the value of formalised and regular stakeholder engagement. Direct engagement with project developers, employers, planning authorities, local councils and sector-specific institutions will be invaluable to understand ongoing transition plans and decisions. This may be one of the most fruitful methods for anticipating potential transitions overall.
Identifying potential hotspots of industrial change
Locating potential industrial transition hotspots will involve identifying places hosting the types of industries which the low carbon economy is expected to move away from. These may include specific sectoral activities (e.g., oil and gas production or domestic vehicle combustion engine construction) and high emitting industrial sites which can be expected to undergo some form of decarbonisation over time.
To identify potential areas of industrial change using available data, the Scottish Government could pre-select a group of high-emitting sectors (e.g., heavy industry, manufacturing, energy, construction, or transport) using UK SIC code classifications. Although SIC code classifications do not precisely match distinctions between emitting and low-carbon activity, industry statistics by SIC code can be broken down to granular sector levels and small-scale geographies across Scotland.
A variety of statistical approaches could be then used to identify potential hotspots in relation to pre-identified sectors. ‘Location quotients’, for example, show the proportion of total employment in a place from a particular industry, compared to the national share. This can show sectors of dependency (or strength) for different local authority areas and at smaller scales. Location quotient data shows Aberdeen City as having a high location quotient in ‘mining and quarrying’ (SIC sector B) of 12.7, and Aberdeenshire of 3.2. This means that the proportion of jobs in ‘mining and quarrying’ in Aberdeen City and Aberdeenshire are 12.7- and 3.2-times the Scotland-wide share respectively (where 0.98% of Scottish jobs are in ‘mining and quarrying’)[10]. The data is sourced from the Business Register and Employment Survey and is available via NOMIS, and used by the Scottish Government, for example, in the Industry Statistics Database.
The Scottish Government could also identify key locations of industrial activity in identified sectors (determined according to SIC codes) based on the following indicators: (i) number of employees and (ii) proportion of employment in the local area dependent on these industries. Data for these measures is available in the Scottish Government’s industry statistics (Scottish Government, n.d.). This proposal takes a slightly different approach to location quotients by recognising the relative importance of industries in places, regardless of their proportional comparison to the rest of Scotland. If a given location is particularly dependent on an industry relative to its local employment levels and economic scale, then a change in this industry could have a significant impact locally (even if the facility is relatively small compared to the Scotland-wide sectoral workforce). Possible geographical scale for these analyses (as advised by analysts in the industry statistics area in government) include, for example, ‘travel to work’ areas, which are based on commuting patterns. Some of these are larger than local authorities, while others are smaller and based around specific towns. The Scottish Government could also use data on ‘anchor firms’ as the largest place-based employers across Scotland to further support hotspot identification.
A sector-based approach could also support the identification of potential net zero ‘growth’ areas, again, using tools such as location quotients or proportion of employment in a local area. The pre-selection of opportunity net zero sectors could be based on existing government strategies and analysis (e.g., the National Strategy for Economic Transformation (2022) and the Green Industrial Strategy (2024)). This will also be conditioned to some extent by available SIC code breakdowns. The current review of SIC code classifications (UK Government, 2026) may enable improved analyses of net zero sectors in the future. There could be overlap between industrial change hotspots and growth areas.
In parallel to sector-based analyses, the Scottish Government could use data sources like the Scottish Environment Protection Agency’s (SEPA) Scottish Pollutant Release Inventory (SPRI), to identify the most emitting industrial sites across Scotland (SEPA, n.d.). This dataset is annually updated and includes an extensive list of pollutants, including key greenhouse gases such as carbon dioxide and methane. As an example, journalist investigations have previously used this data to identify what authors labelled “Scotland’s top 20 climate polluters” with a focus on carbon dioxide emissions (Edwards and Dobson, 2022). The authors identified the single most polluting sites (e.g., SSE’s gas-fired plant at Peterhead) and the most polluting companies (e.g., Ineos). A cement works plant, waste incinerators, a glass manufacturing plant and a whisky distillery were also in the ‘top 20’, highlighting potential transition sites outside of the known industrial transition sectors. This proposal is inspired by similar analyses shared by STUC.
There may also be value in using the regularly updated data and maps from the North Sea Transition Authority (NSTA). NSTA datasets include regularly updated, long term decommissioning plans by well (North Sea Transition Authority, n.d.). Alongside these, the Scottish Government’s Marine Directorate produces spatially mapped data of onshore and offshore oil and gas infrastructure (e.g., MarineScotland, 2020). A spatial, infrastructure-based approach hyper-localises the identification of potential sites of transition and may also support identification of key employers and operators across sites and wells. Additional analysis of the Marine Directorate and NSTA data to identify field names, operators and their employee base could provide further insight into oil and gas transitions more broadly. This project has identified this as a critical area requiring new data collection for JT monitoring.
Identifying potential net zero development hotspots
Scholarships focused on energy, justice and JT have demonstrated the potential negative implications of net zero developments in the places where they are deployed (e.g., Mejía-Montero, 2025; Kalt et al. 2023; Healy et al. 2019). As such, the Scottish Government should also anticipate potential sites of net zero development. This includes both the deployment of renewable energy and related infrastructure (e.g., transmission lines, subsea cables, power stations, and green hydrogen production plants). It also includes sites of land use change like woodland creation and peatland restoration (e.g., for carbon offsetting purposes).
In the case of renewable energy and adjacent energy infrastructure developments, the most comprehensive data source identified is the UK Renewable Energy Planning Database. This is updated multiple times a year (UK Government, n.d.). It tracks the progress of UK renewable electricity projects over 150kW (onshore and offshore) through the planning system across technology types[11]. This data is available in spreadsheet format and as an interactive map, and projects can be filtered by development stages (UK Government, n.d.). The Scottish Government could filter by projects at inception and planning stages as a starting point for anticipatory JT analysis of potential developments.
There is extensive research regarding the justice implications of energy. Data collection associated with renewable energy benefits and ownership distribution is already underway by the Scottish Government. In contrast, this project identifies natural capital projects resulting in land use change for net zero as an important and underexplored area from a JT perspective. The Scottish Crofting Federation, for example, voiced a clear concern regarding land purchase and accumulation through natural capital development opportunities. Conversations across natural capital and Woodland Carbon Code (WCC) areas of government recognised existing concerns about land ownership concentration and the establishment of ‘green lairds’ (McMorran et al. 2022) yet also suggested that ownership concentration is not happening to date. This contrast in stakeholder perspectives demonstrates the relevance of this arena for further research, data collection and anticipatory hotspot attention.
Stakeholder engagement during this project shed light on the limited data available in relation to natural capital projects and their impacts from a JT perspective. Existing data includes publicly available lists of projects registered with WCC and Peatland Code (PC) (Woodland Carbon Code, n.d., Peatland Code, n.d.). In addition, Peatland Action hold and map data regarding completed and in-progress peatland restoration across Scotland (NatureScot, n.d.). Their map includes data on conducted ‘feasibility studies’ which can show sites of future restoration (however, these areas will not necessarily see the development of peatland restoration projects). A similar map was not identified for woodland creation projects. Like energy developments, land use change projects need to obtain consent (e.g., Scottish Forestry, 2025). The Scottish Government could explore avenues to access planning applications for woodland creation and peatland restoration as a step towards understanding planned landscape change for net zero and climate resilience.
Net zero developments are happening at a fast pace and across all of Scotland. This project proposes that the Scottish Government visually map and regularly update related data to enable a more comprehensive understanding of (i) the degree of change across different areas in Scotland and (ii) aggregated effects in a single place. Additional criteria to inform identification of potential hotspots facing net zero developments are (i) considerations of project scale and expected impact and (iii) the local context. This is applicable to both energy and land use change hotspots.
Hotspot indicators
The following section sets out the list of 23 indicators recommended for monitoring hotspots. Various indicators for hotspot JT M&E were selected from the four outcomes in the full M&E framework. Alongside these, additional indicators were identified which provide relevant information regarding transition processes in specific contexts. The selection of indicators was also informed directly by the dual hotspot definition above.
There are known and predicted similarities in the concerns created by specific transition impacts. In the case of industrial change, for example, concerns include worker participation in decision-making processes, unemployment and worker mobility, reskilling, socio-economic wellbeing of the local community, local identity and cohesion and levels of deprivation (e.g., Mayer, 2018; International Labour Organisation, 2015; Walsh et al. 2016; Santos Ayllón and Jenkins, 2023; Shapovalova et al. 2023; Jenkins et al. 2025). For places hosting net zero developments, concerns include transparency and participation in decision-making, stakeholder recognition and decision-making power hierarchies, impacts on identity and place attachment, the distribution of socio-economic impacts and risks of extractivism (Jenkins et al. 2016; Shejale et al. 2025; Raymond et al. 2023; Kalt et al. 2023; Healy et al. 2019; Morrissey, 2023).
Known and predicted concerns informed both the definition of hotspots and the selection of hotspot indicators. As an example, industrial change hotspot indicators include workforce experiences and local economy fluctuations. They also include indicators monitoring alcohol and drug use hospitalisations. While not directly connected to net zero activity, the latter serve as early warning measures of deprivation. Their inclusion draws on Shapovalova et al. (2023) and on the SIMD. Given the SIMD is produced every four to five years, they provide advanced insight into deprivation (SIMD, 2020).
The selection of indicators is further informed by the fact that hotspots directly experiencing industrial or net zero transition impacts (e.g., from the closure of an industrial plant or the deployment of transmission lines), are also impacted by broader transition dynamics captured across the four JT outcomes. In this way, place-specific transitions are layered upon broader JT issues, such as fuel costs, transport accessibility, fair work or participatory capacity in net zero policy-making processes.
Hotspot indicators are proposed as a useful starting point and guide for monitoring hotspot areas. They are not a blanket approach that will apply equally in every site of transition or consistently through time. While hotspots may share characteristics regarding the types of transition underway (e.g. industrial change or decline), each will be unique. Indicators may illustrate similar trends for different hotspots, but this will not necessarily demonstrate that the same transitions are occurring, nor similarities in their just-ness.
Attention should be given to unique, place-based realities including through complementary analytical tools such as the SIMD, existing climate change risk maps and data (e.g., SEPA, 2025; Climate Just, n.d.) and qualitative engagement with stakeholders. This follows recommendations in Jenkins et al. (2025) regarding the importance of bespoke approaches and indicators grounded in the most relevant concerns per place. For the purposes of national-level implementation and taking a national perspective, this report provides a set of indicators as a starting point for hotspot JT monitoring. Table 8 provides an overview of hotspot indicators and their data source. Appendix G provides further detail on hotspot indicators including their desired trend and rationale.
H
Indicator (monitored by selected Local Authority)
Industrial change
Net Zero developments
Data source
H1
Employment rate for people aged 16-64 across Scotland
Number of people in Modern Apprenticeships reporting that (i) their apprenticeship is in ‘green skills’/for the net zero economy’ during, 3-month and 15 months after finishing their apprenticeship and of these, (ii) number of people staying to work in their same Local authority
Sectoral share of GVA (those increasing and in decline)
Employment Share by Sector (Regional Sector Share) (to monitor changing employment across sectors in the local economy; those increasing and in decline).
Location quotients (importance of a sector to a region relative to the national average)
Contextualised within broader economic trends per local authority
Operational capacity of community and locally owned energy installations in Scotland. Include a breakdown (i) by type of ownership (ii) by location and (iii) as a proportion of total renewable energy installed in local area
Proportion of people who agree that the transition to net zero and climate resilience will support a more positive future for young people and future generations in Scotland
x
(Every 3 yrs)
x
(Every 3 yrs)
Scottish Climate Survey (proposed addition from Autumn 2026)
H21
Proportion of people in Scotland reporting satisfaction with opportunities to influence (i) the Scottish Government’s approach to delivering net zero, and (ii) local policy and planning decisions relating to net zero
x
(Every 3 yrs)
Scottish Climate Survey (proposed addition from Autumn 2026)
H22
Proportion of people in Scotland reporting satisfaction with opportunities to influence net zero and climate adaptation developments happening in their local area
x
(Every 3 yrs)
x
(Every 3 yrs)
Scottish Climate Survey (proposed addition from Autumn 2026)
H23
The proportion of people reporting that changes to their local place due to net zero infrastructure and/or land use change have maintained or improved the quality of their local area
x
(Every 3 yrs)
Scottish Climate Survey (proposed addition from Autumn 2026)
Table 8: Hotspot indicators, by hotspot ‘type’ and data source.
All hotspot indicators share two characteristics: they are all available at local authority level and data is updated on an annual basis (except for the Scottish Climate Survey and fuel poverty data, for which local authority data is available every 3 years). The local authority level is the smallest area for which data is available across all identified indicators. This allows comparability. This scale is also recognised as a limitation to the hotspots approach, given transition impacts may be contained to smaller local areas within local authorities. Highland Council data will not necessarily reflect realities of wind farm and transmission line installations in Caithness, for example, and centralised Orkney Islands level data may be insufficient to understand the just-ness of transitions underway on individual islands within the archipelago.
Annual data collection for most indicators is common and is the most frequent data update period (with some exceptions e.g., labour market trends, which are updated monthly). Given that hotspots are already undergoing transformational change, regular, timely monitoring is critical to understand the implications of the transition. Annual indicators could also serve as early warning indicators for hotspot locations over time. At the same time, this annual updating cycle is recognised as a limitation, given that data will never be available in real time. The limitations of the hotspots approach are returned to in Section 4.
Hotspot indicator monitoring should incorporate regular stakeholder engagement. This will be necessary to better understand both (i) where impacts are localised within each local authority and (ii) to obtain regular, near real time updates while indicator data is unavailable. Regular engagement will also triangulate monitoring with qualitative lived-experience data. The role of stakeholder engagement in JT M&E is expanded on in Section 3.5. A key recommendation for Scottish Government is the further development of effective approaches to engagement as a qualitative monitoring tool.
Interpreting indicators
The sections above have presented a set of proposed indicators across four JT outcomes, a selection of ‘summary indicators’ for these, and an additional set of hotspot indicators. Together, these indicators make up the core for monitoring a JT at a Scotland-wide level and for specific sites of transition in Scotland. The indicators are selected based on their relevance and representativeness of the outcomes and hotspots they relate to, alongside data availability.
The identified indicators are partial. Together, they support an understanding of progress towards JT outcomes, yet they are unable to capture every dimension, nuance and implication of the transition from a JT perspective. The transition itself is underway within a broader landscape of social, economic and planetary change, at local, national and international scales. For improved understanding of the just-ness of the transition, the indicators should be interpreted (i) as interrelated features of a JT within the framework, and (ii) in relation to broader contextual trends. This section addresses each of these points in turn.
Interpreting outcome and hotspots indicators
A JT to net zero and climate resilience is a dynamic, multi-layered process. As an example, an individual may face issues of transport affordability due to the shift towards electric vehicles, gain health benefits from reduced air pollution and be employed in peatland restoration while feeling disenfranchised from decisions about the installation of wind turbines near their home. This understanding of the JT was foundational to the conceptualisation of the proposed JT M&E framework.
A multi-layered and dynamic M&E framework was deemed too unwieldy for feasible implementation. As such, the core of the proposed framework is structured according to a linear logic in which high-level outcomes are monitored by a set of indicators, each with an individual desirable trend. If every indicator in the Communities and Places outcome is progressing in the desired direction, then the Scottish Government could interpret this as progress towards this JT outcome.
A review of individual indicator trends alone, however, is insufficient to assess the just-ness of the transition and may obscure experiences of injustice. As an example, an increasing trend in community energy ownership may not show differences in access to community energy ownership opportunities. These considerations also apply to interactions across indicators, and across outcomes too. Increasing community land ownership, for example, is deemed positive from the perspective of community empowerment and access to net zero opportunities. Yet changes in land ownership could also have negative distributional impacts on people previously employed on the land. The increase in marine protected areas is deemed desirable from the perspective of the Environment and Biodiversity outcome yet may also create additional pressures on fishers and coastal communities in relation to the Communities and Places outcome. Critical inquiry into the indicators, what they do not show and how they relate to each other will improve assessment of JT progress. This critical attention draws from methods developed by the field of responsible research and innovation (e.g., Stilgoe et al. 2013) and has also been proposed in anticipatory justice approaches (e.g., Santos Ayllón et al. 2025). It should be complemented with qualitative, stakeholder engagement, returned to in Section 3.5.
The hotspots approach is designed to capture the multi-layered, cross-cutting nature of the JT more effectively. This is made possible by the narrower scope offered by the hotspots approach. Thus, while hotspot indicators have an indicative desired trend (see Appendix G), they should be interpreted in their local context and, to the extent possible, in relation to each other.
Interpreting indicators against contextual trends
Indicator trends can provide the Scottish Government with an overview of progress towards (or away from) a set of desired outcomes. However, these indicators should be interpreted (i) in the context of climate change mitigation and adaptation actions and (ii) as part of a wider socio-economic landscape. The importance of interpreting indicators within context was emphasised by NatureScot team members, alongside Scottish Government analysts in the industry statistics area. The importance of context to understand quantitative indicators is also clear in Shapovalova et al.’s (2023) narrative interpretation of indicators for a JT in Aberdeen and Aberdeenshire. Contextual interpretation recognises the unpredictability of climate impacts and responses to these, and the ways in which wider trends can impact the ongoing transition (e.g., ICAT, 2024).
This report proposes an initial set of trends which can support the interpretation of monitored indicators. The first two relate to climate change mitigation and adaptation, followed by broader socio-economic trends:
Greenhouse gas emissions in Scotland: To assess a JT in the context of progress towards climate change mitigation. Greenhouse gas emissions are reported on annually in the CCP (2026) with a time lag of circa two years.
Climate risk (and adaptation) in Scotland: To assess a JT in the context of changing climate risk. A comprehensive assessment of climate change risk for Scotland is conducted every 5 years by the Climate Change Committee (CCC). Climate adaptation research and policy team members have used the CCC assessment to inform their M&E framework for SNAP3. The CCC presents a set of risks and evaluates these on a scale of high-medium-low. The recommendation is to use this (the number and type of risks per category) as a baseline for climate risk and adaptation (e.g., Climate Change Committee, 2021).
Land ownership concentration in Scotland: To assess a JT to net zero and climate resilience in the context of evolving land ownership trends in Scotland. Changes in land ownership and land use could have a variety of impacts including potential job losses, landscape change and new distributions of benefits and harms. Land ownership was recognised by stakeholders as key to accessing opportunities from net zero and climate resilience. While data is currently unavailable to monitor land concentration trends, the annual Rural Land Market insights report by the Scottish Land Commission can provide a high-level overview of trends (Scottish Land Commission, 2025). This can be supplemented with insight from relevant Scottish Government teams and stakeholders like Community Land Scotland and the Scottish Land Commission.
Economic trends in Scotland: To assess a JT to net zero and climate resilience in the context of the health and resilience of the Scottish economy at any given point in time. This can include particular attention to sectoral composition by % of GVA, to support high-level analyses of the direction of the economic transition. Economic statistics are updated annually across Scottish Government. Business and industry surveys are regularly conducted with the least regular surveys taking place on an annual basis.
Poverty and inequality trends in Scotland: To assess a JT to net zero and climate resilience in the context of structural vulnerabilities and inequity. Relative and absolute poverty statistics, along with GINI coefficient and Palma ratio analyses of inequality are updated annually by Scottish Government.
Global events: To assess a JT to net zero and climate resilience in the context of global affairs, including geopolitical shocks, economic crises, pandemics or accelerating commitments to climate action. Scotland is part of an interconnected economic, institutional and ecological global landscape. Developments in this landscape will undoubtedly impact on – and could be impacted by – Scotland’s progress towards a JT.
These trends are relevant for JT indicator interpretation across the four outcomes and hotspots[12]. Falling fuel poverty and increasing transport affordability indicate positive advances to address fuel and transport inequities. However, in a context of increasing greenhouse gas emissions these would not necessarily be associated with a net zero transition. A continued increase in poverty levels in a context of falling greenhouse gas emissions and increasing low carbon jobs and economic activity (JSEO1, JSEO4) may signal failings in securing JT objectives. Geopolitical shocks (such as the coronavirus pandemic, Russia’s invasion of Ukraine in 2022, or USA and Israel strikes on Iran in 2026) can impact fuel prices and the cost of living, change government policy priorities and affect public concerns. Analysis of indicators in relation to global affairs can thus support improved interpretation of indicator trends and any sudden shifts these may present.
Stakeholder engagement
The proposed framework is grounded in an underpinning commitment to formalised, regular stakeholder engagement. This is seen as fundamental to supporting JT monitoring. Workshop participants emphasised the value of stakeholder engagement and stakeholder participation both for JT delivery, and specifically to support JT M&E. They explained that building trusted and regular networks with key stakeholders could support data collection, fill data gaps, and improve communication about the transition. This focus on engagement also echoes Mechanism 3 in Drabble et al. (2024, p.47), which identified ‘stakeholder participation in Just Transition decision making’ as one of the conditions for JT success.
Stakeholder engagement is envisaged to enable qualitative data collection for relevant indicators and as a supplement to quantitative data. It is also deemed crucial for indicator interpretation, both to triangulate and contextualise indicators with experience on the ground. Importantly, stakeholder engagement can also provide insight into transition impacts before indicator data is available. Finally, engaging with key stakeholders is also suggested as an anticipatory tool for the Scottish Government to identify potential future hotspots.
Stakeholder engagement can provide granularity, nuance and qualitative case studies grounded in lived experiences of the transition. This can improve understanding of what is and is not captured by indicators, and therefore the multiple implications of the transition. As examples, a Poverty Alliance team member referred to instances in which heat pump installations in social housing had resulted in inhabitants falling into energy debt. During the workshop, a representative from CEMVO explained the difficulties often faced by ethnic minorities in accessing opportunities such as the Community and Renewable Energy Scheme (CARES) funding. Fuel poverty and community energy ownership indicators in the framework (PE3 and CP7) do not reflect these risks and inequalities relating to heat pumps and renewable energy. While indicator data does not capture these experiences, qualitative feedback can.
Some indicators in the framework suggest a combination of quantitative and qualitative data, the latter collected as ad hoc stakeholder insight or case studies. Examples include CP3 on community groups involved in climate and sustainability related activities. Climate Action Hub teams can provide qualitative insight into where community-led action is particularly strong. Conversely, this engagement can also show where it is struggling to take off and offer reasons why. Organisations like the Scottish Community Development Centre and the Scottish Communities Climate Action Network can provide further insight into community-led climate action. Recommendations for stakeholder engagement in indicator JSEO16 (on workforce participation) was informed by a discussion with STUC. This shed light on the legal and practical barriers to worker-involved transitions in high emitting industries.
Some indicators in the framework are fully qualitative. One example is CP9, which monitors engagement experiences of the fishing sector with offshore energy developments. Fishing was discussed not only as an economic activity but a way of life, with strong impact on coastal and island local economies and identities (as explained by the Regional Inshore Fisheries Group and Scottish Government team members). The Regional Inshore Fisheries Group reflected on power and resource hierarchies between offshore energy developers and the fishing sector, and on the different types of fishing and potential diverse impacts. Questions of sectoral coexistence, decline and change in the offshore economy are too complex to be captured in a single data point. Engagement with key stakeholder groups directly involved is therefore key.
The Scottish Government can explore different forms of engagement for JT M&E. These may range from individual meetings to establishing a regular stakeholder forum. There may be opportunities for the Scottish Government to complement these efforts with JTC support, which is to be renewed in 2026 (Scottish Government, 2025f). From the perspective of national JT M&E, the Scottish Government already has extensive knowledge and networks with stakeholder groups and organisations across many JT areas of concern. Internal and external stakeholders engaged with throughout this project are also deemed valuable contact points.
Alongside sector-specific stakeholders, and for national JT monitoring, the Scottish Government can engage with Scottish Government teams working on related Scotland-wide monitoring (e.g., the National Performance Framework or the Wellbeing Economy Monitor) to support contextualisation of indicators into Scotland-wide trends. In addition, the Scottish Government could explore existing connections to local authorities to contrast national-level JT monitoring with local concerns. Stakeholders such as the Convention of Scottish Local Authorities (COSLA) and the Scottish Climate Intelligence Service offer potential to connect nationwide JT monitoring to more local priorities. Local authorities could provide qualitative input to complement indicator monitoring, for example, and could report back on which indicators reflect local priorities at a given point in time.
In the case of hotspots monitoring, the Government could establish regular communication and feedback loops with a bespoke set of stakeholders on the ground. This may include local authority representatives, developers, employers, trade unions and local third sector organisations. Such arrangements could also be used as an anticipatory tool to identify future hotspots facing industrial and net zero change. In addition, existing partnerships and stakeholder networks including the eight Regional Economic Partnerships, for example, or the Sub-Scotland Economic Statistics Group, may be useful to support hotspot indicator interpretation.
While this section has focused on engagement with institutional stakeholders, this does not preclude engagement with individuals directly exposed to and experiencing transition impacts. In some cases, this could be the most direct way to access, listen to and integrate lived experience (e.g., Jenkins et al. 2025). Research into justice in energy transitions has explored the role of intermediaries in translating lived experiences such as of fuel poverty, including both their value and potential risks (e.g., Lacey-Barnacle and Bird, 2018; Santos Ayllón and Jenkins, 2023). This section recommends engagement with institutional stakeholders first for reasons of feasibility, and to ease potential burdens on directly affected groups.
Engagement with individuals experiencing transitions may in some cases be necessary to better understand and evaluate transition impacts. Where needed, the Scottish Government should build in opportunities for ad hoc qualitative research and engagement. The Scottish Government may also explore possible avenues for more formalised engagement approaches to reach lived experience, including through participatory citizens assemblies or ‘experts by experience’ panels (e.g., Elstub et al. 2022; Poverty and Inequality Commission, 2023).
Limitations and reflections
The proposed JT M&E framework has several limitations. Some of these relate to the practicalities of framework implementation, and others to the specific constraints affecting this project. Some limitations reflect the complexity of monitoring a JT itself.
Data availability, temporality and scale
Data availability has played an important role in the final shape of the proposed M&E framework. Broadly speaking, core areas of JT concern are included in the framework across outcomes and hotspot indicator lists. However, for many of these indicators, the data available is partial. For example, ‘adults within 5-minute walking distance of greenspace’ does not provide information on the quality or accessibility of this space. In addition, data for all indicators in the framework is retrospective. While many indicators in the framework are available on an annual basis, others are only available every two or three years. The current lack of real time data is arguably a limitation of any M&E framework aiming to monitor and assess a JT in Scotland.
More broadly, data limitations relate to their collection and categorisation parameters. Two clear examples are industrial classifications by SIC codes or the geographies of data collection, which do not necessarily match geographies of transition. This is particularly key in the case of hotspots. Although data is available at local authority levels, sites of transition often sit within local authorities. Transition dynamics may not necessarily be captured by local authority level data. As discussed in Section 3.5, close engagement with relevant stakeholders will be essential to better understand localised transitions. Engagement will provide as close to real-time data as possible and can triangulate and nuance indicator data. It may also be one of the most effective tools to anticipate future hotspots before transitions begin.
Finally, important data gaps remain. While the framework was developed with feasibility of implementation in mind, it also includes critical areas of JT concern for which both understanding and data is lacking. These gaps suggest areas for further research and data collection. These areas are summarised below:
Geographic and demographic breakdowns of low carbon and renewable energy jobs (often referred to as ‘green jobs’),
Education, training and skills development for the economy of the future (in ‘green’ jobs and more broadly),
Regular data collection on individuals’ sense of influence at smaller geographical scales (Scottish Climate Survey data is only available by local authority every 3 years),
Worker transitions, including the processes, distributional impacts and lived experience of workers in high-emitting sectors and on retraining pathways,
Exposure to climate change risk and the ability to access and adopt climate adaptation measures across people and places,
Climate change and net zero transition impacts on business, with attention to vulnerability, resilience and opportunities for different business types and scales. This includes direct attention to sole traders, who make up 71.9% of businesses in Scotland (Scottish Government, 2025g),
Implications, benefits and harms of land use change for natural capital projects,
Opportunities and risks relating to land ownership, access and distribution, with attention to stakeholders such as crofters, farmers and gamekeepers,
Land and coastal place-based identities and the implications of safeguarding or losing generational occupations and skills (e.g. crofting and fishing),
The spatial and demographic distribution of environmental degradation, pollution and hazardous sites across Scotland.
The list above relates to all indicators in the framework, including those with available data. For example, although there is an indicator focused on net zero skills development through apprenticeships, this is insufficient to capture the array of skilling and reskilling processes relating to net zero.
Alongside identified data gaps, stakeholder input spotlighted four key areas for further attention. These are not currently captured in the framework because they cut across various outcomes and are affected by extensive data gaps. The Scottish Government could explore (i) how these issues relate to JT delivery in Scotland and (ii) how they may be monitored and evaluated over time:
Distribution of responsibility, overconsumption and polluter pays considerations: Policy narratives often focus on distributing the benefits of the transition fairly and reducing the burden on disadvantaged households. However, less attention is given to responsibility, overconsumption and polluter pay considerations (at individual, business or industry levels). Participants in the workshop voiced concerns about how ‘climate policy is regressive’. Drabble et al. (2024, p.17) also briefly reflected on these considerations in their reference to ‘assessment of disproportionate benefits’. Most stakeholders engaged in this project and the evidence reviewed did not focus explicitly on issues of historical, international, intergenerational and intragenerational responsibility, often captured by the term ‘climate justice’ (e.g., Roser and Seidel, 2016). Overall, issues of distribution and responsibility are underexplored within a policy context in relation to JT and invite closer attention.
Intersections between food production systems, stakeholder power, food security, ecosystem and human health, and land use change: Interviews with NatureScot and the Scottish Crofting Federation pointed to the intersections between food production systems, power hierarchies and land use change in the transition to net zero. Concerns were also related to issues of food security, resilience and health. These insights invite further attention into how net zero and climate adaptation actions interact, if at all, with food production, food security and land use, and the risks and opportunities from the perspective of ensuring a JT.
Intersections between land prices, housing prices and availability and land use change in rural areas: The relevance of land ownership has been highlighted throughout, particularly in relation to distributional justice and access to net zero opportunities. The Scottish Crofting Federation also highlighted issues of land prices, housing prices and the ways in which land use change can affect these, particularly in rural and island areas. This may be directly affected by net zero and climate adaptation developments. In other cases, this may be adjacent to the transition underway and part of broader trends. Improved understanding of how land and house prices interact with the transition will support improved assessment of a JT.
Implications of human/nature relationships for the planetary crises and JT: There is growing attention to human-and-nature relationships from the perspective of justice, climate change, the energy transition and JT (e.g., Tafon et al. 2023; van Vugt et al. 2025; Tschakert et al. 2020; Stanley et al. 2025). This relates to beliefs, values and ethical systems, similarly to issues of justice (e.g., van Uffelen et al. 2024; Roser and Seidel, 2016). NatureScot interviewees emphasised the importance of assessing the JT within the current, exploitative relationship with nature (in industrial contexts) and its underlying causes. Disconnection from and domination over nature has also been recognised by the Intergovernmental Science-Policy Platform on Biodiversity and Ecosystem Services (IPBES) as an underlying cause of biodiversity loss and nature’s decline (IPBES, 2025, p. 28 Figure SPM.1). In the workshop, indicator discussions for the ‘Environment and Biodiversity’ outcome highlighted diverse perspectives on the role of ‘nature’ within a JT. This included questions about the ways in which the climate and biodiversity crises (also known as the twin-crises) are interlinked; and the implications of this for a JT in Scotland. Overall, the space for nature within understandings of a JT and within JT policy in Scotland is unclear and would benefit from further attention.
Framework structure, design and development
The proposed framework is broadly structured according to a linear logic: outcomes inform the development of indicators which in turn, serve to assess progress towards the outcome. This enables targeted consideration of key areas of concern, along with an opportunity to monitor a suite of indicators providing detail into specific outcomes. At the same time, a linear approach clusters and to some extent, siloes areas and indicators. Indicators captured under ‘People and Equity’ or ‘Environment and Biodiversity’ may also be relevant to monitor progress towards ‘Communities and Places’, for example, but are not easily interconnected in the framework. In contrast to outcomes, a cross-outcome use of indicators is proposed for hotspot monitoring. An example of a cross-cutting indicator approach to M&E is the National Wellbeing Framework for Wales, in which each indicator is relevant to more than one outcome (Welsh Government, 2022b).
Secondly, this framework is designed with in-built stakeholder engagement and qualitative analysis as two fundamental tools for its effective use and delivery. Qualitative approaches are often deemed resource intensive and challenging to implement in practice. Their effectiveness also depends on diverse stakeholders with their own interests and agendas. Emphasis on the role of qualitative approaches also partially moves away from many M&E frameworks that focus predominantly on monitoring quantitative indicator trends over time. Innovation into policy tools and approaches to engage in this feasibly and effectively is a recommendation for the Scottish Government going forward.
Constrained resources for this project resulted in the prioritisation of conceptualisation, outcome and indicator development for monitoring, with less attention to mechanism identification and evaluation proposals. The mechanisms are a key dimension of a full ToC and are important to support evaluation of why a JT is happening, and what actions have driven change (e.g., Drabble et al. 2024, p.42). They allow for “a deeper understanding of what is necessary, and what must be avoided for a ToC to successfully achieve its impact” (Dhillon and Vaca, 2018, p.70). It is recommended that the Scottish Government elaborate on the mechanisms presented by Drabble et al. (2024) to subsequently explore effective and feasible ways for mechanism monitoring. This will also enable more comprehensive evaluations of JT progress.
Finally, the framework has not been ‘tested’ in practice. While indicators have been researched, identified and in some cases, developed, a baseline of data collection has not been undertaken. This report recommends that the Scottish Government collate data across outcome indicators alongside example hotspots such as Aberdeen City or the Shetland Islands. In doing so, it is anticipated that some indicators may evolve, others may be removed and new ones added. This will enable refining of the outcomes and hotspots approach.
Reflections on the temporal nature of (just) transitions
The net zero and climate adaptation transitions, alongside climate change impacts themselves, are by nature fluid, uncertain, and spread over time. Plans such as SNAP3 (2024) and the CCP (2026) set out long term goals to 2045, in keeping with Scotland’s target to reach net zero emissions. This is also reflected in Drabble et al.’s (2024) conceptualisation of a JT ToC for Scotland.
The groups and locations vulnerable to climate change impacts and affected by transition risks and opportunities will change over time. In the case of hotspots, new locations will become focal sites of transition over the next 20 years. The long-term, live and uncertain nature of the transition has implications for any effort towards JT M&E. This requires that the framework be kept live as new issues emerge and new data becomes available. In addition, identifying and defining when sites of transition become hotspots and when their transitions ‘start’ and ‘end’, will be an important consideration for the effective implementation of this framework.
It is recommended that places identified as ‘hotspots’ with known imminent transitions (such as the closure of the Mossmorran chemical plant in Fife (e.g., BBC, 2026)) or those with transitions already underway are monitored as early on as possible. In the case of anticipated hotspots, this becomes a more challenging question relating to pre-empting transitions and the implications of doing so, given that there is no clear cut, pre-determined list of sites of decline or opportunity. Further research into anticipatory policymaking, risk mitigation and future-facing M&E could inform decision-making in this arena.
Reflections on defining the scope of JT
It is also worth reflecting on learnings from this project’s efforts to develop an M&E framework for a JT. Understandings of a JT vary widely. For the development of this M&E framework, this project has understood a JT to be the just-ness of the process and outcomes of the transition in response to climate change through ‘net zero’ and ‘climate adaptation’ in Scotland. Even within these boundaries, issues of JT concern are wide-ranging and incredibly complex. They are also not always comfortably attributable to climate change impacts nor transition actions alone. Instead, they are interwoven with broader local, national and global political, economic and ecological networks, changes and shocks.
The value of tools such as M&E frameworks for a JT should be understood in the messy context of delimiting the scope of JT. Although M&E frameworks will struggle to capture every single aspect and lived experience relating to a JT, they can inform policymaker and societal understanding. They can provide insight into the ways in which the net zero transition and climate adaptation are unfolding and their just-ness. They can also inform interventions and importantly, hold actors in roles of influence and responsibility to account, including the Scottish Government.
Conclusion and recommendations
This project has developed an M&E framework for a JT to a net zero and climate resilient Scotland. The proposed framework supports monitoring of a JT for Scotland as a whole, while integrating attention to specific regions, places and to vulnerable and affected groups. The body of this framework is made up of quantitative indicators alongside recommendations for the development of qualitative indicators. It also integrates qualitative engagement, analysis and interpretation as necessary tools for effective JT M&E.
The proposed framework also builds in a place-based, hotspots monitoring approach. This recognises that specific places will be directly and significantly affected by processes of industrial change and net zero developments. Through the development of the hotspots approach, this framework also presents the future-facing potential of M&E in a JT context, to anticipate and inform transitions towards more just outcomes while mitigating risks (e.g., Santos Ayllón et al. 2025).
This framework is developed within severe constraints on data availability. It offers a step forward towards what is pragmatically possible now. The Scottish Government should keep the framework live and adaptable as the transition unfolds.
The next step is to test the proposed approach through data collection across outcome and hotspot indicators. This will assess how well the framework can be used in practice and its ability to capture JT concerns. In parallel, this report recommends that the Scottish Government develop a set of mechanisms and their monitoring along with approaches to JT evaluation. The identification and development of qualitative engagement tools and analytical approaches for risk mitigation, indicator interpretation and JT evaluation is also encouraged.
Based on stakeholder input and learnings throughout this project, the report closes with a set of key recommendations to Scottish Government for effective M&E of a JT in Scotland:
Start now: The urgency of understanding transition impacts is clearly felt by stakeholders and within government. The inclusion of JT indicators within the CCP (2026) recognises the centrality of a JT to climate action. In this vein, the Scottish Government should begin to systematically monitor, evaluate and report on progress towards a JT. Implementation of existing (albeit imperfect) frameworks and iterative learning is the next step.
Data collation and sharing avenues within and beyond government: Data collection and collation in databases, dashboards and reports is underway across teams and directorates in Scottish Government. There is an opportunity to develop cross-team mechanisms to collect and collate this data. There is also an opportunity to put the necessary infrastructure in place for data sharing by non-governmental actors (and to require this, where relevant) with the Scottish Government, to begin to fill data gaps.
Fill key data gaps with new data collection: Arguably, one of the most pressing data gaps relates to experiences and outcomes of the transitioning workforce in high-emitting sectors. Additional data gaps which require further research from a JT perspective include (i) land use change from natural capital projects, (ii) business vulnerability to climate change and net zero transitions, and (iii) vulnerability to climate impacts and access to adaptation solutions.
Governance, responsibilities and policy responsiveness: M&E frameworks in other areas of government (such as for SNAP3 (2024) or the Biodiversity Strategy (2024)) have developed governance structures for M&E delivery. It is recommended that the Scottish Government explore questions of JT governance and responsibility, including for JT M&E. This may increase attention and accountability of JT delivery. Relatedly, attention to what bounds JT interventions from a Scottish policy perspective can also support efforts towards governance and attribution analyses, alongside mechanism identification.
Trial anticipatory approaches to JT M&E: The Scottish Government can use M&E to support proactive JT planning in ways which mitigate risks and pursue opportunities for more just outcomes, particularly in place-specific contexts. The Scottish Government should also identify available tools for policy responsiveness to insights from anticipatory analyses and JT M&E across outcomes and hotspots more broadly.
Investigate qualitative tools and approaches for M&E: Despite the widespread use of quantitative data for M&E, this project has highlighted the key role of regular stakeholder input, qualitative data and analyses for effective JT M&E. Further development of qualitative engagement tools and analytical approaches is a key recommendation both for indicator monitoring, interpretation and JT evaluation. The implementation of a qualitative-strong JT M&E approach will also require the development and use of strategic analysis capabilities to interpret and evaluate progress towards a JT.
Use M&E to communicate about the JT and about the transition more broadly: There is value in using JT M&E as a tool for improved communication about climate change, climate action and the impacts of net zero and adaptation. This gains relevance in a political context that is shifting towards anti-climate change and net zero narratives. Monitoring JT indicators and communicating these in relation to net zero and climate adaptation (through dashboards, reports or other tools) is identified as a key avenue for dissemination.
Identify tools for data management and communication: The breadth and multi-dimensional nature of JT invite the development of digital visualisation tools. These might include websites or dashboards for ease of monitoring, reporting and broader communication purposes. It is also possible to use programmes like Excel to organise data and begin monitoring. This will enable framework implementation in the short-term with readily available tools. It is recommended that transparent internal and external reporting is prioritised.
Brunt, A., Spooner, D., (1998) ‘The development of wind power in Denmark and the UK’ Energy & Environment, 9(2), pp. 279-296. Available at: https://www.jstor.org/stable/44397481
Cambridge dictionary (n.d.) ‘Evaluation meaning’, Cambridge dictionary, [online]. Available at: EVALUATION | English meaning – Cambridge Dictionary https://dictionary.cambridge.org/dictionary/english/evaluation
Elstub, S., Escobar, O., Henderson, A., Thorne, T., Bland, N. & Bowes, E., (2022), ‘Research Report on the Citizens’ Assembly of Scotland’, Scottish Government Social Research, [online]. Available: https://www.gov.scot/isbn/9781802018943
Healy, N., Stephens, J. C., Malin, S. A. (2019) ‘Embodied energy injustices: Unveiling and politicizing the transboundary harms of fossil fuel extractivism and fossil fuel supply chains,’ Energy Research and Social Science, 48, pp. 219–234. Available at: https://doi.org/10.1016/j.erss.2018.09.016
Heyen, D. A., Beznea, A., Hünecke, K., Williams, R., (2021), ‘Measuring a Just Transition in the EU in the context of the 8th Environment Action Programme – An assessment of existing indicators and gaps at the socio-environmental nexus, with suggestions for the way forward,’ Oko-Insititute, e.V.,Trinomics. March, [online]. Available at: JustTransition_Indicator_Paper_final_clean-2021.pdf
Htitich, M., Krylová, P., Harmáček, J., (2024) ‘Just Transition Score: Measuring the relative sustainability of social progress,’ Environmental and Sustainability Indicators, 23(100440). Available at: https://doi.org/10.1016/j.indic.2024.100440
Initiative for Climate Action Transparency (ICAT), (2024) ‘Tracking Progress Towards a Just Transition A monitoring, evaluation and learning framework to guide justice-oriented, socially owned transition tracking in South Africa,’ Initiative for Climate Action Transparency, April, [online]. Available at: https://climateactiontransparency.org/wp-content/uploads/2025/01/D8.-JT-MEL-Framework-final.pdf
Intergovernmental Science-Policy Platform on Biodiversity and Ecosystem Services (IPBES), (2025), The IPBES Thematic Assessment Report on the Underlying Causes of Biodiversity Loss and the Determinants of Transformative Change and Options for Achieving The 2050 Vision for Biodiversity (Transformative Change Assessment), [online]. Available for download at: https://www.ipbes.net/transformative-change-assessment
Kaljonen, M., Paloviita, A., Huttunen, S., Kortetmäki, T., (2024) ‘Policy mixes for just transitions: A holistic evaluation framework,’ Environmental Innovation and Societal Transitions, 52(100885). Available at: https://doi.org/10.1016/j.eist.2024.100885
Kalt, T., Simon, J., Tunn, J., Hennig, J. (2023) ‘Between green extractivism and energy justice: competing strategies in South Africa’s hydrogen transition in the context of climate crisis’, Review of African Political Economy, 50(177-178), pp. 302–321. Available at: https://www.jstor.org/stable/48814433
Kelly, J. A., Clinch, P., Kelleher, L., Shahab, S., (2020) ‘Enabling a just transition: A composite indicator for assessing home-heating energy-poverty risk and the impact of environmental policy measures,’ Energy Policy, 146(111791). Available at: https://doi.org/10.1016/j.enpol.2020.111791
Lacey-Barnacle, M., Bird, C. M., (2018) ‘Intermediating energy justice? The role of intermediaries in the civic energy sector in a time of austerity,’ Applied Energy, 226, pp. 71-81. Available at: https://doi.org/10.1016/j.apenergy.2018.05.088
McCauley, D., Pettigrew, K.A., Heffron, R. J., Droubi, S., (2023) ‘Identifying, improving, and investing in national commitments to just transition: Reflections from Latin America and the Caribbean,’ Environmental and Sustainability Indicators, 17(100225). Available at: https://www.sciencedirect.com/science/article/pii/S2665972723000028?via%3Dihub
McMorran, R., Reed, M. S., Glass, J., Bauer, A., Glendinning, J., Macaulay, B., McKee, A., Peskett, L., Rothenberg, L., Rudman, H., Williams, A., (2022), ‘Large-scale land acquisition for carbon: opportunities and risks A SEFARI Special Advisory Group’, SEFARI, Scotland’s Rural College, [online]. Available at: https://sefari.scot/sites/default/files/documents/Final%20report%20v2.pdf
Mejía-Montero, A. (2025) ‘From “just” energy to energy justice? Imaginaries of fair wind power in the Isthmus of Tehuantepec, Mexico’, World Development, 195, p. 107135, pp. 1-11.
Minadakis, P.,Vega-Araújo, J. (2024) ‘Rethinking the social license to operate? A theoretical exploration of its synergies with social acceptance and energy justice for a just transition,’ Energy Research & Social Science, 113(103552), pp. 1-11. Available at: https://www.sciencedirect.com/science/article/abs/pii/S2214629624001439
Oliver, D., Solis, E., Lloyd, K., Heron, S., Lynn S., (2025) ‘Exploring a potential approach to understand and map the local level impacts and opportunities of a Just Transition to Net Zero’. Cardiff: Welsh Government, GSR report number 15/2025. 7 February, [online]. Available at: https://www.gov.wales/understanding-just-transition-approach
Raymond, C. M., Stedman, R., Frantzeskaki, N., (2023) ‘The role of nature-based solutions and senses of place in enabling just city transitions,’ Environmental Science & Policy, 114, pp. 10-19. Available at: https://www.sciencedirect.com/science/article/pii/S1462901123000540
Rodhouse, T.S.G.H., Cuppen, E., Correljé, A., Pesch, U., (2024) ‘A new carrier for old assumptions? Imagined publics and their justice implications for hydrogen development in the Netherlands’, Technological Forecasting & Social Change, 204, pp. 1–13. Available at: https://papers.ssrn.com/sol3/papers.cfm?abstract_id=4044540
Roser, D., Seidel, C., (2016) ‘Climate Justice: An Introduction,’ Oxon, UK: Routledge. E-book available online at: https://doi.org/10.4324/9781315617961
Santos Ayllón, L. M., Jenkins, K. E. H., (2023) ‘Energy justice, Just Transitions and Scottish energy policy: A re-grounding of theory in policy practice,’ Energy Research & Social Science, 96(102922). Available at: https://www.sciencedirect.com/science/article/pii/S221462962200425X
Shejale, S., Xinyu Zhan, M., Sahakian, M., Aleksieva, R., Biresselioglu, M. E., Bogdanova, V., Cardone, B., Epp, J., Kirchler, B., Kollmann, A., Liste, L., Massullo, C., Schibel, K-L. (2025) Participation as a pathway to procedural justice: A review of energy initiatives across eight European countries,’ Energy Research & Social Science, 122 (103982).Available at: https://doi.org/10.1016/j.erss.2025.103982
Shen, W., Srivastava, S., Yang, L., Jain, K., & Schröder, P. (2020). Understanding the impacts of outdoor air pollution on social inequality: advancing a just transition framework. Local Environment, 25(1), pp. 1–17. Available at: https://doi.org/10.1080/13549839.2019.1687431
Simeone, L., Drabble, D., Morelli, N., de Götzen, A., (eds.), 2023 Strategic Thinking, Design and the Theory of Change. Edward Elgar Publishing. Accessed online.
Smith, K., (2011) ‘The Danish wind industry 1980–2010: Lessons for the British marine energy industry,’ Underwater Technology, 30(1). Available at: https://doi.org/10.3723/ut.30.027
Stilgoe, J., Owen, R., Macnaghten, P., (2013) ‘Developing a framework for responsible innovation,’ Research Policy, 42(9) pp. 1568-1580. Available at: https://doi.org/10.1016/j.respol.2013.05.008
Sun, L., Liu, X., Hu, Z., Zhang, J., Ducruet, C., Zhang, W., (2024) ‘Does just transition increase social and environmental risks? Evidence from global port cities development,’ Environmental Impact Assessment Review, 105(107370). Available at: https://www.sciencedirect.com/science/article/abs/pii/S0195925523003360
Tafon, R., Saunders, F., Pikner, T., Gilek, M., (2023) ‘Multispecies blue justice and energy transition conflict: examining challenges and possibilities for synergy between low‑carbon energy and justice for humans and nonhuman nature,’ Maritime Studies, 22(45). Available at: https://doi.org/10.1007/s40152-023-00336-y
Transition Plan Taskforce (2024) ‘Putting People at the Heart of Transition Plans: key steps and metrics for issuers. An advisory paper from the TPT’s Just Transition Working Group,’ April, [online]. Available at: https://itpn.global/wp-content/uploads/2024/11/Just-Transition-1.pdf
Trueworthy, A., McCarrel, A., Wieliczkiewicz, J., Cellan, S., Peterson, W., Anderson, S., DuPont, B., Grear, M., (2024) ‘Who will be making wave energy? A community-driven design approach toward just and sustainable energy futures in Alaska’, Energy Research & Social Science. 115, pp.1–18. Available at: https://doi.org/10.1016/j.erss.2024.103615
Van Uffelen, N., Taebi, B., Pesch, U., (2024) ‘Revisiting the energy justice framework: Doing justice to normative uncertainties’, Renewable and Sustainable Energy Reviews, 189, Part A, 113974. Available at: https://www.sciencedirect.com/science/article/pii/S1364032123008328
van Vugt, J., de Ruiter, A., Henning, C., (2025), ‘Where to aim with multispecies climate justice? A critical realist account’, Environmental Politics. Available at: https://doi.org/10.1080/09644016.2025.2582121
The following tables detail (1) engagement with external (non-core Scottish Government) stakeholders through semi-structured and unstructured interviews and informal exchanges; (2) a list of workshop participants and (3) a descriptive list of areas across government that have engaged with and supported this work. Varying levels of detail on stakeholders reflect participant consents.
External stakeholders and public bodies
Method
NatureScot
Semi-structured interview
Poverty Alliance
Semi-structured interview
Scottish Trade Union Congress (STUC)
Semi-structured interview
Scottish Crofting Federation
Semi-structured interview
Community Land Scotland (shared project with Scottish Land Commission)
Unstructured interview
Just Transition Commission Secretariat
Unstructured interview
PhD researcher – qualitative framework development
Unstructured interview
Regional Inshore Fisheries Group
Unstructured interview
Sustainability impact consultant
Unstructured interview
Sustainability impact consultant
Unstructured interview
Scottish Climate Intelligence Service
Meeting and email exchange
Skills Development Scotland
Meeting and email exchange
Public Health Scotland
Meetings and written feedback
Academia – Just Transition M&E researchers
Meeting
IUCN UK Peatland Programme
Email exchanges
Scottish Environmental Protection Agency
Email exchanges
Table 1 (Appendix A): External stakeholder engagement list (by method and in alphabetical order)
Role
Organisation (in alphabetical order)
Environmental Projects Coordinator
CEMVO Scotland
ClimateXChange project lead
ClimateXChange
Culture/SHIFT programme manager
Culture for Climate Scotland
Director of Curriculum for STEM and Construction
Forth Valley College
Researcher
Heriot-Watt University
Just Transition Commissioner, Scotland Director for Business in the Community
Just Transition Commission
Secretary
Just Transition Partnership
Just Transition Communities Project Manager (Project & Practice Lead)
NESCAN – Just Transition Communities Project
Information Consultant, Climate Analyst Team
Public Health Scotland
Principal Information Analyst, Climate Analyst Team
Public Health Scotland
Strategy Lead, Just Transition Unit
Scottish Government
Head of Net Zero Economy and Carbon Markets
Scottish Government
Senior Manager, Sustainability, SSEN Transmission; and member, Climate Emergency Response Group
SSEN Transmission; Climate Emergency Response Group
Coordinator, Aberdeen Just Transitions Lab
University of Aberdeen
Operations Coordinator
2050 Climate Group
Organisation
Workshop facilitator
University of Edinburgh
Research Fellow (Lara Santos Ayllón)
University of Edinburgh
Academic Project Lead (Kirsten Jenkins)
Scottish Government (Climate Change Analysis Unit)
Project representative (Emily Creamer)
Scottish Government (Just Transition Unit)
Project representative (Abi Whitefield-Stevens)
Table 2 (Appendix A): Workshop participants (17 November 2025)
Scottish government focus areas
Agricultural reform research, monitoring and evaluation
City and Region Growth Deals
Climate adaptation policy
Climate adaptation research
Community climate action
Energy transition
Fair Work Convention Secretariat
Flood resistance policy
Geospatial Analysis
Heat research and analysis
Industry Statistics
Inshore fisheries
Just Transition Unit
Land use strategy
Marine climate change and biodiversity policy
National Performance Framework
Natural capital markets policy
Offshore wind policy – fisheries coexistence
Peatland restoration delivery
Poverty and deprivation
Regional Partnerships
Rural and Environment Science and Analytical Services (RESAS) – Environmental Analysis Unit
Rural and Environment Science and Analytical Services (RESAS) – Rural communities research
Scottish Forestry – woodland creation
Transport Statistics
Table 3 (Appendix A): Scottish Government areas (in alphabetical order)
Evidence review: JT M&E terminology
The following table provides an overview of key Scottish Government JT policies and JT M&E publications by the JTC. It illustrates areas of overlap and difference in the use of M&E terminology and categorisation.
Table 1 (Appendix B): Overview of key JT policies and M&E framework terminology and categorisation approaches
Outcome Indicators – Quality assessment
This appendix provides a summary of each indicator, including target population, desired trend, data source and timeframe. It also provides a data quality assessment based on three key criteria: relevance, representativeness and data availability. These criteria were selected from SNAP3 (Scottish Government, 2024a) as the most relevant for this project. Each is categorised according to assessed indicator quality. They are colour coded red for low quality, amber for moderate quality and green for high quality. This is aligned with the approach in used in the SNAP3 M&E framework (2024a, p.35) and in the CCP (2026) (Scottish Government, 2026e). Table 1 below describes each quality assessment criterion and its rating. The table is amended from the CCP (2026).
Criterion
Description
Low
Moderate
High
Relevance
The indicator should relate clearly to the emissions source, climate resilience or just transition outcome it is designed to monitor
Minimal or indirect relationship to emissions reductions, climate adaptation or just transition
Some relationship to emissions reduction, climate adaptation or just transition but indirect or partial
Clear and direct relationship to the emissions pathway, climate adaptation or just transition outcome
Representativeness
The indicator should be directly relevant to key dimensions of the just transition outcome it is designed to monitor
The indicator doesn’t capture the key drivers of the expected emissions reduction, climate adaptation or just transition outcome
Represents some important drivers but not the full picture
Represents the key drivers of just transition, emissions change or climate adaptation
Data availability
Data should be regularly published, accessible and sufficiently robust
Data unavailable, restricted, irregular or highly uncertain
Data available but with limitations (lag, infrequent updates, quality caveats)
Data regularly published, accessible, and statistically robust
Table 1 (Appendix C): Criteria used to evaluate indicators (amended from the CCP (2026) (Scottish Government, 2026e).
Communities and Places
CP1: Proportion of people in Scotland reporting satisfaction with opportunities to influence (i) the Scottish Government’s approach to delivering net zero, and (ii) local policy and planning decisions relating to net zero
Indicator information:
Target population(s): (i) Scotland-wide and (ii) by demographic groups in People and Equity (the same assessment applies)
Data source: Scottish Climate Survey (proposed addition from autumn 2026)
Desired trend: Increasing
Timeframe: Annual
CP1: Indicator quality assessment
Criterion
Rating
Explanation
Relevance
High
This indicator is rated high for relevance given it focuses directly on participation and policymaking in relation to net zero, which is key to a JT.
Representativeness
Moderate
This indicator is rated moderate for representativeness given its direct relevance to JT concerns through a focus on participation and influence over net zero policymaking at national and local scales. Breakdown by demographic groups also reflects considerations of recognition and existing socio-economic inequities in relation to participation opportunities. It does not provide insight into the felt experiences of participation opportunities, and interpretations and experiences of influencing policy may vary across survey respondents.
Data availability
Moderate
This indicator is rated moderate for data availability given that it depends on the annual commissioning of the Scottish Climate Survey.
CP2: Proportion of people in Scotland reporting satisfaction with opportunities to influence net zero and climate adaptation developments happening in their local area.
Indicator information:
Target population(s): (i) Scotland-wide and (ii) by demographic groups in People and Equity (the same assessment applies)
Data source: Scottish Climate Survey (proposed addition from autumn 2026)
Desired trend: Increasing
Timeframe: Annual
CP2: Indicator quality assessment
Criterion
Rating
Explanation
Relevance
High
This indicator is rated high for relevance given its direct focus on engagement and influence over net zero and climate adaptation developments.
Representativeness
Moderate
This indicator is rated moderate for representativeness of JT concerns given its direct attention to issues of participation and influence over net zero and climate adaptation projects at local scales. Breakdown by demographic groups also reflects considerations of recognition and existing socio-economic inequities in relation to participation opportunities. It does not provide insight into the felt experiences of project engagement processes (e.g., consultations) and could underrepresent harder to reach populations, who are also often underrepresented in formal engagement processes.
Data availability
Moderate
This indicator is rated moderate for data availability given that it depends on the annual commissioning of the Scottish Climate Survey.
CP3: Number of community groups involved in climate action/sustainability activities, as recorded by the Climate Action Hubs (and case studies)
Indicator information:
Target population(s): (i) Scotland-wide and (ii) including qualitative attention to groups across Local Authorities
Data source: Climate Action Hubs; qualitative – with community action stakeholders
Desired trend: Increasing
Timeframe: Annual
CP3: Indicator quality assessment
Criterion
Rating
Explanation
Relevance
High
This indicator is rated high for relevance due to its focus on community-led climate action and sustainability initiatives, which related directly to JT outcomes.
Representativeness
Moderate
This indicator is rated moderate for representativeness of JT concerns. Community-led and grassroots climate action more broadly are strongly associated to community empowerment and participation in the transition, both key dimensions of JT. Climate Action Hubs data is not representative of all community-led climate action across Scotland and may also include sustainability initiatives not directly related to net zero or climate adaptation. Engagement with the Climate Action Hub team can provide additional qualitative nuance, including insight into where community-led action is/ is not taking place and why, capturing considerations of spatial justice. Engagement with broader sectoral stakeholders can complement this indicator to provide a broader view of activity in Scotland.
Data availability
High
This indicator is rated high for data availability given that membership data is already collected by the Climate Action Hubs.
CP4: Geographical coverage of regional adaptation collaborations [once full coverage, updates on implementation]
Indicator information:
Target population(s): (i) Scotland-wide and (ii) by Local Authorities not covered by adaptation partnerships
Data source: Adaptation Scotland
Desired trend: Increasing
Timeframe: Annual
CP4: Indicator quality assessment
Criterion
Rating
Explanation
Relevance
High
This indicator is rated high for relevance due to its direct focus on climate adaptation and on partnership working for climate action.
Representativeness
Moderate
This indicator is rated moderate for representativeness of JT concerns. Cross-institutional and cross-stakeholder partnership working has been identified as a key feature of JT. From an adaptation perspective, it captures a range of collaborations and their regional coverage. However, the data records Adaptation Scotland partnerships and may not capture all adaptation activity and collaborations within a region.
Data availability
Moderate
This indicator is rated moderate for data availability given that data is collected directly from Adaptation Scotland. The data will not reflect all adaptation collaborations in Scotland.
CP5: The proportion of people reporting that changes to their local place due to net zero infrastructure and/or land use change have maintained or improved the quality of their local area.
Indicator information:
Target population(s): Scotland-wide
Data source: Scottish Climate Survey (proposed addition from autumn 2026)
Desired trend: Increasing
Timeframe: Annual
CP5: Indicator quality assessment
Criterion
Rating
Explanation
Relevance
High
This indicator is rated high for relevance due to its direct focus on the impacts of net zero infrastructure and land use change.
Representativeness
Moderate
This indicator is rated moderate for representativeness of JT concerns. It puts the focus on the local perceptions and implications of net zero developments to capture distributional issues of benefit and harm from net zero developments. The focus on ‘quality of their local area’ may be interpreted differently by respondents. It may also obscure issues relating to the processes by which developments happened.
Data availability
Moderate
This indicator is rated moderate for data availability given that it depends on the annual commissioning of the Scottish Climate Survey.
This indicator is rated moderate for relevance given that land ownership directly affects community participation in the transition. However, it does not directly focus on community ownership of assets relating to net zero or climate resilience.
Representativeness
Moderate
This indicator is rated moderate for representativeness of JT concerns. Ownership and control over land enables direct access for communities to net zero opportunities, decision-making and benefits distribution. However, this indicator does not reflect the uses of community owned land nor the related impacts on stakeholders dependent on the land.
Data availability
High
This indicator is rated high for data availability given that it is regularly collected by Scottish Government.
CP7: Operational capacity of community and locally owned energy installations in Scotland. Include breakdown (i) by type of ownership (ii) by location and (iii) as a proportion of total renewable energy installed (that year/ overall).
This indicator is rated high for relevance given that the monetary and non-monetary benefits of community owned energy are well known and directly relate to JT outcomes and net zero.
Representativeness
Moderate
This indicator is rated moderate for representativeness because it captures the megawatts of installed capacity but does not provide evidence of the benefit of this to communities. It does not reflect differences in who can and cannot become involved in community ownership initiatives and thus is not representative of socio-economic inequalities. Data breakdowns by type of ownership, by location and as a proportion of total renewable energy installed can provide a more nuanced understanding in this direction. Stakeholder engagement with representative organisations could provide qualitative insight in relation to involved groups and complement this data.
Data availability
Moderate
Data are published on an annual basis as part of Energy Saving Trust ‘Community and Locally Owned Energy in Scotland’ report. The register is not compulsory so may not capture all projects.
CP8: Average value of community benefits committed from renewable energy projects commissioned in the last 36 months, where a community or developer form is attached to a project.
Desired trend: Meet/exceed good practice principles
Timeframe: Annual
CP8: Indicator quality assessment
Criterion
Rating
Explanation
Relevance
High
This indicator is rated high for relevance given the focus on community benefits from renewable energy as a net zero development.
Representativeness
Moderate
This indicator is rated moderate for representativeness of JT concerns. Community benefits payments are a recognised vehicle to distribute benefit locally and increase community wealth in response to implications of renewable energy developments (including, for example, landscape change, noise and economic opportunities). The indicator does not show the distribution of these benefits across Scotland nor within communities, nor how the funds are used.
Data availability
Moderate
This indicator is rated moderate for data availability given that data is regularly collected by Local Energy Scotland. It is provided by developers, project owners and fund administrators on a voluntary basis, so the data may be incomplete.
CP9: Engagement experiences of the fishing sector with offshore energy developments
Indicator information:
Target population(s): Scotland-wide
Data source: Data not available. Recommended data collection: qualitative engagement with key stakeholder groups e.g., Regional Inshore Fisheries Group and existing forums.
Desired trend: Monitor, improving
Timeframe: Annual
CP9: Indicator quality assessment
Criterion
Rating
Explanation
Relevance
High
This indicator is rated high for relevance given the expected impact of planned offshore energy developments (wind, tidal, wave) as part of the net zero transition.
Representativeness
Moderate
This indicator is rated moderate for representativeness of JT concerns. Offshore energy developments create a recognised net zero pressure on the distribution of marine space. The fishing sector is facing cumulative pressures in part, because of the net zero transition. This indicator recommends qualitative engagement with sectoral stakeholders to understand transition dynamics between the offshore energy and fishing sector. This data will not be representative of experiences with every development underway in Scotland and may be highly variable.
Data availability
Low
This indicator is rated low for data availability as this data is not currently collected. Stakeholder networks involving the Scottish Government through which to begin to collect this data are available.
CP10: Distribution of marine space across activities, including % available for fishing
Indicator information:
Target population(s): Scotland-wide
Data source: Data not available in monitorable format. Data available and regularly updated in map format by the Marine Directorate (NMPi)
Desired trend: Monitor, qualitative
Timeframe: Annual
CP10: Indicator quality assessment
Criterion
Rating
Explanation
Relevance
High
This indicator is rated high for relevance given the scale of potential offshore energy developments (wind, tidal, wave) as part of the net zero transition.
Representativeness
High
This indicator is rated high for representativeness of JT concerns. Offshore energy developments are a clear net zero pressure on the use of marine space. The fishing sector is facing cumulative pressures, in part because of the net zero transition. Monitoring available marine space for fishing over time (and where possible, in relation to developing offshore energy projects and related installations e.g., subsea cables) can support distributional justice analyses across energy and fishing stakeholders and provide insight into transition dynamics.
Data availability
Low
This indicator is rated low for data availability as this data is not currently collected in a monitorable format. The data exists and is regularly updated in an online map format by the Scottish Government Marine Directorate.
CP11: Number of woodland creation projects registered with the Woodland Carbon Code (WCC) and peatland restoration projects registered with the Peatland Code (PC) owned by community groups and small landholdings; and as a % of total registered projects.
Indicator information:
Target population(s): Scotland-wide
Data source: Data not currently available. Projects registered with the WCC and PC are visible on their public registers (WCC registry, PCC registry), including details of ownership. Additional analysis may enable identification of community and small landholdings projects. Can collect case study data through qualitative engagement with (e.g., Scottish Forestry, Peatland Action, Community Land Scotland).
Desired trend: Monitor, increasing
Timeframe: Annual
CP11: Indicator quality assessment
Criterion
Rating
Explanation
Relevance
High
This indicator is rated high for relevance given the direct focus on natural capital projects developed for carbon offsetting for net zero.
Representativeness
Moderate
This indicator is rated moderate for representativeness of JT concerns. Community and small landholding involvement in carbon offsetting projects reflects opportunities for smaller scale participation in carbon offsetting projects as a net zero opportunity. Delimiting ‘natural capital’ and carbon offsetting projects is challenging, and not all projects such projects will be registered with the WCC and PC. This indicator does not capture the impacts of these projects.
Data availability
Low
This indicator is rated low for data availability as this data is not currently collected. Data exists on public WCC and PC registries. Specific community and small landholding data may be accessible through further analysis.
CP12: Socio-economic benefits from woodland creation and peatland restoration
Indicator information:
Target population(s): Scotland-wide
Data source: Qualitative engagement with key stakeholder groups e.g., Community Land Scotland, Scottish Forestry, Peatland Action, Scottish Land Commission, and with projects under development. The WCC has a benefits self-reporting tool from which data may also be available for the Scottish Government.
Desired trend: Increasing
Timeframe: Annual
CP12: Indicator quality assessment
Criterion
Rating
Explanation
Relevance
High
This indicator is rated high for relevance given the direct focus on the type and distribution of benefits from woodland creation and peatland restoration, both of which support net zero and climate resilience.
Representativeness
Moderate
This indicator is rated moderate for representativeness of JT concerns. Woodland creation and peatland restoration will create diverse socio-economic benefits and their localised impacts across communities in Scotland directly affects distributional and procedural JT considerations. Defining and quantifying socio-economic benefits from natural capital projects (which are often not monetary benefits) is challenging. Qualitative data collection will support increasing understanding of these projects, their development processes and impacts.
Data availability
Low
This indicator is rated low for data availability as this data is not currently collected. Potential stakeholders for qualitative data collection have been identified and have existing networks with the Scottish Government.
People and Equity
Indicators PE1 and PE2 are covered by the quality assessment in Communities and Places and are not repeated below.
PE3: Percentage of dwellings in Fuel Poverty
Indicator information:
Target population(s): (i) Scotland-wide, (ii) 6-fold rural/urban classification and (iii) Island local authorities
Data source: Scottish House Condition Survey (in Scottish Household Survey)
Desired trend: Towards the attainment of statutory targets
Timeframe: Annual (Local authority data availably every 3 years)
PE3: Indicator quality assessment
Criterion
Rating
Explanation
Relevance
High
This indicator is rated high for relevance given that fuel poverty is an existing, systemic injustice related to access and affordability of energy, a key sector in the transition to net zero.
Representativeness
Moderate
This indicator is rated moderate for representativeness given the strong spatial dimension of fuel poverty in Scotland, where it is strongly characterised by its geographical distribution. Data by local authorities is only available every three years, however; and the indicator does not distinguish between fuel poverty and extreme fuel poverty, nor reflects the lived experiences of different households.
Data availability
High
This indicator is rated high for data availability given that data is published annually as accredited official statistics.
PE4: Housing with EPC C or above across housing/tenure types
Indicator information:
Target population(s): (i) Scotland-wide, (ii) 6-fold rural/urban classification and (iii) Island local authorities
This indicator is rated high for relevance given that increasing energy efficiency is a key vehicle for net zero, climate resilience, and addressing fuel poverty.
Representativeness
High
This indicator is rated high for representativeness given that access to energy efficiency and retrofit solutions is often costly, challenging and is a key avenue to decrease poverty alongside emissions reductions. Inequalities of access to retrofit and efficiency solutions are spread across housing and tenure types, which will also be captured by this indicator. In Scotland, energy efficiency inequalities are also spatially distributed across geographies.
Data availability
High
This indicator is rated high for data availability given this data is collected annually in the Scottish House Condition Survey.
PE5: Percentage of people reporting that they can afford their individual transport costs
Indicator information:
Target population(s): (i) Scotland-wide, (ii) 6-fold rural/urban classification, (iii) island local authorities and (iv) people with different levels of household income.
Data source: Scottish Household Survey (SHS)
Desired trend: Increasing
Timeframe: Annual
PE5: Indicator quality assessment
Criterion
Rating
Explanation
Relevance
High
This indicator is rated high for relevance given that transport affordability is a key concern relating to the transition to net zero.
Representativeness
Moderate
This indicator is rated moderate for representativeness given that it directly asks about issues of affordability and can monitor these across Scotland’s geographies (in which transport needs vary) and with attention to low levels of income. The indicator is based on a reported sense of affordability and could be impacted by various factors other than the net zero transition. Over time, however, as the transition to net zero unfolds, transport should not become unaffordable.
Data availability
High
This indicator is rated high for data availability given this data is collected annually through the Scottish Household Survey.
PE6: Number of people reporting they do not use public transport (buses) due to connectivity issues
Indicator information:
Target population(s): (i) Scotland-wide, (ii) 6-fold rural/urban classification, and (iii) island local authorities
Data source: Scottish Household Survey (SHS)
Desired trend: Decreasing
Timeframe: Every two years
PE6: Indicator quality assessment
Criterion
Rating
Explanation
Relevance
High
This indicator is rated high for relevance given that transport connectivity is a key dimension of transport poverty which could be impacted by the net zero transition. Public transport is a key avenue for transport emissions reductions and is broadly more affordable transport, in particular by bus.
Representativeness
Moderate
This indicator is rated moderate for representativeness given that it focuses directly on issues of connectivity. Connectivity is a challenging issue to capture due to its overlap with other considerations. This indicator is based on a combined analysis of data to the question of why respondents do not use public transport (SHS). The suggested analysis includes attention to the following responses: lack of service, too infrequent, takes too long, inconvenient, no direct route, unreliable. In addition, analysis should also include the response ‘use my own car’ overlayed with these issues. Geographical breakdowns reflect different transport needs across regions in Scotland.
Data availability
High
This indicator is rated high for data availability given this data is collected annually in the Scottish Household Survey.
PE7: (i) Proportion of adults within 5-minute walk of greenspace
(ii) Extent of green-blue land cover in urban areas
Indicator information:
Target population(s): (i) Scotland-wide, (ii) demographic groups, (iii) SIMD 20% most deprived (if data is available)
This indicator is rated moderate for relevance given the role of greenspace in emissions reductions and increasing climate resilience, alongside the benefits from greenspace access for individuals. It is also important to monitor whether new net zero developments are reducing greenspace access.
Representativeness
Moderate
This indicator is rated moderate for representativeness given that it does not reflect the quality, safety nor accessibility of greenspace. Increases in greenspace may not be reflected in responses based on the ‘5-minute walking distance’ perimeter. Greenspace access inequities would support JT analyses, but this is subject to data availability e.g., by SIMD percentile.
Data availability
High
This indicator is rated high for data availability given this data is collected annually in the Scottish Household Survey and the Ordnance survey. The two data sources are used in SNAP3 for annual reporting.
PE8: Proportion of people who agree that the transition to net zero and climate resilience will support a more positive future for young people and future generations in Scotland.
Indicator information:
Target population(s): Scotland-wide
Data source: Scottish Climate Survey (proposed addition from autumn 2026)
Desired trend: Increasing over time
Timeframe: Annual
PE8: Indicator quality assessment
Criterion
Rating
Explanation
Relevance
High
This indicator is rated high for relevance given that an expansive JT has a strong component of intergenerational justice, that is, protecting the planet today for younger people and the generations of the future. This is an underlying driver of the transition to net zero and climate resilience.
Representativeness
Moderate
This indicator is rated moderate for representativeness given that respondents could have varying understandings of what the transition means, or what a ‘more positive future’ entails.
Data availability
Moderate
This indicator is rated moderate for data availability given that it depends on the annual commissioning of the Scottish Climate Survey.
PE9: Level of adaptation action being taken by people in Scotland
Indicator information:
Target population(s): (i) Scotland-wide, (ii) demographic groups, (iii) SIMD 20% most deprived (if data is available)
Data source: Scottish Climate Survey
Desired trend: Increasing
Timeframe: Annual
PE9: Indicator quality assessment
Criterion
Rating
Explanation
Relevance
High
This indicator is rated high for relevance given it directly focuses on ability to engage in climate change adaptation.
Representativeness
Moderate
This indicator is rated moderate for representativeness. The ability to adapt to a changing climate will be impacted by a range of factors, from systemic inequalities through to perceived risk and information and knowledge access. While this indicator captures self-reported data at an individual household level, it does not reflect institutional action to support climate resilience, for example, at local authority level.
Data availability
Moderate
This indicator is rated moderate for data availability given that it depends on the annual commissioning of the Scottish Climate Survey.
PE10: Hospitalisations by heat
Indicator information:
Target population(s): (i) Scotland-wide, (ii) demographic groups (age and sex), (iii) SIMD 20% most deprived (if data is available)
Data source: Public Health Scotland
Desired trend: Decreasing
Timeframe: Annual
PE10: Indicator quality assessment
Criterion
Rating
Explanation
Relevance
High
This indicator is rated high for relevance given it directly focuses on the distribution of impacts from climate change.
Representativeness
Moderate
This indicator is rated moderate for representativeness given that it captures a health concern relating to climate change impacts and by attention to affected populations such as older adults. The data is modelled and will not necessarily reflect the increasing adoption of adaptation measures.
Data availability
High
This indicator is rated high for data availability given that the dataset is developed by Public Health Scotland with plans for annual publication and further development.
PE11: Proportion of householders with prior flood claims who can receive quotes from 5 or more insurers
Indicator information:
Target population(s): Scotland-wide
Data source: Flood-Re
Desired trend: Maintaining/increasing
Timeframe: Annual
PE11: Indicator quality assessment
Criterion
Rating
Explanation
Relevance
High
This indicator is rated high for relevance given it directly focuses on issues of accessing solutions for climate change resilience and adaptation.
Representativeness
Moderate
This indicator is rated moderate for representativeness given that it reflects availability of flood insurance for readily impacted households, which has already been monitored at 100%. As flooding becomes more frequent in a changing climate, availability of flood insurance could be at risk of decreasing. The indicator does not reflect the affordability of this insurance, who can/cannot access it nor whether it is taken up.
Data availability
High
This indicator is rated high for data availability for the data is collected annually from Flood-Re for SNAP3 M&E.
PE12: Proportion of people living in a flood risk area who report an inability to implement flood risk measures
Indicator information:
Target population(s): Scotland-wide
Data source: Scottish Climate Survey (proposed addition from autumn 2026)
Desired trend: Increasing
Timeframe: Annual
PE12: Indicator quality assessment
Criterion
Rating
Explanation
Relevance
High
This indicator is rated high for relevance given it directly focuses on issues of accessing solutions for climate change resilience and adaptation.
Representativeness
Moderate
This indicator is rated moderate for representativeness given that it focuses directly on affected populations by flood risk, and on adaptation capabilities. The implementation of flood resilience at a household level is challenging and very costly. This indicator only focuses on flood risk and does not capture broader risks of climate change and adaptation.
Data availability
Moderate
This indicator is rated moderate for data availability given that it depends on the annual commissioning of the Scottish Climate Survey.
PE13: Premature deaths due to exposure to fine particulate matter (PM2.5) (number of premature deaths)
Indicator information:
Target population(s): (i) Scotland-wide, (ii) by SIMD percentile and (iii) by demographic groups
Data source: Data not available in indicator format. Discussions with Public Health Scotland suggests feasibility of indicator development.
Desired trend: Decreasing
Timeframe: Annual
PE13: Indicator quality assessment
Criterion
Rating
Explanation
Relevance
High
This indicator is rated high for relevance given the expected positive implications of net zero for reductions in air pollution and the distributed impacts of current pollution across Scotland.
Representativeness
Moderate
This indicator is rated moderate for representativeness of JT concerns. Reductions in harmful pollutants is a benefit across Scotland. Suggested geographical and demographic breakdowns draw attention to potential inequities in exposure to polluted environments and subsequent health impacts, which should improve in the transition to net zero. The extent to which this is an issue in Scotland is to be determined once data is collected.
Data availability
Low
This indicator is rated low for data availability as this indicator does not currently exist. Advice from Public Health Scotland suggests feasibility of development.
Jobs, Skills and Economic Opportunities
JSEO1: Employment (full-time equivalent) in the Low Carbon and Renewable Energy Economy (LCREE) in Scotland
This indicator is rated high for relevance given it is specifically focused on job creation in the net zero, low carbon economy.
Representativeness
Moderate
This indicator is rated moderate for representativeness. The dataset cannot be broken down by geographies, demographic groups nor specific sectors. Capturing who can and cannot access low carbon jobs is thus an important gap in this indicator. The indicator also does not reflect the quality of these jobs. The LCREE data are survey-based estimates based on a sample, and results from sample surveys are always estimates and not precise figures.
Data availability
High
This indicator is rated high for data availability given that it is annually published as official statistics by the Office for National Statistics (ONS).
JSEO2: Total employment in Energy (including in renewables)
This indicator is rated high for relevance given the role of the energy sector in Scotland’s economy, and the significance of the energy sector in the move towards net zero.
Representativeness
Moderate
This indicator is rated moderate for representativeness. Monitoring energy employment throughout the transition matters in the Scottish context given expected job losses in fossil fuel energy sectors alongside expected job creation in renewable energy. As a major sector driving activity in the net zero transition in Scotland, this justifies directed attention. If energy employment declines over time, there is reasonable scope to infer that the fossil fuel energy industry employment is not being replaced by growing renewable energy jobs. This indicator does not distinguish between types of energy sectors, occupation nor quality of jobs. It focuses solely on energy and hence on just one part of the net zero economy.
Data availability
High
This indicator is rated high for data availability for the data is annually collected as official statistics by the Scottish Government.
JSEO3: Employment in forestry and marginal employment changes from woodland creation
This indicator is rated high for relevance given the role of land use change activities in net zero and climate resilience.
Representativeness
Moderate
This indicator is rated moderate for representativeness. As the transition unfolds, woodland creation is an economic and emissions reductions opportunity. This indicator captures changes in woodland creation employment, but this is only one of many forms of ‘natural capital’ employment. Not all woodland creation will be for the purposes of net zero or climate adaptation (but all woodland creation will impact emissions).
Data availability
High
This indicator is rated high for data availability given that marginal employment changes are calculated annually by Scottish Forestry. In addition, Scottish Forestry also conduct ad hoc research providing further detail into employment impacts.
JSEO4: Low Carbon and Renewable Energy Economy (LCREE) estimated direct and indirect turnover
This indicator is rated high for relevance given its attention to economic turnover in the net zero, low carbon economy.
Representativeness
Moderate
This indicator is rated moderate for representativeness given that it is based on businesses self-reporting activity across a bespoke set of 17 sectors defined by the Office for National Statistics (ONS). LCREE estimates are survey-based and gather information from a sample of businesses rather than the whole population, so are subject to measurable sampling uncertainty.
Data availability
High
This indicator is rated high for data availability given that it is annually published as official statistics by the Office for National Statistics (ONS).
JSEO5: Businesses with 10+ employees with (i) a climate strategy (ii) biodiversity strategy (iii) publishing an annual sustainability report
This indicator is rated high for relevance given it provides information about business knowledge, planning and action towards climate change and climate adaptation in a transitioning economy.
Representativeness
Low
This indicator is rated low for representativeness. It reflects self-reported commitments towards actions on climate change and biodiversity by businesses, which implies a level of awareness, responsiveness and adaptation by businesses to a changing climate and economy. The Business Insights and Conditions Survey does not include every sector and reports on businesses of 10+ employees. This excludes smaller businesses including sole traders, who make up the majority of businesses in the Scottish economy (in Businesses in Scotland, Scottish Government, 2025g). The data is self-reported and does not reflect actual adaptation or decarbonisation actions.
Data availability
High
This indicator is rated high for data availability given that it is annually available through the Business Insights and Conditions Survey.
JSEO6: Number of people in Modern Apprenticeships reporting that their apprenticeship is in a ‘net zero or green sector’ (i) 3 months and (ii) 15 months after finishing
Indicator information:
Target population(s): (i) Scotland-wide, (ii) by demographic groups
This indicator is rated high for relevance given the direct focus on net zero or ‘green’ sectors in relation to skills development through apprenticeship training underway.
Representativeness
Low
This indicator is rated low for representativeness. The indicator focus is directly relevant to JT concerns in the transition to net zero. However, apprenticeships are only one of many training and education pathways. The sample size will be too small for the Scottish Government to gain insight into skills development, training and retraining underway in Scotland as a whole. Still, a steady increasing trend of apprenticeships in green sectors, alongside monitoring decreasing inequalities across demographic groups, can be considered a positive trend overall.
Data availability
High
This indicator is rated high for data availability because the data is collected on a rolling basis by Skills Development Scotland.
This indicator is rated high for relevance given the importance of worker representation and participation in decision-making throughout the transition to net zero and climate resilience. Trade union representation and access are core characteristics of the fair work economy, in line with Scottish Government commitments.
Representativeness
Low
This indicator is rated low for representativeness given it focuses on trade union membership density in Scotland as a whole, and not in specific sectors relating to the net zero and climate resilience transition. In addition, trade union membership does not ensure worker participation in transition decision-making. Attention to trade union access would support a more nuanced view.
Data availability
High
This indicator is rated high for data availability as this is annually collected as official statistics by the UK Government.
JSEO8: Proportion (%) of employees earning less than the Real Living Wage
This indicator is rated high for relevance given the importance of quality and fair work jobs in the low carbon economy in Scotland. The real living wage is a key characteristic of a fair work economy, in line with Scottish Government commitments.
Representativeness
Moderate
This indicator is rated moderate for representativeness given that it is not broken down by sectors and specifically, net zero and climate adaptation employment. However, it remains representative of a JT given the economy-wide implications of the transition in Scotland, across sectors.
Data availability
High
This indicator is rated high for data availability given it is annually collected by the Office for National Statistics (ONS).
JSEO9: The difference between male and female full-time hourly earnings in the transport sector (SIC H: Transportation and storage)
Indicator information:
Target population(s): Scotland-wide
Data source: Annual Survey of hours and earnings
Desired trend: Gap decreasing
Timeframe: Annual
JSEO9: Indicator quality assessment
Criteria
Rating
Explanation
Relevance
High
This indicator is rated high for relevance given the opportunity for increased pay equity in net zero and climate adaptation related sectors (as a key dimension of fair work), including transport. This indicator was identified in the Draft Transport JT Plan (2025).
Representativeness
Moderate
This indicator is rated moderate for representativeness. It does not capture sub-sectoral categories of high emissions and low emissions transport, yet trends should highlight changes in the gender pay gap in transport overall. These can be contextualised within progress towards emissions reductions across sectors.
Data availability
High
This indicator is rated high on data availability for it is annually collected by the Office for National Statistics (ONS).
JSEO10: The difference between male and female full-time hourly earnings in the energy sector (SIC B: Mining and Quarrying; SIC D: Electricity, Gas, steam and air conditioning supply).
Indicator information:
Target population(s): Scotland-wide
Data source: Annual Survey of hours and earnings
Desired trend: Gap decreasing
Timeframe: Annual
JSEO10: Indicator quality assessment
Criteria
Rating
Explanation
Relevance
High
This indicator is rated high for relevance given the opportunity for increased pay equity in net zero and climate adaptation related sectors (a key dimension of fair work), including energy.
Representativeness
Moderate
This indicator is rated moderate for representativeness given that current SIC code sectoral breakdowns for energy do not capture the full set of changing and new energy activities as a result of net zero.
Data availability
High
This indicator is rated high for data availability for it is annually collected by the Office for National Statistics (ONS).
JSEO11: The difference between male and female full-time hourly earnings in the construction sector. [SIC F: Construction]
Indicator information:
Target population(s): Scotland-wide
Data source: Annual Survey of hours and earnings
Desired trend: Gap decreasing
Timeframe: Annual
JSEO11: Indicator quality assessment
Criteria
Rating
Explanation
Relevance
High
This indicator is rated high for relevance given the opportunity for increased pay equity in net zero and climate adaptation related sectors (a key dimension of fair work), including construction.
Representativeness
High
This indicator is rated high for representativeness given the expected activity in relation to buildings and construction as part of the transition to net zero and climate resilience.
Data availability
High
This indicator is rated high for data availability given that it is annually collected by the Office for National Statistics (ONS).
JSEO12: The difference between male and female full-time hourly earnings in the agriculture sector (SIC A: Agriculture, forestry and fishing)
Indicator information:
Target population(s): Scotland-wide
Data source: Annual Survey of hours and earnings
Desired trend: Gap decreasing
Timeframe: Annual
JSEO12: Indicator quality assessment
Criteria
Rating
Explanation
Relevance
High
This indicator is rated high for relevance given the opportunity for increased pay equity in net zero and climate adaptation related sectors (a key dimension of fair work), including in agriculture and land use.
Representativeness
Moderate
This indicator is rated moderate for representativeness given that current Sectoral Industrial Classification (SIC) breakdown does not capture sub-sectoral categories of land use change relating to net zero and climate resilience activities.
Data availability
High
This indicator is rated high on data availability for it is annually collected by the Office for National Statistics (ONS).
JSEO13: (i) Number of renewable energy supply chain businesses in Scotland.
(ii) Proxy: £ value of ScotWind projects committed to Scottish-based suppliers
Indicator information:
Target population(s): Scotland-wide
Data source: (i) Data not available, (ii) Crown Estate Scotland
Desired trend: Increasing
Timeframe: Annual
JSEO13: Indicator quality assessment
Criteria
Rating
Explanation
Relevance
High
This indicator is rated high for relevance given that the creation of renewable energy supply chain businesses in Scotland is a key opportunity for distributed benefit from the net zero transition.
Representativeness
Low
This indicator is not currently available. The recommended proxy is rated low for representativeness. ScotWind offshore wind project supply chain commitments do not cover all supply chain activity in Scotland, do not represent all renewable energy activity Scotland, nor do they provide detail on business creation and growth. However, as an important energy development with recognised implications in Scotland, it serves as an interim proxy on whether economic opportunities from renewable energy are distributed across the Scottish economy.
Data availability (proxy)
Moderate
The proxy indicator is rated moderate for data availability given that it is collected by Crown Estate Scotland through developer supply chain commitments.
JSEO14: (i) Business resilience and ability to adapt to climate change and the transition
(ii) Proxy (in the CCP, 2026): Proportion of small businesses in Scotland reporting the level of energy prices as an obstacle.
This indicator is rated high for relevance given the need to understand to what extent businesses in Scotland are resilient to climate change, and whether they are benefiting from or being negatively impacted by net zero.
Representativeness
Low
This indicator is not available. The proxy indicator focused on small businesses reporting energy costs as an obstacle to their business is rated low for representativeness. A wide range of factors could be affecting energy prices and business success at different points in time, which makes it challenging to trace this back to the net zero transition itself. The potential impact on energy prices is just one of many ways in which small businesses may be affected by the net zero transition.
Data availability (proxy)
High
The proxy indicator is rated high for data availability given that the data is annually collected in the Scotland Small Business Survey.
JSEO15: Number of workers experiencing redundancy in high emitting industries in Scotland receiving support/ reporting that their employers are implementing transition plans for workers
Indicator information:
Target population(s): Scotland-wide
Data source: Data not available – survey recommended
This indicator is rated high for relevance given the implications of the transition to net zero for high emitting industries and their workforce.
Representativeness
High
This indicator is rated high for representativeness, Managed, supported transitions for workers in high emitting industries is a core pillar of a JT, and the recommended survey should cover workers across high emitting sectors and in a range of occupations.
Data availability
Low
This indicator is rated low for data availability because data is currently non-existent.
JSEO16: High emitting industry worker participation in decisions affecting them
Indicator information:
Target population(s): Scotland-wide
Data source: Data not available – survey recommended
This indicator is rated high for relevance given the implications of the transition to net zero for high emitting industries and their workforce.
Representativeness
High
This indicator is rated high for representativeness given that managed, supported and negotiated worker transitions driven by participatory processes are key to delivering a JT. The recommended survey should cover workers across high emitting sectors and in a range of occupations.
Data availability
Low
This indicator is rated low for data availability because data is currently non-existent.
JSEO17: Sense of uncertainty/ confidence in the transition amongst workers in high emitting industries
Indicator information:
Target population(s): Scotland-wide
Data source: Data not available – survey recommended
This indicator is rated high for relevance given the implications of the transition to net zero for high emitting industries and their workforce.
Representativeness
Moderate
This indicator is rated moderate for representativeness. In a context of industrial change, including at times, site closure and redundancies, the sense of uncertainty and confidence in the transition should to some extent, reflect ongoing experiences with the transition and whether assurances and support are in place.
Data availability
Low
This indicator is rated low for data availability because data is currently non-existent.
Environment and Biodiversity
EB1: Emissions of the eight priority Air Quality pollutants (ammonia, carbon monoxide, nitrogen oxides, non-methane volatile organic compounds, particulate matter, sulphur dioxide and lead) for Scotland and by industrial sector
Indicator information:
Target population(s): Scotland-wide
Data source: National Atmospheric Emissions Inventory
Desired trend: Decreasing
Timeframe: Annual
EB1: Indicator quality assessment
Dimension
Rating
Explanation
Relevance
Moderate
This indicator is rated moderate for relevance given the expected impact of net zero actions on air pollutants and the implications this has for the future health of people and planet.
Representativeness
Moderate
This indicator is rated moderate for representativeness given that air pollution has direct impacts on health across the population. The breakdown by industrial sector enables a degree of attention to where emissions are falling and which ones remain. However, the indicator does not show disproportionate impacts of air pollution on different groups or places, nor the distribution of responsibility for these emissions. Air quality in the UK is not just affected by emissions included in the National Atmospheric Emissions Inventory but also by secondary formation of air pollutants, emissions originating from outside the UK and geographical and meteorological factors.
Data availability
High
This indicator is rated high for data availability given it is annually collected by the National Atmospheric Emissions Inventory.
EB2: Improvements to water quality across types in Scotland
This indicator is rated high for relevance given that the transition to net zero should directly see decreases in water quality pollution from across industries (like fossil fuels and agriculture) but could also create risks to water sources (e.g., through wind farm installation). Annex 2 in the Draft CCP (Scottish Government, 2025i) also identified increased flood risk as posing risks to water quality.
Representativeness
Moderate
This indicator is rated moderate for representativeness given that water quality in Scotland is key for healthy populations and ecosystems. However, the indicator does not capture where or by whom the risks and benefits of decreasing/increasing water quality are being felt because of net zero or climate adaptation interventions.
Data availability
High
This indicator is rated high for data availability given it is annually collected by SEPA.
EB3: Scotland’s carbon footprint expressed in million tonnes of carbon dioxide equivalent per year
This indicator is rated high for relevance given the role of embodied emissions in the move towards net zero and the focus of carbon footprint measurements on consumption emissions. Consumption emissions are those associated with the spending of Scottish residents on goods and services, wherever in the world these emissions arise, alongside emissions directly generated by Scottish households through private heating and motoring (Scottish Government, 2025j). This is different to reporting on the greenhouse gas emissions produced within a country’s territory (UK Government, 2026).
Representativeness
Moderate
This indicator is rated moderate for representativeness given the implications of consumption, resource use and embodied emissions for a JT in relation to planetary boundaries. The indicator does not monitor the distribution of harm nor responsibility for Scotland’s carbon footprint. It also cannot reflect why the footprint is increasing/ falling.
Data availability
High
This indicator is rated high for data availability given it is annually collected by the Scottish Government and trend data is available since 1998.
EB4: Global biodiversity impact (Measures the effect of Scotland’s resource use on biodiversity domestically and abroad)
This indicator is rated moderate for relevance given that the net zero transition will have indirect impacts on resource use. The biodiversity crisis is a key planetary boundary with implications for climate resilience more broadly.
Representativeness
Moderate
This indicator is rated moderate for representativeness given that the dynamics of resource use, emissions reductions and net zero are uncertain.
Data availability
Low
This indicator is rated low for data availability. The indicator is taken from the Circular Economy Strategy (Scottish Government, 2026d). The Material Flow Accounts data is collected by Zero Waste Scotland, but data for this indicator currently unavailable. Frequency of data collection is currently unknown.
This indicator is rated moderate for relevance given that the negative impacts of soil sealing on soil health can limit the potential benefits of healthy soils relating to water filtration and flood risk mitigation. Net zero developments like wind farms can have direct impacts on levels of soil sealing.
Representativeness
Moderate
This indicator is rated moderate for representativeness given that the indicator does not show where or why soil is being sealed. The trade-offs between impacts on soil health for climate resilience versus the installation of a wind farm, for example, are uncertain. This indicator can be regarded alongside indicator EB6 on regeneration of vacant/derelict urban land.
Data availability
Moderate
This indicator is rated moderate for data availability as data is collected by NatureScot from analysis of Ordnance Survey Mastermap data and NatureScot records of windfarm sites. There is historical data from 2009 to 2020, which was published in 2023.
EB6: Regeneration of vacant / derelict urban land (% of which is regenerated through environmental restoration, for climate adaptation and by net zero initiatives)
This indicator is rated high for relevance given that environmental restoration of vacant and derelict land directly supports JT outcomes and has implications for climate resilience.
Representativeness
Moderate
This indicator is rated moderate for representativeness given that the currently available data maps known sites of derelict urban land alongside action being taken. Further analysis is needed to understand what type of site regeneration is underway (e.g., environmental) and whether this is supported by net zero projects. Qualitative case studies and engagement with energy developers on regeneration initiatives may be a useful source of detail on activity underway.
Data availability
Low
This indicator is rated low for data availability. Although data is published by the Scottish Land Commission it is unclear whether it can be accessed and analysed to monitor this indicator.
EB7: Number of hectares of newly protected land and marine features across Scotland
This indicator is rated high for relevance given the importance of environmental restoration for JT. Better protected land and marine areas will be more resilient to climate change impacts.
Representativeness
Moderate
This indicator is rated moderate for representativeness given that measures of protection and restoration not covered by this dataset will not be reflected in the indicator.
Data availability
Moderate
This indicator is rated moderate for data availability given that frequency of data updates is still to be decided (as assessed in the SNAP3 M&E framework, (Scottish Government, 2024a, p. 40).
EB8: Carbon and social footprint of materials used for net zero developments in Scotland
Interim proxy: Carbon Intensity of Materials: indicates whether a nation is consuming more sustainable alternatives, independent of trends in overall greenhouse gas impact.
Indicator information:
Target population(s): Scotland-wide
Data source: Data not available. Developers increasingly conduct project lifecycle assessments for the planning process. This may be a starting point for data collection. Proxy data: Material Flow Accounts
Desired trend: Monitor, qualitative
Timeframe: Annual
EB8: Indicator quality assessment
Dimension
Rating
Explanation
Relevance
High
This indicator is rated high for relevance given that net zero developments like renewable energy projects will have embodied, social and environmental impacts and emissions. These span from material extraction for technological and project development through to waste once projects are decommissioned.
Representativeness
Low
This indicator in unavailable. The proxy indicator is rated low for representativeness given that while it provides an overall picture of trends in the carbon footprint of materials used in Scotland, it cannot distinguish by sectors.
Data availability (proxy)
Low
The proxy indicator is rated low for data availability. The indicator is taken from the Circular Economy Strategy (2026). The Material Flow Accounts data is collected by Zero Waste Scotland, but data for this indicator currently unavailable. Frequency of data collection is currently unknown.
Outcome ‘focus areas’ for indicator development
The following table illustrates the breakdown of the four outcomes into more granular focus areas. These were used as prompts during the workshop held on the 17 November 2025 and in semi-structured interviews, to stimulate discussion about possible indicators.
Theme and Outcome
Potential focus areas for indicators, as directly relates to the process and outcome of net zero and climate adaptation:
Communities and Places
Community empowerment, participation and involvement
Sense of belonging, identity and place
Localised socio-economic benefit
Locally and in relation to Scotland as a whole.
People and Equity
Socio-economic inequalities
Quality of life (mental and physical health, housing, fuel and transport poverty)
Participation inequalities
With particular attention to affected and disadvantaged households and places, from a financial and a spatial lens.
Jobs, Skills and Economic Opportunities
Diversified and prosperous economy, including business health
Worker transitions and availability and accessibility of fair work jobs
Skills and training opportunities
Worker participation in transition processes
With particular attention to affected sectors and groups, alongside risks and opportunities for businesses and economic health more broadly.
Environment and biodiversity
Nature-positive Scotland
Environmental health across land, sea and species
Table 1 (Appendix D): Four JT outcomes and focus areas, prompts for discussion.
‘No data’ outcome indicators: rationale and recommendations
The four outcomes include indicators for which data is currently not available. These indicators represent key areas of JT concern. Stakeholder engagement and desk-based research have helped to identify possible avenues for further refinement and data collection. These indicators, their relevance for a JT in Scotland and possible avenues for data collection are expanded on below, categorised by outcome.
Communities and Places (indicators CP9-CP12)
CP9: Engagement experiences of the fishing sector with offshore energy developments
The fishing sector is experiencing cumulative pressures in part, because of the energy transition. This includes from marine surveying, subsea cable developments and the installation of offshore wind farms. Fishers face high levels of uncertainty regarding the cumulative impact of developments, both due to varying timelines for different projects and uncertainties around the long-term impacts of offshore energy production on the marine environment. The fishing sector is small in capacity and resource in comparison to large scale offshore wind developers, creating hierarchies of power and influence over decision-making. Often, the just-ness of engagement and decision-making processes depend on each individual developer’s approach. This project has not found quantitative data able to communicate this complexity. The recommendation is for the Scottish Government to monitor a qualitative indicator informed by iterative stakeholder engagement with key fisheries representatives (e.g. Regional Inshore Fisheries Group and others). Various forums involving marine stakeholders and the Scottish Government readily exist and could be a possible avenue for qualitative data collection.
CP10: Distribution of marine space across activities, including % available for fishing
Fishing stakeholders often refer to the experienced ‘spatial squeeze’ by the sector. This refers to the accumulating pressures of new blue economy activities, environmental protection and others and the overlap with – and shrinking of – traditional fishing grounds. Stakeholder insights suggested that potentially relevant indicators like ‘employment in fishing’ will be influenced by too many variables beyond the transition to net zero to be useful for JT M&E. However, monitoring available marine space for fishing over time should be able to increase understandings of ongoing spatial trade-offs in the marine environment, including in direct relation to fishing. The Scottish Government’s Marine Directorate publish an interactive website illustrating the distribution of marine space in Scotland. These visual maps are informed by backend data which could support trend analysis regarding % change in marine space available for fishing over time.
CP11-12: Land use change for net zero and climate resilience: ‘natural capital’ engagement processes, participation and distributed benefits
Research on the types of land use change activities and their implications as part of the transition to net zero and climate resilience illustrated the challenges of defining and monitoring these from a JT perspective. Stakeholders explained the difficulties in setting boundaries around the term ‘natural capital’ and what interventions do/ do not fall into the scope of net zero and climate adaptation efforts. Woodlands may be created for carbon offsetting purposes, for example, for social uses or for other economic productive uses like timber production or tourism; all of which could be considered ‘natural capital’. In addition, many of the benefits from natural capital are considered public goods. In this context, indicators CP11 and CP12 focus on issues of ownership and socio-economic benefits, based on insight from stakeholder discussions and identified avenues to trial data collection. Project ownership will largely be conditioned by land ownership. The benefits and costs of owning woodland creation or peatland restoration as a community will likely differ from those of community owned energy. This suggests the need for continued research in this area. Engagement key stakeholders such as Community Land Scotland and their Natural Capital Community Partnerships project will be important to better understand the implications of these projects from a JT perspective. This can enable qualitative data collection for monitoring alongside refinement of land use change JT indicators.
People and Equity (indicator PE13)
PE13: Premature deaths due to exposure to fine particulate matter (PM2.5)
This indicator draws attention to improved air quality and the health implications of existing pollution levels for Scotland, across different groups and in the most deprived areas. This indicator is available in England (Department of Health and Social Care, n.d.). It reflects distributional justice concerns associated with the unequal distribution of negative impacts from environmental pollution in the current, high carbon economy. This unequal distribution should be addressed throughout the transition to a low carbon one (Farrell, 2012; Shen et al. 2020; Sun et al. 2024). This includes attention both to the geographical distribution of premature deaths by air pollution, to different demographic groups and by levels of deprivation across Scotland. Drabble et al. (2024) included various indicators focused on the spatial distribution of pollution exposure (see p.26, p.28, p.42, p.46). Although this data is not published in this form at present, engagement with Public Health Scotland advised that the development of this indicator would be feasible.
Jobs, Skills and Economic Opportunities (indicators JSEO13 – JSEO17)
JSEO13: Number of renewable energy supply chain businesses in Scotland.
The development of a domestic renewable energy industry has been identified by the Scottish Government as a key economic opportunity from net zero for Scotland (e.g., in the Green Industrial Strategy, Scottish Government, 2024c). The growth of existing supply chain businesses in Scotland and development of new ones as renewable energy is installed would reflect a level of distributed benefit, in contrast with the UK experience with onshore wind in the 20th century (Smith, 2011; Brunt and Spooner, 1998). This indicator is not currently developed. Using UK SIC codes, the Scottish Government could first, identify sectors under which renewable energy supply chain activity would be categorised. It could then monitor business growth and business startups in these sectors, to assess whether there is a developing renewable energy supply chain.
Proxy: £ value of ScotWind projects committed to Scottish-based suppliers
The proxy indicator was identified with support from Scottish Government analysts. It is focused solely on ScotWind, the offshore wind leasing rounds led by Crown Estate Scotland. While offshore wind is not representative of the full renewable energy supply chain, the scale and breadth of expected offshore wind projects justify its use as a proxy (Crown Estate Scotland, n.d.). Developers bidding in ScotWind leasing rounds are required to detail their supply chain spend plans in Scotland. This is a suggested avenue for data collection.
JSEO14: Business resilience and ability to adapt to climate change and the transition
Businesses across Scotland will be affected by climate change and will need to adapt to these changes. They will also be affected by the transition to net zero and may benefit from or be harmed by related impacts. The evidence review alongside stakeholder engagement has highlighted an evidence gap regarding the vulnerabilities, risks and opportunities faced by different business types and scales in Scotland, in the context of climate change and the net zero transition. There are a variety of available, regularly updated data sources about businesses in Scotland (including: the Scottish Annual Business Statistics, Small Business Survey Scotland and Business Insights and Conditions in Scotland, amongst others). While some of these surveys ask businesses about climate change impacts or adaptation measures, this data is currently insufficient to convey business transition, vulnerability, risk and opportunity pathways from a JT perspective.
Proxy: Proportion of small businesses in Scotland reporting the level of energy prices as an obstacle
It is important for the Scottish Government to understand the ways in which energy prices are affecting business success. The proposed framework includes the JT indicator which was included in the CCP (2026) as a proxy. However, business energy costs may be affected by many variables, and is only one of a suite of dimensions reflecting business vulnerability and resilience to climate change and the transition. In addition, engagement with Scottish Government industry analysts suggested there are limited surveys for data collection on sole traders. Sole traders make up over 70% of Scottish businesses (in Businesses in Scotland, Scottish Government, 2025g). This suggests a clear opportunity for targeted data collection on the impacts and experiences of climate change and the transition across business types and scales.
JSEO15-17: Indicators relating to worker transitions
Evidence collected throughout this project has spotlighted the lack of data available/ accessible to understand ongoing industrial transitions and the processes, impacts and experiences of the workforce. Employment and skills development indicators included by Drabble et al. (2024) in their framework already highlighted this data gap, given that data could not be categorised e.g., by specific sectors. The framework proposed by this project includes indicators focused on support and participation experiences alongside a broader sense of uncertainty amongst high emitting industry workers. It recommends the development of a targeted survey alongside qualitative methods to understand what is happening in transitioning industrial sites on the ground. Stakeholders such as STUC recognised the challenges of reaching many workers, particularly those working offshore. Suggested methods include in person surveying in key sites of mobility, such as, for instance, Aberdeen Airport. All three indicators (JSEO15-17) can be supported with qualitative case study and experience data from key stakeholders such as STUC, who are involved in day-to-day experiences on the ground. This new data collection could be complemented with case study data from (i) workers accessing the Oil and Gas Transition Training Fund, (ii) workers experiencing redundancy in Grangemouth accessing skill support, and (iii) any other initiatives by Scottish Government to support managed transitions away from high emitting industries.
Environment and Biodiversity (indicator EB8)
EB8: Carbon and social footprint of materials used for net zero developments in Scotland
This indicator recognises that infrastructure developed for the purposes of net zero will also have social and environmental impacts. These impacts are spread throughout renewable energy technology and projects’ supply chains and lifecycles, from material extraction through to decommissioning and waste. This indicator targets responsible renewable energy developments and addresses procedural risks of greenwashing renewable energy production. Developers are increasingly conducting social and environmental lifecycle assessments as part of their project planning applications. The Scottish Government could explore the extent to which this data is accessible and collatable as a starting point for indicator data collection and monitoring. This data would allow for better understanding of net zero developments in Scotland at local and global scales, including the risks of offshored injustice (e.g., Healy et al. 2019).
JT indicators in Scottish Government policy
This appendix details how this framework relates to existing JT indicators in the CCP (2026), the Grangemouth Industrial JT Plan and draft sectoral JT plans. Detailed attention is awarded to the JT indicators in the CCP (2026) given that it is the first Scottish Government publication to include a set of JT indicators for Scotland within statutory annual reporting.
Climate Change Plan (2026)
The CCP (2026) includes 12 JT indicators. This project developed in parallel to proposals for JT indicators in the Draft CCP (2025). However, this framework’s development process was separate. The proposed framework has parallels with, and at times departs from the JT indicators published in the CCP (2026). Table 1 below presents indicators in the CCP (2026) (Scottish Government, 2026e, p. 14) which are not included in the outcome indicator list in the proposed framework and provides a brief explanation as to why.
JT indicator in CCP
Explanation
Employment rate for people aged 16-64 in five local authorities with high socioeconomic dependence on oil and gas industries: (i) Aberdeen City; (ii) Aberdeenshire; (iii) Falkirk; (iv) Shetland Islands; and (v) Orkney Islands
This is not in the full outcomes list in the JT M&E framework because it is part of the proposed hotspots approach.
Proportion of households reporting that they are managing well financially in three local authorities with a high proportion of employment in oil and gas industries: (i) Aberdeen City, (ii) Aberdeenshire, and (iii) Falkirk
This is not in the full outcomes list in the JT M&E framework because it is part of the proposed hotspots approach.
Number of recipients of the Oil and Gas Transition Training Fund joint Scottish Government and UK Government initiative
This indicator is removed from the proposed M&E framework. It is deemed too specific for a national JT M&E framework. It is more clearly policy-oriented than outcome focused. This indicator could support improved, case specific understanding of the transition in the northeast of Scotland, where the Transition Training Fund is being implemented. It could also support causal evaluations of place-based change alongside the articulation of mechanisms (not included in this report).
Table 1 (Appendix E): JT indicators in the CCP (2026) not amongst the outcome indicators of this JT M&E framework.
Draft sectoral JT plans and the Grangemouth Industrial JT Plan
This project has delivered an M&E framework at a Scotland level and is thus less focused on granular assessment of the JT in the four net zero sectors identified by Scottish Government (energy, transport, agriculture and land use, buildings and construction). Similarly, the indicators in the Grangemouth Industrial JT Plan are directly relevant to the place and site-specific transition underway in the Grangemouth industrial cluster and will not apply to all transitions underway in Scotland as a whole.
The Jobs, Skills and Economic Opportunities outcome in the proposed framework includes fair work indicators. These focus on gender pay gap for energy, agriculture and land use, transport and buildings and construction. This selection was informed by indicators in the Draft Transport JT Plan (2025) and insight from the Fair Work Convention Secretariat. Additional sectoral breakdowns for other indicators in the Jobs, Skills and Economic Opportunities outcome (such as for trade union density/ access, or green jobs) are not possible with currently available data.
Some JT indicators relevant in the Grangemouth industrial cluster context (such as access to greenspace, attention to derelict sites or satisfaction with opportunities to influence decisions) are also reflected in indicators across the four outcomes in the proposed M&E framework. More broadly, draft sectoral JT plans, the Grangemouth Industrial JT Plan and their indicators were reviewed as evidence to inform this framework.
Hotspot indicator list – rationale
H
Indicator (reported on per selected local authority)
Desired trend (contextualised per hotspot)
Data source
Rationale
H1
Employment rate for people aged 16-64 across Scotland
Employment trends in hotspots are a key indicator of the workforce’s activity and mobility, both in places of industrial change/decline and in locations hosting large-scale net zero developments.
H2
Unemployment rate for people aged 16-64 across Scotland
Unemployment trends provide nuanced insight into changing employment patterns, often reflecting mobility challenges. Combined attention to employment and unemployment is inspired by Shapovalova et al. (2023).
H3
Number of people Not in Employment and Education or Training (16-19)
This indicator reflects a lack of engagement with available opportunities, by younger generations in sites of transition. An increasing trend draws attention to whether opportunities are available at all. It can highlight concerning transition dynamics in sites of industrial change and in contrast to pre-transition levels.
H4
Number of people in Modern Apprenticeships reporting that (i) their apprenticeship is in ‘green skills’/for the net zero economy’ during, 3-month and 15 months after finishing their apprenticeship and of these, (ii) number of people staying to work in their same Local authority.
Although modern apprenticeships are just one of many education pathways, this indicator will reflect levels of training/retraining opportunities in ‘green skills’ in hotspot locations.
H5
Population change (with attention to in-out migration)
Population changes capture multi-dimensional distributional burdens and opportunities in sites of transition over time. For example, this may include: depopulating areas due to industrial closure or large-scale industrialisation for energy production, or inward-migration due to employment creation as a result of transition interventions.
H6
Business activity/ survivability: Business birth and death rates
Levels of business birth and death are one way to monitor economic activity in a particular area. These data points can serve as an early signal of changing opportunities in a local economy, including highlighting risks of economic decline.
H7
Sectoral economic dependence/diversification:
Sectoral share of GVA (those increasing and in decline)
Employment Share by Sector (Regional Sector Share) (to monitor changing employment across sectors in the local economy; those increasing and in decline).
Location quotients (importance of a sector to a region relative to the national average)
Contextualised within broader economic trends per local authority.
Economic diversification was identified as an objective in the Scottish Government’s National Strategy for Economic Transformation (2022) and was identified by the JTC as a key strategic dimension of a JT (Just Transition Commission, 2024, p. 14).
Sectoral clustering creates innovation and productivity benefits but also increases potential exposure to sector-specific shocks. This indicator supports monitoring of changing economic patterns in hotspots. However, ‘Economic diversification’ does not necessarily demonstrate either resilience or a JT. The Scottish Government should contextualise this indicator within broader economic trends per local area, and the insight from relevant teams and stakeholders.
H8
Proportion of households reporting that they are managing well financially
This indicator provides annual data on felt financial wellbeing by households. It will be particularly relevant to monitor a sense of financial wellbeing on an annual basis in places experiencing industrial change.
This indicator captures potential knock-on effects on house prices from changing land use in sites of transition. This may include the installation of energy infrastructure or natural capital projects.
H10
People reporting that they can afford their individual transport costs
Through annual data, this indicator provides a frequent update on felt transport costs across households in sites of transition. In the case of net zero developments these are often rural and island areas with complex transport realities.
H11
Proportion of adults within 5-minute walk of greenspace
This indicator monitors greenspace levels in places that will host net zero developments. This includes qualitative attention to reduced greenspace access from these developments (e.g., the Energy Transition Zone using part of St. Fitticks Park in Aberdeen. St Fitticks Park is in Torry, one of the more deprived areas of Aberdeen according to SIMD).
H12
Operational capacity of community and locally owned energy installations in Scotland. Include breakdown (i) by type of ownership (ii) by location and (iii) as a proportion of total renewable energy installed in local area.
This indicator captures the multi-dimensional features of transitions given that sites of industrial change may also see community ownership developments. Hotspots of net zero transitions may see projects developing owned by a variety of different stakeholders. While community owned energy is identified as desirable from a JT perspective in Scotland, monitoring this in a hotspot context also enables qualitative attention to the benefits and potential harms of this type of ownership as well.
This indicator captures the multi-dimensional features of transitions given that sites of industrial change may also see community ownership developments. Community ownership of assets beyond energy also signals to opportunities to access transition opportunities beyond energy, alongside community wealth building and empowerment more broadly.
H14
Community benefits from energy (and for natural capital projects, once available)
This indicator captures the multi-dimensional features of transitions. Sites of industrial change may also be hosting renewable energy developments making community benefit payments. In net zero development contexts this should increase alongside increasing renewable energy projects. This indicator will not, however, tell the Scottish Government the impact nor local acceptance of these benefits. Engagement with local stakeholders will provide nuanced insight through a JT lens.
This indicator is included as an early warning sign of deprivation in contexts of industrial change. It is taken directly from Shapovalova et al. (2023).
This indicator is included as an early warning sign of deprivation in contexts of industrial change. It is taken directly from Shapovalova et al. (2023).
H17
Worker participation in industrial change processes
Increasing
N/A
Worker participation in industrial change processes is core to a JT, and hence directly relevant to hotspots of industrial change. Data is currently unavailable. Data collection through surveys and engagement with stakeholders like STUC is recommended.
H18
Number of premature deaths by particulate matter (PM2.5)
Decreasing
N/A
This indicator is included for both sites of industrial change and net zero developments. Decreasing emissions should decrease pollution in industrial sites, and inhabitants in these places may have also had higher historical exposure to pollutants. Increasing premature deaths by PM2.5 particulate matter in hotspots of net zero developments would be a clear warning sign of unexpected transition developments/ stagnant transitions.
This indicator monitors fuel poverty, which captures energy inequities affected by a complex array of factors. Fuel poverty could increase in areas experiencing industrial change while exacerbating felt injustices in locations hosting renewable energy production. Its inclusion also reflects the multi-dimensional aspect of transitions given that places potentially seeing negative consequences may simultaneously see e.g., falling levels of fuel poverty.
H20
Proportion of people who agree that the transition to net zero and climate resilience will support a more positive future for young people and future generations in Scotland
Increasing
Scottish Climate Survey (proposed addition from Autumn 2026)
By Local Authority – Every 3 years
This indicator provides high level overview of perceptions of the transition by and for younger people in places directly witnessing transition impacts. This indicator is only available at local authority level every three years.
H21
Proportion of people in Scotland reporting satisfaction with opportunities to influence (i) the Scottish Government’s approach to delivering net zero, and (ii) local policy and planning decisions relating to net zero
Increasing
Scottish Climate Survey (proposed addition from Autumn 2026)
By Local Authority – Every 3 years
This indicator captures the sense of influence over national and local policy relating to the transition. This is a key dimension of the JT for Scotland and directly relevant in places seeing targeted interventions and experiencing change. This indicator is only available at local authority level every three years.
H22
Proportion of people in Scotland reporting satisfaction with opportunities to influence net zero and climate adaptation developments happening in their local area
Increasing
Scottish Climate Survey (proposed addition from Autumn 2026)
By Local Authority – Every 3 years
This indicator captures the sense of influence over net zero and climate adaptation projects in hotspots. This is a key dimension of the JT for Scotland and directly relevant in places seeing targeted interventions and experiencing change. It is directly relevant for net zero development hotspots and may also be relevant in hotspots of industrial change. This indicator is only available at local authority level every three years.
H23
The proportion of people reporting that changes to their local place due to net zero infrastructure and/or land use change have maintained or improved the quality of their local area
Increasing
Scottish Climate Survey (proposed addition from Autumn 2026)
By Local Authority – Every 3 years
This indicator monitors mid-term experiences of change in sites of transition. It is directly relevant to net zero hotspots and may be relevant in industrial hotspots. It does not reflect the reasons for improved quality nor a breakdown by respondents. This indicator is only available at local authority level every three years.
How to cite this publication:
Santos Ayllón, L. M., Jenkins, K. E. H., (2026) ‘Monitoring a Just Transition to a net zero and climate resilient Scotland’, ClimateXChange. DOI:
While every effort is made to ensure the information in this report is accurate as at the date of the report, no legal responsibility is accepted for any errors, omissions or misleading statements. The views expressed represent those of the author(s), and do not necessarily represent those of the host institutions or funders.
This work was supported by the Rural and Environment Science and Analytical Services Division of the Scottish Government (CoE – CXC).C
These themes were also referred to in the Draft CCP (2025), though they do not feature in the final CCP (2026). ↑
These four ‘themes’, now widely used across Scottish Government JT policy, are different in focus and definition to four ‘themes’ in the National JT Planning Framework (2021). The latter have not been returned to since. ↑
The National Performance Framework for Scotland is currently archived and under review. ↑
The draft Energy Strategy and JT Plan (2023) refers to the eight national JT outcomes in its Annex F to translate them into energy sector outcomes. ↑
The four themes are not referred to in the final CCP (2026). ↑
Some indicators such as ‘employment’, for example, were removed from the full outcome indicator list and integrated into the hotspots monitoring approach instead. ↑
With ‘net zero infrastructure and/or land use change’ this report refers to the installation of renewable energy production and related infrastructure (power stations, transmission lines), alongside projects of woodland creation and peatland restoration for net zero and adaptation purposes. ↑
JSEO indicators 9-12 focus on the gendered dimension of fair work in the four net zero sectors identified by the Scottish Government, following advice from the Fair Work Convention Secretariat and indicators in the Draft Transport JT Plan (2025). This framework prioritises gender pay gap as a measure of structural inequity. ↑
This caveat recognises that while the net zero transition will impact industries such as oil and gas, their declining activity in Scotland is also a result of various factors other than the response to climate change. These have been affecting these industries for some time (e.g., Shapovalova et al. 2023). ↑
Location quotient calculations were provided by the industry statistics area in Scottish Government, January 2026. ↑
The minimum threshold for installed capacity was 1MW until 2021, at which point it was lowered to 150kW. This means that projects below 1MW that were going through the planning system before 2021 may not be represented. ↑
For hotspots, trend three ‘economic trends in Scotland’ should also be complemented with economic trend data in the specific local authority monitored. ↑
Research completed: March 2026
DOI: https://doi.org/10.7488/era/7056
Executive summary
Aims
This report examines how Cross Compliance contributes to Scotland’s Vision for Agriculture, and whether introducing greater ambition will support Scotland in achieving its goals.
All farmers and crofters in Scotland who receive income support under the Basic Payment Scheme must observe Cross Compliance requirements, which are a set of rules that enforce laws around animal and plant health as well as sustainable agricultural practices. Cross Compliance requirements are set as Statutory Management Requirements (SMRs) and Good Agricultural and Environmental Conditions (GAECs). Breaches of these requirements can result in a penalty applied to the value of a business’s Basic Payment Scheme payment entitlement.
The report explores the differences between the Cross Compliance rules in Scotland and EU Member States with a conditionality policy, and analyses the strengths, weaknesses and macro-environmental considerations of three selected opportunities which could be implemented to better align with Scotland’s Vision for Agriculture. A conditionality policy in this context is a rule linking EU farm income support to farmers’ compliance with essential environmental, health, welfare, and land‑management standards.
Findings
We found that the contribution of Scottish Cross Compliance to the five outcomes of the Vision for Agriculture are uneven, with stronger alignment to environmental and animal welfare outcomes, and more limited support for thriving agricultural businesses and a just transition. There was limited evidence in the literature on the implementation and outcome of more ambitious Cross Compliance approaches.
We selected three Cross Compliance opportunities based on the evidence assessment and a set of criteria, and examined them in detail:
Opportunity 1: Enhancement of buffer areas to be in line with best practice for maximum protection to nature and water pollution
Opportunity 2: Extension of management requirements to reduce soil erosion risk
Opportunity 3: Incorporation of hedgerow maintenance requirements
We identified four overarching considerations relevant to any development of the current Cross Compliance rules to better deliver on the Vision’s outcomes:
Balancing environmental ambition with profitability
Developing a strong monitoring and evidence base, including robust data to justify changes and increase the acceptability of policy adjustments
Co‑designing rules with farmers, crofters and land managers
Increasing support, training and communication
Finally, the research emphasised the importance of considering any revisions to Cross Compliance within the wider Scottish agricultural policy framework. Increasing the ambition of Cross Compliance rules in Scotland to improve outcomes may create a gap between the EU conditionality requirements and the Scottish Cross Compliance system.
Conclusions
The opportunities studied here do not constitute an exhaustive list of possible improvements to deliver better economic, environmental and social outcomes, nor an indication of future policy changes to be applied to Cross Compliance rules in Scotland. There is clear potential to strengthen the Cross Compliance rules to support the outcomes of the Vision for Agriculture, but more evidence is needed to support any future changes, as well as holistic consideration of the wider agricultural and environmental policies.
Glossary / Abbreviations table
ARC Act
Agriculture and Rural Communities Act
CAP
Common Agricultural Policy
EU
European Union
FYM
Farmyard Manure
GAEC
Good Agricultural and Environmental Conditions
MS
Member State
PESTLE
Political, Economic, Social, Technical, Legal and Environmental
RAG
Red-Amber-Green
REA
Rapid Evidence Assessment
RPID
Rural Payments & Inspections Division
SEPA
Scottish Environment Protection Agency
SMRs
Statutory Management Requirements
SOM
Soil Organic Matter
SWOT
Strengths, Weaknesses, Opportunities and Threats
Introduction
Context
Scotland’s Vision for Agriculture is to be a global leader in sustainable and regenerative agriculture (see Figure 1). Together with the accompanying Route Map[1], it outlines policies aligned with national climate change[2] and biodiversity[3] targets in a post-Brexit context. As noted in the Agriculture and Rural Communities (ARC) Act[4], the overarching objectives of agricultural policy in Scotland include:
the adoption and use of sustainable and regenerative agricultural practices,
the production of high-quality food,
the promotion and support of agricultural practices that protect and improve animal health and welfare,
the facilitation of on-farm nature restoration, climate mitigation and adaptation, and
enabling rural communities to thrive.
These five Strategic Outcomes have been developed to articulate and evidence what successful delivery of the ARC Act objectives would mean in practice for Scotland’s agriculture, rural communities and the rural economy.
Figure 1: Illustration of the five outcomes of the Scottish Vision for Agriculture
These objectives aim to create a framework that supports environmental and climate goals while ensuring the economic viability and sustainability of Scotland’s agricultural sector.
Cross Compliance
Cross Compliance is a set of rules comprising SMRs (Statutory Management Requirements) and GAECs (Good Agricultural and Environmental Conditions). SMRs are enforced by separate sectorial law in Scotland and include regulations such as the requirements for animal identification. GAECs introduce protections of natural resources such as water, soils & carbon stocks and the minimum level of maintenance required. Therefore, they align closely with Scottish Government climate priorities. Through measures such as maintaining buffer strips, limiting soil erosion or regulating hedge trimming to protect biodiversity, GAECs help mitigate environmental degradation, support ecosystem services and align with several of Scotland’s broader goals of halting biodiversity loss and improving land and water health.
The Cross Compliance rules contribute to Scotland’s environmental targets by setting baseline standards for environmental protection, climate change, good agricultural condition of land, water quality, public health, animal and plant health and animal welfare. Farmers must adhere to these rules to receive support payments, through delivering actions such as buffer strips. Cross Compliance launched in 2005 when the UK was part of the European Union (EU), and Scottish Government has retained the Cross Compliance rules since the UK left the EU in 2020.
Since the UK’s withdrawal from the EU in 2020, Scotland is no longer bound to follow the set of conditionality rules known as “conditionality” included in the Common Agriculture Policy (CAP). This means that Scotland has the legal ability to review and revise Cross Compliance to better support national outcomes and to improve effectiveness. Through the review of GAECs in Scotland there is the potential to have far-reaching climate and biodiversity impacts as roughly 17,000 farmers across Scotland are currently required to meet GAECs requirements.
Aim of this project
This research examines how Cross Compliance contributes to Scotland’s Vision for Agriculture, and to understand whether introducing greater ambition (i.e. conditionality) will support Scotland in achieving its goals. There were three key aims:
Provide clarity and understanding of the current contribution of Scottish Cross Compliance to the five outcomes of the Vision for Agriculture,
identify the opportunities and barriers to developing the current set of Cross Compliance rules to better deliver on these outcomes, including from a practical implementation or economic perspective for farmers, crofters and land managers,
gather any specific lessons from comparable nations in the United Kingdom or the European Union from developments in Cross Compliance in other jurisdictions.
The analysis focusses on GAECS, because SMRs are embedded in separate Scottish Legislation, and therefore GAECs are more likely to be flexible in terms of scope. The research project does not present an analysis of the efficiency and relevance of the current set of Cross Compliance rules in Scotland, nor recommend changing them.
This project looks at the alignment between the Cross Compliance rules and the Vision for Agriculture, exploring differences between these rules in Scotland and other nations with a conditionality policy, and analysing the strengths, weaknesses and macro-environmental considerations of three selected opportunities which could be implemented in order to better align with Scotland’s Vision for Agriculture.
Selection of Cross Compliance opportunities
To select the Cross Compliance opportunities to be analysed for the potential to expand their ambition, a Rapid Evidence Assessment (REA), and stakeholder engagement was undertaken.
Based on the findings, the contribution of the rules was mapped to the outcomes of the Vision for Agriculture, including identifying any evidence gaps, weaknesses and examples of other nations’ Cross Compliance rules showing greater ambition. Based on this assessment and stakeholder inputs, three opportunities were selected for further investigation. The methodological process followed for this project is illustrated in Figure 2.
Figure 2: The five-step approach to develop the analysis of Cross Compliance opportunities
Assessment of the published evidence
We explored the role of Cross Compliance in Scotland within the context of the Scottish Government’s Vision for Agriculture.
A structured REA approach was used to ensure transparency and rigour. A search strategy protocol, including key search terms, inclusion criteria and example search strings was developed, reviewed and agreed by the Steering Group. Evidence was gathered systematically, with searches recorded with information on search date and search engine and string used. Sources were screened for relevance and robustness, and relevant evidence was then extracted and appraised to address the research questions and identify knowledge gaps. Appendix A provides further detail and examples on the search strategy developed.
Findings and information gaps
Research question 1:
What are the Cross Compliance requirements in Scotland, which environmental benefits and limitations do they provide and how do they contribute to the Scottish Government’s Vision for Agriculture?
A list of the SMR and GAEC requirements in Scotland was compiled (Table 1) and expert judgement was used to analyse alignment with the five outcomes of Scotland’s Vision for Agriculture, scored using Red-Amber-Green (RAG) rating system:
”Strong” indicates strong alignment with the outcome,
“Partial/moderate” reflects partial or moderate alignment,
“Negligible” signifies little to no contribution toward that outcome.
This assessment demonstrates that while Scotland’s current Cross Compliance requirements contribute meaningfully to several outcomes within the Vision for Agriculture—particularly in areas such as climate change—their overall impact is uneven. Notably, Outcomes 2 (Thriving Agricultural Businesses) and 5 (Support for a Just Transition) appear to be the least well-supported by existing standards. This is consistent with the intended purpose of Cross Compliance, which focuses on maintaining baseline environmental protections rather than supporting economic or social‑equity outcomes. Nonetheless, for the purposes of this research question- assessing the extent to which current Cross Compliance requirements align with the Vision for Agriculture – these findings point to clear opportunities to improve alignment, raise ambition, and address gaps in delivery.
GAEC/SMR
Contribution to Scottish Governments’ Vision for Agriculture
Outcome 1- High Quality Food Production (inc. animal health and welfare)
Outcome 2- Thriving Agricultural Businesses
Outcome 3- Climate Change Mitigation and Adaptation
Outcome 4- Nature Restoration
Outcome 5- Support for a Just Transition
GAEC 1
Buffer strips along watercourses
Negligible
Negligible
Strong
Strong
Negligible
GAEC 2
Abstraction of water for irrigation
Negligible
Partial/moderate
Strong
Partial/moderate
Negligible
GAEC 3
Protection of groundwater against pollution
Negligible
Negligible
Strong
Partial/moderate
Negligible
GAEC 4
Minimum soil cover
Partial/moderate
Negligible
Strong
Partial/moderate
Negligible
GAEC 5
Minimum land management reflecting site specific conditions to limit erosion
Partial/moderate
Negligible
Strong
Negligible
Negligible
GAEC 6
Maintenance of soil organic matter
Partial/moderate
Negligible
Strong
Partial/moderate
Negligible
GAEC 7
Retention of landscape features
Negligible
Negligible
Strong
Strong
Negligible
SMR 1
Nitrate Vulnerable Zones
Partial/moderate
Partial/moderate
Strong
Partial/moderate
Negligible
SMR 2
Conservation of wild birds
Negligible
Negligible
Strong
Strong
Negligible
SMR 3
Conservation of flora and fauna
Negligible
Negligible
Strong
Strong
Negligible
SMR 4
Food and feed law
Strong
Negligible
Strong
Negligible
Negligible
SMR 5
Restrictions on the use of substances having hormonal or thyrostatic action and beta-agonists in farm animals
Strong
Negligible
Negligible
Negligible
Negligible
SMR 6
Pig identification and registration
Strong
Negligible
Negligible
Negligible
Negligible
SMR 7
Cattle identification and registration
Strong
Negligible
Negligible
Negligible
Negligible
SMR 8
Sheep and goat identification
Strong
Negligible
Negligible
Negligible
Negligible
SMR 9
Prevention and control of TSEs
Strong
Negligible
Partial/moderate
Partial/moderate
Negligible
SMR 10
Restrictions on the use of plant protection products
Partial/moderate
Negligible
Partial/moderate
Strong
Negligible
SMR 11
Welfare of calves
Strong
Negligible
Strong
Negligible
Negligible
SMR 12
Welfare of pigs
Strong
Negligible
Strong
Negligible
Negligible
SMR 13
Welfare of farmed animals
Strong
Negligible
Strong
Negligible
Negligible
Table 1: Contribution of Cross Compliance requirements to Scottish Governments’ Vision of Agriculture.
Environmental benefits of current Cross Compliance regulations
Information on the environmental benefits of Cross Compliance in Scotland is available in the literature, however available evidence on environmental limitations is limited and largely pre-2020. Based on interviews with the Scottish Government and its agencies, a study by Blackstock et al., 2018 found:
Concerns that policy instruments that could address soil protection were not as well implemented as they could be (including under GAECs)
There is scope to strengthen soil protection under the GAECs, and;
There is potential for policy instruments, including GAECs, to deliver greater biodiversity outcomes if requirements were redesigned or implemented differently.
More recent analysis of the environmental limitations of Cross Compliance was not identified. In this context, ‘environmental limitations’ refers to areas where current Cross Compliance requirements may not fully address all environmental pressures, including emerging risks.
Table 2 presents a summary of the environmental benefits of GAECs (the study was focused on GAECs). A full list including the environmental benefits of SMRs is presented in Appendix B.
Table 2: Main environmental benefits associated with GAEC rules
Biodiversity support; supports air and water quality; Climate change mitigation
7 – Retention of landscape features
Nature conservation ; Climate change mitigation
Barriers to implementation
We also identified barriers which can limit the effectiveness of Cross Compliance as a tool for changing the management practises of farmers, crofters, and land managers in Scotland and more widely in the EU. These include:
Administrative burden: The administrative burden of Cross Compliance, primarily the time and effort required both understand requirements and maintain/collate evidence to demonstrate compliance has been widely discussed and remains a major concern despite attempts by public authorities to reduce the burden. Minimising the administrative burden of Cross Compliance can increase the efficiency of agricultural policy. (El Benni et al., 2025)
Lack of awareness and training: A lack of awareness around the environmental benefits of compliance indicates the need for a cultural shift within the farming sector. Improved training and communication could help build understanding of how Cross Compliance supports water quality, soil health, biodiversity, and long-term business sustainability. Emphasising the value of environmental protection as part of business resilience, not just for regulatory purposes, may encourage uptake (Blackstock et al., 2018)
Fear of penalties and inspections: Some farmers and land managers expressed concerns over the risk of prosecution and fines, particularly due to the complexity of rules and fear of inadvertent non-compliance (MacLeod et al., 2008 and Blackstock et al., 2018). This apprehension around inspections can discourage engagement with compliance measures.
Limited access to advice and guidance: Earlier studies (Baldock et al., 2013 and Bennett at al., 2006) highlighted challenges in accessing clear, practical guidance on Cross Compliance across both Scotland and the EU and suggested that existing support mechanisms were not always user-friendly or well-communicated. While current guidance is now clearly set out by Rural Payments and Services, farmers may still experience difficulties in navigating complex requirements or knowing where to look for further information.
Research question 2: Are there any other UK devolved administrations and/or EU Member States (MS) which have shown greater ambition beyond the basic Cross Compliance requirements?
A key challenge in exploring the second research question was the limited literature sources focussing specifically on Cross Compliance ambition. Many references concentrated on eco-schemes or agri-environment schemes, which, while related, fall outside the scope of this project. Among the sources addressing Cross Compliance directly, the emphasis was often on inspections, breaches, and the communication or interpretation of regulatory requirements rather than their ambition beyond the basic Cross Compliance requirements.
While some sources provided insights into how individual European Member States and other UK devolved administrations implement Cross Compliance, it was often unclear whether these examples represented the most ambitious approaches relative to other countries. In a few cases, sources suggested that certain countries go beyond the basic requirements; however, there was a lack of detailed information on how these enhanced measures were implemented, the outcomes achieved, and any barriers or lessons learned. Table 4 presents some examples. As previously indicated, these examples do not cover each GAEC individually, and it remains unclear whether they represent the most ambitious approaches across Member States. As such, the insights should be interpreted as indicative rather than comprehensive. The examples also largely draw on earlier CAP programming periods, given that comprehensive analysis of implementation and outcomes under the new CAP is less available.
Table 4: Examples of Cross Compliance rules in EU MS presented a wider scope than Scotland
Country
Cross Compliance requirements going beyond current GAEC requirements in Scotland
Related Scottish GAEC
References
France and Spain
Management of irrigation systems.
GAEC 2
Farmer, M. and Swales, V., 2004.
France
Unfertilised buffer strips of 5–10 metres width along watercourses.
GAEC 3
European Court of Auditors, 2008
Belgium Flanders
Soil analysis (measure related to soil erosion)
GAEC 5
Farmer, M. and Swales, V., 2004
Netherlands
Notification of more than normal erosion and submit a plan with the measurements they take to adequately fight this erosion
Application of soil treatment measures: targeted post-harvest soil tillage/ wiping tractor-wheel lines and seeding maize and sugar beet/use of follow up green manure crop after cereal and maize/Create water flow-hindering provisions at beneath-side of parcels
Prohibition to exploit soils with slope of 18% or more in another way than grassland
Insurance that permanent pasture area (used as grassland for a period of 5 years or more) does not decline
Jongeneel, R. and Brouwer, F., 2007
France
In the category of other soil erosion standards, France has established an obligation to set up buffer stripes along watercourses. The standard requires farmers who have a watercourse present on the farmland, to set up 5m-10m buffer zones (grass strips)
Kristensen, L. and Primdahl, J. (2006)
Netherlands
Farmers are to report cases of extraordinary erosion
Greece & Lithuania
Arable stubble: incorporation in soil or grazing
GAEC 6
Kristensen, L. and Primdahl, J. (2006)
Czech Republic
Application of liquid manure
Netherlands & Italy
Green cover on set aside land
France & Germany
Crop rotation providing a yearly cultivation of at least three crops (excluding permanent crops)
Greece
Cultivate grain legumes and incorporate these into the soil on 20 % of the cultivated area of their farm each year to improve soil organic matter (SOM)
European Court of Auditors, 2008
Denmark
No tillage is allowed on soils with >12% carbon within protected areas
Environmental Pillar, 2025
Due to limited published evidence, we were unable to draw meaningful comparisons with other jurisdictions. The matrix developed and presented in Appendix C provides a high-level overview of EU GAECs that most closely align with the Scottish GAECs, highlights the countries implementing the greatest number of farm practices under these standards, and presents a selected Member State (based on similarity to Scotland climate and agriculture) to illustrate key farm practices and potential opportunities for development of existing GAEC requirements relevant to Scotland. These potential opportunities include:
GAEC 1- Ploughing bans/restrictions
GAEC 4- Summer cover crop; ban of ploughing grassland
GAEC 5- low/no till; Presence of other unproductive areas and strips
GAEC 6- Crop residues left on soil; biodiversity plan
GAEC 7- Maintenance and conservation of field margins
The review of published evidence highlighted significant knowledge gaps, and the information available was largely high-level, meaning the insights gathered were not sufficient to identify clear opportunities for Scotland to address the five outcomes of the ‘Vision for Agriculture’ through the current Cross Compliance requirements.
Conclusion
The review of the published evidence found that Scotland’s Cross Compliance requirements align most strongly with environmental and animal welfare outcomes of the Vision for Agriculture but offer limited support for business resilience and a just transition. This is as expected given Cross Compliance’s environmental protection remit. While evidence of more ambitious approaches beyond the baseline was identified, this was generally high-level and often lacked detail on implementation or outcomes. As a result, whilst potential opportunities for Scotland do exist, the lack of detailed evidence makes it challenging to understand how these approaches could be used to enhance Cross Compliance in support of all five Vision outcomes.
Stakeholder engagement
The project engaged with stakeholders through a series of structured interviews and workshops to build on the findings of the REA. The first workshop presented the REA results and worked with expert stakeholders to provide Scottish context, helping to refine the research focus and develop a shortlist of Cross Compliance rules considered to have the greatest potential for positive impact.
The second workshop held with policy experts and the structured interviews focused on a deeper exploration of the selected Cross Compliance opportunities, identifying their strengths, weaknesses and the main macro-environmental factors to be considered, if a change in Cross Compliance rules was implemented.
The stakeholder engagement process involved first the development of a Stakeholder Engagement Plan, an Interview Guide and a Workshop Guide. We conducted 3 structured interviews with experts and then held the first workshop with industry representatives to identify the opportunities to be further analysed. We then conducted a second workshop with Scottish Government representatives and 4 structured interviews with experts to complement and refine our opportunity analysis.
The list of organisations which attended the workshops is presented in Appendix D and the main findings are presented in section 4.1.2.
Stakeholder Engagement research findings
In addition to supporting the identification of opportunities, stakeholders provided input on wider considerations on whether Cross Compliance could or should be evolved to better support the Vision for Agriculture.
Lack of alignment of Cross Compliance with the Vision for Agriculture: Both the literature analysis and the stakeholder engagement identified that the Vision for Agriculture and the present GAECs are aligned largely on Outcome 3 (Climate Change Mitigation and Adaptation) and to some extend to Outcome 4 (Nature Restoration). Some stakeholders highlighted that compliance with Cross Compliance rules allows the full payment of support schemes such as the Basic Payment Scheme or the Less Favoured Area Support Scheme, and in that regard plays a significant role in contributing to thriving rural communities (Outcome 2), by helping to maintain farm incomes. However, Cross Compliance was created with the intent to help maintaining baseline environmental protections, rather than supporting economic or social‑equity outcomes.
The need to balance environmental ambition and business profitability, within a broader policy framework: Stakeholders repeatedly highlighted the importance of balancing environmental or social ambition with profitability and farmer’s buy-in. Increasing the level of requirements in the Cross Compliance rules presents some cross-cutting risks such as:
competitiveness concerns for farmers, crofters and land managers if the enforcement of these rules imply investments, a reduction of productive land, are more labour-intensive, increase the administrative burden, etc.
Reduced compliance and decrease in enforcement rates, if the rules are not well understood or deemed impractical. This could necessitate more frequent controls from enforcement authorities, that would place an additional burden on public finance.
An increased number of farmers, crofters or land-managers deciding not to claim Basic Payments, and therefore no longer subject to GAECs, leaving greater gaps in environmental protection.
Several stakeholders stressed the need to consider GAECs within the broader Scottish agricultural policy framework, as Cross Compliance rules interact with other policy mechanisms such as Greening, Tier 2, Agri Environment Climate Scheme, Whole Farm Plan and wider environmental policies and regulations, in order to avoid disconnections and gaps.
An increase of the environmental ambition of the current Cross Compliance rules could be achieved by introducing new requirements, strengthening the existing ones or by shifting some practices which are currently incentivised by other policy mechanisms such as the Agri-Environment Climate Scheme into the baseline requirements. Depending on the changes, some GAECs may be strengthened without major administrative or economic burden, whereas others may deliver better outcomes with some support through incentivised schemes.
The involvement of Scottish farmers, crofters and land managers in a co-design process of the rules: The importance of adopting a multi-stakeholder approach to design policy instruments is widely recognised (Reed, M., 2008). Stakeholder participation increases the quality of environmental decisions, improves the legitimacy of the instruments and the likelihood of their adoption. Stakeholders emphasised the importance of engaging with the farming community and co-designing any changes in Cross Compliance rules to ensure practicality, increase buy-in and improve compliance and therefore effectiveness. Several ideas were mentioned, such as the possibility of involving farmers, crofters and land managers in monitoring and self-regulation to improve engagement or strengthen education and awareness by linking compliance to visible environmental outcomes.
The need for support, training & communication: The importance of improved access to advice, training, and communication has been repeatedly highlighted during the stakeholder engagement activities. For example, soil poaching by livestock near watercourses is a relatively common breach, often due to lack of awareness or habitual livestock management. Training and advice are key to improve compliance, as cumulative impacts of small breaches are poorly understood by farmers.
Information gaps identified
Stakeholder interviews and workshops highlighted several additional research possibilities, which build on the information gaps identified in section 4.1.1. Further research, as detailed below, could improve understanding of how current Cross Compliance supports Scotland’s Vision for Agriculture. It could also indicate how greater ambition in Cross Compliance requirements could support Scotland achieve its goals.
Strengthening monitoring and scientific evidence, with standardised collation between different farm visit and inspection teams. Stakeholders highlighted the importance of providing evidence-based elements to support any changes in the baseline of Cross Compliance requirements to increase their acceptability. However, the desk-based research performed in this project highlighted the current lack of robust monitoring and evaluation data on GAEC rules and their contribution to economic, environmental or social outcomes.
A broader mapping of the interaction between the Cross Compliance requirements and the other following schemes included in the Scottish agricultural policy framework, as they related to support of Scotland’s Vision for Agriculture objectives:
Legal requirements which apply to farmers beyond Cross Compliance (e.g. the General Binding Rules in the Environmental Authorisations (Scotland) Regulations 2018),
The Whole Farm Plan
Greening
The Agri-Environment Climate Scheme
Farm assurance schemes in Scotland.
A detailed assessment of comparable EU countries’ Cross Compliance guidelines, to understand real-world standards and practices and their contribution to goals aligned with Scotland’s Vision for Agriculture objectives. This could include a review of the post-2028 CAP proposal to replace enhanced conditionality with “protective practices”.
Selection of opportunities
Based on the results of the evidence assessment, we identified three opportunities for further investigation based on the following criteria:
Does this opportunity address at least one outcome of the Vision for Agriculture?
Has this opportunity been implemented elsewhere, to benefit from any lessons learnt?
Is this opportunity already covered or partly covered by another Scottish Policy?
Can this opportunity be monitored?
The GAECs selected for further analysis in the final stage of the project were:
Opportunity 1: Enhancement of buffer areas to be in line with best practice for maximum protection to nature and water pollution (related to GAEC 1 – Buffer strips along watercourses)
This section covers an analysis of the Strengths, Weaknesses, Opportunities and Threats (SWOT), and a high-level assessment of the Political, Economic, Social, Technical, Legal and Environmental (PESTLE) factors associated with the shortlisted opportunities. This analysis was completed using Ricardo’s in house expertise and judgement and findings from the stakeholder engagement activities performed during this project. The full analysis for each opportunity is presented in SWOT and PESTLE tables in Appendix E.
Across all three opportunities, the analysis shows some cross-cutting findings: each option provides additional environmental benefits that contribute to the outcomes of Scotland’s Vision for Agriculture, particularly on climate action, nature restoration, and long‑term resilience. All measures strengthen protection of natural assets: buffer strips or areas improve water quality and riparian habitats; erosion‑focused rules safeguard soils and reduce flood risk; and hedgerow maintenance enhances habitat connectivity, carbon storage and shelter for livestock. These opportunities also support the delivery of stronger environmental standards and visibly demonstrate stewardship, meeting high public expectations.
However, this higher environmental ambition comes with challenges. Each opportunity presents greater management complexity, often requiring a more detailed appreciation of local environmental conditions, seasonal planning, or active maintenance. This raises the cognitive burden on farmers, crofters and land managers, especially where holdings have varied soils, slopes, or landscape features. A recurring theme is the need for substantial advisory support, training, and user‑friendly guidance to bridge knowledge gaps and ensure proportionate, practical rules. All options also increase monitoring and enforcement demands on government, particularly where requirements are context‑specific or condition‑based.
Economically, short‑term costs created by land taken out of production, changes in practice, or additional labour may be balanced by longer‑term productivity and resilience gains, such as reduced soil loss, improved water management, and healthier ecological networks. Politically, all three opportunities align well with current EU conditionality requirements but could be exposed to future divergence, as the EU sets out potential new changes for the future of conditionality. Social considerations also emerge across all opportunities, including the need to ensure fairness between upland and lowland systems, the risk of placing disproportionate demands on smaller farms and crofts, and the possibility of pushback if the rules are viewed as inflexible or overly demanding.
Overall, the common message is that the environmental case for improvement is strong, but successful implementation depends on clarity, flexibility, and well‑resourced support – ensuring that higher ambition complements, rather than compromises, the viability of agricultural businesses.
Opportunity 1: Enhancement of buffer areas to be in line with best practice for maximum protection to nature and water pollution
Opportunity description
This opportunity relates to GAEC 1, which covers buffer strips along watercourses[5], among other practices to protect water against pollution. The requirements, which seek to restrict the storage, application of fertilisers and pesticides and cultivations along watercourses, cover the following:
Application of manure/fertiliser at a certain distance from a water course or during certain conditions;
Location of field heaps/storage of manure on holding at certain distances from water courses;
Cultivation of land a certain distance from top of a bank (exemptions apply).
GAEC 1 was explored as a potential opportunity for improvement to further support and align with the aims of the Vision for Agriculture, particularly outcomes 3 and 4. The proposed opportunity covers an enhancement of buffer areas to increase protections to nature and reduce water pollution, by following best practices guidelines focusing on soil type, watercourse type, buffer strip width, buffer strip species composition, and buffer zone size, based on the REA results with examples from other countries.
Other countries, particularly those in the EU following conditionality rules, have set out various ranges and compositions of buffer zones. GAEC 4 in the EU conditionality rules refers to the establishment of buffer strips along water courses[6]. For example, Ireland, which has similarities in cropping systems to Scotland, has a wider range of buffer zone distances (from 3-250m) for spreading organic fertiliser, and for the storage of farmyard manure (FYM) depending on the type of waterbody and cropping activity. In addition, some EU countries go above the basic GAEC requirements and include practices such as restricting certain crop species, or including specific soil management actions along watercourses.
Summary of the findings
The SWOT and PESTLE analysis identified the potential for strong environmental benefits through the enhancement of watercourse buffer areas. Wider and better‑designed buffer strips help reduce nutrient and soil runoff, which improves water quality and creates healthier habitats along watercourses. Adjusting buffer width, vegetation and management to local soil, slope and watercourse conditions makes them more effective, especially during heavy rainfall. This approach is in line with good practice across a number of EU Member States’ approaches and supports climate adaptation by reducing erosion, stabilising soils and improving soil carbon storage capacity.
However, the changes would make farm management more complex. Different buffer widths and management rules increase the amount of information farmers must keep track of and require greater knowledge of local soils and water systems. Smaller farms or crofts with a higher proportion of land adjacent to watercourses may lose more productive area, which could disproportionately affect their income and long‑term business viability. Regulators would also face higher monitoring demands, as they would need to check site‑specific requirements. In the short term, farmers may face a reduction of productive land and additional maintenance load, although over time the benefits – such as lower water treatment costs and reduced damage from erosion – could be significant.
Finally, farmers, crofters and land manager may push back, and compliance levels may suffer if the rules feel too complicated or punitive, especially without good advisory support.
The full analysis of strengths, weaknesses, opportunities, threats and wider macro-environmental factors is presented in Appendix E, section 8.1.
Opportunity 2: Extension of management requirements to reduce erosion risk
Opportunity description
This opportunity relates to GAEC 5, which currently covers minimum land management reflecting site specific conditions to limit erosion and aims to protect soil against erosion in certain situations. The requirements cover the following:
Limit erosion from overgrazing or heavy poaching by livestock.
Put in place measures to limit soil erosion if conditions prevent subsequent crop or cover from being sown (e.g., grubbing and sediment traps/fences)
GAEC 5 was explored as a potential opportunity for improvement to further support and align with the aims of the Vision for Agriculture, particularly outcome 3. The opportunity covers an inclusion of tillage restrictions on specific areas to reduce the risk of erosion.
For EU countries, GAEC 5 is broad and designed to “prevent soil erosion through relevant practices” and different Member States have specific variations on GAEC 5 rules. For example, Ireland includes tillage management rules for both arable and grassland areas:
For grassland parcels, Ireland’s GAEC 5 mandates that there is no ploughing allowed between the 16th of October and 30th of November, and no ploughing on land with a ≥20% slope between the 1st and 31st of December.
For arable land, there is no ploughing on land with a ≥15% slope between 1st and 31st of December; if arable land is ploughed between 1st of July to the 30th of November, farmers must sow a green cover within 14 days of ploughing.
In France, ploughing is prohibited downhill during the most sensitive periods (from 1st of December to 15th of February), specifically on plots located on slopes greater than 10%. While there are some exemptions, this greatly reduces soil erosion impacts in these fields.
Summary of the findings
Strengthening erosion‑risk management would bring clear environmental and climate benefits. Limiting tillage on steep or vulnerable land, or during high‑risk periods, helps reduce soil loss and prevents sediment reaching watercourses. These measures improve soil structure, support better water infiltration and reduce runoff, offering stronger protection during increasingly frequent heavy rainfall. Evidence from other countries shows that these targeted restrictions work well in practice and support long‑term soil health.
At the same time, this opportunity would add complexity for farmers. Erosion risk varies widely across Scotland, so rules may differ by field, slope or season. This means farmers may need to build additional knowledge about erosion risks and suitable management options and may have to adjust operations based on conditions each year. Some measures could also reduce flexibility in how land is managed, particularly where steep slopes or varied topography are involved, which may cause concern. The monitoring burden for Scottish Government would also increase due to the need to check more detailed and time‑sensitive requirements.
Short‑term costs may arise through changes to current practice, for example, fencing to protect sensitive areas or establishing ground cover more frequently. But over time, better soil management can deliver important economic benefits, including maintaining soil fertility, reducing remediation needs and preventing more serious erosion damage. As with the other opportunities, acceptance will depend on clear guidance, practical support, and rules that take account of different farm systems and landscapes.
The full analysis of strengths, weaknesses, opportunities, threats and wider macro-environmental factors is presented in Appendix E, section 8.2.
Opportunity 3: Incorporation of hedgerow maintenance requirements
Opportunity description
This opportunity relates to GAEC 7, which currently covers retention of landscape features to protect them. The current GAEC requires the following:
Dry stone or flagstone dykes, turf and stone-faced banks, walls, hedges, ponds, watercourses or trees must not be removed or destroyed without consent.
No hedges trimming or lopping of tree branches during the bird nesting and rearing season (there are some exemptions).
No cultivation of land within two metres of the centre line of a hedge (exemptions apply)
No application of fertilisers (organic manure, chemical or nitrogen) or pesticides within two metres of the centre line of a hedge (exemptions apply).
GAEC 7 was explored as a potential opportunity to incorporate hedgerow maintenance requirements in Scotland to further support and align with the aims of the Vision for Agriculture.
GAEC 7 in Scotland is equivalent to GAEC 8 in the EU[7], which requires the maintenance of non-productive areas and landscape features, and the retention of landscape features, including hedgerows. As noted previously, other countries have variations on the rules, going further than the minimum requirement. For example, in France, hedges less than or equal to 10 metres wide must be managed for biodiversity, and a hedge may not have any discontinuity (“gap” or portion of the linear feature containing elements that do not meet the definition of a hedge) greater than 5 metres. In Ireland, there is a specific focus on invasive species control on landscape features and non-productive areas, and any replacement hedgerows must consist of traditional local species.
Summary of the findings
Introducing hedgerow maintenance requirements would provide a wide range of environmental, climate and landscape benefits. Well managed hedgerows improve biodiversity, support wildlife movement, store carbon and help reduce wind erosion and runoff. They also play an important role in farming systems by providing shelter for livestock and contributing to healthier soils and water. International experience shows that active management – such as planned cutting, gap filling and using appropriate species – greatly improves hedgerow condition and long‑term function.
However, moving from basic protection to active maintenance increases the workload and knowledge required of farmers. Hedgerows vary in age, type and condition, so it can be difficult to apply one set of rules that fits all situations. This means farmers may need new advice on cutting cycles, species selection and how to manage gaps, while inspectors may need to make more judgement‑based assessments of hedge condition. These factors make monitoring and enforcement more challenging and may increase costs for both farmers and government.
Although farmers could face new short‑term costs – such as replanting, gap filling and more regular maintenance – the potential longer‑term gains could be substantial, including reduced erosion, healthier ecosystems, and improved animal welfare through increased livestock shelter. Public support is likely to be high because hedgerows are visible features and strongly associated with a well‑managed rural environment.
The full analysis of strengths, weaknesses, opportunities, threats and wider macro-environmental factors is presented in Appendix E, section 8.3.
Conclusion
This project examined how Cross Compliance contributes to Scotland’s Vision for Agriculture, and whether introducing greater ambition will support Scotland in achieving its goals. We delivered an analysis of three selected opportunities of enhanced Cross Compliance rules. The selected opportunities do not constitute an exhaustive list of possible improvements to deliver better economic, environmental and social outcomes, nor an indication of future policy changes to be applied to Cross Compliance rules in Scotland.
Current Contribution of Cross Compliance to the Vision for Agriculture
Mapping the current Cross Compliance rules against the five outcomes of the Vision for Agriculture has clarified where Scotland already has a solid foundation (particularly for Outcomes 3 and 4), and where opportunities exist to strengthen alignment.
The project emphasised the importance of considering any revisions to Cross Compliance within the wider Scottish agricultural policy framework, given the interactions between Cross Compliance and mechanisms such as Greening, Tier 2 schemes, the Agri Environment Climate Scheme, Whole Farm Plans, and broader environmental policies and regulations.
Opportunities and barriers to enhanced Cross Compliance
Across the literature, stakeholder engagement, and the analysis of three selected opportunities, a set of cross-cutting themes have been identified.
Common strengths and opportunities
Enhancing environmental ambition within Cross Compliance through wider buffer areas, strengthened erosion‑control measures, or more active hedgerow maintenance could deliver additional benefits for water quality, biodiversity, soil health, carbon storage, and climate resilience.
Several improvements would allow for more targeted, locally tailored requirements rather than uniform rules, such as differentiating rules by soil type, slope, etc. Stakeholders noted that this approach is fairer, avoids placing disproportionate burdens on certain farms or crofts, and is likely to deliver better environmental outcomes as it directs effort to the places where risks are highest and benefits greatest.
These environmental gains could also support long‑term business resilience, for example by reducing erosion damage, improving soil structure, and moderating the impacts of extreme weather.
Shared constraints and risks
Increasing ambition introduces greater management complexity for farmers, crofters and land managers, and raises the risk of unintentional non‑compliance. For the Scottish Government, there is a risk of increased enforcement challenges where rules are highly site specific or qualitative.
Stronger rules could lead to increased short‑term economic costs, such as reduced productive area or additional labour, and may create perceptions of competitive disadvantage.
There is a consistent need for clear guidance, tailored training, advisory support, and co‑design with farmers, crofters and land managers to ensure rules are both practical and acceptable.
The analysis also highlighted the strong role for digital tools, remote sensing, mapping, and precision technologies to support targeting and monitoring. Overall, stakeholders emphasised that environmental ambition must be balanced with profitability, fairness, and proportionality, and must be considered alongside the suite of other policy instruments that also contribute to the Vision’s outcomes.
Lessons from Other Jurisdictions
This project gathered lessons from EU Member States on increasing the ambition of Cross Compliance rules. We identified examples of stronger or more specific requirements, which offered useful indications of possible directions for Scotland. However, the evidence base was high‑level, fragmented, and often outdated, with limited detail on implementation, enforcement, practical delivery, cost-effectiveness or observed outcomes. This makes it difficult to determine which international approaches are genuinely most effective, or most relevant to the Scottish context.
Key information gaps
The literature review found limited evidence on the implementation and outcome of more ambitious Cross Compliance approaches. The project identified several information gaps, limiting Scotland’s ability to make well‑evidenced decisions about increasing ambition within Cross Compliance.:
Limited monitoring and evaluation data on how existing Cross Compliance requirements perform in practice, and on their contribution to environmental, economic or social outcomes.
Lack of detailed implementation evidence from other countries, particularly on costs, compliance, enforcement, and effectiveness.
Unclear interactions between Cross Compliance and other Scottish policy instruments such as Tier 2, Agri Environment Climate Scheme, Whole Farm Plans or Greening, making it difficult to assess the overall contribution to the Vision for Agriculture.
Ambiguity around future EU conditionality developments, and how Scotland might seek to enhance the Cross Compliance ambition without creating unintended divergence between the EU conditionality and the Scottish Cross Compliance systems.
General considerations
The findings indicate that Scotland has clear opportunities to strengthen environmental outcomes through Cross Compliance. This project identified some overarching considerations for developing the current set of Cross Compliance rules to better deliver on the Vision’s outcomes:
Balancing environmental ambition with competitiveness
Developing a strong monitoring and evidence base, including robust data to justify changes and improve the acceptability of policy adjustments
Co‑designing rules with farmers, crofters, and land managers
Increasing support, training and communication
References
Baldock, D., Desbarats, J., Hart, K., Newman, S., and Scott, E. (2013) “Assessing Scotland’s Progress in the Environmental Agenda”. Institute for European Environment Policy: London.
Bennett, H., Osterburg, B., Nitsch, H., Kristensen, L., Primdahl, J. and Verschuur, G., 2006. Strengths and Weaknesses of Crosscompliance in the CAP. EuroChoices, 5(2), pp.50-57.
Blackstock K.L, Juarez-Bourke A, Maxwell J.L., Tindale S., Waylen K.A (2018) “Aligning Policy Instruments for Water, Soil and Biodiversity”, Report, James Hutton Institute, Aberdeen, 24pp
Farmer, M. and Swales, V (2004). The development and implementation of Cross Compliance in the EU 15: an analysis (p. 84). Institute for European Environmental Policy.
Farming for a better climate (n.d) -Regenerative Agriculture: Keeping soil covered- practical guide
Friends of the Earth Europe (2022) CAP Strategic Plans: Green Deal or No Deal? . [Online] Available at: FRI-22-Pac-UK6.pdf
MacLeod, Moxey, McBain, Bevan, Bell, Vosough Ahmadi and Evans. (2008) “Overview of costs and benefits associated with regulation in Scottish agriculture”. SAC Commercial Ltd, Pareto Consulting, Sue Evans Research
Reed, M. (2008). Stakeholder participation for environmental management: A literature review. Biological Conservation, Volume 141, Issue 10, Available at: https://doi.org/10.1016/j.biocon.2008.07.014
TITLE-ABS-KEY “Scotland” AND “(“Cross Compliance” OR “GAEC” OR “SMR”) AND “environmental” (“benefits” OR “limitations”)
TITLE-ABS-KEY “Scotland” AND (“Cross Compliance” OR “GAEC” OR “SMR”) AND current “environmental” (“weakness* OR “gaps” OR “limitations”)
TITLE-ABS-KEY “Scotland” AND “(“Cross Compliance” OR “GAEC” OR “SMR”) AND (“implementation” OR “Delivery”) AND (“Barrier*” OR “Challenge*”) AND (“Farmer*” OR “Crofter*”)
Research question 2:
TITLE-ABS-KEY (“European” OR “member state” OR “Defra” OR “Welsh Government” OR “Irish Government”) AND “ambition” AND “beyond” AND “Cross Compliance”
TITLE-ABS-KEY “*” AND (“Implementation” OR “Delivery”) AND (“Outcomes” OR “findings”)
*name/detail of increased ambition requirement
Screening criteria
Literature was screened for information on the following inclusion criteria
Cross Compliance environmental benefits and limitations (REA Section 1)
Barriers to implementation of current Cross Compliance requirements for farmers and crofters (REA Section 1)
Cross Compliance requirements contribution to the Scottish Government’s Vision for Agriculture (REA Section 1)
Cross Compliance gaps or areas of current weakness related to environmental outcomes (REA Section 1)
Countries which have shown/ are showing requirements with greater ambition beyond the basic Cross Compliance requirements (REA Section 2)
How these requirements have been implemented, outcomes achieved, barriers to implementation, unexpected consequences and lesson learnt (REA Section 2)
Cross Compliance requirements and associated environmental benefits
limit further greenhouse gas emissions (must not ploughing/reseeding rough grazing or other semi-natural areas; not draining wetlands; not removing/burning scrub and gorse; not carrying out muirburn outside the burning season
Overview of GAEC Implementation in the EU: country-level practices and opportunities for Scotland
This table provides a high-level overview of EU GAECs that most closely align with the Scottish GAECs, highlights the countries implementing the highest number of farm practices under these standards, and presents a selected Member State (based on similarity to Scotland climate and agriculture) to illustrate key farm practices and potential opportunities relevant to Scotland.
GAEC
Associated/most closely related GAEC (EU)
Countries implementing the most farm practices under the GAEC
Country chosen for comparison
Farm Practices codes implemented – high level description of basic practices
Farm Practices codes implemented – high level description of more niche practices
Potential opportunities to investigate for Scotland
GAEC 1
GAEC 4 – Establishment of buffer strips along water courses
Czech Republic
Denmark
Greece
France
Hungary
Italy
Luxembourg
Denmark
Maintenance and conservation of unproductive buffer strips along water courses
Bans or restrictions of ploughing on limited areas of the arable field
Ban of plant protection products along water courses
Ban on fertilisation along water courses
Ban of some crop species
Soil management
Soil management
Bans or restrictions of ploughing on limited areas of the arable field
Ban of some crop species
GAEC 4
GAEC 6 – Minimum soil cover to avoid bare soil in periods that are most sensitive
Bulgaria
Germany
Croatia
The Netherlands
Slovakia.
The Netherlands
Intermediate cash crops
Catch crops
Crop residues left on soil, leaving stubbles on the field
Winter cover crop
Green cover on permanent crops
Soil cover
Ban of ploughing of grassland
Mulching
Summer cover crop
Intermediate cash crops
Catch crops
Winter cover crop
Green cover on permanent crops
Soil cover
Ban of ploughing of grassland
Mulching
Summer cover crop
GAEC 5
GAEC 5 – Tillage management, reducing the risk of soil degradation and erosion, including consideration of the slope gradient
Austria
Germany
Luxembourg
Luxembourg
Maintenance and conservation of unproductive buffer strips along water courses
Terraces
Presence of landscape features
Other unproductive areas and strips (excluding fallows)
Low input systems
Low tillage
No tillage
Restriction on tillage (timing, direction in slopes…)
Tillage
Other practices to combat erosion
Soil management
Buffer strips against soil erosion
Ban of ploughing of grassland
Grassland management
Grassland and grazing
Maintenance and conservation of terraces
Presence of other unproductive areas and strips
Machinery use
Maintenance and conservation of unproductive buffer strips along water courses
Terraces
Presence of landscape features
Other unproductive areas and strips (excluding fallows)
Low input systems
Low tillage
No tillage
Restriction on tillage (timing, direction in slopes…)
Tillage
Other practices to combat erosion
Soil management
Buffer strips against soil erosion
Ban of ploughing of grassland
Grassland management
Maintenance and conservation of terraces
Presence of other unproductive areas and strips
Machinery use
GAEC 6
GAEC 2- Protection of wetland and peatland
Austria
Denmark
Greece
Sweden
Spain
Germany
Lithuania
Sweden
Wetland maintenance and conservation
Peatland maintenance and conservation
Low tillage
Tillage
Soil management
Drainage restrictions
Restriction on tillage (timing, direction in slopes.)
Crop residues left on soil, leaving stubbles on the field
Crop residues left on soil, leaving stubbles on the field
GAEC 3- Ban on burning arable stubble, except for plant health reasons
Belgium (F)
Greece
Malta
Portugal
Belgium (F)
No burning of crop residues
Biodiversity plan
Biodiversity plan
GAEC 7
GAEC 8- Minimum share of agricultural area devoted to non-productive areas or features
Austria
Belgium (W)
Cyprus
Greece
Germany
France
Hungary
Italy
Romania
Belgium (W)
Ban and restrictions of fertilisers on limited areas of the field other than along water courses
Mowing or grazing obligations on limited areas of the field other than along water courses
Maintenance and conservation of hedges/wooded strips
Maintenance and conservation of isolated trees
Maintenance and conservation of group of trees/field copses
Maintenance and conservation of trees in line
Maintenance and conservation of field margins
Maintenance and conservation of patches
Maintenance and conservation of unproductive buffer strips along water courses
Ponds
Small wetlands
Ditches
Streams
Stone walls
Terraces
Other landscape features
Seeded flower areas/strips
Strips for other aims
Other unproductive areas and strips (excluding fallows)
Landscape
Bans or restrictions on the use of plant protection products on limited areas of the field other than along water courses
Land laying fallow
Cultivation of Nitrogen fixing/protein crops
Bans or restrictions of ploughing on limited areas of the arable field
Restriction of timing of activities (seasonal or daily) for wildlife
Other bans or restrictions on limited areas of the field other than along watercourses
Other obligations on limited areas of the field other than along watercourses
Seeded areas/strips
Mowing or grazing obligations on limited areas of the field other than along water courses
Maintenance and conservation of field margins
Maintenance and conservation of patches
Maintenance and conservation of unproductive buffer strips along water courses
Other landscape features
Seeded flower areas/strips
Strips for other aims
Other unproductive areas and strips (excluding fallows)
Landscape
Land laying fallow
Cultivation of Nitrogen fixing/protein crops
Bans or restrictions of ploughing on limited areas of the arable field
Other bans or restrictions on limited areas of the field other than along watercourses
Other obligations on limited areas of the field other than along watercourses
Seeded areas/strips
Other EU GAECs
GAEC 1
Czech Republic
Luxembourg
Denmark
Luxembourg
Grassland management
No conversion of grassland into other uses
No tillage
GAEC 7
Czech Republic
Germany
Spain
Ireland
Luxembourg
Poland
Portugal
Ireland
Crop rotation
Intermediate cash crops
Catch crops
Crop diversification
GAEC 9
Czech Republic
France
Croatia
Luxembourg
Portugal
Luxembourg
Ban of ploughing of grassland
No conversion of grassland into other uses
Interventions in Natura 2000 areas
Limitation in timing and other limitations for plant protection products other than along water courses
Low tillage
List of organisations engaged in the workshops
The following organisations participated in the first workshop:
NFU Scotland
SAOS
RSPB Scotland
AHDB Scotland
Nature Friendly Farming Network
SAC Consulting
Land Workers Alliance
Rural Payments Agency England
The following organisations participated in the second workshop:
Scottish Government
Historic Environment Scotland
SEPA
RPID
Crofting Commission
Scottish Forestry
NatureScot
SWOT and PESTLE analysis for the 3 selected opportunities
Opportunity 1: Enhancement of buffer areas for nature and water pollution
Opportunity 1 – SWOT analysis
Strengths
Weaknesses
Supports Outcome 3 Climate change mitigation and adaptation: Enhanced buffer areas can reduce nutrient and sediment losses during extreme rainfall events, supporting adaptation to climate change. Permanent vegetation within buffers may also provide modest carbon sequestration benefits and improve soil stability.
Supports Outcome 4 Nature Restoration: Wider and well-managed buffer areas can provide additional riparian habitat, contributing to biodiversity gains alongside improvements in water quality.
Targeted design is supported by evidence-based improvements in protecting water against pollution: Tailoring buffer width and management to soil type, slope and watercourse characteristics can improve pollutant interception compared with uniform minimum standards.
Alignment with best practice: Alignment with countries that apply wider and more differentiated buffer requirements supports cross border consistency with established best practice.
Climate resilience & adaptation: Permanently vegetated buffer strips can soil stability and may contribute to longer term soil carbon storage while improving resilience to extreme weather.
Increased management and compliance complexity for farmers: Requirement expansion would likely add to the number of management rules farmers must consider, increasing the complexity of day-to-day compliance and recordkeeping.
Cognitive burden: Differentiated buffer widths or conditions based on location, soil or watercourse type may increase the cognitive burden on farmers, particularly where rules vary within a single holding.
Knowledge gaps may require significant advisory support and training: Implementing more targeted buffer designs may highlight knowledge gaps around soil, hydrology, and best practice, increasing demand for advisory support and training.
Monitoring burden: More variable or site-specific requirements could increase the complexity of monitoring and enforcement for regulators, particularly where buffer standards differ across holdings.
Uneven impacts on smaller holdings with water courses: Smaller holdings or crofts with a high proportion of land adjacent to watercourses may experience disproportionate impacts from wider buffer requirements compared with larger farms.
Alignment with existing statutory requirements: Many buffer distances are set within existing legislation, meaning current rules must at least meet statutory minima and revisions are likely to focus on maintaining consistency with existing legal requirements.
Opportunities
Threats
Alignment with future environmental goals: Enhancing buffer areas could align with future longer term environmental and climate objectives by supporting integrated approaches to water quality, biodiversity, and climate resilience.
Positive public perception and market benefits: Visible action to protect watercourses and nature may positively influence public perception of farming and support market, or assurance scheme benefits linked to environmental performance.
Stacked environmental benefits i.e. beyond protecting water against pollution: Beyond reducing water pollution, enhanced buffer zones can deliver multiple co-benefits such as carbon sequestration, biodiversity gains and improvements in soil organic matter.‑benefits such as carbon sequestration, biodiversity gains and improvements in soil organic matter.
Innovation and research funding to identify how to maximise the benefits: Support targeted innovation and research funding, including pilot projects or academic partnerships, to identify how buffer design and management can maximise environmental benefits.
Adopt proven models: Drawing on existing approaches implemented in other countries allows Scotland to adopt proven models and lessons learned rather than developing measures from scratch.
Demonstration of leadership on environmental protection: Strengthening buffer requirements would demonstrate leadership in environmental protection by going beyond minimum standards while building on measures that are already well understood.
Opportunity to refine requirements to suit locally specific physical conditions: Refine buffer and management requirements to better reflect local physical conditions, such as soil type, slope, hydrology, and watercourse characteristics, improving effectiveness and proportionality.
Allow direct drilling into Buffers to establish more deep routed plants: Allowing direct drilling within buffer areas could support the establishment of deeper rooted plant species, enhancing soil structure, water infiltration, and long-term nutrient interception without additional soil disturbance.
Opportunity to introduced infield measures / buffers to address soil erosion: Infield measures or buffers could be used alongside watercourse buffers to target erosion hotspots within fields, providing additional flexibility to address soil loss at source rather than relying solely on edge of field controls.
Farmer resistance (cost, complexity, maintenance and land loss): Enhanced buffer requirements may face resistance from farmers if perceived as increasing costs, management complexity, maintenance obligations, or loss of productive land.
Policy uncertainty: Ongoing policy reform creates uncertainty over whether Cross Compliance will be retained in the long term, potentially limiting confidence in investing in enhanced requirements.
Enforcement challenges: More complex rules may make it harder to demonstrate non‑compliance consistently and to apply penalties fairly and proportionately.
Budget constraints for advisory and monitoring services: Additional advisory, mapping and monitoring requirements may place pressure on public budgets and delivery bodies, particularly in the context of wider resource constraints.
Non-compliance: Increased rule complexity may raise the risk of unintentional non‑compliance
Stakeholder pushback and loss of trust: If perceived as costly, impractical or disproportionately affecting smaller businesses, enhanced requirements may generate stakeholder resistance and reduce trust in future reforms.
Perception of competitive disadvantage with overseas markets: Stronger environmental requirements may be perceived as placing domestic producers at a competitive disadvantage compared with overseas markets operating under less stringent standards.
Misalignment with EU following future changes: Future changes to EU conditionality or related legislation could create divergence or misalignment, requiring further revisions to maintain consistency or comparability.
Categorisation of water courses: farmers will need clear and consistently applied definitions of which watercourses are in scope to avoid confusion and implementation challenges
Requirement for additional risk mapping: Enhanced or targeted buffer requirements may necessitate further risk mapping or spatial data to clearly demonstrate compliance
Reduction of productive land area: Widening buffer strips may reduce the area of productive land available for in‑field soil health improvement activities, potentially limiting farmers’ ability to implement other beneficial practices within cropped fields.
Risk to small crofts and field viability: On small crofts or fields, wide buffer requirements could render some parcels impractical to manage, increasing the risk of land abandonment and a reduction in active land management.
Opportunity 1 – PESTLE analysis
Political
Economic
Alignment with current EU rules: Aligning enhanced buffer requirements with existing EU GAEC standards supports policy coherence and helps maintain consistency. However, there is a risk of future misalignment with the EU and risk of competitive disadvantage. Future changes to EU conditionality or environmental legislation could result in misalignment, potentially creating a perceived or actual competitive disadvantage for Scottish producers over time.
Policy delays: Further policy development, consultation, or alignment with wider agricultural reforms may delay implementation.
Increased costs for farmers: land loss, maintenance- Enhanced buffer requirements may result in direct costs for farmers through loss of productive land and ongoing management and maintenance of buffer areas
Long term economic benefits from reduced pollution and damage: Improved buffer areas may deliver long term economic benefits through reduced water treatment costs, lower soil loss, and decreased flood damage to infrastructure and farmland.
Cost for government: Enhanced requirements could increase costs for government, including the provision of advisory services, monitoring and enforcement, data management, and administrative oversight.
Concerns about fairness across farm types and locations: Costs and impacts may vary between upland and lowland areas, farm sizes, and farming systems, raising concerns about fairness and proportionality if measures are applied uniformly.
Social
Technological
Public expectation for stronger environmental standards: There is growing public expectation for farming to deliver stronger environmental standards
Positive perception of farming as environmentally responsible: Well-designed buffer areas can enhance the visual landscape and biodiversity, supporting a more positive public perception of farming as environmentally responsible
Possible farmer resistance: More complex or costly requirements may generate resistance among farmers, particularly where impacts on profitability or land use are perceived as significant.
Concerns about fairness (practicality in upland vs lowland areas): Differences in practicality between upland and lowland areas may raise social concerns about fairness if requirements are not sufficiently flexible or context specific
Ongoing croft abandonment linked to economic viability: There is an existing trend of croft abandonment where agricultural income is insufficient to cover costs, and additional land use restrictions could exacerbate this issue.
Opportunity for precision mapping and remote sensing: Advances in precision mapping and remote sensing could support more accurate identification of watercourses, buffer requirements and higher risk areas, improving targeting and compliance.
Opportunity for digital advisory and monitoring tools: Precision mapping and remote sensing could support more accurate identification of watercourses, buffer requirements and higher risk areas, improving targeting and compliance.
Improved fertiliser spreading accuracy: Advances in fertiliser spreading technology can improve application accuracy
Use of satellite tracking collars to manage grazing pressure: The use of satellite tracking collars on cattle can control grazing to avoid sensitive areas such as water margins and historic sites.
Legal
Environmental
Enforcement challenges: Legally robust enforcement may be challenging where buffer requirements are complex.
Risk of disputes over interpretation of rules: Unclear or ambiguous legal wording could lead to disputes overrule interpretation
Requirement for clear, context specific rules and definitions: From a legal perspective, clear and precise definitions of buffer width, species composition, and management requirements are essential to ensure enforceability and legal certainty
Improved water quality (zones and strips), soil quality and biodiversity (strips): Enhanced buffer zones and strips can improve water quality by reducing nutrient and sediment runoff, while also supporting soil condition and increasing on-farm biodiversity.
Climate adaptation: Vegetated buffer strips can help slow overland flow, reduce soil erosion, and contribute to reduced flood risk under extreme rainfall events.
Climate mitigation: Permanent vegetation within buffer strips can contribute to climate mitigation through soil carbon sequestration, alongside associated benefits for soil and water quality.
Habitat connectivity: Buffer strips can act as linear habitats, improving connectivity between fragmented habitats and supporting wider ecological networks.
Potential for invasive species: If poorly managed, buffer areas may create conditions that allow invasive or undesirable species to establish and spread.
Increased runoff risk under a changing climate: Changing climate, with heavier rainstorms may increase the risk of run off - stakeholders suggest buffers should be mandatory against all watercourses to intercept soil
Opportunity 2: Extension of management requirements to reduce erosion risk
Opportunity 2 – SWOT analysis
Strengths
Weaknesses
Supports Outcome 3 Climate change mitigation and adaptation: Restrictions on tillage in erosion-prone areas can reduce soil loss and sediment runoff during extreme weather events, supporting both climate mitigation and adaptation objectives.
Prohibiting tillage during high-risk times of year and on high-risk land is supported by evidence: limiting tillage on steep slopes and during high-risk periods reduces soil erosion, sediment transport and associated impacts on water quality.
Supports climate resilience & adaptation: Reducing erosion through targeted land management can improve soil structure and infiltration, helping to moderate runoff and reduce downstream flood risk.
Increased compliance complexity for famers: Extending management requirements may increase compliance complexity for farmers, particularly where rules differ by land type, slope, or time of year.
Cognitive burden: Seasonal restrictions and spatially targeted rules could increase the cognitive burden on farmers, especially on holdings with varied topography or land use.
Knowledge gaps may require significant advisory support and training: Introducing new or expanded erosion controls may highlight knowledge gaps around slope thresholds, soil erosion risk, and appropriate mitigation measures, increasing the need for advisory support and training.
Monitoring burden: More differentiated erosion controls may increase monitoring and enforcement requirements, particularly where compliance depends on timing, slope measurements or site-specific conditions.
Risk of overly prescriptive rules given variable local conditions: It is a difficult GAEC to change as circumstances can vary significantly – Examples are of large fields with slope exposed to wind and erosion – overly prescriptive rules may fail to address the most significant real world erosion risks.
Mismatch between Rural Payments & Inspections Division (RPID) and SEPA classification of non‑compliance: Differences in how RPID and SEPA classify breaches or non‑compliance may create confusion
Opportunities
Threats
Alignment with future environmental goals: Strengthening erosion related management requirements supports longer term environmental goals by integrating soil protection, climate resilience, and water quality objectives.
Positive public perception and market benefits: Clear action to reduce erosion and protect soils may strengthen public confidence in sustainable land management and support market or assurance scheme expectations.
Stacked environmental benefits i.e. beyond protecting soil from erosion: In addition to reducing erosion, targeted land management can improve soil structure, support biodiversity, enhance water quality, and contribute to flood risk reduction.
Innovation potential: Extending erosion controls could encourage the uptake of innovative approaches such as precision grazing or virtual fencing
Evidence based development using farm level data: Evidence-based development using data/examples of common issues found during farm visits
Targeted approach rather than a one size fits all model: A targeted approach allows erosion measures to focus on higher risk fields or areas, improving effectiveness and proportionality across different farm and croft systems.
Opportunity to address in‑field soil erosion: Opportunity to tackle in‑field soil erosion, which is recognised as a significant and widespread issue in parts of Scotland.
Inclusion of protection of scheduled monuments: Including scheduled monuments within areas where erosion should be avoided would support alignment with Historic Environment Policy for Scotland and help protect cultural assets at risk from soil loss.
Strengthen restrictions on steep ground adjacent to watercourses: Further restrictions on working or ploughing steep ground near watercourses could reduce erosion and sediment delivery to water, particularly during high-risk periods.
Measures to minimise bare soil over winter: Promoting practices that minimise bare soil over winter targets one of the periods when erosion risk is highest, particularly under wetter and more variable weather conditions.
Improved tramline management: Better tramline management offers a practical way to reduce runoff pathways and soil erosion
Promoting good practice rather than solely prohibitive rules: Opportunity to promote good practice rather than just a solely restrictive set of requirements
Farmer resistance due to increased regulatory complexity, and reduced flexibility to manage land as see fit: Additional or more restrictive erosion controls may face resistance from farmers if they reduce flexibility to manage land in response to local conditions.
Policy uncertainty: Uncertainty around future agricultural policy and the long-term role of Cross Compliance may reduce confidence in implementing enhanced requirements.
Enforcement challenges: Where erosion rules are highly site specific or time limited, demonstrating noncompliance and applying proportionate penalties could present enforcement challenges.
Budget constraints for advisory and monitoring services: Expanded erosion management requirements may increase demand for advisory support, monitoring, and administration
Non-compliance: Greater complexity in erosion related rules may increase the likelihood of unintentional noncompliance.
Stakeholder pushback and loss of trust: If requirements are perceived as overly restrictive, there is a risk of stakeholder pushback that could undermine trust in future agricultural policy reforms.
Perception of competitive disadvantage: Stronger erosion control requirements may be perceived as placing Scottish producers at a competitive disadvantage relative to producers operating under less stringent regimes.
May require risk map: Implementing slope-based tillage restrictions may require detailed risk mapping to identify relevant slope thresholds
Opportunity 2 – PESTLE analysis
Political
Economic
Alignment with current EU rules: Aligning enhanced buffer requirements with existing EU GAEC standards supports policy coherence and helps maintain consistency. However, there is a risk of future misalignment with the EU and risk of competitive disadvantage. Future changes to EU conditionality or environmental legislation could result in misalignment, potentially creating a perceived or actual competitive disadvantage for Scottish producers over time.
Policy delays: Further policy development, consultation, or alignment with wider agricultural reform processes may delay implementation
Long term economic benefit from reduced soil loss and improved soil fertility: Reducing erosion through targeted management can deliver long term economic benefits by maintaining soil fertility, sustaining productivity, and reducing the need for inputs or remediation.
Cost for government: Implementing enhanced erosion controls may increase costs for government, including expenditure on advisory services, monitoring and administration.
Additional costs to farmers: Strengthened erosion management requirements may result in additional costs for farmers, such as installing or maintaining fencing to control livestock access to erosion prone or sensitive areas.
Social
Technological
Public expectation for stronger environmental standards: There is increasing public expectation for farming to deliver stronger environmental standards, including sustainable food production and improved protection of soils.
Positive perception of farming as environmentally responsible (soil protection): Visible action to prevent soil erosion can reinforce a positive public perception of farming as environmentally responsible and committed to long term land stewardship.
Possible farmer resistance due to complexity: More complex or site-specific erosion requirements may lead to resistance from some farmers, particularly where rules are perceived as difficult to understand or implement.
Opportunity for digital advisory and remote monitoring tools: Digital advisory platforms and remote monitoring tools could support farmers in understanding site specific erosion requirements and help streamline compliance and monitoring.
Use of soil monitoring technologies to monitor erosion risk: Soil monitoring technologies, such as sensors could help identify and monitor areas at higher erosion risk and support more targeted land management decisions.
Legal
Environmental
Enforcement challenges: Legally robust enforcement may be difficult where erosion related requirements are highly site specific or conditional, increasing the risk of inconsistent compliance decisions.
Risk of disputes over interpretation of rules: Ambiguity in how erosion controls are interpreted (e.g. slope thresholds or management obligations) could lead to disputes, appeals, or challenges.
Requirement for clear, context specific rules and definitions: Clear legal definitions of erosion risk, including how thresholds are defined and applied in different landscapes, will be essential to ensure certainty, enforceability, and fairness.
Improved water and soil quality: Reducing soil erosion through targeted land management can improve both soil condition and water quality by limiting sediment and nutrient runoff into watercourses.
Climate adaptation: Improved soil structure and ground cover can increase resilience to heavier rainfall, flooding and periods of drought by enhancing infiltration and water retention.
Climate mitigation: Reduced disturbance of soils in erosion prone areas can support soil carbon retention while delivering co-benefits for soil and water quality.
Soil habitat enhancement: Protecting soils from erosion helps maintain soil biological activity and structure, supporting healthier soil habitats and ecosystem function.
Opportunity 3: Incorporation of hedgerow maintenance requirements
Opportunity 3 – SWOT analysis
Strengths
Weaknesses
Supports Outcome 3 Climate change mitigation and adaptation: Well-maintained hedgerows can contribute to climate mitigation through carbon storage and support adaptation by reducing wind exposure, runoff and soil loss.
Supports Outcome 4 Nature Restoration: Enhanced hedgerow maintenance supports nature restoration by improving habitat quality, connectivity and species diversity across agricultural landscapes.
Supports Outcome 1 High quality food production (includes animal health and welfare): Hedgerows provide shelter for livestock, helping to reduce weather stress and support animal health and welfare.
Hedgerow maintenance is supported by evidence-based improvements to protect the landscape feature: Evidence shows that active hedgerow management, including appropriate cutting regimes and species composition, improves hedgerow condition and long-term landscape function.
Alignment with best practice: Aligning hedgerow maintenance requirements with approaches used in other EU countries supports cross border consistency and reflects established best practice beyond minimum baseline standards.
Increased management and compliance complexity for farmers: Introducing hedgerow maintenance requirements may increase management and compliance complexity for farmers.
Knowledge gaps may require significant advisory support and training: More detailed hedgerow management standards may highlight knowledge gaps around appropriate cutting regimes, species composition, and invasive species control, increasing the need for advisory support and training.
Monitoring burden: Moving from passive protection to active hedgerow maintenance may increase monitoring and enforcement demands, particularly where compliance depends on management timing or hedgerow condition.
Difficulty prescribing active maintenance rules across diverse hedgerow contexts: Prescribing active hedgerow maintenance rules is challenging due to the wide variation in hedgerow type, age, condition and location
Opportunity to include cutting date restrictions to protect birds: Including clearer hedgerow cutting date restrictions within GAEC 7 could strengthen protection for nesting and breeding birds
Opportunities
Threats
Alignment with environmental goals- Strengthening hedgerow maintenance requirements supports future wider environmental goals by contributing to climate action, nature restoration, and landscape resilience.
Positive public perception and market benefits: Well-maintained hedgerows provide visible evidence of environmental stewardship, which may support positive public perception and market or assurance scheme expectations.
Stacked environmental benefits: In addition to protecting hedgerows themselves, improved management can deliver co‑benefits such as carbon sequestration, biodiversity enhancement, air quality improvements, and reduced flood risk.
Digital tools (e.g. remote sensing and mapping) to reduce inspection costs: Remote sensing, mapping and digital tools could be used to support monitoring of hedgerow condition and management, potentially reducing inspection costs and administrative burden.
Farmer resistance: More detailed hedgerow maintenance requirements may face resistance from farmers if they are perceived to increase management complexity, costs, or ongoing time commitments.
Policy uncertainty: Uncertainty over the long-term role of Cross Compliance may reduce confidence in introducing enhanced hedgerow maintenance requirements.
Enforcement challenges: Active management standards may make it more difficult to demonstrate non‑compliance objectively and to apply penalties consistently and proportionately.
Budget constraints for advisory and monitoring services: Implementing and supporting enhanced hedgerow maintenance may place additional demands on advisory, monitoring and enforcement resources, within existing budget constraints.
Non-compliance: Increased complexity around hedgerow management rules may raise the risk of unintentional non‑compliance.
Additional complexity in definitions and scope: Further clarity would be required on hedgerow definitions, including what constitutes a hedge and how native or invasive species are classified, to avoid inconsistency and dispute.
Opportunity 3 – PESTLE analysis
Political
Economic
Alignment with current EU rules: Aligning enhanced buffer requirements with existing EU GAEC standards supports policy coherence and helps maintain consistency. However, there is a risk of future misalignment with the EU and risk of competitive disadvantage. Future changes to EU conditionality or environmental legislation could result in misalignment, potentially creating a perceived or actual competitive disadvantage for Scottish producers over time.
Policy delays: Further policy development, consultation, or alignment with wider agricultural and environmental reforms may delay implementation.
Costs for farmers: Introducing active hedgerow maintenance standards may create direct costs for farmers, including gap filling, replanting, and ongoing management.
Long term economic benefit: Well-maintained hedgerows can deliver long term economic benefits by helping reduce soil and wind erosion, supporting natural pest control, and protecting wider farm productivity.
Cost for government: Enhanced hedgerow maintenance requirements may increase public sector costs associated with advisory support, monitoring, administration, and enforcement.
Social
Technological
Public expectation for stronger environmental standards: There is growing public expectation for attractive, well maintained rural landscapes that reflect stronger environmental standards and stewardship.
Positive perception of farming as a steward of heritage, biodiversity and livestock welfare: Active hedgerow maintenance can reinforce positive public perceptions of farming as a custodian of cultural heritage, biodiversity and livestock welfare.
Possible farmer resistance due to added workload: Additional hedgerow maintenance requirements may lead to resistance among some farmers if they increase workload or ongoing management demands.
Opportunity for digital advisory and remote monitoring tools: Digital advisory platforms and remote monitoring tools could support farmers in understanding hedgerow maintenance requirements.
Use of remote sensing and drones to monitor hedge condition and gaps: Remote sensing and drone technologies could be used to identify hedgerow condition, gaps, and discontinuities.
Legal
Environmental
Enforcement challenges: Enforcing hedgerow maintenance requirements may be legally challenging where standards are qualitative or condition based, increasing the risk of inconsistent compliance decisions.
Risk of disputes over interpretation of rules and maintenance standards: Variation in how hedgerow condition or maintenance standards are interpreted could lead to disputes, appeals, or legal challenge.
Requirement for clear, context specific rules and definitions: Clear legal definitions of what constitutes a hedgerow, acceptable maintenance activities, permitted gap sizes, and native or invasive species will be essential to ensure enforceability, consistency, and legal certainty.
Improved water and soil quality (erosion control): Well-maintained hedgerows can help reduce soil and surface runoff, supporting improved soil condition and protecting water quality by limiting sediment and nutrient losses.
Biodiversity support: Active hedgerow management can enhance habitat quality for a wide range of species, supporting farmland biodiversity.
Climate adaptation: Hedgerows can improve climate resilience by reducing wind exposure, moderating microclimates, and helping manage runoff during heavy rainfall and periods of heat stress.
Climate mitigation: Healthy hedgerows contribute to climate mitigation through carbon storage in woody biomass and soils, alongside associated improvements in soil and water quality.
Habitat connectivity: Linear hedgerow networks provide important habitat corridors that support species movement and connectivity, particularly for birds, pollinators and other wildlife.
Potential for invasive species if poorly managed/ non-compliance: If maintenance is poorly implemented or compliance is low, hedgerows may create opportunities for invasive or undesirable species to establish and spread.
How to cite this publication:
Harpham, L , Peters, E, Decherf, C, Gill, D, Wood, C. (2026) How Cross Compliance contributes to Scotland’s Vision for Agriculture, ClimateXChange.
While every effort is made to ensure the information in this report is accurate as at the date of the report, no legal responsibility is accepted for any errors, omissions or misleading statements. The views expressed represent those of the author(s), and do not necessarily represent those of the host institutions or funders.
This work was supported by the Rural and Environment Science and Analytical Services Division of the Scottish Government (CoE – CXC).
Heat networks use fluid-filled pipes to carry thermal energy from one place to another, serving multiple end users.
Traditional heat networks typically feature an ‘energy centre’ where high temperature heat is generated before it is sent out to the heat-using properties which are connected to the network. By contrast, low temperature heat networks connect two or more properties to a shared source of thermal energy, without a central station where high temperatures are generated. Instead, heat pumps within individual properties or buildings extract heat from the network, which typically operates at less than 35 degrees centigrade, and upgrade it to provide heating and hot water.
Heat networks are identified as a key strategic technology for meeting Scotland’s greenhouse gas emissions reductions targets (Scottish Government, 2022). Assessing their potential is a core requirement for local authorities’ Local Heat and Energy Efficiency Strategies (LHEES), the first versions of which were published in 2023 and 2024.
To date, most local and national energy planning in Scotland has focused on high temperature heat networks, typically operating at more than 65 degrees centigrade. This research addresses that gap by identifying where low temperature heat network are most likely to be suitable.
Aims
The results of this assessment identify where low temperature heat networks are most likely to be suitable across Scotland.
The results can support a range of uses, including local and national energy planning, project identification and prioritisation, public engagement (including awareness-raising), business planning and strategy development, knowledge-building and as an input to future research. The intended users include the Scottish Government, local authorities, energy system planners, enterprise development agencies, heat network developers, social landlords, researchers and members of the public.
The approach that has been developed also has policy value. It provides a tested and documented methodology that can be repeated and refined in future assessments.
This is a national level, first pass assessment of locations where low temperature heat networks may be suitable. It does not assess the relative attractiveness or feasibility of specific opportunities. Instead, the data outputs provide data that users can apply to screen and prioritise opportunities according to their own objectives.
Findings
Figure 1 provides an overview of the methodology used in the assessment:
Figure 1: Simplified representation of national assessment methodology
In many areas, the most effective approach is likely to involve several smaller low temperature networks rather than a single large network. In denser urban locations, particularly in city centres, there are often multiple possible configurations. The opportunities identified should therefore be interpreted as areas of high potential rather than clearly defined project proposals.
The national assessment does not account for existing low temperature heat networks, recent or planned new build developments, networks that rely on both heating and cooling, or schemes involving large distances between buildings. To maintain a manageable and practical set of data outputs, smaller opportunities below a defined scale threshold were excluded. However, smaller low temperature heat networks connecting only a few properties can still be viable.
The assessment identified around 11,000 Multi-Building Opportunities and 17,000 Communal Opportunities across Scotland. Together, these represent approximately 900,000 domestic properties and around 100,000 non-domestic properties, around a third of each total. The heat demand represented by these opportunities combined amounts to over 20 TWh/yr.
Most opportunities involve relatively small numbers of properties, typically up to 30, with total heat demand of up to 300 megawatt-hours per year. A smaller number of opportunities have much higher total heat demand, especially where anchor loads such as hospitals and higher education buildings are present.
Low temperature heat network opportunities are distributed across each of Scotland’s 32 local authority areas. While concentrations are highest in more densely populated regions, including the Central Belt and urban areas around Aberdeen and Dundee, opportunities are also present in smaller towns, rural areas and coastal communities across Scotland.
Most opportunities were matched with nearby green spaces that could potentially host heat collection infrastructure. A smaller proportion were matched with nearby water bodies, and relatively few with nearby waste heat sources, although, in some cases these offer significant potential.
More than half of all opportunities are in areas where over 90% of properties currently use mains gas for heating. However, a notable proportion, around 16%, are located in areas with no mains gas use, often in off-gas locations or electrically heated buildings.
Recommendations
Scottish local authorities and other organisations involved in energy planning can use the results of the national assessment to inform strategies and delivery plans relating to heat networks, heat decarbonisation, and electricity network upgrades.
Organisations involved in project identification, including building owners, heat network project developers, community groups and economic development agencies, can use the datasets to screen and prioritise opportunities for further assessment. In some cases, access to the datasets will require compliance with data sharing agreements.
Confidence in the results of the national assessment could be improved through better evidence on the relationship between heat demand and viable connection distances between properties. Improvements to input datasets, particularly relating to heat demand and waste heat sources, would help to better capture the full potential for low temperature heat networks.
Glossary / Abbreviations
Anchor Load
A large heat user within a heat network opportunity whose substantial annual heat demand provides a stable base of consumption, improving revenue certainty and supporting the overall viability of a heat network. This research defined anchor loads according to their estimated annual heat demand (above 100 megawatt-hours per year for public sector properties and above 200 megawatt-hours per year for all other properties).
Air source heat pump
A type of heating system that uses electricity and the energy in ambient air to generate useable heat and/or hot water.
Building
A built structure containing one or more heat-using properties that is mapped with a single footprint in Ordnance Survey MasterMap.
Closed loop borehole
The underground component of a ground source heat system in which pipes circulate fluid through a sealed loop contained within a borehole to extract heat from the ground.
Communal Opportunity
A location likely to be suitable for a heat network serving multiple properties within the same building, such as blocks of flats or multi-occupancy commercial buildings.
First pass assessment
An initial, high-level screening based on national datasets, intended to identify areas of potential rather than to assess feasibility.
Green Heat in Greenspaces (GHiGs)
An evaluation of low-carbon and renewable heat opportunities within parks and other green spaces, produced by Greenspace Scotland. The assessment considers land use, environmental constraints, and potential heat network integration.
Ground source heat pump
A type of heating system that uses electricity and the energy in the ground and/or groundwater to generate useable heat and/or hot water.
Home Analytics (HA)
A detailed analysis of residential building characteristics, energy consumption, and heat demand, produced by Energy Savings Trust to support heat decarbonisation and local energy planning.
Heat Demand Proximity Analysis
A process that identifies clusters of buildings that are potentially suitable for heat networks by calculating and applying maximum viable connection distances based on estimated heat demand.
High Property Count Area (HPCA)
A zone, defined by this research, which is home to more than 1,000 heat demands and within which there are likely to be many opportunities for both low and high temperature heat networks.
High temperature heat network
A system of water-filled pipes connecting two or more buildings to a shared thermal energy source and operating at a temperature suitable for providing space heating or hot water generation without further elevation. This research has defined high temperature heat networks as those operating above 65 degrees centigrade.
Local Heat and Energy Efficiency Strategy (LHEES)
Strategies developed by Scottish local authorities that support the local planning, coordination and delivery of the heat transition, including building energy efficiency.
Low temperature heat network
A system of water-filled pipes connecting two or more buildings to a shared thermal energy source and supplying heat pumps located at each property. This research has defined low temperature heat networks as those typically operating at a temperature below 35 degrees centigrade.
Multi-Building Opportunity
An area within which there is likely to be scope for one or more viable low temperature heat networks, each serving a cluster of separate buildings.
Non-Domestic Analytics (NDA)
An assessment of energy use, building typologies, and heat demand across commercial, industrial, and public-sector properties, produced by Energy Savings Trust to aid with strategic heat planning.
Open loop borehole system
A ground source heat system that extracts groundwater from one borehole and reinjects it into another.
Opportunity
A geographic grouping of properties identified through the national assessment as having potential suitability for a low temperature heat network. Opportunities are not assessed for feasibility and should be interpreted as areas for further investigation.
Property
A building or part of a building which is owned or leased as a unit and normally has its own, separately controllable heat distribution system.
Shared Ground Loop
A type of low temperature heat network in which the heat source is a ground source heat collector that is shared between multiple distributed heat pumps.
Scotland Heat Map (SHM)
A national dataset capturing characteristics of and estimated heat demand for the majority of buildings across Scotland, produced by the Scottish Government to support regional comparison and strategic heat planning.
Low temperature heat networks
Just as electricity networks use cables to transport electrical energy from one or more points of generation to multiple points of use, heat networks use fluid-filled pipes to carry thermal energy from one place to another. Heat networks can take different forms. An important distinction that can be made between two of the main types relates to the temperature at which they operate. The temperature of the pipe network relative to the temperatures required by the end users has a fundamental impact on what items of equipment are required where on the network.
(a)
(b)
Figure 2: Simplified diagram of a) low temperature heat network features and b) high temperature heat network features
Figure 2 a) shows a simplified depiction of the features of low temperature heat networks. In each of the two networks shown, water-filled pipes connect separately occupied properties to a shared source (or sources) of thermal energy. The left network accesses thermal energy from a waste heat source (a data centre) as well as the ground and distributes it to separate buildings. The right network accesses a single heat source (a body of water) and distributes it to flats within a single building. The temperature of the water in the network is likely to be between 0 and 35 degrees centigrade (although could be warmer). In both instances, heat pumps in individual properties upgrade the temperature of the thermal energy that they extract from the network to supply space heating and hot water to occupants. Some low temperature heat networks are able to supply cooling to buildings in addition to (and often at the same time as) supplying heating.
By contrast, the high temperature heat network shown in Figure 2 b) shows multiple properties being supplied from a central energy centre. The temperature of the water that circulates from the energy centre to the end users is likely to be above 55 degrees centigrade, possibly much hotter. Connected properties do not normally need their own heat pumps. Instead, heat exchangers transfer thermal energy from the network to properties’ internal heating systems without upgrading its temperature.
Aims of the research
Policy value of the research outputs/
This national assessment of low temperature heat network opportunities aims to support the Scottish Government’s priority to reduce greenhouse gas emissions in the building sector. More specifically, it aims to support national and local policies, strategies and delivery plans associated with the development of low carbon heat networks in Scotland. It does this by providing the results of the first national-scale assessment of a class of heat networks that has, to date, typically been underrepresented in local and national energy planning. The results of the assessment show where low temperature heat networks are most likely to be suitable and provides additional data for each identified location that further characterises the opportunity. Aggregating the individual opportunities identified gives an indication of the extent and distribution of the overall opportunity for this type of heat network in Scotland.
The approach developed to generate these results itself also has value for policymakers and Scottish local authorities. Future assessments will be able to repeat and/or build on a tested, refined and documented methodology that has been designed with replicability in mind.
In addition to a policy and local government audience, it is anticipated that this research will have value for the heat network and heat-in-buildings industry, the owners and occupants of buildings that require heat decarbonisation solutions, energy network planners and operators, potential investors in heat networks, community organisations and interested members of the public.
This report communicates some of the results of the national assessment in the form of summaries relating to the low temperature heat network opportunities identified. This assessment is intended to inform decision making and does not determine the feasibility of individual projects.
Another critical output of the research is several datasets which capture details about the opportunities identified. Different versions of these geospatial datasets enable sharing with different recipients, depending on their organisation’s status (public sector or not) and the licenses that they hold to certain data products. The different versions enable users to gain maximum value from the research within the constraints imposed by data restrictions.
Context for interpretation
The national assessment is a top-down, “first pass” assessment of locations likely to be suitable for low temperature heat networks in Scotland. The opportunities identified in the research outputs have not been subject to any individual assessments. The selection process made use of information from national-scale datasets only; more localised information was not taken into account. Assessment of the relative attractiveness of specific opportunities was not within our scope.
The identified opportunities are entirely independent of the LHEES developed for each of Scotland’s 32 local authority areas. Local authorities have not carried out any screening of low temperature heat network opportunities ahead of publication. However, the research outputs offer important value for future development and the delivery of actions that align with them, particularly where local authorities are able to screen and prioritise opportunities relevant to their geographic area. This national assessment supplements, but does not supersede LHEES, it is intended to complement, rather than replace, LHEES.
The level of detail with which low temperature heat network opportunities were assessed is very much less than would typically be involved in a feasibility study. In most cases, the level of detail falls short of that which would typically be used to justify carrying out a feasibility study. Organisations wishing to pursue the assessment and possible development of a low temperature heat network in a specific location are advised to use the results of the national assessment as a starting point for a further investigation that incorporates local information. Users will need to apply judgment to develop and refine the concept for the network beyond the initial spatial boundary and the associated group of properties that are defined through this research.
The results of the national assessment inevitably include as “opportunities” some areas which are not in practice good locations for low temperature heat networks. They also fail to include some locations which would, upon further investigation, prove to be good opportunities. The national assessment can only offer generalised justifications for why a location has been included and another location excluded.
It is frequently the case that a group of properties that has been designated as a low temperature heat network opportunity would also represent an opportunity for a small high temperature heat network. The advantages and disadvantages of low temperature systems are often place-specific, requiring an options assessment to be carried out to establish which is likely to be a better fit for the heat sources, buildings and intermediate spaces involved.
Research concept and technical focus
Low temperature heat networks use a system of fluid-filled pipes to connect two or more buildings or separately occupied properties to a shared source of thermal energy. Low temperature heat networks, in common with many higher temperature networks, harvest energy from sources that are cooler than the temperatures needed by the buildings and processes they serve. Examples of these cooler heat sources include the ground, water bodies, and many waste heat sources. In contrast to higher temperature heat networks, these low temperature systems do not upgrade the temperature centrally – instead, one or more dedicated heat pumps per property supply the heating and hot water that the connected buildings need. Some low temperature heat networks are able to supply cooling to buildings in addition to (and often at the same time as) supplying heating.
In theory, low temperature heat networks could be used to heat buildings almost anywhere; all it takes is two or more buildings or separately occupied properties to be close enough together for it to make sense to share a heat source. However, some places are better than other places. This research aims to identify locations across Scotland where low temperature heat networks are most likely to be suitable. It aims to make available information about these locations and the opportunities there to facilitate consideration of low temperature heat networks as an option for decarbonising heat in buildings. This information includes the possible presence of waste heat sources near to heat network opportunities.
The opportunities identified could each be developed as a potential low temperature heat network scheme. However, it could be the case that smaller schemes within the areas delineated are more viable in practice – or that upon further investigation it makes sense to extend networks to certain neighbouring buildings outwith the areas mapped or to interconnect opportunity areas. The opportunities mapped and listed in the national assessment should be interpreted as guides to areas of high potential rather than defined proposals for schemes. For example, neither indicative pipe network routing nor precise locations for connections to heat sources are produced.
Use cases
The intended audience for the research comprises numerous groups who have the potential to contribute to meeting Scotland’s targets for building decarbonisation and heat network deployment. The degree to which the needs of the intended audiences for the research outputs are met is key to its impact. Therefore, the anticipated use cases are central to the aims of the research. This report aims to present the research and its results in such a way that readers can easily understand its implications and the conclusions reached. The data outputs produced by the research can be used for purposes that include local and national energy planning, project identification and prioritisation, public engagement (including awareness-raising), business planning and strategy development, knowledge-building and as an input to future research.
Scottish local authorities are a particularly important audience for the research. Having developed their LHEES over the period 2022 – 2024, local authorities are now engaged in implementing the Delivery Plans associated with the Strategies. In general, low temperature heat networks were not considered in detail when most of the Strategies and Delivery Plans were written. This outcome results from the methodology that local authorities were encouraged to follow when developing their LHEES in 2022 – 2024, which centred on high temperature heat networks. However, they have the potential to make a significant contribution to the decarbonisation of heat in buildings, alongside the other leading solutions:
building energy efficiency;
high temperature heat networks;
individual, non-networked heat pumps; and
other important technologies which have less widespread applicability.
The national assessment raises the profile of low temperature heat networks as a means to achieve the objectives of LHEES, and delivers information that can help local authorities (and other users) to focus on priority areas and to rank the opportunities that have been identified. Local authorities and their partners will still need to consider what the best technology choice is for each type of building in each locality. The national assessment does not directly compare low temperature heat networks against other zero-emissions heating solutions or identify optimum solutions, and as such cannot be a direct input into Delivery Plans or derived activities.
Other audiences that we specifically considered included:
energy system planners;
enterprise development agencies;
heat network developers;
social landlords;
researchers; and
members of the public, including those who are active in community organisations.
Developers of small high temperature heat networks may find that the results of the national assessment of low temperature heat network opportunities offer information that is useful for the identification of opportunities for higher-temperature systems. This would especially be the case if the results were combined with information about buildings’ temperature requirements and the density of heat demand at street-by-street level.
Our aim has been for the outputs to correlate as well as possible with real-world opportunities, while avoiding modelling factors that influence viability in subjective rather than objective ways. The national assessment acknowledges, and allows space for the influence of, local complexity while delivering a single assessment for the whole of Scotland.
Non-technical objectives
Non-technical objectives for the national assessment included:
Geographic inclusivity – giving all areas of Scotland an equal ‘chance’ when it came to the identification of opportunities, after heat demand distribution is taken into account.
Technical inclusivity – representing a range of possible scales, heat sources and network archetypes that can form viable low temperature heat networks.
Replicability – developing a methodology that can be followed by others in the future to update results and further heat decarbonisation objectives.
Elements excluded from the national assessment
Table 1 lists the main types of low temperature heat network opportunity that are excluded from the national assessment for reasons of data unavailability, output useability, dependence on local energy planning outcomes and/or the need for focus on ‘mainstream’ and lower-risk opportunities.
Excluded type of opportunity
Justification of exclusion
Existing low temperature heat networks
Data unavailability
Isolated smaller-scale low temperature heat network schemes
Output useability – see Section 4.2 and Appendix A Section 4.2.3
Low temperature heat networks that could be installed to serve groups of new buildings
Data unavailability
Low temperature heat networks that would be made viable by the fact that they serve cooling customers as well as heating customers (“ambient loop heat networks”)
Data unavailability (although some potential cooling customers have been identified)
Low temperature heat networks involving inter-building distances of more than 1 km
Need for focus on ‘mainstream’ and lower-risk opportunities – see Sections 4.2 and Appendix A Section 4.2.1.4
Smaller-scale opportunity delineation within areas of very high heat demand or very high property counts
Dependence on local energy planning outcomes – see Section 4.3 and Appendix A Section 4.2.4
Table 1: Summary of elements known to be excluded from the national assessment
Summary of methodology
This section summarises how the assessment identifies and characterises potential opportunities for low temperature heat networks.
The methodology for the national assessment was not developed in isolation. Several opportunities were created for stakeholders to consider and provide feedback on the methodological approach and many of the most influential decisions that were made. Stakeholder engagement covered the ways that information is presented and concepts communicated, in addition to the analytical processes that produce information outputs.
This chapter summarises the methodology in non-technical language, focusing on the concepts used rather than the sequential actions performed. Limitations of the research are discussed at the end of this chapter. Fuller detail of the methodological approach, justification of the decisions made, and the steps executed is set out in Appendix A.
The key data sets used as inputs were the Scotland Heat Map 2022, Home Analytics v4.1, Non-Domestic Analytics v2.0 and Green Heat in Greenspaces, supported by various Ordnance Survey and open government datasets. Input datasets were assessed in terms of data quality and the risks associated with uncertainty and inaccurate data. Where required, mitigating actions were taken. Mitigating responses included imposing limits on the influence of outlier heat demands and grouping quantitative data into bands to address concerns regarding the data’s consistency between different parts of Scotland.
The key outputs are geospatial polygons and point data that represent low temperature heat network opportunity locations, as well as some other features that help to enrich the understanding of the opportunities. Values in the datasets produced were aggregated to produce national and local summary results. Visual presentations of the data outputs were developed to enrich their interpretation and make them accessible to a wider audience.
The main steps followed included:
Proximity analysis using a large dataset of potentially suitable heat demands and their relative locations – resulting in groupings of nearby heat demands;
Application of constraints such as physical barriers and the size of the opportunities identified – resulting in geospatial features that represent Communal Opportunities, Multi-Building Opportunities and High Property Count Areas;
Characterising opportunities via integrating additional datasets and performing calculations which aggregate information relating to all the heat demands within each opportunity – resulting in datasets that enrich the geospatial features.
The methodology aimed to identify clusters of heat demands that correlate reasonably well with real-world opportunities for low temperature heat network deployment but aimed to minimise the influence of more subjective assumptions. This means applying a relatively small number of selection criteria in the proximity analysis and constraints application stages but attaching a much wider range of informative attributes to the groupings once they had been created. Attributes selected included (among other parameters) property tenure, existing heating fuel usage and existing heating systems. The attribute selection responded to user needs as expressed in stakeholder consultations. The geospatial data presentations give users the ability to zoom in on specific places and see information that helps them to investigate which buildings are likely to be able to connect to a network and which ones aren’t. The appended information will help stakeholders to understand how good a particular opportunity is compared to all the others in their region or in the whole country, according to their own views on what makes an opportunity ‘good’. Users can also filter the long list of opportunities in order to only focus on those which possess certain characteristics, such as those located in regions of more constrained electrical grid capacity or those featuring a certain percentage of properties which are electrically heated.
Quality assurance of the methodology and the assumptions made was carried out by the researchers, and separately by Scottish Government representatives. A more detailed description of quality assurance checks is provided in Section 6 of Appendix A.
Heat demand proximity analysis
At a nationwide scale, three elements make more difference than anything else to the strength of an opportunity for low temperature heat networks:
how close buildings or properties are together;
whether buildings are divided into flats and other types of units like shops; and
how much heat is needed by the properties.
The Scotland Heat Map dataset provides information on the locations of almost every building in Scotland, along with an estimate of how much heat each property needs (or in some cases, the heat it actually uses). To identify places where these elements come together in promising ways, we converted each property’s heat demand into a spatial distance proxy, representing the distance over which it may be viable to connect to neighbouring properties. The proxy represents an estimate of the real-world distance over which it could be viable for that property to share heat network infrastructure with a neighbour or neighbours. We designed a process that identifies when two or more properties’ proxy distances overlap, a circumstance that indicates that they could be part of the same low temperature heat network opportunity. This process generates many groupings of heat demands, each of which is reasonably ‘heat dense’.
Building inclusion and exclusion
Estimates for the heat demand of almost every building in Scotland are contained in the Scotland Heat Map (SHM). We removed around 10% of the heat demands from the dataset because they are unlikely to be able to benefit from a low temperature heat network connection:
all heat demands less than 5,000 kWh per year (for which another zero-emissions heating system is likely to be lowest cost); and
non-domestic heat demands with building use classifications that indicate a high likelihood that their heat demand is dominated by temperature requirements that exceed those which can normally be produced through networked heat pumps, or that are likely to have minimal or no heat demand. The list of excluded use classes is reported in Table 16 in Appendix A, Section 4.3.1.
We also removed heat demands which had been marked as likely to have issues in the dataset (for example, if the creators of the dataset considered that a building’s use classification indicated that it would not be expected to have a heat demand). The remaining SHM heat demand estimates were used for the calculation of the maximum connection distance for each of around 2.5 million properties in Scotland.
Domestic buildings’ suitability for networked heat pumps was not used as a criterion for excluding any heat demands from the analysis. It was assumed that there is a route to heat pump suitability for almost all domestic buildings. Where modifications are required (and in many instances they are not) they can include energy efficiency improvements and/or the upgrading of radiators and other types of heat emitter. High temperature ground source heat pumps (those able to output heat at more than 65°C) are an alternative way to successfully heat more challenging dwellings via low temperature heat networks.
Similarly, it was assumed that non-domestic buildings using energy for space heating and hot water generation are also almost always potentially suitable for connection to a low temperature heat network.
No screening was carried out by local authorities or other project partners.
Constraints on opportunity size and network reach
Our process mapped certain features of the physical world which are difficult and expensive for heat networks to cross – things like rivers, railways and big roads – so that they can exert constraints on how heat demands are grouped together into ‘opportunities’.
We determined that the national assessment would only map and characterise opportunities where at least ten homes could be connected to a network, or five buildings or units that are not homes. If there is a combination of homes and other types of property, a formula that weighs them up:
However, it is important to understand that low temperature heat networks can still be a good idea for smaller groups of buildings. A review of 34 operational Shared Ground Loop schemes in the UK (Barns et al., 2026) found that 13 of 34 (38%) schemes connected fewer than 20 heat pumps, with the minimum number of heat pumps being two. The restriction on size adopted in this research ensured that the number of opportunities identified was large but reasonable but does not imply that smaller schemes do not represent opportunities.
When identifying spatially dispersed opportunities, we made sure that the distance between buildings within an opportunity area does not risk being unrealistically large (while recognising that in exceptional circumstances, connections exceeding the 1 km threshold adopted could be feasible).
Distinct types of opportunity
An important distinction between two types of low temperature heat network concerns the number of buildings which are served by the network. Our process separated ‘Communal Opportunities’ (blocks of flats, tall tenement buildings and large multi-occupancy commercial buildings) from opportunities that consist of clusters of separate buildings.
Some areas in Scotland are particularly ‘heat dense’ – either they have a great number of heat demands close together, or there are multiple buildings present that demand especially large quantities of heat. Often both of these circumstances are present. These areas cover many of Scotland’s city centres and the centres of larger towns; they are also sometimes found in industrial areas or around very large hospitals. These areas often have significant overlap with the areas that have previously been identified as promising for the development of high temperature heat networks. Many options are likely to exist regarding the types and sizes of low temperature scheme that could be built within heat-dense zones. For example, a single large scheme could be viable – but it may also be possible to develop multiple smaller schemes or to develop in phases.
The proliferation of options for both high and low temperature heat networks means that it is particularly important that strategic energy planning is carried out before decisions are made about what should be built where. To avoid implying that any one technological solution is best within the more heat dense zones, and to recognise the possibility that many separate schemes could be developed within those areas, we separated them from smaller Multi-Building Opportunities. This was done simply on the basis of the number of heat demands (above or below 1,000). These areas with over 1,000 heat demands were referred to as High Property Count Areas (HPCAs).
It was found that the total heat demand of all properties within some HCPAs exceeded 100,000 MWh per year. This sub-group was referred to as High Heat Demand Areas. No Multi-Building Opportunities had total heat demands exceeding 100,000 MWh per year. Therefore, all High Heat Demand Areas were also High Property Count Areas.
Characterising opportunities
The previously described process of heat demand proximity analysis, barrier mapping, and opportunity classification generates a list of places where there are likely to be good prospects for constructing a low temperature heat network. (Whether or not a low temperature heat network is the best solution to decarbonising heat in that place has not been assessed through this research.) These places can be depicted on a map of Scotland or of a smaller area within Scotland, showing them either as singular points, as spatial areas or as indicators of the number and/or density of opportunities within a larger area.
In addition to the locations of opportunities, stakeholders have interest in other aspects of the spatial areas that they represent, the buildings within them and the people that live and work there. We researched what is most important for stakeholders through information-gathering workshops and a questionnaire. Wherever possible the data that is expected to be most valuable has been appended to the spatial datasets of opportunities such that a specific opportunity in a specific place is richly characterised. We generated quantitative summaries of the characteristics of opportunities across different geographical groupings, including the whole country and each local authority area.
Much less detailed characterising information was calculated for High Property Count Areas and High Heat Demand Areas than was the case for Multi-Building Opportunities. This choice reflects the fundamental difference between how larger and smaller opportunity groups should be approached. For larger groupings, including High Property Count Areas and High Heat Demand Areas, detailed local energy planning is essential to establish which low temperature heat network options exist and how they compare to other options. Furthermore, the large number of demands present in these areas means that aggregated information is less relevant and meaningful as an indicator of the characteristics of potential low temperature heat network schemes than is the case for smaller groupings of properties.
Linking heat sources to opportunities
A viable heat source for low temperature heat networks is present in almost all locations in Scotland. Closed loop boreholes are near-universally feasible and can be considered to be the default heat source for any of the opportunities identified (while recognising that space constraints may limit the amount of heat that can be extracted and supplied to a network). Open loop boreholes are less widely feasible but can offer significant advantages over closed loop boreholes. Often ground heat collectors of either type can be installed in close proximity to the heat demands connected to the network. In some circumstances, it can be beneficial to construct them at some distance from the heat users in order to access larger open spaces or more favourable construction conditions.
Where they exist and are feasible, alternative heat sources may offer capital and/or operating cost advantages over ground heat collectors. It may be feasible to use a mix of heat sources to supply larger-scale networks. Alternative heat sources include water bodies (rivers, lochs, the sea) and waste heat that can be captured from various industrial, built environment and waste management sources.
The viability of using a particular heat source to serve a particular heat network depends on, among other factors, the amount of heat that can be transferred and the distance over which a connecting pipe route must be constructed. A proximity analysis process was carried out to match non-contiguous (e.g. located at a distance) heat sources to low temperature heat network opportunities. The heat sources included in this process were green spaces, water bodies and waste heat. Where a heat source was found to be closer than the calculated maximum distance (capped at 1 km), it was ‘linked’ to the heat network opportunity and a set of characteristics appended to the geospatial feature that represents the opportunity. Separately, the linked waste heat sources were assembled into a dedicated dataset of geospatial points with characterising attributes.
Low temperature heat network archetypes
To enable an intuitive understanding of the diverse types of low temperature heat networks and their prevalence within the opportunities identified by the national assessment, we classified the opportunities as belonging to one or more ‘archetypes’. We used the list of archetypes presented in the South of Scotland Heat Network Prospectus (with minor modifications), which group networks according to geographic context and/or the socio-technical drivers that justify their development. Our methodology developed new logical and quantitative criteria for archetype classification, allowing thousands of opportunities to be classified automatically rather than manually.
A brief description of each archetype and the criteria for classifying an opportunity are:
Communal Opportunity – A network that could serve multiple properties within the same building. Communal Opportunities include blocks of flats, tall tenements and taller multi-property commercial buildings. These are identified where multiple heat demand records occupy the same building footprint polygon, and where the majority of records have building height (to the top of the walls) greater than 7.5 metres.
Multi-Building Opportunity – The counterpoint to a Communal Opportunity, i.e. a group that includes heat demands spread across several spatially separated buildings. Multi-Building Opportunities were defined as containing fewer than 1,000 individual heat demands.
Anchor Load-Led – A Multi-Building Opportunity that features one or more anchor load heat demands within its boundaries. Anchor loads are large heat users that can provide a network with higher revenue certainty and/or introduce economies of scale that benefit the network as a whole. For the purposes of the national assessment, an anchor load has been defined as a non-domestic building with an estimated annual heat demand exceeding 200 MWh per year (or 100 MWh per year if it is a public sector building).
Heat Source-Led – A Communal Opportunity or Multi-Building Opportunity that has been linked to a nearby but non-contiguous heat source (waste heat, blue space or green space).
Street Scale – A Multi-Building Opportunity covering a total area of less than 3,000 square metres.
Urban Neighbourhood Scale – A Multi-Building Opportunity covering a total area of more than 3,000 square metres but less than 100,000 square metres. At least 80% of heat demands in the cluster must be classed as ‘urban’. Occasionally, this archetype covers entire settlements.
While High Property Count Areas and High Heat Demand Areas (introduced in Section 4.3) are not low temperature heat network archetypes as such, their definitions should be considered alongside the above archetypes. This is because they effectively place an upper limit on the scale of any of the above archetypes (as they have been defined by this research):
High Property Count Area – A grouping of more than 1,000 heat demands identified through the heat demand proximity analysis process.
High Heat Demand Area – A grouping of heat demands whose total heat demand exceeds 100,000 MWh per year. (This national assessment found that all High Heat Demand Areas were also High Property Count Areas.)
Other characteristics
In addition to the characterising information described earlier in this chapter, data concerning the following topics was added to the geospatial features that represented Communal Opportunities and Multi-Building Opportunities:
Information about the locality: local authority, Data Zone, urban or rural classification, on- or off-gas status, indicators of the status of the electricity grid
Information about buildings: counts of domestic and non-domestic properties, building age, heritage status, categorisations familiar to local authorities
Heat demand information: total heat demand, statistics about existing heating fuels and heating systems
Social information: measures of deprivation, information about social tenure versus other types, and estimates of the likelihood of fuel poverty
Information on heat sources: number of potentially suitable waste heat sources, green spaces and water bodies matched with the opportunity
Detailed data on geological favourability is available through the British Geological Survey’s online UK Geothermal Platform. Although integration with the national assessment was initially considered, data sharing limitations prevented the inclusion of UK Geothermal Platform data within the research’s data outputs. Users of the national assessment data outputs are encouraged to access the UK Geothermal Platform to obtain information about the estimated yield of closed loop and open loop boreholes within a geographic area of interest. The capacity of identically specified closed loop boreholes could vary by a factor of two between the opportunity locations identified through this research, although about around three quarters of opportunities lie within 10% of the mean capacity. Only a minority (less than 2%) of opportunities are located in areas where the dataset indicates that there is likely to be potential for open loop boreholes.
Limitations of the research
Input datasets
Three main datasets drive the identification of opportunity groupings and provide the majority of the characterising data that applies to them: Home Analytics, Non-Domestic Analytics and the Scotland Heat Map.
Other than its location relative to others, the estimated heat demand of a particular address is the main parameter that determines whether it is included in an opportunity grouping or not. The vast majority of the heat demand estimates in the dataset used are modelled values rather than measured values, although the type of modelling involved (and its inherent uncertainty) varies. Uncertainty in the heat demand estimates could lead to fewer (or more) opportunities being identified than would have been the case had more accurate data been available. The size of the opportunities identified would have also been affected. However, in our methodology an evidenced general trend for overestimated heat demands is counteracted by the selection of reasonably conservative assumptions for proximity analysis.
Heat demand estimates for non-domestic properties are much more likely to have been inferred from very basic information, and so lower confidence can be placed in their modelled heat demand estimates in general. The heterogeneity of non-domestic properties further reduces the confidence that can be placed in their heat demand estimates regardless of the type of modelling involved.
Misclassification of buildings in terms of use will have occasionally led to their exclusion from the dataset used to identify opportunities. This would have resulted in their exclusion from opportunity groupings and could have potentially (but infrequently) caused entire opportunities to be missed. Misclassification will have occasionally led to the erroneous inclusion of buildings that are not actually good candidates for connection to low temperature heat networks. Where this has occurred, identified opportunities will have been more numerous and/or larger than they should have been.
The datasets are unavoidably biased towards newer, urban properties that have recently been built, bought, sold or had significant retrofit work completed (thus triggering the requirement for an Energy Performance Certificate to be produced and lodged). This means that, in general, there is lower confidence in the data reported for rural areas.
A significant proportion (around half) of the other characteristics that derive from Home Analytics, Non-Domestic Analytics and the Scotland Heat Map and are calculated for or applied to opportunities are modelled data rather than measured data.
Occasional mismatches between how the three datasets represent (or do not represent) particular properties are infrequently responsible for proportions not summing to 100% or components not summing to the exact numerical total expected. These inaccuracies are generally negligible in scale in comparison to the values they affect.
Further comment on the accuracy of the Scotland Heat Map heat demand estimates, and the opportunity characteristics that derive from it and its related datasets, is made in Appendix A.
Assumptions
The assumptions for which uncertainty has the greatest impact on the results are those used in the proximity analysis to form groupings of buildings that represent low temperature heat network opportunity locations. These assumptions are explored in more detail in Section 4.2.1.1 of Appendix A.
Further influential assumptions concern the distances across which heat sources can be matched to opportunities, and the building use types that were assumed to be unsuitable for connection to a low temperature heat network. These topics are discussed respectively in Sections 4.2.7 and 4.3.1 of Appendix A.
Other limitations
The elements excluded from the national assessment are listed in Section 3.5, along with justification for their exclusion.
Findings from the research process
This chapter summarises key conceptual findings from the research process, including insights from previous work and stakeholder engagement.
We focus on the conceptual findings developed through a desk study of relevant past approaches (both research and policy implementation initiatives) and a series of stakeholder engagement activities. These findings informed both the development of the methodology and the formation of conclusions from the results of the assessment.
It complements the quantitative results to be presented in Chapter 6.
Relevant past approaches and ongoing initiatives
The First National Assessment of Potential Heat Network Zones (Zero Waste Scotland, 2022a) and the Methodology guidance documents produced to support the development of LHEES introduced a standardised methodology for identifying opportunities for high-temperature heat networks within local areas or at a national scale. The First National Assessment and the earlier stages of heat network zone identification in the LHEES development process both represent top-down, data-driven approaches. They used heat demand proximity analysis as a key tool for grouping individual heat-using properties into proto-networks or zones in which it was thought that high temperature heat networks had the potential to be viable.
In their work for the Argyll and Bute LHEES (Argyll and Bute Council, 2024), Zero Waste Scotland and Buro Happold applied a similar heat demand proximity analysis method to identify Shared Ground Loop heat network opportunities. Adapting it to low temperature heat networks, the researchers selected different assumptions regarding the relationship between a property’s heat demand and the maximum distance over which it could be linked to another within a grouping. The geographic focus – smaller towns and villages in Argyll and Bute – meant that physical barriers to heat network construction were not often present within the opportunity groupings that were identified, and that areas with very high property counts or very high total heat demands were not encountered. Heat sources other than nearby ground heat collectors were also not investigated.
In 2025, South of Scotland Enterprise, Scottish Borders Council and Dumfries and Galloway Council published the South of Scotland Heat Networks Prospectus (South of Scotland Enterprise, 2025). This work identified 12 low temperature heat network opportunities across the region, spanning a range of sizes, heat sources and built environment contexts. The Prospectus classified these 12 opportunities as belonging to one or more low temperature heat network archetypes. The list of 7 archetypes included settlement-wide, urban neighbourhood, new developments, anchor load-led, blocks of flats, street and heat source-led.
Nesta’s work on Clean Heat Neighbourhoods (ongoing at the time of publication) is exploring how open data can be used to develop neighbourhood-scale plans for transitioning to clean heat. Low temperature heat networks are one of the technologies assessed in Nesta’s work, which has also developed an approach which estimates which low-carbon heating technologies (also including high temperature heat networks and individual heat pumps) are suitable for each domestic address in Great Britain.
Stakeholder views
The development of the methodology for the national assessment was supported by a multi-stage programme of stakeholder engagement involving a broad range of organisations. A series of four stakeholder events were delivered during the research period, comprising two workshops in August 2025 and two workshops in November 2025. In addition, an online questionnaire and a series of one-to-one meetings supplemented the findings from the workshops. More detail is available in Section 4.1.1 of Appendix A.
Concepts presented
Stakeholders were given an overview of our proposals with respect to the research objectives. They heard our interpretation of who the users of the research outputs might be, and what specific needs they have. We introduced some relevant existing research approaches and policy implementation activities that offered lessons for our work.
The strategic approach taken: minimising the number of subjective factors that influence opportunity identification, but richly characterising the opportunities identified so that users can perform their own screening and prioritisation.
The proposed mechanics of the heat demand proximity analysis, and proposals for the key assumptions that underlie it (explored in Section 4.2.1 in Appendix A). These assumptions are among the most critical decisions made regarding the national assessment methodology because they determine the distance over which each heat demand is able to connect to neighbours. In turn, this influences which groupings are identified and where.
How we proposed to deal with taller, multi-occupancy buildings like flats.
The proposed method for matching low temperature heat network opportunities with potentially suitable heat sources that are located some distance away from them (explored in Section 4.2.7 in Appendix A).
The formats that the research outputs were envisaged to take.
Stakeholders were presented with some initial outputs from test runs of the opportunity identification and characterisation process. This allowed discussion of the degree to which the opportunities found matched with stakeholders’ expectations, and the development of ideas regarding visual presentation.
Outcomes
In the earlier of two stakeholder consultation exercises, stakeholders were able to confirm that the datasets that we proposed to use were fit for purpose. That said, some limitations of those datasets were identified. Additional data sources were suggested for consideration.
Stakeholders identified common traits of promising opportunities that included the presence of anchor loads (schools, NHS sites), off-gas areas, and potential for community ownership. Viability was stated to be influenced by grid capacity, geology, visual impact, and retrofit feasibility. High social impact and alignment with existing programmes (such as External Wall Insulation programmes) were also felt to be strongly beneficial.
Participants in workshops gave their view on terminology, leading to the adoption of terms like Communal Opportunity, Multi-Building Opportunity and High Property Count Areas in this report and the project’s data outputs.
Stakeholders stressed the importance of the outputs of the national assessment being tailored to different audiences. These include use cases such as feasibility funding, community awareness, and strategic planning. Stakeholders were able to suggest some of the evaluation metrics that they would use to assess low temperature heat network opportunities. Information has been provided as part of the project’s data outputs to enable some of these to be directly assessed. Others were not possible to include but have informed our conclusions regarding how users can improve upon our outputs with locally relevant information, or how further work at a national scale could enhance the aims of this research.
Overall, the stakeholder engagement activities have provided evidence that:
the methodology applied to deliver the national assessment is appropriate, and likely to achieve ‘buy-in’ from users of its results;
the major user groups and their needs have been considered when planning the research outputs;
the design of the main visualisations of output data is adequately clear, enabling address-level precision to users with access to the Scotland Heat Map dataset (and to all users, albeit with lower accuracy).
Factors influencing opportunity viability and benefits
Through desk research and stakeholder engagement we developed a list of the main factors that influence the viability of low temperature heat networks, based on available national-scale datasets. Some of the factors can have both positive and negative impacts on network viability, or will be assigned very different levels of importance to different stakeholders. The factors identified are listed in Table 2, which arranges them roughly in order of how objective or subjective their impact is. How the methodology approached each of these factors is discussed in Section 4.2 of Appendix A.
The potential for low temperature heat networks to benefit from electricity system flexibility (for example by the charging of thermal storage) was queried by stakeholders, but it was concluded that this was not of strong relevance to the national assessment.
More objective factors, clearer relationship with viability
Presence of grid or micro-grid electricity supplies[1]
Proximity of heat-using properties relative to their total annual heat demands
Presence of physical barriers to the installation of heat network infrastructure
Presence of anchor loads (properties that use large amounts of heat)
Geological favourability, where sub-ground conditions are known (for ground source systems)
Presence of potentially suitable waste heat sources
Presence of potentially suitable green space and/or water bodies
Number of connections within a low temperature heat network
More subjective factors, less clear relationship with viability (may be positive or negative)
Presence of cooling demand
Property tenure
Property age and heritage designations
Interaction with the planning of other local energy infrastructure, including high temperature heat networks
Current and future status of local and regional electricity grid infrastructure
Existing heating fuels and heating systems (including internal heat distribution systems and heat emitters like radiators)
Building energy efficiency
Presence and severity of fuel poverty
Table 2: Factors influencing low temperature heat network opportunity viability and benefits, loosely arranged from most objective to most subjective
Policy-relevant findings
Carbon emissions reduction potential
The national assessment aims to support the Scottish Government’s priority to reduce greenhouse gas emissions in the building sector. Low temperature heat networks in each of the opportunity locations identified in the national assessment have the potential to reduce greenhouse gas emissions, provided that the network is replacing polluting or less efficient heating systems. The calculation of greenhouse gas emissions reduction potential is straightforward but requires a timescale to be selected for the assessment. This is because the electricity grid is in the process of decarbonising, so the emissions associated with electricity used by heat pumps (and network circulation pumps, if present) depend on the point of assessment. Another necessary assumption is the average efficiency (or seasonal performance factor) of the heat pumps that would be connected to the network.
A further complication is presented by the fact that, on average, the real-world heat consumption of domestic properties is lower than the estimated heat demands present in the dataset used. If scaled up to a large group of buildings, a region, or the country, this could result in an overestimation of the carbon savings potential of low temperature heat networks. It is also reasonable to assume that not all properties within an area covered by a low temperature heat network opportunity will actually connect to a developed scheme.
The characterising attributes of the opportunities identified include calculated total heat demands within the opportunity disaggregated by current heating fuel (mains gas, electricity, other). Users can apply derating to these totals if desired before multiplying them by their chosen emissions factors to calculate the ‘business as usual’ emissions from heating against which heat network emissions can be compared.
Proximity to existing and planned high temperature heat networks
Low temperature heat network opportunities often have significant overlap with the areas previously identified as promising for the development of high temperature heat networks. Within any of the areas of opportunity for low temperature heat networks identified by our research, it is possible that high temperature heat networks already exist or may be planned to be built. However, this is more likely to be the case in urban centres. In these places, low temperature heat networks may still be viable around the ‘edges’ of the high temperature networks. This finding is supported by Barns et al. (2026), who mapped the city of Leeds’s indicative Heat Network Zone alongside its existing city centre heat network and 30 separate Shared Ground Loop schemes, observing the low temperature heat networks existing outside of or close to the periphery of a high temperature heat network zone.
Proximity to existing and/or planned high temperature heat networks was not used as a criterion for the identification of low temperature heat network opportunities, nor was it possible to incorporate information on potential overlaps when characterising opportunities. Readers and users of the project data outputs are encouraged to view them alongside the latest available information about high temperature heat network locations (existing and prospective) from sources such as LHEES, published information about schemes that are in development and Heat Network Zone designations.
Potential for community-led development or community ownership
Low temperature heat networks can be developed by communities, and it is also possible for communities to own and operate them in a similar way to other local energy infrastructure. The potential for community involvement in low temperature heat networks is difficult to assess through a data-driven approach. However, the results of the national assessment could be compared with maps of active community energy and local climate action organisations to identify locations where there might be potential.
Urban or rural geography
A typical feature of urban locations that makes low temperature heat networks more viable is higher heat demand density (more properties and more total heat consumption per metre of street or per square metre of neighbourhood). On the other hand, rural areas can offer lower costs for the installation of buried pipework. This is thanks to them typically having more unpaved public areas, and simpler layouts for existing buried services like water mains and electricity and communication cables. Where there is ample green space, ground source heat collectors located in trenches (rather than boreholes) are an option. Trenched solutions can reduce costs and increase viability.
Urban and rural communities experience different challenges for decarbonising which are of interest to policymakers. Firms involved in the construction of low temperature heat networks may view urban and rural locations differently in terms of the projects that they target. The national assessment results report the percentage of heat demands within an opportunity grouping that are classified as urban.
With some notable exceptions in the Highlands and Islands, urban areas in Scotland are normally served by gas networks. Many rural areas are not. Scottish Government policy and individual LHEES distinguish between ‘on gas’ and ‘off gas’ buildings. The percentage of heat demands that are ‘off gas’ within each opportunity grouping was calculated and reported as an opportunity characteristic.
Summary of results from the national assessment
This chapter summarises the key quantitative results of the national assessment, including the scale, distribution and characteristics of identified opportunities.
The national assessment has generated datasets which represent the low temperature heat network opportunities identified, as well as some features that further enrich the understanding of those opportunities. This chapter presents quantitative results that summarise the opportunities (and their characteristics) across different geographical groupings, including the whole country and each local authority area. It also presents a selection of charts that communicate the distributions of results across different parameters. The results presented in this chapter should be viewed with consideration of the caveats expressed in Section 3.1.1 and elsewhere in preceding chapters. Importantly, they represent a first-pass assessment of low temperature heat network opportunities rather than a definitive list. They derive from national-scale datasets only (not incorporating more localised information) and the assessment carried out is very much less detailed than a feasibility study. The low temperature heat network opportunities have not been compared against other zero-emissions heating solutions, and represent potential technological solutions rather than optimum solutions.
Opportunity numbers, heat demands and property counts
The national assessment identified a total of 11,109 Multi-Building Opportunities and 16,985 Communal Opportunities. These opportunity groupings represent around 500,000 and 400,000 dwellings respectively. There are around 50,000 non-domestic properties within each type of opportunity. The heat demand represented by these opportunities combined amounts to over 20 TWh/yr.
Table 3 summarises the number of opportunities identified in each local authority area.
Region
Local authority
Number of Multi-Building Opportunities
Number of Communal Opportunities
Total number of opportunities
Scotland
Dumfries and Galloway
475
158
633
South
Scottish Borders
399
238
637
Highland and
Argyll and Bute
416
298
714
Islands
Comhairle nan Eilean Siar
65
0
65
Highland
781
262
1,043
Orkney Islands
45
11
56
Shetland Islands
46
16
62
Glasgow and
East Ayrshire
339
138
477
Strathclyde
East Dunbartonshire
342
155
497
East Renfrewshire
223
191
414
Glasgow City
397
4223
4,620
Inverclyde
145
449
594
North Ayrshire
472
226
698
North Lanarkshire
678
556
1,234
Renfrewshire
264
722
986
South Ayrshire
292
210
502
South Lanarkshire
698
955
1,653
West Dunbartonshire
227
408
635
Aberdeen
Aberdeen City
198
1471
1,669
And North
Aberdeenshire
534
159
693
East
Moray
212
60
272
Edinburgh
City of Edinburgh
614
3066
3,680
and Lothians
East Lothian
238
175
413
Midlothian
180
71
251
West Lothian
352
254
606
Tayside,
Angus
322
207
529
Central and
Clackmannanshire
139
55
194
Fife
Dundee City
92
880
972
Falkirk
315
284
599
Fife
1,011
596
1,607
Perth and Kinross
331
330
661
Stirling
243
153
396
Opportunities
spanning multiple
24
8
32
Total
11,109
16,985
28,094
Table 3: Total numbers of Multi-Building and Communal Opportunities by local authority
Figure 3: Locations of potential opportunities (Multi-Building Opportunities and Communal Opportunities combined)
Region
Local authority
Total heat demand of Multi-Building Opportunities (MWh)
Total heat demand of Communal Opportunities (MWh)
Scotland
Dumfries and Galloway
709,377
51,143
South
Scottish Borders
472,610
102,274
Highland and
Argyll and Bute
503,311
84,467
Islands
Comhairle nan Eilean Siar
68,016
0
Highland
1,092,008
85,203
Orkney
108,410
3,644
Shetland
132,302
4,426
Glasgow and
East Ayrshire
321,202
38,852
Strathclyde
East Dunbartonshire
321,352
28,164
East Renfrewshire
150,170
42,159
Glasgow City
909,987
2,175,389
Inverclyde
223,439
126,560
North Ayrshire
432,086
81,850
North Lanarkshire
549,021
147,632
Renfrewshire
384,239
221,667
South Ayrshire
344,164
57,670
South Lanarkshire
662,284
191,348
West Dunbartonshire
269,856
85,847
Aberdeen
Aberdeen City
231,528
478,742
And North
Aberdeenshire
914,718
44,130
East
Moray
387,631
20,997
Edinburgh
City of Edinburgh
735,461
1,556,994
and Lothians
East Lothian
287,204
45,359
Midlothian
212,576
13,102
West Lothian
439,929
52,537
Tayside,
Angus
358,895
67,943
Central and
Clackmannanshire
132,185
11,297
Fife
Dundee City
128,287
299,722
Falkirk
321,237
73,368
Fife
1,060,077
218,985
Perth and Kinross
557,970
104,302
Stirling
363,906
60,861
Opportunities
spanning multiple
214,523
6,446
Total
13,999,962
6,583,080
Table 4: Total heat demand within Multi-Building and Communal Opportunities by local authority
Figure 4: Total heat demand of potential opportunities (Multi-Building Opportunities and Communal Opportunities combined) within local authority boundaries
Table 3 reports the number of opportunities of each type by the local authority within which they are located. Low temperature heat network opportunities can be found in each of Scotland’s 32 local authority areas. The more sparsely populated areas like the Orkney Islands, Shetland Islands and Comhairle nan Eilean Siar (Western Isles) still contain more than 50 opportunities each. The larger cities each contain several thousand opportunity groupings. The map in Figure 3 illustrates the geographic spread of the opportunities identified.
Table 4 presents the total heat demand of each type of opportunity in each local authority area. This data confirms that, while the greatest potential in terms of total heat demand can be found in the larger cities, there is potential for supplying very significant amounts of heat through low temperature heat networks elsewhere in the country. Highland, Fife and Aberdeenshire stand out as areas with large quantities of heat demand contained within Multi-Building Opportunities. Figure 4 presents the total heat demand within both types of opportunity by local authority, using colour coding to differentiate between the areas with the lowest, medium and highest totals.
Figure 5: Number of potential low temperature heat network opportunities, by scale of total heat demand within opportunity (within the range 0 – 1,000 MWh per year)
Figure 6: Number of potential low temperature heat network opportunities, by scale of total heat demand within opportunity (within the range 1,000 – 10,000+ MWh per year)
Figure 5 and Figure 6 show the distribution of the low temperature heat network opportunities by scale, grouping opportunities according to their total heat demand. Around a third of opportunities (around 10,000) have a total heat demand between 100 and 200 MWh per year each. This is roughly equivalent to the total heat demand of 10-20 typical 3-bedroom homes.
The majority (89%) of opportunities contain fewer than 100 dwellings and fewer than 10 non-domestic properties. These represent 38% of the heat demand of all opportunities combined.
The proportion containing fewer than 100 dwellings and fewer than 10 non-domestic properties is very similar for both Communal Opportunities and Multi-Building Opportunities (90% and 87% respectively). More than half contain less than 20 dwellings.
Table 5 presents the total number of properties located within each type of opportunity in each local authority area. It confirms that Glasgow and Edinburgh contain the greatest numbers of properties included within both types of opportunity combined (but dominated by Communal Opportunities). Highland and Fife have the largest number of properties contained within Multi-Building Opportunities.
Region
Local authority
Total number of properties within Multi-Building Opportunities
Total number of properties within Communal Opportunities
Scotland
Dumfries and Galloway
26,377
2,476
South
Scottish Borders
19,360
4,305
Highland and
Argyll and Bute
17,118
5,682
Islands
Comhairle nan Eilean Siar
2,111
0
Highland
36,765
4,139
Orkney
3,066
133
Shetland
3,516
212
Glasgow and
East Ayrshire
15,802
2,167
Strathclyde
East Dunbartonshire
13,328
2,735
East Renfrewshire
6,796
3,214
Glasgow City
24,542
146,839
Inverclyde
8,221
10,877
North Ayrshire
21,583
4,958
North Lanarkshire
29,882
11,967
Renfrewshire
12,065
16,493
South Ayrshire
13,339
3,722
South Lanarkshire
30,063
17,238
West Dunbartonshire
11,205
8,357
Aberdeen
Aberdeen City
9,026
38,683
And North
Aberdeenshire
33,679
2,352
East
Moray
14,106
823
Edinburgh
City of Edinburgh
25,341
111,513
and Lothians
East Lothian
12,930
3,675
Midlothian
8,881
1,038
West Lothian
17,604
3,690
Tayside,
Angus
13,293
3,585
Central and
Clackmannanshire
7,254
858
Fife
Dundee City
3,972
21,752
Falkirk
13,419
5,575
Fife
43,392
10,584
Perth and Kinross
20,385
6,994
Stirling
14,441
3,656
Opportunities
spanning multiple
4,945
121
Total
537,807
460,413
Table 5: Total number of properties within opportunities by local authority
High Property Count Areas and High Heat Demand Areas
High Property Count Areas (HPCAs) were found in all of Scotland’s 32 local authority areas. There are HPCAs in every ‘Large Urban Area’ (areas with more than 125,000 population[2]) and the majority of ‘Other Urban Areas’ (areas with 10,000 to 124,999 population). Some ‘Accessible Small Towns’ also have HPCAs.
The HCPAs with heat demands exceeding 100,000 MWh per year are also High Heat Demand Areas. Table 6 reports the number and characteristics of the High Property Count Areas and High Heat Demand Areas (the High Heat Demand Area results being a subset of the High Property Count Area results).
High Property Count Areas
High Heat Demand Areas
Number of areas identified
345
45
Total annual heat demand in MWh per year
20,486,063
7,126,080
Total number of properties within areas
1,024,374
324,911
of which domestic properties
926,210
294,237
of which non-domestic properties
98,164
30,674
Table 6: High Property Count Areas and High Heat Demand Areas results
Figure 7 shows the distribution of HPCAs according to their total annual heat demand.
Figure 7: Number of High Property Count and High Heat Demand Areas, by total heat demand
Low temperature heat network archetypes
Table 7 summarises the results of the national assessment, broken down according to the low temperature heat networks defined in Section 4.4.2. There is significant overlap between the groups belonging to each Multi-Building Opportunity archetype, which means that the disaggregated figures do not sum to the totals that apply to their parent category. This is because it is common for more than one archetype to apply to a Multi-Building Opportunity.
It can be seen that a little over a fifth of Multi-Building Opportunities include one or more anchor loads. Half of these include public sector anchor loads, while three-quarters include non-public sector anchor loads. The Anchor Load-Led archetype was not applicable to Communal Opportunities.
More than 85% of opportunities were matched with one or more nearby green spaces. 22,348 (80%) of opportunities had been matched with between 1 and 5 green spaces. A few were matched with a large number of green spaces, with two instances featuring 74 and 96 green spaces matches representing the extremes. In the locations with large numbers of matches, many of the green spaces involved had relatively small areas (although still larger than 1,000 square metres). They included areas of roadside grass, open areas within industrial estates and around public buildings, and patches of uncultivated grassland or scrubland. The number of green space matches is a guide to the diversity of possible places where ground heat collection infrastructure could be located. However, it is not indicative of the total heat generation potential associated with green space within or close to a low temperature heat network opportunity.
Overall, 3,668 opportunities (13%) were matched with one or more blue spaces. Most of these were matched with 1, 2 or 3 water bodies. A small number (52) of opportunities were matched with between 4 and 10 water bodies.
In total, 132 opportunities were matched with waste heat sources, with the majority of these being matched with one nearby site where waste heat is expected to be available. Most of these matched waste heat sources have estimated supply capacities of up to 1,000 MWh per year. However, a minority of the matched sources are estimated to be able to supply up to 10,000 MWh per year, and a few in excess of 30,000 MWh per year.
Number identified
Total heat demand within group (MWh per year)
Number of properties within group
All low temperature heat network opportunities
28,094
20,583,042
998,220
of which Multi Building Opportunities
11,109
13,999,962
537,807
of which Communal Opportunities
16,985
6,583,080
460,413
High Property Count Areas
345
20,486,063
1,024,374
High Heat Demand Areas
45
7,126,080
324,911
Multi Building Opportunities
11,109
13,999,962
537,807
of which Heat Source-Led archetype
9,670
13,309,834
514,337
of which Anchor Load-Led archetype
2,395
11,349,534
393,030
of which Street Scale archetype
5,149
913,243
65,006
of which Urban Neighbourhood Scale archetype
2,752
1,971,540
90,993
Communal Opportunities
16,985
6,583,080
460,413
of which Heat Source-Led archetype
15,501
5,915,943
420,343
Heat Source-Led archetype
25,171
19,225,776
934,680
of which matched with greenspace
24,504
18,450,639
916,717
of which matched with a water body
3,668
7,476,261
261,550
of which matched with a waste heat source
132
503,487
13,067
Table 7: Summary of national results broken down by archetypes
Characteristics of properties within opportunities
Socially rented properties can represent good opportunities for low temperature heat network development thanks to the prevalence of concentrated ownership by organisations with strong incentives to decarbonise their stock. Across the opportunities identified in the model, 40% contain no socially rented dwellings. Among those that do, Communal Opportunities are more likely to include socially rented homes, and for the proportion of homes that are socially rented to be higher. The socially rented proportion averages 36% of dwellings within Communal Opportunities, compared to 16% within Multi-Building Opportunities. 10% of Communal Opportunities (1,557) were found to be wholly socially rented compared to 1% of Multi-Building Opportunities (133).
Fuel poverty is a social dimension that is important to many organisations involved in energy planning and the development of low temperature heat networks. Estimates of the likelihood of domestic properties’ occupants experiencing fuel poverty are available in the Home Analytics dataset. However, the bases of these estimates are not nationally consistent. To reduce the impact of local variability, the datasets generated by the national assessment express fuel poverty prevalence in terms of Lower, Middle and Higher bands rather than quantitatively. These bands were designed to contain roughly equal numbers of low temperature heat network opportunities, such that the Lower band contains the third of opportunities that have the lowest overall fuel poverty prevalence (and so on).
Figure 8: Number of potential low temperature heat network opportunities within each fuel poverty band defined by the national assessment
Figure 8 shows the distribution of opportunities across the fuel poverty bands. The Lower, Middle and Higher bands account for around 303,000, 308,000 and 288,000 dwellings respectively. The relatively even distribution of dwellings across the three bands is a result of their definition: the Lower, Middle and Higher bands refer to the expected average rates of fuel poverty relative to all low temperature heat network opportunities. The bands allow those opportunities with the highest or lowest expected prevalence of fuel poverty to be identified. However, more granular fuel poverty data (such as that available through the Home Analytics dataset) is required to understand the probability of fuel poverty affecting dwellings within an opportunity grouping.
It is notable that Multi-Building Opportunities are over-represented in the Lower band (e.g. these opportunities tend to involve groupings with lower overall prevalence of fuel poverty). The estimated average fuel poverty prevalence within Communal Opportunities is more likely to place them in the Higher band (higher overall prevalence of fuel poverty). This finding conforms to expectations, given that many social homes (often occupied by people with low incomes) are located in blocks of flats.
Figure 9: Number of potential low temperature heat network opportunities, by the proportion of properties estimated to currently use gas for heating
Figure 9 illustrates the distribution of the identified opportunities according to the percentage of properties within them that are estimated to currently use mains gas for heating. Well over half of the opportunity groupings are dominated by gas as a heating fuel. However, a notable proportion comprises groups in which no properties use mains gas. Many of these are Multi-Building Opportunities in areas where there is no mains gas grid, or Communal Opportunities in blocks of flats that are electrically heated.
1,724 opportunities (1,461 Communal Opportunities and 263 Multi-Building Opportunities) consist of groupings in which 100% of properties are electrically heated. Electrically heated homes with high heat demands are of particular relevance to fuel poverty, since these homes tend to experience the highest heating costs (or to be underheated in response to high heating costs).
Potential uses of the results
The data outputs produced by the research can be used for purposes that include local and national energy planning, project identification and prioritisation, public engagement (including awareness-raising), business planning and strategy development, knowledge-building and as an input to future research.
Figure 10 depicts the typical development process for a low temperature heat network project, including some of the stages that may be undertaken. The process contains the same activities as are typically undertaken for high temperature heat network projects. This national assessment falls into the very first stage in the process, which is one of strategy development, mapping and masterplanning. Multiple options remain under consideration at this point, including different types, scales and configurations of heat network as well as other low-carbon heat technologies.
The process depicted in Figure 10 is not prescriptive. It is frequently the case – especially for smaller and simpler low temperature heat network projects – that many of the activities and stages shown in the diagram can be undertaken at low cost and with a light touch. Decision-making by private sector heat network developers or property owners engaged in decarbonising their stock might make reference to energy strategies and plans developed by others, and might combine feasibility work with business case development. Multiple stages of design may not be required for lower risk schemes.
Figure 10: Low temperature heat network project development process (adapted from Heat Network Support Unit materials)
The high-level statistics and charts presented in the previous section could be used to raise the profile of low temperature heat networks as building decarbonisation technology option, and therefore as a means to achieve the objectives of LHEES and national-scale targets. The information presented about opportunity characteristics only scratches the surface of the data that is available regarding each individual opportunity or the aggregated opportunities in an area. Users of the detailed data outputs can use this information to select priority opportunities for further development work. The detailed data may also serve as an input to energy planning processes that consider multiple technologies and energy vectors and the relationships between them. For some organisations, access to the datasets will require signing of and compliance with a data sharing agreement.
Data on the favourability of specific areas for shallow geothermal heat (closed loop and open loop boreholes) will be important for the further assessment of low temperature heat network opportunities in locations where other heat sources are not available. The British Geological Survey’s UK Geothermal Platform is a freely available web-based data resource that could be used to understand the potential yield from underground boreholes in the vicinity of an opportunity.
Characteristics generated by the national assessment that could be used to prioritise places for low temperature heat network development include (among many others):
The density of opportunities of any type, or of a particular type, could inform supply chain participants’ strategies with respect to geographic focus or types of environments that offer growth potential.
Social deprivation and fuel poverty probability indicators could enable the identification of places where low temperature heat networks might be able to have a positive impact on fuel poverty.
Opportunities with a high proportion of socially rented dwellings may represent favourable locations due to the likely concentration of property ownership among organisations with strong drivers to decarbonise heating systems.
The prevalence of polluting heating systems could enable prioritisation based on potential carbon savings.
Priorities for further work
The following list identifies priorities for further work that have been informed by desk research undertaken in support of the national assessment; stakeholder engagement; and analysis of the limitations of the national assessment methodology. More detailed potential improvements are explored in Section 7 of Appendix A.
Develop improved evidence regarding the relationship between properties’ heat demands and the maximum distances over which it is viable for them to connect to a low temperature heat network. Conduct sensitivity analysis on the assumptions that the national assessment used to understand the impact on the number and scale of opportunities identified.
Incorporate more recently-updated heat demand and opportunity characterisation data.
Expand and update the list of waste heat sources from which potential matches with low temperature heat networks are assessed. In particular, a larger number of wastewater treatment plants as well as recently-constructed and planned data centres could be added along with estimates of their heat supply potential.
Develop methodologies to analyse the likelihood of construction or relative attractiveness of specific opportunities.
Improve the evidence base around key topics identified by stakeholders:
The cost and affordability of heat from low temperature heat networks, and how it compares to alternatives (including business as usual);
Delivery vehicles appropriate to the development of low temperature heat networks;
Impacts on and interactions with nearby high temperature heat networks (both operational and planned);
Risks associated with the development of low temperature heat networks that differ from other heat infrastructure projects;
Timescales applicable to the project development process for low temperature heat networks;
Advantages offered by low temperature heat networks (relative to the alternatives) in specific geographical, built environment and social contexts.
Conclusions
Our work provides the first national-scale assessment of locations where there is strong potential for supplying heat through networks that are designed to operate at low temperatures (typically less than 35 degrees centigrade). The results of our assessment can be used for purposes that include local and national energy planning, project identification and prioritisation, public engagement (including awareness-raising), business planning and strategy development, knowledge-building and as an input to future research.
Our approach builds on those previously used in the assessment of high temperature heat network opportunities at national scale, and more localised work focusing on low temperature networks. Future assessments will be able to repeat and/or build on a tested, refined and documented methodology that has been designed with replicability in mind.
Our national assessment identified a total of 11,109 Multi-Building Opportunities and 16,985 Communal Opportunities across Scotland. These opportunity groupings collectively represent around 900,000 dwellings and 100,000 non-domestic properties. They include around a third of the country’s housing stock and around a third of Scotland’s non-domestic properties. In practice, not all properties within the identified opportunities are likely to choose to or be able to connect to a network. These totals represent an estimate of the potential, given the assumptions made and within the range delineated by the identification and classification criteria used (minimum and maximum property counts).
The majority of the opportunities identified involve relatively small numbers of heat-using properties. However, there are also a small number of opportunities with high significance in terms of their total heat demand. These include groupings with a large number of properties and those with one or more large anchor loads. Around 350 opportunities have total heat demands exceeding 10,000 MWh per year. High Property Count Areas represent a further approximately 350 groupings with total heat demands ranging from around 13,000 MWh to around 290,000 MWh.
The findings also support the idea that the future market for low temperature heat networks could potentially be much larger than it is at present. That said, this research has not compared low temperature heat networks against other zero-emissions heating solutions or sought to identify optimum solutions. The actual contribution that low temperature heat networks can make to net zero will depend on the number and characteristics of places in which they represent the ‘best’ solution. Small- and medium-scale high temperature networks may be more cost effective than low temperature heat networks in some of the contexts drawn out by this research.
Low temperature heat network opportunities can be found in each of Scotland’s 32 local authority areas. When depicted on a map, the concentrations of opportunities in the country’s more heavily populated regions (the Central Belt and the urban areas around Aberdeen and Dundee) are evident. However, it is also clear that opportunities can be found in the majority of Scotland’s towns, and in rural and coastal villages throughout the Scottish mainland and islands. Opportunities exist right up to the country’s extremities: from Unst to the Rhins of Galloway, and from Barra to the Berwickshire coast. This finding supports the conclusion that all Scottish local authorities should consider low temperature heat networks in future iterations of their LHEES. It could also support decision-making in the supply chain by organisations that may be planning entry into new geographic markets. Other possible uses of the findings regarding geographic distribution relate to electricity infrastructure planning and regional economic development activities.
The information generated about individual opportunities allows them to be ranked and prioritised relative to other opportunities, supporting project identification. This could be relevant for owners of property portfolios (including Registered Social Landlords) as well as heat network project developers. However, the data outputs associated with any one opportunity must be viewed as indicative, and suitable for justifying further project development work rather than supporting significant project-level decisions.
In conclusion, the national assessment provides important new information concerning the potential for supplying heat through low temperature heat networks in Scotland. Provided that the limitations associated with its ‘first pass’, top-down and experimental nature are appropriately recognised, the national assessment can immediately and meaningfully support energy planning initiatives and project identification. The approach developed is suitable for future replication, giving it the potential to contribute to the reduction of greenhouse gas emissions in the built environment over a longer timescale. It provides a national evidence base to support further investigation and informed decision making on low temperature heat networks.
Barns et al., 2026. Opportunities and costs for shared ground loops. Renewable and Sustainable Energy Reviews, 228, 116490. Available at: https://doi.org/10.1016/j.rser.2025.116490.
Fernández et al., 2025. The integration of heat pumps into the thermal systems of hospital facilities to advance their transformation towards Zero-Emission Buildings. Journal of Building Engineering, 111, 113531. Available at: https://doi.org/10.1016/j.jobe.2025.113531.
Few et al., 2023. The over-prediction of energy use by EPCs in Great Britain: A comparison of EPC-modelled and metered primary energy use intensity. Energy and Buildings, 288, 113024. Available at: https://doi.org/10.1016/j.enbuild.2023.113024.
Kensa Group Response: Environmental Audit Committee Inquiry Heat resilience and sustainable cooling August 2023. Available at: committees.parliament.uk/writtenevidence/123197/pdf/ (Accessed: 21 January 2026).
Sinclair and Unkaya (BRE) for ClimateXChange, 2020. Potential sources of waste heat for heat networks in Scotland. Available at: http://dx.doi.org/10.7488/era/730.
Zero Waste Scotland, 2024. Identifying opportunities for shared loop GSHP: Principles to indicate specific prospects (Confidential).
Appendices
Introduction
This Appendix begins by setting out the ‘model’ scope and specifications, where the ‘model’ is defined as the process for delivering the national assessment of low temperature heat network opportunities using input datasets, assumptions, calculations and geospatial processes. Chapter 4 of this Appendix sets out the key decisions that shaped the design of the model: the strategic approach; key concepts, assumptions and limitations; screening decisions; and data quality risk assessment and mitigation. Chapter 5 sequentially lists the steps followed to execute the model. The final sections discuss the quality assurance activities carried out by the researchers and Scottish Government representatives, and then go on to discuss potential improvements.
Model scope
Summary statement
The model delivers a national assessment of locations that are potentially suitable for low temperature heat networks in Scotland. The research supports the Scottish Government’s priority to reduce greenhouse gas emissions in the buildings sector.
Model details
Key outputs
The key outputs generated by the model are:
geospatial polygons representing Multi-Building Opportunities and High Property Count Areas (both defined later in this Appendix), with attribute data;
geospatial points representing Communal Opportunities, Public Sector Anchor Loads, Other Anchor Loads, Potential Heat Sources and Potential Cooling Customers (all defined later in this Appendix); and
geospatial data presentations (geopackages) which allow different elements of the polygons/points and their distributions to be viewed and interpreted.
Key inputs
The key data sets used by the model are the Scotland Heat Map 2022, Home Analytics v4.1, Non-Domestic Analytics v2.0, Green Heat in Greenspaces and the UK Geothermal Platform Summary Layers.
Boundaries and geographic scope limitations
The spatial extent of the model is the areas enclosed by (collectively) the boundaries of the 32 Scottish local authority areas, plus (where not already included) water bodies within 100 metres of local authority areas. The built environment modelled is limited to those properties which have demand for heat and feature in the 2022 Scotland Heat Map, which means it does not include recent new build or planned developments.
The low temperature heat network opportunities identified are not influenced by the presence of demand for cooling, which in practice could improve project viability. However, potential larger cooling customers within heat network opportunity groupings have been identified.
Model specifications
For the purposes of this section, the ‘model’ is defined as the process by which the national assessment has been delivered.
The model was required to identify locations likely to be suitable for low temperature heat networks in Scotland, and to generate data outputs that characterise the potential opportunity at each location. From these data outputs, national-level or regional-level numerical summary results were generated.
The model was also required to generate mapping visualisations that users could use to understand the distribution of opportunities across Scotland and at a more localised level, and to inspect individual opportunity locations. Geospatial data outputs were required in order that certain users could incorporate the results of the national assessment into their own geospatial information systems (GIS) environments, integrate with their own data and perform their own follow-on analysis.
The map visualisations and geospatial data outputs also illustrate the distribution of characteristics and conditions that tend to make a location suitable for low temperature heat networks. Users can use these characteristics to carry out their own prioritisation of opportunities.
The model comprises data inputs, calculations and processes and data outputs.
Data inputs
The datasets that provided inputs to the model are listed in Table 8.
Screening of heat demands and heat sources (see Section 4.3)
Editing of a small number of influential outliers (see Section 4.2.1.4)
Presence of influential heat demand outliers
General accuracy of heat demand estimates, building height estimates, building use classifications, heat source supply potential
Home Analytics Scotland v4.1
Comma separated values
Merging multiple files
Transformation into geospatial database format
Data minimisation (removal of unneeded fields)
General accuracy of fuel poverty probability estimates, heating fuel and heating system data
Relevance of LHEES Categories data for this national assessment
Non-Domestic Analytics v2.0
Geospatial database
Data minimisation (removal of unneeded fields)
General accuracy of heating fuel and heating system data
Accuracy of public building identification
Green Heat in Greenspaces
Geospatial database
Screening of smaller green spaces
Accuracy of spatial mapping of open green space
UK Geothermal Platform Summary Layers
Geospatial database
Data minimisation (clipping to study area)
Accuracy limitations stated by the creators
Ordnance Survey MasterMap
Geo-package
Data minimisation (clipping to study area)
Accuracy of representation of real-world buildings
Ordnance Survey Zoomstack
Geospatial database
Data minimisation (clipping to study area)
Gaps in mapped barrier features
Mapped barrier features relevance to real physical barriers
2022 Data Zone boundaries
Geospatial database
Not needed
2020 Scottish Index of Multiple Deprivation
Geospatial database
Not needed
Scottish Government Urban Rural Classification 2022
Geospatial database
Not needed
Census 2022 Output Areas
Geospatial database
Not needed
Table 8: Data inputs, summary of pre-processing and summary of data quality assessment
An additional dataset has been compiled by the researchers from a web search for operational and planned data centres in Scotland.
User inputs
Users will only interact with the outputs of the model, which represent a single, static scenario. Users viewing the outputs through GIS software will be able to select different pre-defined views of the data, and to apply filters to create their own desired presentations. Users will not specify any parameters that influence the outputs, although they will be able to create modified versions of the outputs (including adding or deleting geospatial features and overwriting attributes). A master copy of the outputs will be held by Scottish Government and represents an unaltered ‘single source of truth’.
Model outputs
Table 9 lists the layers included in the geospatial data outputs.
Layer name
Description
Format
Communal Opportunities
Buildings featuring a large enough number of individual heat-using properties, for which a communal low temperature heat network solution is likely to be a viable option.
Point data
Multi-Building Opportunities
Groupings of buildings in which a number of individual heat-using properties have been linked to each other through proximity analysis to indicate an opportunity for one or more low temperature heat networks. Multi-Building Opportunities do not include any heat demands which are present within Communal Opportunities.
Polygons
High Property Count Areas
Groupings of buildings, linked to each other through proximity analysis, but featuring a large enough number of properties that there are likely to be many opportunities for low temperature heat networks. High Property Count Areas are defined as groupings containing more than 1,000 heat demands.
Polygons
Public Sector Anchor Loads
Individual properties within Multi-Building Opportunities that are designated as public buildings and have estimated annual heat demands exceeding 100 MWh per year.
Point data
Non- Public Sector Anchor Loads
Individual properties within Multi-Building Opportunities that are not designated as public buildings and have estimated annual heat demands exceeding 200 MWh per year.
Point data
Potential Waste Heat Sources
Buildings, utilities assets or industrial facilities that represent possible waste heat sources for low temperature heat networks and have been matched to Communal Opportunities or Multi-Building Opportunities through proximity analysis.
Point data
Potential Cooling Customers
Buildings or industrial facilities that represent possible cooling customers within Multi-Building Opportunities
Point data
Table 9: Data outputs
Table 10 lists the visualisations that were created and included in the geopackages for the purpose of assisting users to understand the spatial and statistical distributions of different parameters. Not all visualisations are made available to all users (as per data sharing arrangements).
View name
Description
Format
MBO Raster
A raster that displays the heat demand distribution within Multi-Building Opportunities, aggregated to 50 metre by 50 metre squares (Scale = 1:12,500 – 0)
Raster
Density
A large-scale view of part or all of Scotland, with the aggregated number of opportunities displayed for generalised areas
(Scale = 1:100,000,000 – 1:50,000)
Point cluster
SIMD
A localised view showing opportunities visually coded according to the majority value of the Scottish Index of Multiple Deprivation decile for each grouping (Scale = 1:50,000 – 0)
Polygons
Grid Capacity
A localised view showing opportunities visually coded according to their electricity grid capacity band (see Section 4.2.11 of this Appendix) (Scale = 1:50,000 – 0)
Polygons
Social Tenure
A localised view showing opportunities visually coded according to the proportion of dwellings that are socially rented (three bands: Low, Medium and High Social Tenure)
(Scale = 1:50,000 – 0)
Polygons
Fuel Poverty
A localised view showing opportunities visually coded according to their fuel poverty band (see Section 4.2.12 of this Appendix) (Scale = 1:50,000 – 0)
Polygons
Fuel Type
A localised view showing opportunities visually coded according to the distribution of existing fuel types among included properties. Five bands:
100% gas
80-100% gas, diverse other fuels*
0-80% gas, diverse other fuels*
0% gas, diverse other fuels*
0% gas, 100% electricity
* diverse other fuels may include oil, LPG, electricity and other fuels
(Scale = 1:50,000 – 0)
Polygons
Heat Source Led
A localised view showing opportunities visually coded according to whether they belong to the Heat Source Led archetype (“YES”) or not (“NO”) (Scale = 1:50,000 – 0)
Polygons
Anchor Load Led
A localised view showing opportunities visually coded according to whether they belong to the Anchor Load Led archetype (“YES”) or not (“NO”) (Scale = 1:50,000 – 0)
Polygons
Table 10: Geospatial visualisations
Calculations and processes
Figure 11 summaries the logical steps that lead to the delivery of the spatial polygons and point data that comprise the model outputs.
Figure 12 summarises the high-level processes that match non-contiguous heat sources to opportunities for the purposes of opportunity characterisation.
Output: Multi-Building Opportunity and High Property Count Area datasets
Output: Communal Opportunity datasets
** The main working dataset is a data-minimised version of the ‘Heat demands’ layer of the Scotland Heat Map, with minor additions created in Step 2.
* The creation of a geospatial layer representing physical barriers was an activity carried out in parallel to Steps 1 to 4.
Figure 11: Flow chart summarising the high-level processes leading to the data outputs
Waste heat sources
Green spaces and water bodies
Figure 12: Flow chart summarising the high-level processes that match non-contiguous heat sources to opportunities for the purposes of opportunity characterisation
Software requirements
The geospatial outputs are provided in a format that can be opened by all major Geospatial Information Systems (GIS) software packages.
Model design
The model comprises data inputs, calculations and processes and data outputs. The data inputs and data outputs exist in static format, with their version indicated in filenames and accompanying documentation. The calculations and processes that generated the data outputs are documented in this section and Section 5 of this Appendix but are not otherwise retained. The model does not require maintenance.
An Assumptions Log accompanies the data outputs. All assumptions listed in the Log have been addressed in this Appendix.
Data quality impacts were assessed, and for the most part the response was to accept the impacts as a limitation of the methodology. In this chapter, data accuracy considerations are discussed alongside the concept to which they relate.
The input datasets used represent the most comprehensive datasets available that are fit for the purpose required. However, for a small number of issues, active responses were developed and are described in this chapter and Section 5.1.3.
Strategic approach
The model design aimed to identify clusters of heat demands that correlate reasonably well with real-world opportunities for low temperature heat network deployment, but aimed to minimise the influence of more subjective assumptions. By attaching informative attributes to the groupings, they become characterised opportunities. These attributes highlight those aspects that could significantly influence the attractiveness of the opportunity to certain stakeholders (who will bring their own implicit weightings to the different characteristics). The exception to this is a scale-based screening parameter that has been applied to ensure that outputs are manageable in number (preferring a large number of reasonably-sized opportunities over a very large number of opportunities dominated by very small schemes).
Stakeholder engagement
The development of the methodology for the national assessment was supported by a multi-stage programme of stakeholder engagement involving a broad range of organisations. This engagement ensured that the research approach, underlying assumptions and emerging findings were informed by the practical experience, operational knowledge and strategic priorities of organisations active in Scotland’s heat, energy and infrastructure sectors.
A series of four stakeholder events were delivered during the research period, comprising two workshops in August 2025 and two workshops in November 2025. These events brought together representatives from local authorities, network operators, public bodies, heat network developers, community energy groups, national agencies and academic or technical specialists. All 32 Scottish local authorities were invited to attend these events, ensuring that every council had the opportunity to contribute local knowledge and perspectives. The workshops enabled participants to:
review and discuss the emerging methodology for identifying low temperature heat network opportunities;
provide feedback on key modelling assumptions, including definitions of opportunity types, thresholds, and data inputs;
explore early spatial outputs and identify areas where local knowledge could complement national datasets;
highlight known constraints, operational considerations and integration challenges relevant to heat network deployment; and
share examples of ongoing or planned heat decarbonisation activity that could influence interpretation of the assessment outputs.
In addition to the group workshops, we held a series of one-to-one meetings with key stakeholders to gather deeper technical insights and address topic-specific considerations. Organisations engaged through these targeted discussions included Scottish Power Energy Networks (SPEN) and the British Geological Survey (BGS).
Collectively, the stakeholder engagement process strengthened the robustness of the national assessment, helping to validate the suitability of key assumptions, highlight limitations inherent in national scale datasets, and ensure that the final geospatial outputs are aligned with the needs and expectations of future users—including local authorities, public sector organisations and industry partners.
Model concepts, assumptions and limitations
Heat demands and distances between potential connections
Heat demand proximity analysis assumptions
The amount of heat needed by an individual property has a very strong influence on the distance over which it is viable to connect its heating system to a local heat network. The national assessment took an approach common to most other relevant past assessments: calculating an estimated maximum connection distance between heat demands that was directly proportional to the sum of the heat demands.
For almost all properties, the formula used to calculate the maximum connection distance was:
The divisor of 2,000 (units: kWh per year per metre) is a proxy for the Linear Heat Density that could be achieved by the relevant section of a low temperature heat network. The Linear Heat Density (LHD) is a measure of the amount of heat supplied through part or all of a heat network relative to the total length of pipe route in that (part-)network. For prospective heat network opportunities, the LHD is a relatively strong indicator of the likely financial viability of the network. A high LHD implies that more heat will be supplied (generating revenue and/or cost savings) through a shorter amount of pipework (costing less to install and maintain).
Stakeholders were consulted on the fundamentally influential LHD-proxy assumption of 2,000 kWh per year per metre, with general support expressed for this value. It also aligns with a value used in a previous assessment carried out by Zero Waste Scotland and Buro Happold for low temperature heat networks in Argyll and Bute, which was informed by engagement with an experienced low temperature heat network developer. This assumption was further justified through our development of prototype comparative cost models.
The Linear Heat Density of a theoretical pipe route that connects two individual buildings is conceptually different from the overall Linear Heat Density of a heat network. The latter measure takes into account the fact that pipe routes often deviate significantly from the shortest possible route between two points, and that not all buildings within a defined area will necessarily have connected to the network. The overall LHD of planned and operational low temperature heat networks can be less than 2,000 kWh per year per metre, often considerably so. Averfalk et al. for IEA (2021) assessed 37 heat networks across the world, most of them low temperature heat networks or operating at less than 65 degrees centigrade for most of the year. The authors found that almost half of these networks exhibited values below 1,000 kWh per year per metre including delivered cooling energy as well as heat (meaning that their heat-only LHD could be even lower).
It is possible that schemes exhibiting lower heat demand densities can be viable. A major developer of low temperature heat networks suggested in a submission to the UK Parliament Environmental Audit Committee (Kensa, 2023) that a heat demand density of 500 kWh per metre per year could indicate viability. However, the aim of this research to identify locations likely to be suitable for these types of heat networks (rather than only possibly suitable) justifies the selection of a higher number.
If the LHD-proxy value chosen had been higher, fewer opportunities would have been identified, and they would have tended to be smaller. If the LHD-proxy value had been lower, more opportunities would have been identified, and they would have tended to be larger.
It is recommended that any future studies that require an LHD-proxy value for the identification of low temperature heat network opportunities assess the evidence available at the time to select an appropriate assumption.
There is on average a difference between real-world heat consumption of a property (lower) and the estimated heat demand in the dataset used (higher) (Few et al., 2023, and discussed in more detail in Section 4.2.1.3). The selection of a 2,000 kWh per metre per year divisor, rather than a lower figure, offers the benefit of slightly compensating for the overestimation of heat consumption.
One group of properties for which a different divisor was used was public sector anchor loads. In recognition of the strong motivations that the owners of these properties have to decarbonise (among other factors), a divisor of 1,500 kWh per metre per year was used. This assumption was also tested and agreed with stakeholders.
When identifying spatially dispersed Multi-Building Opportunities, we applied a limit of 1 km to the maximum distance over which two buildings can be grouped into an opportunity (without there being additional buildings in between). This meant that the distance between buildings within an opportunity area did not risk being unrealistically large. However, in exceptional circumstances, connections exceeding the 1 km threshold adopted could be feasible. For example, a building with a very large heat demand, such as a hospital or higher education campus, may be separated from other buildings by open space through which it is reasonably cheap to construct a pipeline. The viability of a heat network involving this long connection could be further enhanced if an attractive heat source could be accessed by connecting across the space; if the land between is under single ownership or a small number of owners; or if the large heat user exhibited low seasonality in its heating demand or required cooling outside the heating season.
If the maximum connection distance had been higher, more opportunities would have been identified, and they would have tended to be larger (and vice versa).
Heat demand proximity analysis mechanics
An important distinction between two types of low temperature heat network concerns the number of buildings which are served by the network. Our process separated ‘Communal Opportunities’ (blocks of flats, tall tenement buildings and large multi-occupancy commercial buildings) from opportunities that consist of clusters of separate buildings. Communal Opportunities were identified by grouping heat demands that shared a building footprint in the Ordnance Survey MasterMap Buildings data layer, and where the majority of heat demand records infer that the estimated building height is at least 7.5 metres. Although not perfect, these criteria tend to include blocks of flats, tenements and taller mixed-use buildings while excluding houses.
Buildings whose height has been overestimated will have occasionally been misclassified as a Communal Opportunity. However, this categorisation is arbitrary – and despite the building’s height it is still possible that a communal system is appropriate. If a building’s height has been underestimated, a genuine opportunity for a communal system may have been missed – but the heat demands in that building will have had the chance to be picked up in a Multi-Building Opportunity.
Once the heat demands that had been grouped into Communal Opportunities had been identified, the master dataset of heat demands was separated into two parts: one containing the heat demands belonging to Communal Opportunities and one containing all other heat demands. The latter part-dataset went forward to the Multi-Building Opportunity identification process.
The Communal Opportunities did not form part of the Multi-Building Opportunity identification process. The approach taken ensures that Communal Opportunities are not double counted when low temperature heat network opportunities are considered as a whole. Communal Opportunities often represent locations where real schemes could be implemented relatively simply and potentially quickly.
A potential limitation of this approach is that some buildings near to Communal Opportunities, but which are not close enough to other individual or smaller multi-property buildings, may not be identified as belonging to any low temperature heat network opportunities. Rarely, a Communal Opportunity might form a ‘bridge’ between two small clusters of buildings that on their own fall short of being identified as Multi-Building Opportunities. These limitations are expected to have a relatively small impact on the overall results of the national assessment. If a particular Communal Opportunity is subject to further project development investigation, the potential to extend the network to nearby buildings should be considered. Similarly, the potential for the properties in the building to be served from a wider multi-building network (perhaps centred on an anchor load or accessing attractive heat sources) should be considered.
To identify sets of buildings that could be grouped together into Multi-Building Opportunities, spatial buffers were created around the point locations of heat demands. The radius of these circular buffers was calculated for each point using the estimated heat demand and the LHD-proxy values, enforcing the 1km maximum radius described in the previous section. Where the buffer circles overlap, heat demands have the potential to be linked to each other in a single grouping. If no overlap occurs, heat demands cannot be part of the same cluster. Various additional steps, described in subsequent sections, deal with the influence of physical barriers and inclusion/exclusion criteria for the groups that are generated.
The proposed proximity analysis methodology was explained to stakeholders in advance of its final selection and execution. Stakeholders expressed agreement with the suitability of this approach to the purpose of identifying low temperature heat network opportunities.
Heat demand accuracy
Other than its location relative to others, the estimated heat demand of a particular address is the main parameter that determines whether it is included in an opportunity grouping or not. The total heat demand of an opportunity group is also an important piece of characterising information. The dataset from which heat demand estimates were taken is the Scotland Heat Map 2022 (SHM). The vast majority of the heat demand estimates in the dataset used are modelled values rather than measured values.
Consideration was given to using the more recent heat demand estimates available in the Home Analytics and Non-Domestic Analytics datasets. However, it was determined that the advantages offered by the newer datasets were offset by the risk that errors would arise in the matching and merging processes that would be required to integrate datasets that each represent snapshots at different points in time. For example, the classification of residential institutions has changed in recent years.
The SHM heat demand estimates are derived from multiple sources. The highest-confidence values are collected from energy billing or procurement data or derived from metered energy consumption. Medium-confidence estimates are derived from Energy Performance Certificates (the production of which involves physical surveys and some building energy modelling) or Home Analytics modelling.
The lowest-confidence estimates derive from floor area, building age and property type or building use information (with some of these parameters inferred by modelling if they are not known[4]). The low-confidence estimates rely on benchmark heat demand figures according to building use (non-domestic properties) or property age and type (dwellings). The benchmarks are subject to adjustment where insulation is present, or to account for climatic variation across Scotland. Full detail on the derivation of heat demand estimates can be found in the Scotland Heat Map User Guide (Scottish Government, 2023).
The Home Analytics modelling that underlies almost half of domestic heat demand estimates in the SHM is generally representative of the Scottish housing stock. It is reasonably accurate in terms of its ability to replicate the heat demand estimates generated by the Energy Performance Certificate (EPC) production process (Energy Saving Trust, 2025a). However, the production of EPCs itself involves some simple modelling of a property’s heat requirements based on observations made during a physical survey. EPCs – and therefore any modelling that tries to achieve good correlation with EPC heat demand estimates – tend to overestimate heat demand relative to real-world consumption (Few et al., 2023). If heat demand estimates were more realistic (generally lower), fewer opportunities would have been identified through the national assessment, and they would have tended to be smaller.
The version of the Scotland Heat Map used for the national assessment did not incorporate heat demand estimates from the Non-Domestic Analytics dataset. Instead, heat demands are either estimated from building use classifications, floor areas and benchmarks; from EPCs; or from energy billing data collected from various public sector organisations. For non-domestic properties, the heat demands estimated using benchmarks (least confidence) vastly outnumber those derived from EPCs, which in turn outnumber those derived from billing data (best confidence). Furthermore, the heterogeneity of non-domestic properties further reduces the confidence that can be placed in modelled heat demand estimates, whether they were produced for the purposes of an EPC or calculated using benchmarks (Energy Saving Trust, 2025b).
For the national assessment, the impact of uncertainty in non-domestic heat demand estimates is likely to be greater than the impact of uncertainty in domestic heat demand estimates. This is because almost all of Scotland’s larger “anchor load” heat demands are non-domestic, and non-domestic heat demands are on average higher than domestic heat demands. These facts, combined with the level of uncertainty that applies to non-domestic heat demands, impact the results of the national assessment in the following ways:
Non-domestic properties’ proportionally larger contribution to opportunity groupings’ heat demand translates into amplified uncertainty on the total heat demand of an opportunity grouping that includes non-domestic properties (and any quantities or conditions derived from the heat demand, including the matching of heat sources to opportunity groupings).
Non-domestic properties tend to be possible to connect to other buildings over larger distances. These distances can be considerable (up to 1km). In proximity analysis, ‘anchor loads’ often enable the inclusion of many smaller heat demands that fall within their maximum connection radius. Overestimated anchor load heat demands will tend to result in anchor load-led opportunities that are larger in area, have higher property counts and have higher total heat demand than would otherwise be the case. Underestimated anchor load heat demands will have the inverse impact, with the additional result that in some instances opportunity groupings may be missed entirely if they fall below the property count thresholds chosen for the national assessment.
The SHM and Home Analytics datasets are unavoidably biased towards newer, urban properties that have recently been built, bought, sold or had significant retrofit work completed (thus triggering the requirement for an EPC to be produced and lodged). This means that, in general, there is lower confidence in the data reported for rural areas.
Heat demand outliers, unfeasible heat demands and distance constraints
The national assessment dealt with exceptionally large heat demands both through the imposition of limits within heat demand proximity analysis and through selected overwriting of heat demand data.
The maximum distance between potential connections was not allowed to exceed 1 km. This action reflects real-world constraints that are likely to apply, but also effectively places a cap on the influence of an individual property’s heat demand in terms of the formation of a cluster, thereby nullifying large outliers.
In general, as the distance in between two heat demands increases, the probability of encountering one or more obstacles that are very difficult or expensive to cross increases. The cost and/or difficulty of passing such obstacles may not be justified, rendering the connection unviable. Longer distances also tend to incur greater pumping costs and, where applicable, greater heat losses. It is therefore appropriate to set a threshold distance above which it is assumed that the likelihood of a connection being viable becomes low. One of the world’s largest low temperature heat networks in Heerlen, Netherlands, involves maximum inter-building distances of 800 to 1,000 metres as the crow flies (Brummer and Bongers, 2019).
The Scotland Heat Map contains a small number of erroneous outlier heat demands. We concluded that around 16 of the 41 largest heat demands (those estimated in the SHM to consume more than 20,000 MWh per year) were overestimated by a factor of 10 or more, based on consideration of the floor area and the most energy-intensive heat demand benchmark from CIBSE’s TM46 Energy Benchmarks publication (CIBSE, 2008). These 16 heat demands represent less than 0.01% of the non-domestic heat demands in the SHM, and less than 0.001% of all heat demands in the SHM. A further 12 of the largest heat demands were also determined to be likely to have been overestimated, but to a smaller degree.
These 28 outlier heat demands were edited for the purposes of calculating the total heat demand within an opportunity grouping, to improve the accuracy of opportunity characteristics and the statistics derived from them. This adjustment reduced the number and impact of unrealistic totals reported as characteristics of opportunities. Adjustments were only made to non-domestic properties with a heat demand exceeding 20,000 MWh per year, and a reported ‘confidence level’ which suggested that the heat demand had been modelled rather than being based on actual reported energy use. The heat demand was reduced to 20,000 MWh/year or 1 MWh/m2/year (whichever was lower). This does not represent a theoretical maximum demand that can be connected to a low temperature heat network, but rather an adjustment to reduce the impact of very large potentially erroneous heat demands.
Considering buildings that are typically space heated throughout (i.e. excluding industrial sites and distribution and logistics centres), many of Scotland’s largest properties by floor area are hospitals and higher education buildings. These large public buildings often have heat demand estimates that are derived from metered consumption data (hence have a high confidence level). Consideration of the metered heat demand figures for Scotland’s largest hospitals and higher education buildings leads to the conclusion that the country’s largest combined space heating and hot water loads are in the region of 20,000 MWh per year (only one hospital exceeds this value). The overwriting process described in the previous paragraph does not impact the heat demand estimates for hospitals or higher education facilities where their ‘confidence level’ is the highest value (5).
The second criterion for limiting heat demand estimates is justified by consideration of fuel demand benchmarks included in CIBSE’s TM46 Energy Benchmarks publication (CIBSE, 2008). Of the 29 categories of building for which energy benchmarks are stated, the most heat-intensive is “Swimming pool centre”, with a benchmark of 1,130 kWh per year per square metre of floor area. This benchmark is stated in terms of fossil fuels used for heating, meaning that it corresponds approximately to a heat demand of 1,000 kWh (or 1 MWh) per year per square metre. The researchers chose to use this value as representing the highest reasonable heat use intensity for the purposes of adjusting large outlier heat demands.
These 28 heat demand adjustments result in a reduction of between around 1,000 MWh/year (smallest adjustment) and 1,000,000 MWh/year (largest adjustment) in the heat demand of the opportunity groupings in which these properties lie. These adjustments affect the total heat demand of relevant opportunity groupings, but not the list of properties included in the groupings (because maximum connection distances were already capped at 1km, meaning that all heat demands above 2,000 MWh/year (or 1,500 MWh/year for public anchor loads) have the same maximum connection distance).
A further adjustment was made to hospitals with heat demands exceeding 10,000 MWh per year, regardless of the basis of the heat demand value. This adjustment sought to account for the fact that in medium-to-large-sized hospitals a significant proportion of the overall heat demand relates to uses that can be served only from high-temperature sources. An energy model of a medium-sized hospital in Spain was developed by Fernández et al. (2025). The researchers went expanded the simulation to additional locations, including London. The London results were used to estimate the proportion of heat demand that could be met from a low temperature heat network supplying heat into existing hot water distribution systems. (The heat demanded by existing steam-using systems was assumed to be not easily met from a low temperature heat network. Multi-stage steam-generating heat pump systems are technically feasible but offer minimal operational cost benefits relative to electric steam generators, which are cheaper to install.) The assumed proportion of hospital heat demand that was included in aggregated heat demand totals within opportunity groupings was 42.5%. An adjustment was applied to a total of 17 hospitals.
It was noted through work on this assessment, and our past experience working with the Scotland Heat Map, that one circumstance that can lead to outlier heat demands is a large supermarket with one or more concessions within it and/or an internal café restaurant. Anomalous heat demands occur when the large floor area of the supermarket is divided equally between several use classes (as per the methodology followed in the development of the SHM), rather than the actual floor areas being applied. The heat demand benchmark for the “Restaurant / Cafeteria” use class is more than 3 times higher than the benchmark for the “General Retail” use class. A high heat demand benchmark therefore gets applied to a falsely large floor area that has been assigned the “Restaurant / Cafeteria” use class.
The prevalence of this circumstance within West Lothian and an area of Glasgow peripheral to the city centre was investigated. While several instances were noted of “Restaurant / Cafeteria” UPRNs having high assigned floor areas, some of these shared a building with other heat-intensive use classes (e.g. Hotel). It was therefore decided that adjusting “Restaurant / Cafeteria” heat demands across the board was not appropriate.
Influence of physical barriers
The aim of the national assessment was to identify locations likely to be suitable for low temperature heat networks in Scotland. This meant that the identification process needed to take constraints into account, including physical barriers to construction.
Ordnance Survey mapping layers (from the OS Zoomstack product) were used to create a combined “Barriers” spatial dataset. This was then used to cut the heat demand buffer areas, effectively representing some of the physical features that often prove too costly or impossible for low temperature heat networks to cross. The barriers applied include major roadways (motorways and A-roads), railways, woodlands and waterways.
The application of these barriers in the analysis of spatially dispersed heat demand groupings had a direct impact on opportunity identification, preventing connectivity across features that pose a high likelihood of obstructing or increasing cost and complexity for a heat network. The resultant opportunities are therefore smaller, more realistic zones of demand.
However, the mapping of the physical features did not entirely meet the needs of this assessment. Sometimes gaps in the mapped ‘barrier’ features (such as bridges over watercourses) prevent clusters from being cut fully. This means that they remain as a single polygon and are treated as a single Multi-Building Opportunity. Consequently, a barrier with a gap in the wrong place does not have an impact on the final clusters. This is reasonable in the case where a real physical feature like a bridge happens to provide an opportunity for low temperature heat network pipe routing, but these circumstances are rare.
Another limitation of the method to account for physical barriers arises from the fact that elevated features such as viaducts, flyovers and aqueducts are mapped as barriers but do not impose constraints in the real world. These elevated features are not separately identifiable within the dataset. Consequently, some clusters are cut where they should logically be continuous.
Nevertheless, the application of mapped barriers normally improves the credibility of the opportunities identified by accounting for real world constraints and not treating heat demand proximity as the sole determining factor of viability. That said, the opportunity areas are indicative zones of interest rather than firm extents of possible schemes. Local knowledge and further analysis are required to develop the opportunity areas identified by the national assessment into defined potential schemes that respond to the barriers that exist in a particular location.
Number of potential connections
In order to constrain the number of opportunities identified to a manageable total, and focus attention on the opportunities with more significant potential decarbonisation impact, we determined that the national assessment would only map and characterise opportunities above a certain size threshold. We included opportunities where at least 10 homes could be connected to a network, or 5 properties that are not homes. If there was a combination of homes and other types of property, a formula weighed them up:
It must be emphasised that low temperature heat networks can still be a good idea for smaller groups of properties. A review of 34 operational Shared Ground Loop[5] schemes in the UK (Barns et al., 2026) found that 13 of 34 (38%) schemes connected fewer than 20 heat pumps, with the minimum number of heat pumps being 2. The restriction on size adopted in this research ensured that the number of opportunities identified was large but reasonable, but does not imply that smaller schemes do not represent opportunities.
We also applied upper limits to the number of potential connections that could exist within the main opportunity groupings. If potential Multi-Building Opportunities would have exceeded these thresholds, we classified them as High Property Count Areas (HPCA) and treated them separately from Multi-Building Opportunities. The maximum number of heat demands within a Multi-Building Opportunity was set at 999; groupings of 1,000 or more are High Property Count Areas. The significance of HPCAs is described in the following Section 4.2.4.
The accuracy of property counts for opportunities depends on the accuracy and completeness of the mapping of Scotland’s heat-using properties, and the correct classification of property types and uses. In the time period since the production of the Scotland Heat Map dataset, some properties will have changed their occupancy type from domestic to non-domestic (or vice versa), and some properties will have become vacant or been demolished while others have been built or brought back into occupation. It is possible that, despite local authorities and the Ordnance Survey’s quality assurance processes, a small minority of property addresses have been incorrectly classified as being either domestic or non-domestic. The more detailed use classifications may also occasionally be inaccurate.
Misclassification of buildings in terms of use will have occasionally led to their exclusion from the dataset used to identify opportunities. This would have resulted in their exclusion from opportunity groupings, and could have potentially (but infrequently) caused entire opportunities to be missed. Misclassification will have occasionally led to the erroneous inclusion of buildings that are not actually good candidates for connection to low temperature heat networks. Where this has occurred, identified opportunities will have been more numerous and/or larger than they should have been. Misclassification is also a root cause of heat demand inaccuracy as explored in Section 4.2.1.3.
Recent new build and planned future new build are known omissions/exclusions from the national assessment due to data unavailability.
High Property Count Areas and High Heat Demand Areas
Some areas in Scotland are particularly ‘heat dense’ – either they have a great number of heat demands close together, or there are multiple properties present that demand especially large quantities of heat. Often both of these circumstances are present. These areas cover many of Scotland’s city centres and the centres of larger towns; they are also sometimes found in industrial areas or around very large hospitals.
These areas often have significant overlap with the areas that have previously been identified as promising for the development of high temperature heat networks. Within any of the areas of opportunity for low temperature heat networks identified by our research, it is possible that high temperature heat networks already exist or may be planned to be built. However, this is more likely to be the case in urban centres. In these places, low temperature heat networks may still be viable around the ‘edges’ of the high temperature networks.
High temperature heat network development aside, it is also the case that many options are likely to exist regarding the types and sizes of low temperature scheme that could be built in the most heat dense areas. For example, a single large scheme could be viable – but it may also be possible to develop multiple smaller schemes or to develop a large scheme in phases.
The proliferation of options for both high and low temperature heat networks means that it is particularly important that strategic energy planning is carried out before decisions are made about what should be built where. Energy planning seeks to find the optimum combination of solutions for the locality as a whole, which often differs from the combination of solutions that would arise if schemes were developed in isolation according to their own individual drivers.
To avoid implying that any one technological solution is best within the more heat dense zones, and to recognise the possibility that many separate schemes could be developed within those areas, we separated them from smaller Multi-Building Opportunities. This was done simply on the basis of the number of heat demands. Those areas with more than 1,000 heat demands were referred to as High Property Count Areas (HPCAs). It was found that the total heat demand of all properties within some HPCAs exceeded 100,000 MWh per year. This sub-group was referred to as High Heat Demand Areas.
High Heat Demand Areas do not represent a theoretical upper bound for the demand that can be supplied through a single low temperature heat network scheme. Although schemes larger than this could be conceived, it is also possible (and for many locations, likely) that an opportunity area with tens or hundreds of megawatts of total heat demand could be home to multiple smaller low temperature heat networks rather than a single scheme.
No Multi-Building Opportunities had total heat demands exceeding 100,000 MWh per year. Therefore, all High Heat Demand Areas were also High Property Count Areas.
Much less detailed characterising information was calculated for High Property Count Areas and High Heat Demand Areas than was the case for Multi-Building Opportunities.
A review of 34 operational Shared Ground Loop schemes in the UK (Barns et al., 2026) found that these schemes connected an average of 84 heat pumps, with the maximum number of heat pumps being 770. This justifies the selection of the threshold of 1,000 for the number of heat demands.
Presence of anchor loads
An anchor load is a large, heat user with a consistent demand whose substantial annual heating requirement provides a stable base of consumption, improving revenue certainty and supporting the overall viability of a heat network. The presence of one or more anchor loads within a Multi-Building Opportunity would typically make a low temperature heat network more likely to be viable in that location. In this research, an anchor load is defined as a non-domestic property with an estimated annual heat demand exceeding 200 MWh per year (or 100 MWh per year if it is a public sector building). Although it is often stated that public anchor loads are beneficial for heat networks of all types (e.g. Scottish Futures Trust, 2024), some stakeholders who we consulted questioned the ability of public sector buildings to act as proactive earlier adopters of the technology or initiators of new schemes.
If lower thresholds had been set for the identification of anchor loads, more anchor loads would have been identified (and more Anchor Load-Led archetype networks would have been identified). If higher thresholds had been used, fewer anchor loads would have been identified.
The classification of non-domestic buildings as public sector or not public sector is a new and experimental aspect of the Non-Domestic Analytics dataset. As such, its accuracy is not yet well understood. The misclassification of buildings as “public” will have infrequently led to their being linked to groupings across distances that would not have been possible had they been classified as “non-public”. Vice versa, some public buildings will have infrequently been missed from opportunities due to misclassification.
Locations not on the electricity grid
The methodology does not specifically exclude heat-using properties that are not served by a mains grid electricity supply. In practice, the development of low temperature heat networks in off-grid locations is likely to be challenging due to high electricity costs and capacity constraints. However, there is precedent for the adoption of heat pumps in off-grid locations (for example, in Knoydart). Users viewing the outputs of the national assessment should consider the possibility that some island and remote rural opportunities (including clusters of buildings on upland estates) may include off-grid buildings.
Proximity of favourable non-contiguous heat sources
The research mapped three different heat sources that could be beneficial to connect to a low temperature heat network despite spatial separation between the heat source and the heat demands. These heat sources were green spaces, water bodies and sources of waste heat. Table 11 lists the sources of information, and which quantities were used. The screening of heat sources is described in Section 4.3.2 of this Appendix.
Heat source
Data source
Data item(s)
Waste heat sources
Scotland Heat Map 2022 ‘Potential Energy Supply’ layer[6]
Waste heat locations (point data)
Waste heat supply name and sector
Estimated annual heat supply potential
Estimated temperature range of heat supply
Seasonal variation category
Waste heat sources
Web search for operational and planned data centres in Scotland
Addresses or postcodes of operational or planned data centres
Green space hosting closed or open loop boreholes
Green Heat in Green Spaces (GHiGS) dataset
Green space locations and boundaries
Water bodies (static water bodies, rivers, sea)
Ordnance Survey Zoomstack
Water body locations and boundaries
Table 11: Data sources for non-contiguous heat source information
The main dataset used to map waste heat sources dates from 2020 and only identifies 9 data centres (although acknowledges that there was a higher number operating at that time). Since 2020, new data centres have been constructed and many more are planned, including some very large facilities. Data centres could be a key source of heat for low temperature heat networks, with very substantial total annual supply potential. Due to the potential importance of this class of waste heat source, we expanded the mapping of data centres through additional data gathering from publicly available online sources including Data Center Map (2025), cross-checked with other sources located through web searches. These extra data centre locations were not characterised with any estimates of heat supply potential. The additional data centre locations which were matched with opportunities are listed in Table 12.
Name
Location
Status
ATOS Livingston
Livingston, West Lothian
Operational
DataVita DV2
Glasgow City Centre
Operational
IFB Union Street
Aberdeen City Centre
Operational
brightsolid Aberdeen
Aberdeen
Operational
Apatura Coldstream
Coldstream, Scottish Borders
Planned, with operation expected circa 2030
Cato Data Centre
Auchtertool, Fife
Planned, with key agreements secured
Table 12: Additional data centre locations
The Scotland Heat Map ‘Potential Energy Supply’ layer contains modelled estimates of waste heat supply capacity, which are subject to limitations identified by the creators (Sinclair and Unkaya, 2020). Inaccurate waste heat supply capacity data is likely to have led to matches being made between waste heat sources and opportunities that do not represent real prospective relationships, and conversely to some real prospective relationships being missed. However, heat source matches have not influenced the identification of opportunities, and so these impacts affect opportunity characteristics only.
Several categories of waste heat sources have been noted as absent from the dataset used. Anaerobic digestion facilities, crematoria, incinerators and thermal power stations (including Energy from Waste facilities) represent possible sources of low temperature waste heat that were not included in the matching process. Many wastewater treatment plants have also been noted to be missing from the dataset.
The accuracy of the GHiGS dataset in terms of mapping open (non-wooded) green spaces was assessed by comparing it to alternative maps. It was concluded that urban green space (which is most likely to be linked to low temperature heat network opportunities) is mostly accurate, but there are conflicts between the classification of open green space and woodland between different maps. However, the identification of a particular green space through the proximity analysis does not mean that it is necessarily suitable for the construction of ground source heat collection infrastructure: usage, heritage protection, nature protection or aesthetic considerations as well as engineering factors like ground composition and access routes can all prevent a green space from being a viable heat source for a low temperature heat network.
There were no concerns regarding the accuracy of water body mapping, although the lack of data regarding the depth of water and flow rate of water courses means that a match between a low temperature heat network opportunity and a water body cannot be taken as firm indication of the viability of water source heat.
Waste heat source matching
The formulae used to calculate the maximum connection distance between waste heat sources and low temperature heat network opportunities was:
The divisor of 4,000 (units: kWh per year per metre) aligns with a value used in by AECOM (2025) in a review of opportunities and technical solutions for data centre waste heat reuse in London. AECOM’s modelling found that 4,000 kWh per metre per year (referring to the connection between data centre and heat network) was a strong indicator of viability.
If the LHD-proxy value had been higher, fewer matches between heat sources and opportunities would have been identified. If the LHD-proxy value had been lower, more matches between heat sources and opportunities would have been identified.
The maximum distance between heat sources and low temperature heat network opportunities was not allowed to exceed 1 km, reflecting real-world constraints that would often apply to such connections. However, it should be noted that there is an example in Scotland of a waste heat source being used to serve a low temperature heat network more than 1 km away (the AMIDS scheme in Renfrewshire, which connects heat users to a wastewater heat source more than 2 km away). If the maximum connection distance had been higher, more matches between heat sources and opportunities would have been identified (and vice versa).
For the purposes of proximity analysis, data centres that do not feature in the Scotland Heat Map dataset have been assumed to be connectable over a maximum distance of 1 km from heat demands (or a shorter distance, if limited by the opportunity’s total heat demand). This corresponds to the smallest size of data centre that we mapped (around 1 MW).
Waste heat sources that are within the calculated maximum distance of a Communal Opportunity were considered to be matched to that opportunity. Similarly, waste heat sources that are close enough to the geometric centroid of a Multi-Building Opportunity were matched to the opportunity. The centroid was used as a proxy for the average point of heat delivery; in practice, waste heat would need to be distributed to connected properties via an interface identified at the design stage.
Sinclair and Unkaya (BRE) for ClimateXChange (2020) estimated potential heat supply in MWh for each of the waste heat sources they identified. The limitation identified by the authors suggest that these values are subject to high uncertainty and require further research to improve heat supply capacity estimates. Furthermore, the national assessment heat source matching methodology does not make use of Sinclair and Unkaya’s assessment of the seasonality of waste heat sources. This could lead to an overestimation of heat supply potential due to the time-mismatching of supply and demand. The total capacity of matched waste heat sources is reported as a characteristic of opportunities, but users should exercise caution when using this data.
Matching green spaces and water bodies
A different approach was taken to matching green spaces and water bodies. The Green Heat in Green Spaces (GHiGS) project estimated the heat supply capacity of each relevant green space in Scotland, but no such estimates were available for water bodies[7]. Some water bodies mapped will have near-infinite heat supply capacity (e.g. the sea) whereas others will be relatively limited (canals with minimal flow rate).
Because of the range of spatial extents and geometric shapes that exist among green spaces, proximity analysis based on a site’s total estimated supply capacity risks identifying matches with low temperature heat network opportunities that are not realistic in practice. For example, a lollipop-shaped green space has greatest capacity to host boreholes in the wider part of its shape – but a simple matching process could link it to low temperature heat network opportunities that are only within reach of the ‘stick’. Instead, a simpler approach of searching for matches within 100 metres of a green space’s boundary was adopted.
If the maximum connection distance had been higher, more matches between heat sources and opportunities would have been identified (and vice versa).
Heat from green spaces will normally be available at a lower (environmental) temperature than waste heat from industrial, utility or waste management sources. Therefore, the distance over which interconnection can be justified is lower for green spaces, relative to the amount of heat supplied. It should be noted that a separation of 100 metres between a Multi-Building Opportunity’s boundary and a green space’s boundary does not represent the real distance over which heat must be transported. The distance to reach boreholes within the green space and to reach heat demands within the opportunity cluster add to the distance between the boundaries.
The lack of heat supply estimates for water bodies means that proximity analysis based on a site’s total estimated supply capacity is not possible. In order to avoid linking low-capacity water bodies to opportunities over unrealistic distances, a maximum distance of 100 metres was applied. This means that some very significant opportunities are missing from the assessment. However, easy access to mapping that includes large water bodies will allow any user to make their own assessment of which larger rivers, lochs and coastal waters might offer potential heat supplies for a particular low temperature heat network opportunity.
Existing heating fuels and heating systems
The cost and carbon impacts of switching to a heat pump depend on which alternative is being used for comparison. Data on the existing heating fuels used and heating systems present within each opportunity grouping were reported as counts of properties. Calculated total heat demands associated with different heating fuels (natural gas, electricity, other) were generated for each opportunity grouping. These totals could be used as inputs for calculating cost and carbon impacts.
The heating fuel and heating system categorical data have a high level of accuracy for domestic properties, but are among the least opportunity attribute accurate fields for non-domestic properties. 21% of properties’ heating fuels and heating systems in Non-Domestic Analytics 2.0 derive from Energy Performance Certificates, with the remainder modelled by Energy Saving Trust with a sample-tested accuracy of around 90%. According to the dataset’s Release Notes (Energy Saving Trust, 2025b), the modelling tends to overestimate the proportion of properties that use electricity and underestimate the number using gas boilers.
Property-level requirements for heat pump integration
A wide range of approaches and criteria have been applied in the past to the question of whether a property is ‘suitable’ for being heated with a heat pump. The concept is relevant for heat pumps connected to low temperature heat networks as well as standalone heat pumps. Some researchers (Energy Systems Catapult, 2021) have found that “there is no property type or architectural era that is unsuitable for a heat pump”. However, critics have suggested that these statements when viewed in isolation can be misleading, and that questions of suitability must be qualified with a definition of what suitability means. A literature review accompanied by expert interviews (Johnston et al., 2024) found a mixed picture in terms of the prevalence of heat pump suitability among Scottish homes, with gaps found in each of the four most relevant publications reviewed.
Suitability is usually judged on the basis of a combination factors, but the factors used differ significantly. The inclusion or exclusion of operating costs (and related affordability judgements) and the extent of upgrades required to insulation and/or heat distribution systems are among the most critical for determining the outcome of a suitability assessment.
This research has taken the most inclusive view regarding technical suitability, which is that there is a viable route to heat pump integration for the overwhelming majority of domestic properties and those non-domestic properties which need space heating and hot water. No domestic properties, and few non-domestic properties, were excluded from the analysis for technical suitability reasons.
However, heat pump operating costs relative to alternatives do vary significantly between individual properties. Likewise, required upgrades alongside heat pump installation can also range from none at all to highly disruptive and expensive work. An assessment of heat pump suitability that is familiar to Scottish local authorities and the readers of their Local Heat and Energy Efficiency Strategies (LHEES) is the four-fold “LHEES Categories” classification system. This system defines the categories slightly differently depending on whether a dwelling is on or off the gas grid, although the high level criteria are the same. Full detail of the classification process is available in the Detailed Practitioner Approach developed by Zero Waste Scotland (2022b, 2022c) as part of the LHEES Methodology guidance.
LHEES Category
High-level criteria
Category 0
Already utilise a communal heating system
Category 1
Are highly suited to a heat pump solution: minimal fabric upgrade required and already have a wet heating system.
Category 2
Already have a wet heating system but are likely to require[8] energy efficiency retrofit of moderate scope
Category 3
Dwellings that do not have a wet heating system or are likely to require energy efficiency retrofit exceeding moderate scope before heat pump integration; or
Dwellings that are not suited to heat pump technology.
Table 13: Summary of LHEES Category high-level criteria
For low temperature heat network opportunities in the national assessment that include adequate numbers of domestic properties (at least 5 in a category), the characterising dataset includes a count of the number of dwellings that have been assessed as falling into each LHEES Category. The address-level data underlying these totals comes from the Home Analytics dataset.
A limitation of the LHEES Categories arises from limitations in the data available at the time of their creation. For example, information on building energy efficiency did not incorporate floor construction or floor insulation, which is information that is now available through some datasets.
It should also be noted that LHEES Categories are derived based on parameters that do not fully align with a property’s prospects for connecting to a low temperature heat network. For example, heritage status can be a reason why a low temperature heat network connection is a better choice than an air source heat pump. Furthermore, an existing heat pump could be an enabler rather than barrier to joining a scheme with networked heat pumps.
Low temperature heat network archetypes
To enable an intuitive understanding of the diverse types of low temperature heat networks and their prevalence within the opportunities identified by the national assessment, we classified applicable opportunities as belonging to one or more ‘archetypes’. We used the list of archetypes presented in the South of Scotland Heat Network Prospectus (South of Scotland Enterprise, 2025), with minor modifications. The archetypes group networks according to geographic context and/or the socio-technical drivers that justify their development. Our methodology developed new logical and quantitative criteria for archetype classification, allowing thousands of opportunities to be classified automatically rather than manually. The quantitative criteria selected have a direct impact on the number of opportunities identified as belonging to the relevant archetype in logical ways.
Archetype
Identification Criteria
Sub-Archetypes
Communal Opportunity
Multiple heat demand records occupying the same building footprint polygon
Building height (to top of wall) >=7.5 metres for the majority of heat demands
Minimum property numbers as set out in Section 4.2.3 of this Appendix
Domestic
Non-domestic
Mixed use
Heat Source-Led
One or more non-contiguous heat sources have been linked to the opportunity
Waste heat source-led
Green space-led
Blue space-led
Anchor Load-Led
Applicable to Multi-Building Opportunities only
One or more public sector anchor loads or non-public sector anchors loads are present within the heat demands that constitute the opportunity
Public sector anchor load-led
Private/other anchor load-led
Street Scale
Applicable to Multi-Building Opportunities only
The area within the cluster boundary is less than or equal to 3,000 m2
Urban Neighbourhood Scale
Applicable to Multi-Building Opportunities only
The area within the cluster boundary is more than 3,000 m2 and less than or equal to 100,000 m2
At least 80% of heat demands are in locations classified as ‘urban’ by the Scottish 8-fold urban rural classification.
Table 14: Low temperature heat network archetypes
The archetypes and their classification criteria are listed in Table 14. Not all opportunities are assigned an archetype: for example, a Multi-Building Opportunity with an area of more than 100,000 m2 , which does not contain any anchor loads and has not been matched with any non-contiguous heat sources would not belong to any of the archetypes listed in the table.
Electricity grid capacity status
The capacity of the local electricity grid to accommodate new electrical loads is an important factor for the viability of low temperature heat networks. Over the coming decades, local electricity grids will be upgraded to enable buildings to adopt heat pumps in all locations where they represent the best solution for decarbonising heat. However, the status of the electricity grid also influences what the best heat decarbonisation solution is for a particular property. In the short term, grid constraints can prevent the mass adoption of heat pumps that would be involved in the establishment of a low temperature heat network. However, heat pumps connected to low temperature networks place less strain on electricity networks than air source heat pumps. This means that grid constraints can sometimes support the viability of low temperature heat networks rather than limit them.
Identified low temperature heat network opportunities were divided into three equal-sized groups according to the projected ‘headroom’ at the local primary substation as a proportion of its capacity. This value acts as a proxy for the degree of electricity grid constraints that are likely to apply to each opportunity.
Prevalence and severity of fuel poverty and multiple deprivation
Low temperature heat networks can sometimes offer lower heating costs than existing polluting heating systems[9], and are almost always cheaper than direct electric heating (UK Government, 2025). Heat networks’ potential contribution to fuel poverty reduction at the same time as decarbonising makes them interesting to a variety of stakeholders. On the other hand, if the cost of heat from a low temperature heat network is too high (driven by factors such as capital costs, operating model or electricity costs), the risk of exacerbating fuel poverty must be investigated and managed.
Accurate fuel poverty data at a local level is not available. However, estimates of the likelihood of domestic properties’ occupants experiencing fuel poverty are available in the Home Analytics dataset. Identified low temperature heat network opportunities across Scotland were divided into three groups according to the average estimated probability of fuel poverty among dwellings within the opportunity grouping. Higher, Middle and Lower fuel poverty probability bands were defined as greater than 31%, 22 to 31%, and less than 21% respectively. Because they are derived from estimated probabilities, these bands also represent the estimated (rather than actual) relative prevalence of fuel poverty within an opportunity grouping.
The Scottish Index of Multiple Deprivation was also included as a characteristic of an opportunity.
Property tenure
Dwellings which are socially rented by Local Authorities or Registered Social Landlords can represent good opportunities for low temperature heat network development thanks to the prevalence of concentrated ownership by organisations with strong incentives to decarbonise their stock. Property tenure data (including modelled estimates) is available within the Home Analytics dataset, and was used to calculate the estimated percentage of dwellings within an opportunity grouping which are socially rented. Energy Saving Trust state that the modelled categorical data on tenure in Home Analytics is around 98% accurate, and better than this if only the distinction between socially rented and other properties is considered (Energy Saving Trust, 2025a).
Property age and heritage designations
The age of a building can pose challenges for the installation of low temperature heat network connections (Johnston et al., 2024 and Historic England, 2025). However, building age can also represent an opportunity where low temperature heat networks are possible but other zero-emissions heating systems are more difficult. The estimated age of Communal Opportunity buildings and anchor load buildings was included as characterising information.
Heritage designations – either buildings being Listed or properties being in Conservation Areas – are also potential barriers or opportunities. The Listed status and Conservation Area inclusion of anchor load properties were included as characterising data. For Multi-Building Opportunities and Communal Opportunity buildings, the percentage of properties within the grouping with either Listed Status or included in Conservation Areas was calculated.
Presence of cooling demand
If configured to do so, low temperature heat networks can supply cooling as well as heating. The presence of cooling customers can improve the viability of a network by injecting ‘free’ thermal energy into the network that can be used elsewhere by customers needing heating. No national-scale dataset of cooling demand exists. Where it is available, data on cooling demands is sparse and unreliable. It generally does not provide sufficient resolution regarding seasonal variation, which is critical for networks that seek to reap the benefits of simultaneous or near-simultaneous heating and cooling demands.
For these reasons, the national assessment does not incorporate demand for cooling into the process that identifies opportunities. However, heat rejected from some larger cooling processes (supermarket refrigeration, data centres, brewing) was modelled as waste heat sources linked to Multi-Building Opportunities. At the same time, a geospatial data layer of potential cooling customers was created so that their presence within Multi-Building Opportunities can be identified. The criteria used to identify these properties are set out in Table 15.
Data source
Criteria
Scotland Heat Map 2022 ‘Potential Energy Supply’ layer
Sector equals “Brewery”, “Cooling Towers”, “Data centre”, or “Supermarket”
Scotland Heat Map 2022 ‘Heat demands’ layer
Ordnance Survey Class Description (tertiary level) is “Hotel/Motel” (CH03), “Bingo Hall / Cinema / Conference / Exhibition Centre / Theatre / Concert Hall” (CL07) or “Hospital / Hospice” (CM03) – or secondary level description is “Office” (CO).
and
Heat demand > 100MWh/year.
Table 15: Criteria for the identification of potential cooling customers within Multi-Building Opportunities
Screening decisions
Heat demand screening (inputs)
We removed 67,297 heat demands which had been marked as likely to have issues in the input dataset. The Scotland Heat Map includes as a data field a flag indicating whether OS mapping data suggested that there may be a reason to doubt the heat demand estimate. We excluded all heat demands which had the values ‘Non-building – parent’, ‘Non-building – not parent’, ‘Building – parent’ and ‘Building – no demand’ from the main working dataset. We also excluded heat demands with a description of ‘unclassified’, as these tend to include new build with incomplete or placeholder data as well as other potentially problematic addresses.
We also removed 254,424 further heat demands from the dataset that are unlikely to be able to benefit from a low temperature heat network connection:
all properties with heat demands less than 5,000 kWh per year, for which another zero-emissions heating system is likely to be lowest cost[10] (237,448 heat demands, of which 199,928 domestic and 37,520 non-domestic); and
non-domestic heat demands with building use classifications that indicate a high likelihood that their heat demand is dominated by temperature requirements that exceed those which can normally be produced through networked heat pumps, or that are likely to have minimal or no heat demand (16,976 properties). The list of excluded use classes is reported in Table 16.
Changes to the list of excluded use classes could conceivably lead to some buildings being excluded (or re-included) from the dataset used to identify opportunities. The impact of exclusion would be that relevant opportunity groupings would be smaller. Potentially, but infrequently, the exclusion of heat demands would cause entire opportunities to be missed. Conversely, changes leading to some buildings being included could cause opportunities to be identified that otherwise would not be.
Class Code
Class Description
Class Code
Class Description
Likely to be dominated by very high temperature heat demands
CI01CW
Cement Works
CU08
Gas / Oil Storage / Distribution
CI07
Incinerator / Waste Transfer Station
OI09
Kiln / Oven / Smelter
Likely to have no or minimal heat demands
CA
Agricultural
CS01
General Storage Land
CA02FF
Fish Farming
CT01
Airfield / Airstrip / Airport / Air Transport Infrastructure Facility
CA03
Horticulture
CT02
Bus Shelter
CA03VY
Vineyard
CT03
Car / Coach / Commercial Vehicle / Taxi Parking / Park And Ride Site
CB
Ancillary Building
CT04CF
Container Freight
CC06
Cemetery / Crematorium / Graveyard. In Current Use.
Table 16: List of Ordnance Survey Class Descriptions removed from Scotland Heat Map dataset before starting heat demand proximity analysis
Properties already using a heat pump (most likely an air source heat pump) and those already served by electrically powered communal heating systems could, in some circumstances, still benefit from switching to a low temperature heat network connection. This is particularly true when the current heating system reaches its end-of-life.
In their work for the Argyll and Bute Local Heat and Energy Efficiency Strategy, Zero Waste Scotland and Buro Happold assessed domestic properties only and excluded those which:
were believed to use mains gas as their main heating fuel (or for which the main heating fuel was unknown);
were believed to have a communal heating system with electricity as its main fuel; and
were believed to already have a heat pump.
These screening decisions were driven by the objectives of the study and factors specific to Argyll and Bute, including the strategic approach taken to off-gas areas as opposed to on-gas areas. The same screening criteria were not used for this nationwide study because properties currently using mains gas can represent good candidates for low temperature heat network development. However, depending on geographic location, such development may or may not align with the objectives of local energy plans and strategies. Similarly,
Heat source screening (inputs)
Waste heat sources with estimated available waste heat temperatures exceeding 80°C were screened out from the dataset. Although it would be technically straightforward for these sources to supply heat into low temperature heat networks, it is likely that there are ‘better’ uses for high value, high temperature waste heat. Heat reuse and supply to high temperature heat networks are likely to be favoured over supply to low temperature heat networks.
The Green Heat in Green Spaces (GHiGS) dataset includes many green spaces (or parts of green spaces) that are long and narrow, such as roadside verges. These features may have large total areas and so have the potential to host a large capacity of ground source heat infrastructure. However, the connection of features like closed loop boreholes over long linear distances is unlikely to be feasible for capital cost reasons as well as the challenges posed by pumping fluid over large distances. The linear reach of these green spaces means that it is possible for proximity analysis to link them to low temperature heat network opportunities that are situated close to their extremities.
The mapped water bodies used for the assessment feature long, narrow elements. In addition to rivers, which can be viable for accessing water source heat, the mapped elements included drainage ditches and small, low flow rate water courses.
Green spaces that are narrower than 10 metres (and <10m wide sections of broader-shaped green spaces) were eliminated from the dataset of green spaces that could be linked to opportunities. The same action was taken to address narrow water bodies. In both instances, it was found through trial and error that a 10-metre exclusion criterion worked to eliminate most roadside verges and ‘tendrils’ of green spaces as well as most drainage ditches and small burns.
This was achieved by applying a ‘negative’ (inwards) buffer of 5m to green space and water body polygons to eliminate narrow features (followed by the application of a positive 5m buffer to restore the original dimensions of broader-shaped areas).
Finally, green spaces and water bodies that have areas less than 1,000 square metres (after the application of the negative buffer described in the previous paragraph) were screened out of the dataset of green spaces and water bodies that could be linked to opportunities.
Greenspace Scotland (2021) mapped green spaces greater than 100 square metres as potential heat sources for ground source heat pumps serving individual properties, with a 100 square metre space assumed to be able to host one borehole. A space of 900 square metres (30m x 30m) was assumed to be able to host up to 9 boreholes. The GHiGS researchers applied a multiplier of 0.4 to the total area of mapped green spaces to align with an assumption that 40% of any one green space might be available for borehole construction. We chose a minimum green space area of 1000 square metres to correspond with a realistic potential capacity for 4 boreholes and 50,000 kWh/year total heat supply to connected demands (equal to the minimum total heat demand of a cluster containing 10 dwellings).
The same area criterion was used for water bodies by considering the area of a small lake or pond that could – according to rules of thumb – supply 25,000 kWh/year. Non-static water bodies of the same “area” could supply more than this.
Multi-Building Opportunity screening (outputs)
Groupings created through proximity analysis that only featured a small number of buildings were screened out in order to generate the Multi-Building Opportunities dataset, according to the formula stated in Section 4.2.3 of this Appendix. Similarly, High Property Count Areas were separated from Multi-Building Opportunities according to the 1,000-property threshold explained in Section 4.2.3.
If the screening criteria had involved a higher threshold for Multi-Building Opportunities, fewer Multi-Building Opportunities would have been identified, and they would have been on average smaller. If the screening criteria had involved a higher threshold for High Property Count Areas, more Multi-Building Opportunities would have been identified but the HPCAs would have been less numerous. With lower thresholds, the opposite impacts would apply.
Trimming of Multi-Building Opportunity and High Property Count Area shapes
The process that creates Multi-Building Opportunity groupings sometimes resulted in polygons with highly irregular shapes. Some examples of irregular shapes that had the potential to be confusing to users were presented to stakeholders. In general, stakeholders felt that it was worthwhile improving the boundaries of Multi-Building Opportunities, but that irregularities could be tolerated provided that users were informed of the significance of the shapes presented.
Census Output Areas are a system of geographic division that often aligns with significant physical changes (such as transitions between built up areas and farmland). A trimming process was applied that removed parts of the polygons that belonged to different Census Output Areas to the rest of the opportunity area but contained no heat demands. The result was a set of ‘trimmed’ polygons which represented Multi-Building Opportunities. In general, this was a change that impacted the visual representation of the opportunities only (not the groupings of buildings or characterising data, other than the area of the opportunity polygon).
However, in a small number of cases (138, or 1% of the Multi-Building Opportunities), the trimming process resulted in one or more heat demands being isolated from the grouping that they belonged to and thus lost from the Multi-Building Opportunity dataset. This unwanted side effect was potentially justified by the improvements achieved in terms of the visual representation of opportunities. However, it did mean that the link between the opportunity identification process and the data outputs was slightly compromised. It was not possible within the programme for the research to consult stakeholders regarding this trade-off, nor to revert to a methodology that did not apply the trimming with Output Areas. Our recommendation is that future assessments do not include the ‘trimming’ process, but ideally stakeholders would be consulted (having been presented with information about the advantages and disadvantages) before a decision is made.
Data quality risk assessment and mitigation
Risk assessment focusing on data quality was carried out at the point of decision regarding input datasets and updated as the analysis progressed. Risks associated with systematic errors, outliers and datasets’ fitness for purpose were considered for all input datasets. Some data quality risks impact users’ likely interpretation of the results, requiring an active response.
Table 17 summarises the main data quality issues identified that are linked to input datasets, and the responses adopted.
Dataset
Issue
Response
Scotland Heat Map – Heat Demand layer
Inaccuracy (in general) of estimated heat demands due to reliance on modelling and benchmarks, underoccupancy and/or underheating
Accept as a limitation of the national assessment methodology
Scotland Heat Map – Heat Demand layer
Inaccuracy of a small number of properties for which extremely large heat demands are reported
Design proximity analysis methodology that neutralises outliers. Adjust individual heat demands for the purposes of summing heat demand within opportunity groupings
Scotland Heat Map – Heat Demand layer
Unrealistic assignment of heat demands within certain mixed-use buildings (see Section 4.2.1.4)
Accept as a limitation of the national assessment methodology
Scotland Heat Map – Heat Demand layer
Inaccuracy of building height estimates from which ‘floor proxy’ values are derived
Accept as a limitation of the national assessment methodology
Scotland Heat Map – Potential Energy Supply layer
Uncertainty and limitations of approach and input datasets as identified in the relevant project report
Accept as a limitation of the national assessment methodology
Home Analytics
Inconsistent basis for deriving fuel poverty probability estimates in different geographic areas
Accept as a limitation of the national assessment methodology. Mitigate impact on data user/audience understanding by expressing fuel poverty probability as 3-tiered categories rather than absolute numbers
Home Analytics
Limitations of data used to derive LHEES Categories for each dwelling, and applicability to low temperature heat networks as opposed to air source heat pumps
Accept as a limitation of the national assessment methodology
Ordnance Survey MasterMap
Fitness for purpose of mapped physical features as representing barriers to low temperature heat network construction and operation
Accept as a limitation of the national assessment methodology
Ordnance Survey ZoomStack
Fitness for purpose of mapped physical features as representing barriers to low temperature heat network construction and operation
Accept as a limitation of the national assessment methodology
Table 17: Input data quality issue summary
Table 18 summarises the main data quality issues identified that affect specific elements of output datasets, and the responses adopted. Some of these issues can be traced directly to input data quality issues listed in Table 17.
Element of output dataset(s)
Issue
Response
Multi-Building Opportunities
138 ‘fragment’ polygons, each containing a small number of heat demands, were created by the trimming process described in Section 5.6. These were disconnected from the groupings they should have been part of.
Accept as the ‘price’ of the Multi-Building Opportunity polygon shape improvements achieved by the trimming process. These fragments were deleted from the dataset.
Multi-Building Opportunities
Around 70 very small (<100m2) polygons are present. These are generally groupings that could have been Communal Opportunities, but either the building height has been recorded as being below 7.5 metres or the properties are located at a point or points where there is no building footprint in Ordnance Survey MasterMap.
Accept as a limitation of the national assessment methodology.
A minority of heat demands present in the Scotland Heat Map 2022 and included within opportunity groupings are not represented in Home Analytics or Non-Domestic Analytics[11]. Occasionally, the resulting data gap can lead to proportions not summing to 100% or to the correct numerical total.
Accept as a limitation of the national assessment methodology.
A minority of heat demands present in the Scotland Heat Map 2022 and included within opportunity groupings are represented in both Home Analytics and Non-Domestic Analytics11. Occasionally, the resulting data duplication can lead to proportions not summing to 100% or to the correct numerical total.
Accept as a limitation of the national assessment methodology.
Table 18: Output data quality issue summary
Model execution step-by-step
Initial dataset preparation
Transformation of data format
Datasets were transformed as required to allow for operation within the QGIS software that was used for all geospatial processing and analysis. For the provided datasets this included converting between tabular and spatial formats, combining the multiple Home Analytics CSV files into a single shapefile, and ensuring all files were loaded using the relevant project Coordinate Reference System (CRS) for the QGIS file (ESPG:3857). Field structures were standardised across the datasets, with particular effort required to standardise the Unique Property Reference Numbers (UPRNs) in order to support the dataset joins required for the execution of the methodology.
As noted in Section 4.5 of this Appendix, a minority of heat demands present in the Scotland Heat Map 2022 and included within opportunity groupings are not represented in Home Analytics or Non-Domestic Analytics. In these instances, specific UPRNs contained within the Scotland Heat Map were not present in the Home Analytics or Non-Domestic Analytics datasets. Around 7,000 heat demands within Multi-Building Opportunities (0.4%) had UPRNs that did not have matches in either the Home Analytics or Non-Domestic Analytics datasets. A similar fraction of heat demands within Communal Opportunities were affected. The impact of these non-matches is that, occasionally, the resulting data gap can lead to proportions not summing to 100% or to the correct numerical total.
Cleaning and minimising
The datasets were minimised by removing all attribute fields except those required for subsequent analytical steps.
Table 19 lists the conditions used to clean and further minimise Scotland Heat Map Heat Demand layer data in order to create a useable dataset that was fit for the purpose of the national assessment.
Scotland Heat Map Heat Demand layer field name
Conditions for inclusion or exclusion
base_issue_flag
INCLUDE if value is “Building – has demand”
Otherwise, EXCLUDE
DESCRIPTIV
EXCLUDE if value is “unclassified”
Otherwise, INCLUDE
heatdemand
INCLUDE if value >5,000 kWh/year
Otherwise, EXCLUDE
CLASS
EXCLUDE if value matches list in Table 16
Table 19: Conditions applied to clean Scotland Heat Map heat demand data
A cleaning process focused on removing features that were less relevant to low temperature heat network opportunities was carried out. Features that were labelled as “unclassified”, “no demand” or had an estimated demand under 5,000kWh per year were removed from the identification process. This was done to remove any demands unlikely to represent viable connections. Furthermore, the demand points were then refined using the building use classification codes provided through the SHM dataset. By screening out codes associated with heat demands which are minimal, likely overestimated or dominated by high temperature requirements (such as fish farms, petrol stations and timber mills respectively), we ensured that the remaining demand data points represent heat-consuming properties which could reasonably be potential off takers of heat from a low temperature heat network.
In rare instances (114 of several million), erroneous data was present in the ‘Building Age’ field of Home Analytics or Non-Domestic Analytics (either zero values or text that did not represent the building age). In these instances, data was replaced with ‘Unknown’, a valid value that was already present in other heat demand records.
The Scotland Heat Map Potential Energy Supply layer was screened by excluding all heat source records where the value of the field “Temperature_range” was ‘80-120’ or ‘>120’. Geometric processing of green space and water body polygons to remove ‘narrow’ features is further described in Sections 4.3.2 and 5.8.2. The resulting green space and water body polygons which had total areas of less than 1,000 m2 were screened out (excluded) from the respective datasets of potential heat sources.
Data quality risk mitigation
Identified issues that were accepted as limitations (rather than actively addressed) are listed in Section 4.5 and discussed in other relevant sections of this report.
One data quality issue that required action was large outlier heat demands. A small number of outlier heat demands were adjusted as per the conditions and calculations listed in Table 20. The reasons for these adjustments are stated in Sections 4.2.1.3 and 4.2.1.4.
Edited SHM Heat Demand layer field name
Conditions for editing values
Calculation of new value
heatdemand (28 values edited)
‘heatdemand’ value ≥ 20,000 MWh/year
AND
‘confidence’ value < 5
Lower of: 20,000 MWh/year, ‘floor_area’ value * 1 MWh/m2/year
heatdemand (17 values edited)
‘CLASS’ value = ‘CM03’
AND
‘heatdemand’ value ≥ 10,000 MWh/year
‘heatdemand’ value * 0.425
Table 20: Conditions for editing certain Scotland Heat Map heat demand data
Minor processing of main working dataset
Minor dataset joins
In order to support the identification of opportunities, minor datasets joins were carried out to join the “Public Building” field found within the Non-Domestic Analytics to the SHM dataset. This was done to support the identification of anchor loads in the later stages of the methodology. This join was validated to confirm match rates within expectations of the number of demands.
Minor interim field creation
A number of fields were created to support opportunity identification through filtering, weighting and classification operations. Some of these fields served purely as interim data fields and so do not feature in the final output datasets.
A unique identifier field was created for the points within the main working dataset to allow for consistent tracking of demands across multiple stages of the methodology execution. Indicator fields were also created to distinguish between (and separately weight) domestic and non-domestic demands, and to identify demands which were considered public sector anchor loads. These indicator fields were crucial for representing the scale of potential opportunities and in their classification according to low temperature heat network archetypes.
The methodology used the heat demand required by individual properties as the main determining factor of the distance over which it may be able to connect to others through a low temperature heat network. The estimated maximum connection distance of a demand was calculated in the QGIS Field Calculator using the formula:
In the formula, LHD (a proxy Linear Heat Demand – see Section 4.2.1.1) was 2,000 kWh/year/metre for almost all heat demands, reflecting the value applied in previous regional low temperature heat network assessments and supported by a comparative cost model completed as part of this research. However, public sector anchor load properties were treated differently in order to reflect the advantages they hold in terms of their ability to connect to potential future heat networks. (Public sector anchor loads were identified where the field “PUBLIC_BUILDING_FLAG” in the Non-Domestic Analytics dataset had a value of “Local Authority”, “Scottish Government”, “UK Government” or “Other”, and where the “heatdemand” field in the Scotland Heat Map was greater than 100 MWh per year.) A lower figure of 1,500 kWh/year/metre was used for these demands. This resulted in such public sector properties having an influence over a proportionally larger area than that of the other demands.
The “CLAMP(0,(X),1000)” function in the formula was used in order to prevent exceptionally large heat demands from being connected to other heat demands over unrealistically large distances (considering the increased risk, cost and delivery challenges associated with very long pipe runs) and to limit the impact of large heat demand outliers. The function limited the maximum buffer radius to 1 km.
Communal Opportunity identification
Utilising the OS Mastermap – Building Footprints shapefile, an initial spatial join step was undertaken to identify heat demands (point data) located within the same building footprint polygon. These co-located heat demands include those within buildings containing multiple units such as blocks of flats, tenements or their non-domestic equivalents. Using the “Join by Locations (Summary)” spatial join tool available within the QGIS software toolbox, the previously processed heat demand points were connected to the OS Building Footprints layer. This tool summarises all data points which relate to the selected geometry of the chosen layer and allows the calculation of property counts, sums of heat demand values, and other functions such as averages and majority values.
When executing the join of the heat demand points to the building polygons, two data fields were selected to be summarised in order to identify Communal Opportunities. For an opportunity to be considered as a Communal Opportunity it must meet both of the following criteria:
Grouping scale indicator is 10 or higher: The scale indicator is a sum of the values of one of the identifier fields discussed in the previous section, which weights domestic and non-domestic demands by assigning a value of 1 or 2 respectively. Groupings which have a scale indicator value of less than 10 (the threshold chosen by the researchers to include groupings as Opportunities) were removed from the Communal Opportunities dataset.
Majority “Floor_Proxy” is 3 or higher: In the SHM dataset, the “floor_proxy” field is a “proxy for the number of floors in a building. Calculated based on a building height divided by 3 i.e. assumes a floor height of 3m”. Once the rounding involved in the calculation of the “floor_proxy” field is taken into account, this criterion is equivalent to the requirement for Communal Opportunities to have a height of at least 7.5 metres. Although not perfect, this criterion tends to include blocks of flats, tenements and taller mixed-use buildings while excluding houses.
All buildings containing groupings of heat demands that did not meet both criteria were deleted from the layer, leaving only the buildings which were deemed to be Communal Opportunities. The calculation and appending of characterising data for these opportunities is discussed later in this chapter.
Separation of Communal Opportunities from main working dataset
Opportunity groupings that involved spatially dispersed heat demands were dealt with through a separate process to the Communal Opportunities. This is because the proximity analysis used for the identification of Multi-Building Opportunities is ineffective when properties are situated in vertically above one-another. To prepare the main working dataset for proximity analysis, a spatial selection tool was used to separate the heat demands that had been grouped into Communal Opportunities from all other heat demands. The “Select by Location” tool available within the QGIS software toolbox was used to perform this step. The main working dataset (the heat demand points layer which had been cleaned and minimised) was filtered with reference to the building polygon layer created in Section 5.3. The heat demands that spatially interact with these buildings were exported to create a new layer of address-level data dedicated to Communal Opportunities. This selection was then inverted with the remaining demands being exported to a new layer which would be subjected to the identification process for Multi-Building Opportunities described in the following section.
This activity created 2 distinct heat demand point layers (in addition to a master layer which contains all demand points post cleaning and minimising):
The heat demands which were co-located with the building polygons created in Section 5.3 (heat demands within Communal Opportunities).
The heat demands to be taken forward in the spatially dispersed section of the methodology.
Multi-Building Opportunity and High Property Count Area identification
Drawing buffers around heat demands
Utilising the buffer radius field created in the steps described in Section 5.2.2, circular buffers were drawn around the remaining heat demands within the geospatial environment. The radius of the circles represented the estimated distance within which connection to a low temperature heat network could be economically viable.
Subtracting barriers
To reflect physical and practical constraints that would be likely to influence a potential heat network, a dedicated “barriers” layer was created using Ordnance Survey map layers, including major roadways such as motorways and A-roads as well as other physical barriers such as railways, woodlands and waterways. This barrier shapefile was used to cut the previously-created buffer zones in an attempt for the generated opportunities to better represent deliverable conditions (rather than relying on heat density alone).
The buffers were cut utilising the “difference” tool available on QGIS, removing only the sections where the buffer zones intersect with barriers.
Deleting orphaned fragments and merging overlapping shapes
The use of barrier shapes to cut buffer zones resulted in fragments of buffer zone polygons that were no longer spatially connected to the heat demand point from which the buffer zones were originally generated, but retained a connection to each other in the data environment. In order to identify and remove these fragments, the resultant layer was first processed using the “Multipart to Singlepart” tool. This tool separates the fragments which had been cut from the same single original shape into fully-individual polygons.
A spatial check was then conducted to determine if any given fragment contained its source heat demand utilising the “ID” identifiers applied in an earlier process. This was done using the “Join by Location” tool in QGIS with the set up as shown in Figure 13.
Figure 13: “Join by Location” tool settings used for deleting orphaned polygon fragments
The result of this process is the creation of a new polygon for each interaction between a parent heat demand and a child fragment with which it intersects[12].
The buffer fragments that pass this check were then dissolved (using the QGIS tool of the same name) to merge overlapping buffer areas into combined proto-opportunity areas.
Joining attributes to polygons and screening by property count
A spatial summary join was performed between the proto-opportunity polygons created in the previous step and the heat demand point data from which they were created. This enabled the polygons to be categorised as ‘opportunities’ or non-opportunities. Summary statistics were calculated to determine the total heat demand for the opportunities, as well as creating a grouping scale indicator similar to that created for Communal Opportunities (the sum of the heat demands’ values if domestic = 1 and non-domestic = 2).
The proto-opportunity polygons were then filtered using a grouping scale indicator threshold of 10. Groupings which did not meet the threshold were deleted.
Trimming of Multi-Building Opportunity and High Property Count Area shapes
The process that creates Multi-Building Opportunity groupings, laid out in previous sections, sometimes results in polygons with highly irregular shapes. A trimming process was applied that cut opportunity areas along the boundaries of Census Output Areas, using the same tools as described in Section 5.5.2[13]. This action created fragments that belonged to different Output Areas to the rest of the opportunity area but contained no heat demands. These fragments were deleted and the remaining areas (all containing heat demands) were re-joined using the process described in Section 5.5.3. The result was a set of ‘trimmed’ polygons which represented Multi-Building Opportunities. In general, this was a change that impacted the visual representation of the opportunities only (not the groupings of buildings or characterising data, other than the area of the opportunity polygon).
In a small number of cases (138, or 1% of the Multi-Building Opportunities), the trimming process resulted in one or more heat demands being isolated from the grouping that they belonged to. These fragments were deleted from the Multi-Building Opportunity dataset.
Separation of Multi-Building Opportunities and High Property Count Areas
With the final Opportunity areas created and summary statistics joined, a further classification step was completed to differentiate between High Property Count Areas and the Multi-Building Opportunities which form the focus of the national assessment. Using the property count fields added in a previous step, High Property Count Areas were separated from the other polygons whenever the property count was greater than or equal to 1,000.
High Heat Demand Areas were identified within the High Property Count Areas dataset by selecting only those areas with total heat demands above 100,000 MWh per year.
Matching of non-contiguous heat sources to opportunities
Waste heat sources
13 new data centre locations were identified through a web search and added to the waste heat sources dataset from the Scotland Heat Map (without any of the characterising data that is present in the SHM).
Buffer radii were calculated for all waste heat sources using the process described in Section 5.2.2, but this time using a Linear Heat Density proxy of 4,000 kWh/metre/year multiplied by their estimated annual heat supply capacity. Data centres that do not feature in the Scotland Heat Map dataset were assigned a buffer radius of 1 km. Buffers were then drawn in the GIS environment using the process described in Section 5.5.1.
Maximum connection distances were calculated for Communal Opportunities and Multi-Building Opportunities, also using a Linear Heat Density proxy of 4,000 kWh/metre/year multiplied by their total estimated annual heat demand.
A proximity analysis considered the separation between a waste heat source’s point location and either the building footprint of a Communal Opportunity or the geometric centroid of a Multi-Building Opportunity. The centroid was chosen as the evaluation point to avoid instances where ‘limbs’ extending from Multi-Building Opportunity polygons were close to waste heat sources but the majority of the heat demands were not. The choice of the centroid also limited instances where large areas of open green space were within reach of the waste heat source, but heat demands were not.
Using spatial join operations in QGIS, any demand evaluation points (building footprints or opportunity centroids) located within the maximum supply-driven connection distance of each waste heat source were taken forward for further evaluation based on the demand-driven maximum connection distance.
For each waste heat source and opportunity pairing identified through a spatial intersection, lines were drawn between the waste heat locations and the point or polygon representing the opportunity. This was done using the “Shortest Line Between Points” tool in QGIS. Each line represented a potential match between supply and demand, with the line also facilitating the calculation of the distance between the two. These distances were compared against the corresponding demand-driven maximum connection distances previously calculated. Any lines that exceed the maximum distance for their matched demand group were removed from the analysis. Each remaining connection line therefore represented a viable spatial match between a waste heat source and an opportunity.
Waste heat sources that had been matched with low temperature heat network opportunities were processed into a dedicated output dataset which captures their locations and the relevant fields present in the original Scotland Heat Map layer such as the heat source sector and annual supply potential (where available).
Blue and green spaces
The blue space dataset was created by combining Ordnance Survey mapping of static water bodies, waterways and coasts into a single file. This included rivers, canals, lochs and other major surface water features.
The Green Heat in Green Spaces (GHiGs) dataset was produced by Greenspace Scotland specifically to support the identification of opportunities for hosting ground source heat infrastructure in public green spaces, including in connection with heat networks. The country’s mapped green spaces were already subjected to a degree of screening in the preparation of the dataset. An additional screening step removed blue and green space polygons with areas of less than 1,000 m2.
Both the blue space and GHiGs datasets were subject to a geoprocessing step that removed narrow parts of the polygons present. This enabled the subsequent process of matching green and blue space with opportunities to avoid creating unrealistic connections (as explained in Section 4.3.2). This was done by applying a negative (inwards) buffer of 5m to the shapefile which will remove any polygon (or part of a polygon) that is narrower than 10 metres. The resultant layer was then buffered again by 105m (positive, outwards) to counteract the initial negative buffer and implement a maximum matching search radius of 100 metres from the boundary of a green or blue space.
A spatial join was then conducted between the blue and green spaces’ buffers and the opportunities (both multi-building and communal) identified in previous steps. Intersections between these features represented matches between heat sources and opportunities.
Identification and characterisation of anchor loads and cooling customers
Public sector anchor loads were identified according to the criteria stated in Section 5.2.2. Non-public sector anchor loads were identified where the field “PUBLIC_BUILDING_FLAG” in the Non-Domestic Analytics dataset had a value of “Not applicable”, and where the “heatdemand” field in the Scotland Heat Map was greater than 200 MWh per year. Both types of anchor load were processed into dedicated output datasets which capture their locations and characteristics that are relevant to the viability of connecting them to a low temperature heat network. (Dataset joins using the anchor loads’ Unique Property Reference Numbers (UPRNs) enabled data from both Scotland Heat Map and Non-Domestic Analytics to be brought together.)
Potential cooling customers existing within Multi-Building Opportunity groupings were identified through application of the criteria set out in Table 21 to the relevant datasets and performing of a spatial join. The type of building, infrastructure or process was included in a dedicated output dataset which also captures the location of each potential cooling customer.
Data source
Criteria
Scotland Heat Map 2022 ‘Potential Energy Supply’ layer
Sector equals “Brewery”, “Cooling Towers”, “Data centre”, or “Supermarket”
Scotland Heat Map 2022 ‘Heat demands’ layer
Ordnance Survey Class Description (tertiary level) is “Hotel/Motel” (CH03), “Bingo Hall / Cinema / Conference / Exhibition Centre / Theatre / Concert Hall” (CL07) or “Hospital / Hospice” (CM03) – or secondary level description is “Office” (CO).
and
Heat demand > 100MWh/year.
Table 21: Criteria for the identification of potential cooling customers within Multi-Building Opportunities
Characterisation of Communal Opportunities and Multi-Building Opportunities
A range of characterising data fields were joined onto the Communal Opportunities and Multi-Building Opportunities spatial datasets. (Data fields integral to the opportunity identification process – namely, heat demands and domestic and non-domestic property counts – were already present for these layers as well as for High Property Count Areas.)
Characterising data mostly came from the three address-level datasets (Scotland Heat Map, Home Analytics and Non-Domestic Analytics), with some additional spatial data derived from open government sources (Local Authority and Data Zone boundaries, the Scottish Index of Multiple Deprivation and the Scottish Government Urban Rural Classification). The source of each data field in the Communal Opportunities and Multi-Building Opportunities layers is listed in Table 24 and Table 22. Full details of input datasets are given in Section 3.1 of this Appendix.
The Unique Property Reference Number (UPRN) was the data field used to match values from Home Analytics and Non-Domestic Analytics with the heat demand points that derived from the Scotland Heat Map. The vast majority of SHM heat demand points were also present in the relevant other dataset. However, a total of 6,588 (0.4% of 1.5 million) SHM heat demand UPRNs which were part of Multi-Building Opportunities or High Property Count Areas were not present in Home Analytics or Non-Domestic Analytics. This could have been due to incompleteness of datasets, inconsistencies with UPRN assignment, changes of use, or building demolition. A similarly small fraction of heat demands in Communal Opportunities were affected.
Data from the aforementioned sources was summed, counted or formed the input to further calculations (such as percentages of overall totals). For some data fields, a majority (modal) value from the grouped heat demands was calculated. In some instances, the requirement for data to be aggregated to a certain level (to satisfy data protection and licensing requirements) meant that criteria had to be met for a value to be reported. The calculations applied to each field in the Communal Opportunities and Multi-Building Opportunities layers are set out in Table 23 and Table 25.
Where Scotland Heat Map UPRNs were absent from the other datasets, data relating to these heat demands was excluded from the calculations of group characteristics. This explains why occasionally some values do not sum to the totals that would otherwise we expected. Percentage results represent the distribution of characteristics across heat demands that had Home Analytics and/or Non-Domestic Analytics records only.
Some characterising data fields relate to low temperature heat network ‘archetypes’ that may or may not apply to a particular opportunity. These archetypes were defined by the researchers as set out in Table 14, Section 4.2.10. Archetype identification sometimes required spatial joins to be conducted with layers representing heat sources and anchor loads. Other archetypes are defined by opportunity characteristics like area and urban/rural classification.
SHM = Scotland Heat Map, HA = Home Analytics, NDA = Non-Domestic Analytics, GHiGS = Green Heat in Green Spaces. Table continues on subsequent pages.
Short Field Name
Full Field Description
Source
ID_2
Communal Opportunity identification number
None (original)
ParentUPRN
Communal Opportunity ‘Parent’ Unique Property Reference Number (UPRN)
SHM
Local_Aut2
Local Authority
data.gov.uk
Data_Zone2
2022 Data Zone
data.gov.uk
SIMD_Deci2
Data Zone Overall Scottish Index of Multiple Deprivation (SIMD) Decile
data.gov.uk
UrbRur8_2
2022 Urban-Rural 8-fold classification
data.gov.uk
HeatDemnd2
Communal Opportunity estimated total annual heat demand in MWh
SHM
Dom_Count2
Communal Opportunity number of dwellings
SHM
ND_Count2
Communal Opportunity number of non-domestic heat demands
SHM
Soc_Ten%2
Communal Opportunity percentage of dwellings with social tenure
HA
FP_Band2
Communal Opportunity fuel poverty band
HA (banding is original)
Fuel_Gas%2
Communal Opportunity percentage of heat demands with mains gas as the main fuel type
HA and NDA
Fuel_Ele%2
Communal Opportunity percentage of heat demands with electricity as the main fuel type
Fuel_Oth%2
Communal Opportunity percentage of heat demands with other as the main fuel type
Sys_Boil%2
Communal Opportunity percentage of heat demands with boiler as the main heating system
HA and NDA
Sys_HP%2
Communal Opportunity percentage of heat demands with heat pump as the main heating system
Sys_Comm%2
Communal Opportunity percentage of heat demands with a communal system as the main heating system
Sys_Othr%2
Communal Opportunity percentage of heat demands with other as the main heating system
LHEECt0%2
Communal Opportunity percentage of dwellings in LHEES Low Carbon Heat Category 0
HA
LHEECt1%2
Communal Opportunity percentage of dwellings in LHEES Low Carbon Heat Category 1
LHEECt2%2
Communal Opportunity percentage of dwellings in LHEES Low Carbon Heat Category 2
LHEECt3%2
Communal Opportunity percentage of dwellings in LHEES Low Carbon Heat Category 3
BLCon_Gas2
Communal Opportunity baseline total annual heat consumption from mains gas in MWh
SHM, HA and NDA
BLCon_Ele2
Communal Opportunity baseline total annual heat consumption from electricity in MWh
BLCon_Oth2
Communal Opportunity baseline total annual heat consumption from other fuel in MWh
Bldg_Age2
Communal Opportunity building age
SHM
Heritge%_2
Communal Opportunity percentage of properties with building heritage designation(s)
HA and NDA
Off_Gas%_2
Communal Opportunity percentage of properties estimated to be “off gas” [14]
SHM
EleGrdCap2
Communal Opportunity electricity grid capacity band
Communal Opportunity number of non-domestic heat demands
Count19
Soc_Ten%2
Communal Opportunity percentage of dwellings with social tenure
Count of dwellings with social tenure divided by count of dwellings19. Number of domestic properties in building must be at least 5, otherwise data point will be “NULL”
FP_Band2
Communal Opportunity fuel poverty band
Category assigned on the basis of average fuel poverty probability percentage for dwellings in group. Number of domestic properties in building and with a value in the relevant field must be at least 10, otherwise data point will be “NULL”
Fuel_Gas%2
Communal Opportunity percentage of heat demands with mains gas as the main fuel type
Count of heat demands using the fuel divided by count of heat demands within the grouping19
Fuel_Ele%2
Communal Opportunity percentage of heat demands with electricity as the main fuel type
Fuel_Oth%2
Communal Opportunity percentage of heat demands with other as the main fuel type
Sys_Boil%2
Communal Opportunity percentage of heat demands with boiler as the main heating system
Count of heat demands using the heating system divided by count of heat demands within the grouping19
Sys_HP%2
Communal Opportunity percentage of heat demands with heat pump as the main heating system
Sys_Comm%2
Communal Opportunity percentage of heat demands with a communal system as the main heating system
Sys_Othr%2
Communal Opportunity percentage of heat demands with other as the main heating system
LHEECt0%2
Communal Opportunity percentage of dwellings in LHEES Low Carbon Heat Category 0
Count of dwellings in the category divided by count of dwellings within the grouping19
LHEECt1%2
Communal Opportunity percentage of dwellings in LHEES Low Carbon Heat Category 1
Number of domestic properties in each count must be at least 5, otherwise data point will be “NULL”
LHEECt2%2
Communal Opportunity percentage of dwellings in LHEES Low Carbon Heat Category 2
LHEECt3%2
Communal Opportunity percentage of dwellings in LHEES Low Carbon Heat Category 3
BLCon_Gas2
Communal Opportunity baseline total annual heat consumption from mains gas in MWh
Sum of heat demands of all properties in grouping that use the fuel
BLCon_Ele2
Communal Opportunity baseline total annual heat consumption from electricity in MWh
BLCon_Oth2
Communal Opportunity baseline total annual heat consumption from other fuel in MWh
Bldg_Age2
Communal Opportunity building age
Majority (modal) value within grouped heat demands
PropTy_maj
Communal Opportunity majority domestic property type, if applicable
Majority (modal) value within grouped domestic heat demands
Heritge%_2
Communal Opportunity percentage of properties with building heritage designation(s)
Count of heat demands which are either in Conservation Areas or Listed divided by count of heat demands within the grouping19
Off_Gas%_2
Communal Opportunity percentage of properties estimated to be “off gas” [20]
Count19 of heat demands which are recorded as “off gas” divided by count of heat demands within the grouping
EleGrdCap2
Communal Opportunity electricity grid capacity band
Category assigned on the basis of the expected available headroom at the location’s primary substation as a proportion of expected primary substation capacity in 2030
Majority (modal) value within grouped domestic heat demands
HeatSrceW2
Number of heat sources of type Waste Heat matched to Communal Opportunity
Count
HeatSrceG2
Number of heat sources of type Greenspace matched to Communal Opportunity
Count
HeatSrceB2
Number of heat sources of type Blue Space (water bodies) matched to Communal Opportunity
Count
HeatScMWh2
Communal Opportunity matched waste heat sources total annual potential supply in MWh
Sum
Archtyp1_2
Type of Communal Opportunity (Domestic, Mixed Use, Non-domestic)
If grouping heat demands are all domestic, archetype is Domestic. If grouping heat demands are all non-domestic, archetype is Non-domestic. Otherwise, archetype is Mixed Use
Archtyp2_2
Heat Source Led archetype, if applicable
If at least one Waste Heat, Greenspace or Blue Space heat source is matched to the opportunity, archetype applies
Table 24: Sources of characterising data fields in the Communal Opportunities output layer
Table continues on subsequent pages
Short Field Name
Full Field Description
Calculation, if applicable
All applicable fields
Where a data field is a calculated majority (modal) value, the value will be “NULL” if there is no majority value (e.g. if there is a tie)
Cluster_ID
Multi-Building Opportunity identification number
Local_Aut1
Local Authority
Majority (modal) value within grouped heat demands
Data_Zone1
2022 Data Zone in which majority of heat demands lie
SIMD_Deci1
Overall Scottish Index of Multiple Deprivation (SIMD) Decile of Data Zone in which majority of heat demands lie
Urb%_1
Percentage of heat demands in Urban areas (according to 2022 Urban-Rural 8-fold classification)
Count of heat demands in location classified as Urban divided by count of heat demands within the grouping[22]
HeatDemnd1
Cluster estimated total annual heat demand in MWh
Sum
Dom_Count1
Cluster number of dwellings
Count22
ND_Count1
Cluster number of non-domestic heat demands
Count22
Soc_Ten%1
Cluster percentage of dwellings with social tenure
Count of dwellings with social tenure divided by count of dwellings22. Number of domestic properties in cluster must be at least 5, otherwise data point will be “NULL”
FP_Band1
Cluster dwelling fuel poverty band
Category assigned on the basis of average fuel poverty probability percentage for dwellings in group. Number of domestic properties in cluster and with a value in the relevant field must be at least 10, otherwise data point will be “NULL”
Fuel_Gas%1
Cluster percentage of heat demands with mains gas as the main fuel type
Count22 of heat demands using the fuel divided by count of heat demands within the grouping
Fuel_Ele%1
Cluster percentage of heat demands with electricity as the main fuel type
Fuel_Oth%1
Cluster percentage of heat demands with other as the main fuel type
Sys_Boil%1
Cluster percentage of heat demands with boiler as the main heating system
Count22 of heat demands using the heating system divided by count of heat demands within the grouping
Sys_HP%1
Cluster percentage of heat demands with heat pump as the main heating system
Sys_Comm%1
Cluster percentage of heat demands with a communal system as the main heating system
Sys_Othr%1
Cluster percentage of heat demands with other as the main heating system
LHEESCt0%1
Cluster percentage of dwellings in LHEES Low Carbon Heat Category 0
Count of dwellings in the category divided by count of dwellings within the grouping22
LHEESCt1%1
Cluster percentage of dwellings in LHEES Low Carbon Heat Category 1
Number of domestic properties in each count must be at least 5, otherwise data point will be “NULL”
LHEESCt2%1
Cluster percentage of dwellings in LHEES Low Carbon Heat Category 2
LHEESCt3%1
Cluster percentage of dwellings in LHEES Low Carbon Heat Category 3
BLCon_Gas1
Cluster baseline total annual heat consumption from mains gas in MWh
Sum of heat demands of all properties in grouping that use the fuel
BLCon_Ele1
Cluster baseline total annual heat consumption from electricity in MWh
BLCon_Oth1
Cluster baseline total annual heat consumption from other fuel in MWh
Heritge%_1
Cluster percentage of properties with building heritage designation(s)
Count of heat demands which are either in Conservation Areas or Listed divided by count of heat demands within the grouping22
Off_Gas%_1
Cluster percentage of properties estimated to be “off gas” [23]
Count of heat demands which are recorded as “off gas” divided by count of heat demands within the grouping22
EleGrdCap1
Cluster electricity grid capacity band
Category assigned on the basis of the expected available headroom at the location’s primary substation as a proportion of expected primary substation capacity in 2030
HeatSrcW_1
Number of heat sources of type Waste Heat matched to cluster
Count
HeatSrcG_1
Number of heat sources of type Greenspace matched to cluster
Count
HeatSrcB_1
Number of heat sources of type Blue Space (water bodies) matched to cluster
Count
HeatScMWh1
Cluster matched waste heat sources total annual potential supply in MWh
Sum
ArctypAnc1
Anchor Load Led archetype, if applicable
If at least one anchor load is present within the grouped heat demands, archetype applies
ArctypHSL1
Heat Source Led archetype, if applicable
If at least one Waste Heat, Greenspace or Blue Space heat source is matched to the opportunity, archetype applies
ArctypNhd1
Urban Neighbourhood archetype, if applicable
If the area within the cluster boundary is more than 3,000 m2 and less than or equal to 100,000 m2 and at least 80% of heat demands are in locations classified as ‘urban’, archetype applies
ArctypStr1
Street Scale archetype, if applicable
If the area within the cluster boundary is less than or equal to 3,000 m2, archetype applies
Clust_Area
Area of Multi-Building Opportunity polygon in square metres
Pub_Anc_L1
Indicator of presence of public sector anchor loads
Oth_Anc_L1
Indicator of presence of non-public sector anchor loads
Table 25: Calculation of characterising data fields in the Multi-Building Opportunities output layer
Quality assurance
Stakeholder engagement provided some high-level quality assurance of elements of the model design, including key assumptions. Data quality risk assessment and responses are discussed in Section 4.5 of this Appendix. This chapter discusses dedicated quality assurance activities carried out in addition to stakeholder engagement and data quality risk assessment.
Researchers’ quality assurance
Quality assurance checks carried out on the model and its outputs included:
review of model scope, specification and model map;
review of methodology (this Appendix) for correctness and fitness-for-purpose;
review of data outputs User Guide for completeness and fitness-for-purpose;
maintenance of version control;
review of data outputs:
units, precision and data type (numbers, text)
field and layer labelling
empty data fields, extreme values and distributions within data layers
checksums
review of visualisations for readability and accuracy;
development of Assumptions Log and Quality Assurance Log, including Issues Log and Possible Improvements Log.
Issues noted were either resolved through adjustments to the model or accepted and discussed in the appropriate section of this Appendix.
Scottish Government quality assurance
A meeting was held with Scottish Government representatives during which elements of the model were demonstrated within the QGIS software environment. Questions were posed and answered on diverse aspects of the methodology. Scottish Government representatives also reviewed Sections 2 to 5 of this Appendix and the Assumptions Log.
Potential improvements
The following potential improvements have been identified while developing and implementing the methodology for the national assessment:
Conducting sensitivity analysis on the Linear Heat Density-proxy assumption to generate an understanding of how the number and scale of Multi-Building Opportunities varies. This could help practitioners decide which opportunities they should focus on, and would help researchers to build the evidence base regarding the contribution that low temperature heat networks could make to decarbonising heat in buildings.
Investigating the impact of using the same Linear Heat Density-proxy assumption for public sector anchor loads as for all other types of building. If the impact of treating public anchor loads differently is negligible, the methodology could be simplified.
Incorporating more recently updated heat demand data from Home Analytics, Non-Domestic Analytics or other sources (including the Scotland Heat Map should it be updated). Improving accuracy due to increasing Energy Performance Certificate (EPC) coverage, new data collection and the development of improved modelling methodologies will improve the ability of the national assessment methodology to identify locations likely to be suitable for low temperature heat networks.
Sub-archetypes (for example, types of Communal Opportunity based on occupancy or building form) could be developed.
Scottish Water information regarding the location and capacity of wastewater treatment plants would expand the number of potentially viable waste heat sources available to be matched with nearby low temperature heat network opportunities.
Ordnance Survey building use classes could be used to expand the list of important sources of waste heat beyond those included in the SHM “Potential Energy Supply” layer.
Research into the waste heat capacity of non-fossil fuelled thermal power stations (e.g. from condensers that form part of the steam cycle) and anaerobic digestion plants could support the expansion of potential sources of waste heat that could supply low temperature heat networks.
Improvements to the available data concerning green spaces and woodland could improve the accuracy of the matches identified between green spaces and low temperature heat network opportunities.
Information on the variation of waste heat availability with time (from daily profiles to seasonal fluctuations) would improve confidence in the degree to which demand from heat users on a network can be met from a waste heat source.
How to cite this publication:
Waters, L., Brown, B. and Brown, A. (2026) ‘National assessment of low temperature heat network opportunities’, ClimateXChange. https://doi.org/10.7488/era/7027
While every effort is made to ensure the information in this report is accurate as at the date of the report, no legal responsibility is accepted for any errors, omissions or misleading statements. The views expressed represent those of the author(s), and do not necessarily represent those of the host institutions or funders.
This work was supported by the Rural and Environment Science and Analytical Services Division of the Scottish Government (CoE – CXC).
Grid electricity connections are near-universal in Scotland, with the notable exception of some islands, remote communities and very remote rural properties. The national assessment has not excluded known off-grid locations. We expect that, in the very rare cases that opportunities are identified in such places, most users will be aware of the constraints that apply. More information can be found in Section 4.2.6 of Appendix A. ↑
The categories used in this paragraph are those defined by the Scottish Government’s 6- and 8-fold urban-rural classifications. ↑
All geospatial data was reprojected to a common Coordinate Reference System (CRS). ↑
Where no EPC exists for an address, the developers of the dataset (and those that feed into it) inferred its heat demand by training statistical and geospatial models using the address-level information that is available, combined with local area statistics (such as from neighbours’ EPCs). The production of EPCs itself involves some simple modelling of a property’s heat requirements based on observations made during a physical survey. ↑
Shared Ground Loop schemes are a type of low temperature heat network in which the heat source is a ground source heat collector that is shared between multiple distributed heat pumps. ↑
The ‘Potential Energy Supply’ layer derives from an assessment of potential sources of waste heat for heat networks in Scotland carried out by Sinclair and Unkaya (BRE) for ClimateXChange (2020). ↑
The Green Heat in Green Spaces project was unable to calculate this quantity with sufficient confidence to publish results and was restricted in terms of the contributory data that was possible to share. ↑
The concept of what properties ‘require’ in order to enable heat pump installation is not explained. It is unclear whether operating costs, capital costs, space requirements, consumer acceptance or technology availability (among other possible factors) influence judgments of what is ‘required’. ↑
Feasibility studies and options appraisals provide evidence that low temperature heat networks can be, but are not always, cost-competitive with existing polluting heating systems. Comparisons of shared ground loop operating costs with individual air source heat pumps (Element Energy, 2023) can also be considered alongside comparisons of air source heat pumps against fossil heating systems such as those provided by Energy Saving Trust. ↑
Evidence could not be found in literature to support this quantitative assumption. Johnston et al. (2024) state that in small properties with low heat demands, the capital costs of an air-to-water heat pump may not be economic and alternative technologies should be considered. We infer that heat pumps connected to low temperature heat networks will similarly be uneconomic for properties with low heat demands. The value of 5,000 kWh per year was selected and justified through the development of a simple cost model comparing a Shared Ground Loop scheme connection with electric storage heaters. The model assumed a heat pump capacity of 3 kW (equal to the smallest ground source heat pumps currently on the market), typical per-property installation costs, heat pump grants available in early 2026 (and expected to continue), typical system efficiencies, long-term average electricity prices, maintenance costs and equipment replacement costs. For properties with low heat demands, air-to-air heat pumps can often outcompete electric storage heaters in terms of overall heating costs. ↑
Often this issue can be attributed to changes to buildings that took place between the creation of the datasets on which the Scotland Heat Map 2022 was built, and the creation of the versions of Home Analytics and Non-Domestic Analytics used in the National Assessment. Demolitions or changes of use are common changes that would cause this issue. ↑
The “Join by Location” tool effectively allows all demands that fall within the spatial boundary of a single parts polygon to share its ID with that polygon, creating a new polygon for each interaction (i.e if a buffer fragment contains 5 demand points within it, 5 polygons with one ID each is added to this new layer). A check is then done which matches the ID which was attached to each heat demand point with the ID attached to each new polygon created by the “Join by Location” process. Any polygon without a matching ID (including if there are no heat demand points within it) was considered an “orphaned” fragment. and deleted from the developing polygons layer. ↑
The output area polygons available from National Records of Scotland required to be converted into line data format and buffered by 1 metre to give them physical breadth that could interact with opportunity area polygons. Cut opportunity areas were then buffered by 1.1 metres to allow them to re-connect. ↑
‘Off gas’ refers to a property location being more than 63 metres from the nearest Scotia Gas Network gas distribution pipe. It is not related to the fuel used in that property. Independent gas networks are not included. ↑
Long Term Development Statements, Network Development Plans, Heat Maps and Primary Substation Polygons from the two Distribution Network Operators that serve Scotland. ↑
‘MoMu class’ is an archetype group developed by Energy Savings Trust that represents common types of blocks of flats in Scotland. ↑
‘Off gas’ refers to a property location being more than 63 metres from the nearest Scotia Gas Network gas distribution pipe. It is not related to the fuel used in that property. Independent gas networks are not included. ↑
Long Term Development Statements, Network Development Plans, Heat Maps and Primary Substation Polygons from the two Distribution Network Operators that serve Scotland. ↑
In QGIS, rather than performing a ‘Count’ calculation, it was necessary to sum a field that contained a ‘1’ for heat demands that were to be counted and a ‘0’ for all other heat demands. ↑
‘Off gas’ refers to a property location being more than 63 metres from the nearest Scotia Gas Network gas distribution pipe. It is not related to the fuel used in that property. Independent gas networks are not included. ↑
‘MoMu class’ is an archetype group developed by Energy Savings Trust that represents common types of blocks of flats in Scotland. ↑
In QGIS, rather than performing a ‘Count’ calculation, it was necessary to sum a field that contained a ‘1’ for heat demands that were to be counted and a ‘0’ for all other heat demands. ↑
‘Off gas’ refers to a property location being more than 63 metres from the nearest Scotia Gas Network gas distribution pipe. It is not related to the fuel used in that property. Independent gas networks are not included. ↑
Scotland’s peatlands store large amounts of carbon and play a key role in climate regulation and biodiversity conservation. However, extracting peat for use in horticultural growing media – materials used to grow plants in containers or controlled systems – damages these ecosystems and releases greenhouse gas emissions.
The Scottish Government has committed to ending the use of peat in horticulture, while recognising the sector’s economic importance. In 2024, potatoes, fruit and vegetables, and ornamental plants such as flowers and shrubs together contributed £831 million to Scottish crop output, representing over half of the total value.
This report assesses whether it is possible to move to peat-free growing materials in Scottish horticulture. It draws on published studies, industry reports and extensive engagement with the sector, including workshops and interviews with growers, growing media manufacturers, retailers and researchers. Stakeholders provided practical insight into how peat-free systems are working in practice, the challenges businesses face, and the solutions currently being trialled across the industry.
Key findings
Scotland can achieve peat-free horticulture. Businesses across the horticulture sector are already using a range of alternative growing materials.
The main challenge is system coordination. For a successful transition to peat free horticulture, infrastructure, standards, supply chains and technical growing practice are best aligned.
Parts of the sector have already made progress. Retail growing media are now largely peat-free, while some tree growers and producers of ornamental plants have significantly reduced their use of peat
Some growing approaches face greater challenges in a peat-free transition. Growers must test propagation systems and production of seed potatos and ericaceous crops – acid-loving plants such as blueberries – over a longer period to ensure peat-free methods work reliably.
Cost, supply chain capacity and consistency of materials remain key barriers.
With coordinated implementation and realistic timelines, Scotland has the resources and industry capability to support a peat-free transition.
Conclusions
This report finds that the principal challenge for Scotland’s peat-free transition is the coordination of infrastructure, standards, supply chains and technical growing practice – rather than a lack of alternatives or willingness in the sector.
Evidence from trials, real business use and stakeholder experience shows that growing without peat can be successful when materials are reliable, standards are clear, and the appropriate support is provided. Where these conditions are uncertain or developing, growers and manufacturers reported that technical uncertainty can translate into commercial risk.
The transition should therefore be understood as a process of system redesign rather than simple material substitution. With coordinated implementation and investment, and continued collaboration across the sector, Scotland can phase out horticultural peat while keeping plant growing productive and reliable.
Overall, the evidence indicates that Scotland can achieve transition to a peat-free horticulture sector. Scotland has the resources, industry capability and emerging technical knowledge needed to support this transition. The pace of this change will depend on clear policy direction, realistic timescales, and continued support for infrastructure, standards, and shared trials.
Glossary
Term
Definition
Air-filled porosity
A basic measure of how well soil or growing media allows air to reach plant roots. Refers to the proportion of the material’s volume that is filled with air after the growing medium has been fully watered and excess water has drained away. Expressed as a percentage, with higher values indicating more air space and lower bulk density.
Amateur grower
Individuals growing plants, typically in a home or community setting, for personal enjoyment. May sell plants face-to-face at local events for charitable purposes e.g. National Gardening Scheme. Not making a regular profit.
Bare-root plants
Plants that are sold with their roots exposed, without soil or growing medium.
Biochar
A highly porous, carbon-rich material produced by heating organic biomass (e.g. wood, crop residues or manure) in a low-oxygen environment through pyrolysis.
Biosecurity
Practices that prevent the introduction and spread of plant diseases and pests.
Black peat
Found in the lower, older layers of a peat bog. Composed of plant matter which is in more advanced stages of decomposition than in upper layers. Dark brown to black in colour, with dense, compacted structure.
Blonde peat
Sometimes referred to as white peat. Youngest form of peat, extracted from the uppermost layers of peat bogs. Less decomposed than black peat, with a more fibrous and open structure.
Bulk density
A measure of how heavy a growing medium is for a given volume. It reflects how compact the material is, with higher bulk density indicating a heavier, more compact medium with fewer air spaces, and lower bulk density indicating a lighter, more open structure. Bulk density affects handling, transport costs, plant stability, and root aeration, and is therefore an important factor when comparing peat-based and peat-free growing media.
Carbon sequestration
The process by which carbon dioxide is captured and stored in natural sinks such as peatlands, forests and soils.
Cation exchange capacity (CEC)
The ability of a growing media or soil to hold and exchange positively charged ions (cations), including key nutrients. High CEC media retains and supplies cations more effectively.
Circular economy
A circular economy is one that reduces demand for raw materials, designs products to last, and encourages reuse, repair, and recycling. It aims to keep materials in use for as long as possible, extract maximum value from them while in use, and recover and regenerate products and materials at the end of their service life.
Carbon dioxide equivalent (CO2e)
A standard metric for measuring the total climate change impact of different greenhouse gases (GHGs). It converts the emissions of various GHGs, such as methane and nitrous oxide, into a single unit representing the amount of CO2 that would cause the same amount of warming.
Coir
A natural fibre extracted from the outer layer of coconut husks, commonly used as a peat alternative in growing media.
Composted bark
The outermost part of woody plants (usually softwoods) which are crushed and screened before fermenting in heaps. Used in growing media chiefly to improve drainage and increase air capacity. May increase CEC and pH buffering of media.
Composted green waste (CGW)
Biodegradable organic waste, primarily composed of plant material, that has been decomposed and recycled as a soil amendment or growing media component. Production, quality control and lab testing for CGW is covered by The British Standard Institution PAS 100 across the UK.
Environmental horticulture
Defined by the Horticultural Trades Association (HTA) as encompassing ‘a wide range of activities—includingcompanies that cultivate ornamentalplants, manufacturers of gardenequipment, wholesalers and retailerssuch as garden centres, and specialistsin landscape and arboriculturewho maintain home gardens andexpansive parks.’
Ericaceous plants
Group of plants in the family Ericaceae, which thrive in acid (low pH) soil environments. Includes economically important genera such as Vaccinium (blueberry, cranberry), Rhododendron and Camellia.
Greenhouse Gas (GHG) emissions
GHG’s – including carbon dioxide, methane, nitrous oxide and fluorinated gases – which trap heat when released into the atmosphere, contributing to global warming and climate change.
Horticulture
The science and art of cultivating plants. The horticulture industry can broadly be broken down into two main sectors – environmental and production.
Hydroponics
A method of growing plants without soil or growing media, using nutrient-rich water solutions.
Life Cycle Assessment (LCA)
A method used to evaluate the environmental impact of a product, including carbon footprint, resource use and emissions.
Liner
Young plants grown individually from cuttings in modular trays ready to be potted-up or planted-out. The term ‘liner’ is often used interchangeably with ‘plug’.
Loam
A type of soil composed of roughly equal proportions of sand, silt and clay particles.
Microbial activity
The presence and function of microorganisms in soil or growing media, impacting plant health and nutrient availability.
Oomycetes
A group of fungus-like microorganisms, commonly known as ‘water-moulds’, which often act as decomposers. Thrive in moist environments and include damaging pathogens such as Phytophthora spp.
Plant pathogen
Biological agents which cause disease in plants, negatively impacting plant health, quality and crop yield. Includes microorganisms such as bacteria, fungi and viruses.
Pathogen screening
The process of testing growing media for harmful microorganisms.
Peat
Organic material formed when dead plant matter collects and breaks down slowly in cool, waterlogged, oxygen deficient conditions.
Introduced into UK horticultural use in the 1930’s and renowned for its water retentive properties and favourable structure.
Peat-free growing media
Growing media composed of non-peat components, including coir, wood fibre, composted bark and composted green waste. Peat-free media is typically made up of a combination of ingredients to achieve the desired growing properties.
Peat soils
Soil with a surface peat layer with more than 60% organic matter and of at least 50cm thickness.
Peaty soils
Soil with a shallower peat layer at the surface less than 50cm thickness over mineral layers.
Perlite
Formed from a naturally occurring volcanic glass, which is mined and heated to produce a lightweight, porous material. Commonly used to improve aeration and drainage in growing media.
pH buffering capacity
Describes how well a growing medium can resist changes in pH when fertilisers or other inputs are added. A medium with good buffering capacity maintains a more stable pH, helping to ensure nutrients remain available for healthy development.
Phytotoxicity
Adverse effects on plant growth and development caused by phytotoxins (substances which are toxic or poisonous to plants). In the context of growing media, excessive fertiliser may result in phytotoxicity.
Plug plants
Young plants grown individually from seed in modular trays ready to be potted-up or planted-out.
Professional grower
Individuals or groups regularly growing and selling plants with a view to making a profit.
Propagation
The process of growing new plants from seeds, cuttings, or tissue culture through both sexual and asexual means.
Responsible sourcing
The ethical procurement of raw materials that ensures environmental sustainability and fair labour practices.
Responsible Sourcing Scheme (RSS)
A framework that assesses the environmental, economic, and social sustainability of growing media components.
Soft fruit
Soft, juicy fruit borne on low growing plants (not trees) such as strawberries, raspberries and blueberries.
Sphagnum moss
A plant species that grows on peatlands and other wet habitats, often harvested for horticultural use as a water-retentive substrate.
Standardisation and quality Control
Efforts to ensure consistency, safety, and performance across the growing media production sector.
Supply chain reliability
The ability to ensure consistent availability and quality of growing media materials.
SWOT Analysis
A strategic planning tool that evaluates: Strengths, Weaknesses, Opportunities, and Threats.
Vermiculite
A naturally occurring mineral, which is mined and heated to produce an expanded, lightweight material. Primarily used in horticulture to retain moisture and nutrients, can also improve aeration, although not to the same degree as perlite.
Wood fibre
Fibres extracted mechanically/thermally from wood and wood waste, used in peat-free growing media for high air capacity, good drainage and low bulk density.
Context for transition to peat-free horticulture
4.1 Research purpose
The Scottish Government has committed to phasing out the use of peat in horticulture. This commitment is reflected in policy measures including National Planning Framework 4 (NPF4) (Scottish Government, 2023a) and the consultation Ending the Sale of Peat in Scotland (Scottish Government, 2023b), which together restrict new commercial peat extraction licences and set out the basis for stakeholder engagement on the transition. Scottish Ministers have also written to UK counterparts to advocate for coordinated UK-wide legislation and a clear roadmap for ending horticultural peat use, underscoring inter-governmental support for a structured transition (Scottish Government, 2026).
This research (October 2024 to September 2025; Appendix A) examined the transition to peat-free growing media from a Scottish perspective and focussed on:
The level of confidence in available peat alternatives, including their performance, supply reliability, sustainability and cost.
The preparedness of the horticulture sector to reduce and eliminate peat use.
The main barriers to transition across Scottish horticulture.
Challenges associated with peat-dependent crops and growth stages, particularly ericaceous plants and propagation.
The scope for industry collaboration through coordinated grower trials.
The role and practicality of peat-free standards.
The overall feasibility of a sector-wide transition.
Background
Peat emerged as a key growing media component in UK horticulture in the 1970s, having first been commercialised as a constituent in loam-based media for container planting in the 1930s (Alexander et al., 2008; Prasad et al., 2024; Waller, 2012). Its combination of high water-holding capacity, good air porosity and structural stability ensures optimal conditions for healthy root development, while its low bulk density and friable texture make it easy to handle (Schmilewski, 2008). The inherently low nutrient content of peat allows growers to tailor treatments to suit specific crops, making it a versatile growing medium (National Institute of Agricultural Botany, 2024). Traditionally peat has been regarded as free from pathogens, pests, and weed seeds both at point of extraction and during controlled production. Its processing and grading are considered straightforward, and its pricing has historically been highly competitive (Barrett et al., 2016), making it a preferred choice in both professional and amateur horticulture.
Peatlands play a crucial role in carbon sequestration but, when degraded, become significant sources of greenhouse gas emissions (International Union for Conservation of Nature and Natural Resources, 2021). Analysis by The Wildlife Trusts (2022) estimates that up to 31 million tonnes of carbon dioxide have been released since 1990 as a result of peat extraction for UK horticulture. Although peatlands cover only about 3-4% of the Earth’s land surface, they store more carbon than any other terrestrial ecosystem, holding roughly twice as much as all the world’s forest biomass combined (United Nations Environment Programme, 2022).
Around 20% (c.1.8 million hectares) of Scotland’s land area is peatland (Bruneau and Johnson, 2014). Approximately 80% of UK peatlands are degraded, the majority located in Scotland, with 90% of raised bogs and 70% of blanket bogs in damaged condition (NatureScot, 2015). Although only around 1,000 hectares (0.05%) are harvested annually for horticulture – producing roughly 270,000 m³ of peat (Scottish Government, 2025, pers. comm.) – extraction disproportionately affects lowland raised bogs, one of the most threatened peatland habitats (UK Centre for Ecology and Hydrology, n.d.). Peat extracted in Scotland accounted for 18% of the total volume used in UK growing media in 2022 (Horticultural Trades Association, 2022a).
Concerns about the carbon emissions and biodiversity loss resulting from peat extraction were first raised in the 1980s and 1990s (Waller, 2012), prompting the formation of the Peat Working Group in 1992 and the introduction of stricter harvesting regulations. The UK Government’s first formal reduction goal appeared in Minerals Planning Guidance 13 (Department for Environment, Food and Rural Affairs, 1995), which aimed for 40% of growing media materials in England to be non-peat by 2005 (Alexander et al., 2008). This trajectory was reinforced in the 2011 Natural Environment White Paper (The Natural Choice), which set voluntary targets to phase out peat use in amateur gardening by 2020 and in professional horticulture by 2030 (HM Government, 2011).
Subsequent national and UK policy has sought to progress this transition. The phasing out of peat-based horticultural products is a devolved matter, with each nation developing its own approach within the context of an intended UK-wide ban. In England, the Department for Environment, Food and Rural Affairs (2023) previously set out a series of proposed phase-out dates under the former UK Government, including a statutory ban on the retail sale of peat-based products for amateur use by 2024, a phased reduction for professional growers by 2026, and a full prohibition by 2030. The current UK Government has reiterated its intention to legislate for a ban on the sale of peat and peat-containing products, although implementation remains contingent on parliamentary time and no specific timetable has yet been confirmed (Defra, 2025a). A Private Members’ Bill seeking to give legislative effect to a ban in England and Wales has been introduced to the UK Parliament and is awaiting a second reading (UK Parliament, 2025).
In Scotland, the Government has committed to ending the sale of peat-based horticultural products. The 2021–22 Programme for Government (Scottish Government, 2021) included a pledge to develop and consult on a ban as part of a wider strategy to transition away from peat. This commitment was progressed in February 2023 through a public consultation seeking stakeholder views on prohibiting sales, initially in the retail market and subsequently for professional growers (Scottish Government, 2023b).
Current use of peat in the horticulture industry
Figures released by the HTA (2022) and Defra (2025b) reveal that total peat use in UK horticulture declined slowly between 2011 and 2019, remaining close to 2 million m³ per year (Figure 1). In 2020, peat use increased temporarily, coinciding with a surge in home gardening and plant production during national COVID-19 lockdowns (White et al., 2021). From 2021 onwards, peat use fell rapidly; total volumes declined by around two-thirds between 2020 and 2023, associated with a sharp reduction in retail peat use; professional peat use also declined, but at a slower pace. By 2023, retail and professional use had converged at similar levels, each accounting for around half of remaining peat consumption.
Figure 1: Total peat usage across retail and professional sectors 2011-2023 (Defra, 2025b; HTA, 2022)
Between 2011 and 2023, the retail horticulture sector consistently used more growing media than the professional sector, typically between two and four times as much (Figure 2). Retail volumes fluctuated, but remained high overall, at 2.34 million m³ in 2023, compared with 0.81 million m³ used by professional growers. This reflects the much larger scale of the consumer growing-media market relative to commercial plant production. This highlights an important dynamic in the transition to peat-free media. Although the retail sector has reduced its peat use more rapidly, it remains the largest user of growing media overall. As a result, changes in the composition of retail products continue to exert a strong influence on total peat demand.
Figure 2: Total growing media usage across retail and professional sectors 2011-2023 (Defra, 2025b; HTA, 2022)
What are the alternatives to horticultural peat in growing media?
Current alternatives
Ongoing research and commercial trials have led to the development of several viable alternatives to peat, either individually or through the blending of more than one constituent material. Table 1 summarises a range of materials currently used, trialled, or proposed as alternatives to peat in horticultural growing media. It provides a high-level overview of each material’s origin, current level of commercial adoption, and primary functional role within growing-media blends.
The table is intended as an orientation tool for policymakers and practitioners, supported by full SWOT and detailed analyses of performance, constraints and sustainability considerations presented in Appendix F and Appendix G respectively. Currently, the most widely adopted materials across both professional and amateur horticultural sectors are wood fibre, coir and composted bark (Defra, 2025b; HTA, 2022).
Table 1: Overview of alternatives
Material
Source
Characteristics/uses
Anaerobic digestate (AD)
Limited/early commercial adoption
By-product of anaerobic digestion. Consists of nutrient-rich material remaining after organic waste is broken down in oxygen-free conditions during biogas production.
Supplies high levels of essential nutrients. Is used primarily to enhance the fertiliser value of growing-media blends, rather than as a structural base.
Composted bark
Widespread commercial adoption
By-product of forestry and wood-processing industries. Bark is composted through piling and turning, screened, and often nitrogen-treated prior to use.
Provides high air-holding capacity and structural openness (particle size dependent). Low inherent nutrient content allows fertilisation to be tailored to crop requirements.
Biochar
Limited/early commercial adoption
Carbon-rich, porous material produced by heating organic biomass (e.g. wood, crop residues or manure) under low-oxygen conditions (pyrolysis).
Contributes stable structure, porosity, nutrient retention and water-holding capacity when used as a blended additive.
Composted bracken
Limited/early commercial adoption
Harvested from natural/managed areas where bracken grows abundantly. Biomass is composted before use.
Improves structure and aeration, with potential nutrient contribution when composted. Can be suitable for ericaceous crops where composted material is acidic.
Coir and coir pith
Widespread commercial adoption
By-product of the coconut industry, consisting of fibres and fine pith derived from the outer husk of coconuts.
Provides a good balance of water retention and aeration, with high re-wetting capacity. Functionality varies depending on blend composition.
Composted green waste (CGW)
Widespread commercial adoption
Derived from commercial and public waste streams, including local authority green waste and agricultural residues.
Typically nutrient-rich. Used to enrich peat-free mixes and contribute organic matter.
Composted heather
No current commercial market
Upland biomass harvested as part of moorland vegetation management; chopped and composted to produce a fibrous material.
Early trials suggest potential for ericaceous growing media where an acidic product can be produced; evidence base remains under development.
Hemp fibre (Cannabis sativa)
No current commercial market
Fast-growing fibre crop that can be produced domestically; fibre derived from the woody core (hurds or shiv).
Lightweight material with good air-holding capacity and moderate water retention; may have nitrogen immobilisation effects due to high C:N ratio (similar consideration as wood fibre).
Loam
Widespread commercial adoption
Fertile mineral soil composed of a balanced mixture of sand, silt and clay.
Provides mineral content, structure and water-holding capacity; traditionally used as a base component in growing media.
Marine sediment
No current commercial market
Dredged material collected from coastal or marine environments and subjected to remediation prior to reuse.
Potential to contribute mineral fraction and influence water/nutrient dynamics when appropriately remediated; suitability is highly dependent on salinity/contaminant control and particle-size distribution.
Reclaimed peat
Limited/early commercial adoption
Peat recovered from previously disturbed sources (e.g. construction/dredging spoil, excavation arisings, or other waste streams) and processed for reuse.
Retains some of peat’s structural and water-holding properties; typically blended with composted or fibrous materials to improve performance.
Rice husk ash (RHA)
No current commercial market
By-product of rice milling, produced by controlled burning and processing of rice husks.
Enhances structure, aeration and water-holding capacity in growing-media blends.
Sheep wool
Limited/early commercial adoption
By-product of the wool industry, typically using low-grade fleece unsuitable for textile manufacture.
Retains water, supplies slow-release nitrogen and improves aeration.
Spent mushroom compost (SMC)
Limited/early commercial adoption
By-product of commercial mushroom production, following pasteurisation of spent growing substrate.
Nutrient-rich organic material used primarily as a conditioner or minor component in growing media to enhance fertility and structure.
Farmed Sphagnum
No current commercial market
Harvested from cultivated peatland systems using propagated Sphagnum moss, not wild-harvested.
Highly effective water retention and structure that improves aeration; particularly suited to propagation and sensitive crops.
Wood fibre
Widespread commercial adoption
Derived from primary and secondary wood-processing residues; fibres are processed under high temperature and pressure and often nitrogen-treated.
Enhances structure and air-holding capacity; commonly blended with other components in peat-free growing media.
Widespread commercial adoption
Across the UK and Scottish horticultural sectors, a range of peat alternatives are now in widespread commercial use, reflecting rapid diversification of the growing media market since the early 2010s. Wood fibre, composted bark, coir, composted green waste and loam form the core constituents of many current retail and professional blends, although their relative importance differs markedly between sectors. Wood fibre, composted bark and coir underpin both professional and retail formulations, whereas composted green waste is used predominantly in the retail market, with very limited penetration into professional growing systems. Each of these components contributes distinct physical and chemical properties, allowing manufacturers to engineer bespoke mixes tailored to specific crop needs and end markets. Most commercial products therefore rely on combinations of these materials, as no single component replicates the balance of air porosity, water-holding capacity and stability traditionally provided by peat (Gruda, 2019; Peano et al, 2012).
Limited or early commercial adoption
While a range of emerging or regionally available feedstocks (e.g. bracken, sheep wool, anaerobic digestate, biochar, spent mushroom compost and reclaimed peat) have been explored in peat-free media formulation, the published evidence base on their performance, quality variability and commercial feasibility remains relatively sparse. Many assessments are preliminary, often confined to small-scale trials or expert commentary rather than coordinated multi-site studies. Further research is therefore required to clarify where these materials may be deployed most effectively and at what scale (Calisti et al., 2023; Johnson and Di Gioia, 2023; Kennard, 2020; Medina et al., 2009; Pitman and Webber, 2013).
Although several of these materials demonstrate technical promise in specific contexts, uptake remains constrained by factors including supply consistency, variability in quality, sustainability considerations, regulatory requirements and the need for additional processing. In interviews, manufacturers of professional growing media consistently described these materials as “promising but peripheral”, noting that they are typically incorporated through pilot collaborations, niche retail products or experimental blends rather than forming part of core formulations.
No current commercial market in Scottish horticulture
A further group of materials is not yet established at commercial scale within UK professional growing media markets but is attracting interest in the context of longer-term peat-free strategies. These include composted heather, rice husk ash, marine sediment, hemp fibre and farmed Sphagnum. Rather than offering immediate substitutes, these materials represent prospective feedstocks that could contribute to future supply diversification and reduced dependence on imported substrates.
Several of these materials present theoretical or demonstrated advantages in specific contexts, including regional resource availability, circular-economy potential, carbon storage capacity and favourable structural properties. For example, cultivation of Sphagnum biomass through paludiculture systems has been investigated as a renewable peat substitute (Gaudig et al., 2017; Wichtmann et al., 2016), while rice husk ash and marine sediment have been assessed in blended substrates in controlled horticultural trials (Mattei et al., 2017; Omar et al., 2023). However, evidence of large-scale agronomic performance, supply-chain logistics and quality standardisation remains limited across most materials. Published studies are typically experimental, pilot-scale or regionally specific, and few materials have yet been widely validated under recognised horticultural quality standards such as PAS 100 or the Responsible Sourcing Scheme.
Stakeholder interviews characterised these options as high-potential but low-readiness, with further work required to clarify processing requirements, certification pathways, performance consistency and economic viability before widespread commercial uptake could occur. As Scotland progresses its transition away from peat, the future role of such materials will depend on continued research, market development and regulatory alignment rather than immediate substitution potential.
Mineral components and functional additives in peat-free media
The transition to peat-free growing media has prompted a more deliberate combination of organic and mineral components to maintain the structural and functional properties required for reliable plant growth. Mineral additives such as perlite, vermiculite and clay pumice are central to this task. Each offers specific physical benefits that provide structure and buffering capacity, and can be used to improve drainage, air holding capacity, nutrient retention and physical stability. These materials are increasingly important for standardising performance and reducing variability in peat-free formulations.
Alongside mineral additives, manufacturers and researchers have turned to supplements to strengthen the performance of peat-free media. These include biostimulants and wetting agents (surfactants). Biostimulants – including algae extracts, beneficial bacteria, fungal inoculants and mineral salts – are believed to enhance natural plant processes, promoting more efficient uptake of water and nutrients (Kisvarga et al., 2022). Wetting agents, available in liquid or granular form, improve water absorption and distribution within the media, helping to reduce runoff and water waste. Although many wetting agents are derived from synthetic chemicals, more sustainable alternatives are emerging. RHS peat-free trials have reported significant benefits from biostimulant use (RHS, 2025, pers. comm), and some growing media suppliers are now incorporating these into their professional peat-free formulations.
Media blending
It is widely recognised that there is no “silver bullet” replacement for peat (Koseoglu et al., 2021). Peat uniquely combines high porosity, water-holding capacity, structural stability and low inherent fertility, allowing growers to exercise precise control over nutrition and acidity (pH). Alternative constituents typically provide some, but not all, of these properties in isolation. As a result, the academic literature consistently emphasises that effective peat-free substrates must be formulated through blending multiple components, selected to balance water retention, drainage, nutrient availability and physical stability according to crop type and production system (Gruda and Bragg, 2020; Schmilewski, 2008). International reviews of growing-media systems note that blending is unavoidable, as no individual material replicates peat’s multifunctionality (Bragg and Alexander, 2019). This conclusion is reinforced by recent European analyses, which show that while bio-based resources such as wood fibre, composted bark, composted green waste and coir are available at scale, each presents technical or logistical limitations that must be addressed through careful combination and optimisation (Hirschler et al., 2022).
Tailoring mixes to specific crop needs
Evidence from stakeholder engagement across Scotland indicates that growers and growing media manufacturers who have successfully reduced peat typically rely on formulations combining wood fibre, composted bark, coir and – particularly for retail mixes – composted green waste. Manufacturers have refined these mixes through tailored approaches to wood fibre processing, coir buffering, and bark composting to improve consistency and performance.
European research identifies clear technical thresholds for peat-free material – typically up to 40% wood fibre, 50% composted bark, or 40% composted green waste – beyond which plant growth and substrate structure decline (Blok et al., 2021; Raviv, 2013). These findings underline that peat-free horticulture is not a simple substitution exercise, but one that depends on optimised blends informed by research, collaborative trials and coordinated supply-chain development. Diversification of materials improves performance and resilience, reducing exposure to single-stream supply risks and reflecting wider European recommendations to mobilise bio-based resources while maintaining quality and consistency (Gruda & Bragg, 2020; Hirschler et al., 2022; Schmilewski, 2014).
The transition to peat-free growing media frequently necessitates adjustments to irrigation and nutrient regimes, particularly in nurseries managing diverse crops under shared irrigation systems where substrate water and nutrient dynamics differ. Stakeholders emphasised the importance of tailoring media to specific crops and growth stages, with individual nurseries often requiring fine-textured propagation media alongside coarser, more water-retentive mixes for container-grown plants. As a result, growers commonly source multiple blends from different suppliers. This approach supports crop performance and operational flexibility, but has implications for procurement, consistency and supply-chain coordination.
While research demonstrates that peat-free growing media can support successful plant growth across a wide range of crops, outcomes are contingent on effective management of irrigation, nutrient supply and physical properties through optimised blending. Continued refinement, supported by targeted trials, collaboration and knowledge exchange, will be critical to broadening adoption and strengthening confidence in the performance of peat-free formulations (Bek et al., 2020; Hirschler et al., 2022; Koseoglu et al., 2021; Royal Horticultural Society, 2023; Sradnik et al., 2023). Appendix H presents an industry-led case study demonstrating how blended peat-free and peat-reduced growing media can be designed to meet crop performance requirements using widely available materials.
Sustainability of alternatives
It is essential that the sustainability of alternatives is clearly understood. This can be assessed through three complementary approaches:
Environmental assessment: This approach quantifies the environmental footprint of peat alternatives by analysing carbon emissions, energy use, water consumption and end-of-life impacts (Hospido et al., 2010). Studies assessing substitutes such as coir highlight that environmental outcomes vary depending on production methods, transport distances and assessment boundaries, underscoring the need for careful interpretation of life-cycle results (Peano et al., 2012; Toboso-Chavero et al., 2021).
Social sustainability: This dimension considers labour conditions, health implications and workplace safety within raw material supply chains. Sahu et al. (2019) identified significant health risks among workers involved in coir production, many of whom were women lacking adequate personal protective equipment (PPE), while Peano et al. (2012) highlighted occupational health risks associated with the processing of composted green waste.
Responsible Sourcing Scheme (RSS): The Responsible Sourcing Scheme for growing media is an industry-led framework that assesses the environmental and ethical performance of growing media products through a transparent scoring system covering energy use, water use, social compliance, habitat and biodiversity, pollution, renewability and resource-use efficiency. By providing clear ratings and independent auditing, the RSS supports informed decision-making by manufacturers, retailers and growers about the environmental impacts of growing media mixes and encourages continuous improvement in material sourcing (Responsible Sourcing Scheme, n.d.).
Environmental assessment
The assessment summarised in Table 2 provides a high-level overview of the environmental sustainability of sixteen potential alternatives to peat used in horticultural growing media. It draws on published life-cycle assessments (LCAs), industry reports, peer-reviewed literature and stakeholder interviews, supplemented with Scotland-specific evidence where available. Key sources include Gabryś and Fryczkowska (2022), Gruda (2019), Hashemi et al. (2024), Hirschler et al. (2022), Litterick et al. (2019), Peano et al. (2012), Stichnothe (2022), and Toboso-Chavero et al. (2021). Each material is assessed across four sustainability dimensions:
Emissions during production: Based on available LCAs, including direct fossil fuel use and indirect biogenic carbon release. Where quantitative data are reported, emissions are expressed as kg CO₂e per tonne (or per m³ for peat), with ranges reflecting methodological variation and uncertainty.
Transport emissions: Differentiating between locally sourced materials with short supply chains and imported feedstocks associated with long-haul transport.
Risk of offshoring impacts: A qualitative assessment of whether peat substitution may displace carbon or environmental burdens to other regions (e.g. imported coir or Baltic peat).
Scottish availability: The extent to which materials can realistically be sourced within Scotland, informing circular-economy potential, transport emissions and exposure to offshored impacts.
The qualitative ratings used in Table 2 (Low, Moderate and High) are intended to support comparative interpretation rather than provide precise measurements. Relative to other peat alternatives, a Low rating indicates lower production emissions, limited processing requirements and/or short supply chains based on available evidence. Moderate ratings reflect higher energy inputs, greater processing or transport requirements, or mixed evidence across impact categories. High ratings indicate materials that consistently show higher emissions, longer supply chains or greater risks of offshoring environmental impacts. Full quantitative data, assumptions and sources underpinning these classifications are provided in Appendix I. Table 2 should therefore be read as a comparative overview, highlighting broad patterns in environmental performance across material groups rather than precise rankings between individual material.
Table 2: Summary environmental assessment of peat alternatives used in horticultural growing media
Material group
Materials
Production emissions
Transport and offshoring
Scottish availability
Overall sustainability signal
Local woody materials
Composted bark
Low
Low-moderate
High
Favourable
Wood fibre
Low
Low
High
Favourable
Local organic wastes and by-products
Anaerobic digestate (AD)
Low
Low
High
Favourable
Biochar
Moderate
Moderate
Moderate
Mixed/context-dependent
Composted bracken
Low
Low
High
Promising but data-limited
Composted green waste
Low-moderate
Low
High
Favourable
Sheep wool
Low
Low
High
Promising but data-limited
Soils and sediments
Loam
Moderate
Low
Moderate
Mixed/context-dependent
Marine sediment
Moderate
Low
Moderate
Promising but data-limited
Imported agricultural by-products
Coir and coir pith
Moderate
High
Low
Higher environmental risk
Imported agricultural by-products
Rice husk ash (RHA)
Moderate-high
High
Low
Higher environmental risk
Novel or emerging materials
Composted heather
Low
Low
Moderate
Promising but data-limited
Hemp fibre (Cannabis sativa)
Moderate
Moderate
Moderate
Promising but data-limited
Farmed Sphagnum
Low-moderate
Low
Moderate
Promising but data-limited
Peat (domestic and imported)
Peat
High
Moderate-high
Declining/ constrained
Unfavourable
Reclaimed peat
Moderate-high
Low-moderate
Low-moderate
Mixed/context-dependent
Spent mushroom compost
Low-moderate
Low
Moderate
Mixed/context-dependent
Overall, the assessment indicates that environmental performance is strongly influenced by material provenance, processing intensity and supply-chain geography. Transport and offshoring ratings are based on indicative UK and European sourcing assumptions; however, actual impacts will vary depending on specific supply routes, processing locations and logistics. Across all assessed dimensions, locally sourced woody materials, particularly wood fibre and composted bark, consistently demonstrate more favourable environmental profiles than peat and imported alternatives, reflecting low production emissions, short supply chains and high Scottish availability.
Among waste-derived materials, anaerobic digestate performs favourably across all sustainability dimensions, reflecting its status as a locally available by-product with low marginal emissions and strong alignment with circular-economy objectives. Composted green waste similarly shows favourable environmental performance, with emissions largely confined to processing activities. Other locally available materials, including composted bracken and sheep’s wool, demonstrate promising circular-economy potential but remain constrained by limited life-cycle evidence and uncertainty around scalability. Biochar presents potential benefits as a carbon-stable amendment; however, its overall sustainability signal remains context-dependent, varying with feedstock type, energy inputs and the scale of domestic processing capacity.
Materials requiring primary extraction or intensive processing, such as loam and marine sediment, show more mixed environmental profiles. While both benefit from relatively short transport distances, their circular-economy potential is limited by extraction impacts, energy requirements and, in the case of marine sediment, contamination risks and evidence gaps around horticultural suitability at scale. In contrast, imported agricultural by-products, particularly coir and rice husk ash, consistently present higher transport emissions and greater risks of offshoring environmental impacts, limiting their sustainability within a Scottish context despite the widespread use of coir as a peat substitute.
Finally, materials that retain a direct link to peat extraction, including reclaimed peat and spent mushroom compost, offer only partial or transitional environmental benefits. While reclaimed peat avoids new extraction and spent mushroom compost is waste-derived with low additional emissions – and may become inherently peat-free as mushroom production transitions away from peat – both currently remain constrained in their ability to support long-term peatland protection and a fully peat-free growing-media transition (for full SWOT analysis please see Table 24 in Appendix F).
Social sustainability of alternatives
Social sustainability in peat-free growing media encompasses labour conditions, occupational health and safety, and the distribution of social impacts across domestic and international supply chains. While the environmental case for peat substitution is well established, the social implications of alternative materials are more variable and, in some cases, less visible. Addressing these issues is critical to ensuring that the transition to peat-free horticulture does not externalise social risks onto workers or communities elsewhere. Table 32 in Appendix J sets out key social sustainability considerations.
Social sustainability is highest where supply chains are domestic, formalised and regulated, with well-characterised and controllable occupational risks (e.g. anaerobic digestate (AD), wood fibre, loam, spent mushroom compost (SMC)). Moderate–high ratings reflect generally regulated contexts moderated by seasonal labour, dust or bioaerosol exposure, agrochemical inputs or emerging-sector uncertainty (e.g. wool, farmed Sphagnum, composted green waste (CGW)). Moderate ratings capture identifiable exposure risks or regulatory complexity (e.g. hemp, marine sediment). Lower ratings arise where informal labour structures, persistent health concerns or structural sustainability conflicts externalise social risk (e.g. coir, reclaimed peat, rice husk ash).
Responsible Sourcing Scheme (RSS) calculator
Published in August 2024, Guidance Notes: Responsible Sourcing Scheme for Growing Media established an industry-led framework for assessing the sustainability of growing media ingredients. The Responsible Sourcing Scheme (RSS) evaluates key input materials used in horticulture against multiple environmental and social criteria to support more informed decision-making by growers, retailers and consumers. Scores are based on manufacturer data that is subject to independent auditing to enhance transparency and credibility. A detailed summary of the RSS methodology and scoring system is provided in Appendix K.
While the scheme incorporates measures related to carbon and climate within criteria such as energy use and pollution, it does not directly quantify greenhouse gas (GHG) emissions or carbon sequestration in the manner of a full lifecycle assessment. Instead, climate-relevant impacts are inferred through proxy indicators such as fossil fuel consumption, transport inputs and other resource use measures. Methane and nitrous oxide are acknowledged within the broader framework but are not systematically modelled as discrete climate impact outputs.
As a result, the RSS provides a structured, transparent and multi-criteria tool for comparing the relative sustainability of growing media ingredients, but its treatment of carbon and climate impacts is indirect and not comprehensive. This has implications where peat-reduction policy is closely linked to quantified carbon outcomes, especially when comparing materials with differing biogenic carbon dynamics or soil carbon effects.
Positioning the RSS alongside more detailed climate-accounting approaches highlights the trade-offs between usability and precision: the scheme’s graded index supports practical sourcing decisions and market signalling, whereas lifecycle-based carbon inventories offer deeper quantification of climate footprints for research and policy evaluation.
Industry perspectives on environmental sustainability
Stakeholder engagement confirmed that environmental performance remains central to the rationale for peat reduction, though interpretations of “sustainability” varied considerably in practice. Manufacturers and growers emphasised carbon reduction, circular-economy principles and local sourcing as core sustainability strategies.
Several participants highlighted closed-loop systems and renewable energy use, including compost production powered by food-waste-derived biogas and investment in carbon-capture technologies. Others prioritised regional sourcing to reduce transport emissions, with some growers deliberately avoiding imported coir in favour of domestic forestry residues. Resource diversification was also identified as a key strategy, with interest in utilising biomass streams such as bracken and wool to support circular supply chains and reduce reliance on imports.
However, stakeholders also cautioned against environmental trade-offs and “hidden carbon costs,” particularly in relation to long-distance transport of coir and continued reliance on imported peat. Concerns were also raised about contamination in green-waste compost and the need for robust quality assurance to maintain product performance and consumer confidence.
Knowledge gaps in sustainability assessment of alternatives
Although multiple frameworks exist to assess the sustainability of peat-free growing media – including Life Cycle Assessment (LCA), social risk analysis and the Responsible Sourcing Scheme (RSS) – there remain significant methodological and evidential gaps. These gaps affect the comparability, transparency and policy relevance of sustainability claims associated with peat alternatives. More detailed explanation of these gaps is given in Appendix L.
Availability of alternatives
Overview
The transition to peat-free growing media depends on reliable access to alternative materials at sufficient scale and consistent quality. Availability is determined by domestic resource capacity, competition from other sectors, processing infrastructure, and the feasibility of imports. In Scotland, forestry and agricultural by-products provide a strong resource base, however, meeting national demand will require addressing technical, logistical and regulatory constraints.
Established inputs such as wood fibre, composted bark, green waste and imported coir already underpin much of the UK market. Alongside these, several materials remain at limited or developmental stages, including bracken, wool, heather residues, anaerobic digestate, biochar and farmed Sphagnum. Evaluating their role requires consideration of market scale, processing capacity and their contribution to displacing remaining peat use. At UK level, peat consumption has fallen substantially in recent years, however, further substitution depends on the reliable supply and optimisation of the principal alternative materials. Appendix M provides a quantitative comparison of the four most widely adopted alternatives relative to remaining UK peat demand, indicating their current market volumes and the constraints that may limit further expansion. In summary:
Wood fibre and composted bark represent the most significant near-term substitutes, constrained by bioenergy competition and processing capacity.
Composted green waste provides meaningful volume but depends on consistent quality assurance to manage contamination risks.
Bracken and low-grade sheep wool offer renewable, locally available feedstocks with potential for niche or supplementary use, though operational and regulatory barriers remain.
Loam, digestate fibre and biochar are unlikely to provide large-scale substitution, serving primarily additive or specialist functions.
Emerging materials – including farmed Sphagnum, heather residues, hemp and marine sediments – show longer-term or localised potential but are not currently scalable.
Imported materials such as coir and rice husk ash can supplement domestic supply but introduce carbon and supply-chain vulnerabilities.
Overall, achieving national peat replacement will require coordinated expansion of domestic processing capacity, improved resource recovery systems and targeted innovation to scale viable alternatives.
Global context of the supply chain of raw materials
The availability of alternative raw materials is shaped not only by technical suitability but by competing industrial demands and wider geopolitical dynamics. Supply-chain pressures are experienced differently across the sector: growers report direct exposure to trade, availability and logistical constraints, whereas manufacturers more commonly emphasise regulatory consistency, feedstock certification and contamination standards (Litterick et al., 2019).These structural dynamics influence the reliability, scalability and long-term resilience of Scotland’s peat-free transition.
Assessment of key alternatives indicates three broad patterns of exposure:
Domestic materials, including wood fibre, composted bark and composted green waste, are subject to limited geopolitical risk but face strong internal competition from bioenergy, construction and agricultural markets (Koseoglu and Roberts, 2025). Availability is therefore closely linked to forestry outputs, waste-management systems and energy policy.
Import-dependent materials, notably coir and rice husk ash, are exposed to global market volatility, shipping costs and potential export controls, increasing supply uncertainty for Scottish growers (Koseoglu and Roberts, 2025). These materials remain sensitive to geopolitical developments and international trade conditions.
Emerging or under-utilised Scottish resources, such as bracken, heather residues, anaerobic digestate fibre and sheep wool, carry minimal geopolitical exposure but depend on regulatory alignment, processing infrastructure and land-management incentives to become viable at commercial scale (Gaudig et al., 2017; Hill, 2022; Pitman and Webber, 2013).
Taken together, these findings indicate that material security depends less on absolute resource availability and more on cross-sector competition, infrastructure capacity and regulatory coherence within Scotland and the wider UK. A detailed material-by-material assessment of competing uses and geopolitical exposure is provided in Appendix N.
Biosecurity in peat-free growing media production
Biosecurity is a critical consideration in peat-free horticulture, as contaminated growing media can introduce plant pathogens and threaten crop health (Elliot et al., 2023; Frederickson-Matika et al., 2024; Litterick et al., 2025; Vandecasteele et al., 2018). Scotland’s transition away from peat brings renewed attention to these risks, particularly given the increased use of organic and recycled inputs. Key challenges are summarised in Appendix O and include:
Pathogen risk in organic substrates: Organic and recycled materials may harbour plant pathogens, underscoring the need for clearly defined sanitisation protocols and plant-health-specific quality standards (Elliot et al., 2023; Vandecasteele et al., 2018).
Limited plant-health coverage in certification schemes: Existing accreditation frameworks primarily address human-health and contamination thresholds, with limited explicit provision for plant-pathogen risk (Elliot et al., 2023).
Traceability and import assurance considerations: Effective risk management depends on consistent material tracking, proportionate import controls and clear guidance on waste reuse and disposal (Elliot et al., 2023; Litterick et al., 2025).
Variation in substrate risk profiles: Biosecurity risk differs between materials. Green waste composts certified under BSI PAS 100 are generally considered moderate risk, as the standard focuses on human-health criteria rather than plant-pathogen assurance. Heat-treated wood fibre and composted bark are typically regarded as lower risk. Virgin peat has historically been considered comparatively low risk due to limited microbial activity; however, detections of Fusarium oxysporum f. sp. melonis and Rhizoctonia spp. have been reported (Frederickson-Matika, 2024; Litterick et al., 2025).
Evidence indicates a lack of sector-wide standardisation in sanitisation regimes, particularly regarding time, temperature and moisture thresholds – an issue most pronounced among smaller producers (Litterick et al., 2025). While peat has often been regarded as comparatively low risk due to limited biological activity, studies have demonstrated that peat-based substrates can support the survival and proliferation of plant pathogens where contamination occurs (Benavent-Celma et al., 2023; James, 2005).
Systematic, comparative surveillance of baseline pathogen loads across peat and peat-free media however remains limited (Müller et al., 2025). Current evidence therefore does not support a definitive conclusion that peat-free substrates inherently present greater biosecurity risk than peat. Rather, risk appears to be influenced by processing controls, quality assurance systems and supply-chain management. Achieving equivalent assurance across materials depends on transparent quality control, consistent testing and clearly defined sanitisation standards (Elliot et al., 2023). Biosecurity considerations therefore form one component of the broader technical, environmental and supply-chain assessment required when evaluating peat alternatives and designing resilient media blends for Scottish horticulture (Müller et al., 2025).
The economics of peat-free growing media
Recent analysis (Koseoglu & Roberts, 2025) and stakeholder engagement indicate that cost remains a significant barrier to peat-free transition. Of the 18 grower interviews analysed in Phase 2 of this research, 16 (89%) reported increased growing media costs following transition to peat-free or peat-reduced mixes. Reported increases most commonly fell within a range of approximately 10-40% when comparing like-for-like volumes of peat-free media with previously purchased peat-based mixes. Some growers cited substantially higher differentials, including instances where price was reported to have doubled. These figures reflect grower-reported purchase prices rather than standardised per-unit market comparisons. These stakeholder-reported increases are broadly consistent with findings from a UK-wide Royal Horticultural Society (2023) survey, which identified a 15–25% higher average cost for peat-free compared with peat-reduced growing media among responding businesses (n=35).
Cost impacts appear to vary across sectors, with ornamental, forestry, fruit and vegetable, and potato mini-tuber growers all reporting upward pressure, though the magnitude differed according to crop type, blend formulation and procurement arrangements. In some cases, growers indicated that transition would not have been economically viable without external financial support. Despite the consistency of reported cost increases, there remains limited peer-reviewed research directly comparing peat and peat-free media under equivalent production conditions, highlighting a gap in systematically collected cost data.
Material cost differentials
Stakeholder interviews and recent supply-chain analysis identify relative cost differences between major peat-free constituents (Table 3). Manufacturers indicated that composted bark and wood fibre are currently among the more cost-competitive peat-free components. Stakeholder-reported pricing suggested composted bark was below some peat-blended media, while wood fibre was moderately higher. In contrast, coir-based mixes were consistently described as substantially more expensive, with reported cost increases of 30-50% attributed to washing, buffering and international freight. Hirschler and Osterburg (2025), and Koseoglu and Roberts (2025) similarly identify coir as among the more expensive peat-free constituents, reflecting its processing requirements and transport intensity.
Composted green waste feedstocks are often available at relatively low bulk prices within the recycling sector. However, higher bulk density and additional processing requirements (e.g. screening, drying and quality control) contribute to final blended media costs, making simple raw price comparisons with peat imprecise (Koseoglu and Roberts, 2025). Digestate-based composts were reported at intermediate price points, reflecting maturation and handling requirements despite waste-derived feedstocks. A comparative cost analysis in a commercial plant nursery context found that compost derived from anaerobic digestion could present cost advantages relative to peat when assessed on a lifecycle cost basis, including labour and handling impacts (Restrepo et al., 2013).
For materials that do not yet have an established place in the UK growing media market (e.g. hemp fibre, marine sediment, rice husk ash, farmed Sphagnum and composted heather), reliable cost data are largely unavailable. These materials are typically produced at pilot scale, are regionally specific, or are not yet integrated into established supply chains. As a result, pricing information is either unpublished, commercially confidential, or highly context-dependent. This makes direct comparison with peat or mainstream alternatives difficult at present.
Table 3: Relative cost differences and cost drivers for widely adopted peat-free constituents
Material
Indicative cost position (relative to peat) *
Key cost drivers
Composted bark
Comparable to or slightly above peat
Processing, screening
Coir and coir pith
Substantially above peat
Import, washing, buffering
Composted green waste (CGW)
Moderately above or competitive, depending on processing and blend context (no standardised pricing)
Processing, screening, drying
Wood fibre
Moderately above peat
Processing, screening
* Relative positions reflect stakeholder and literature evidence rather than fixed market pricing.
Independent market analysis in Germany found that peat-free growing media cost on average approximately 21% more than peat-containing products at retail, although prices for individual growing-media components did not differ consistently. This suggests that mix formulation, processing and market structure contribute to observed price differentials (Hirschler & Osterburg, 2025). It is important to note that growing media component prices are subject to fluctuation due to factors including energy costs, freight rates, exchange rates, seasonal demand and regulatory changes. For this reason, the table above presents relative cost positions and principal cost drivers rather than fixed price estimates.
Ancillary production costs
Growers emphasised that cost increases extend beyond media purchase prices. Transition to peat-free substrates often requires adjustments to irrigation regimes, fertiliser strategies and handling systems. Several growers reported increased labour inputs associated with altered media structure, including more frequent tray filling adjustments and manual interventions. One nursery estimated overall production costs increased by 25-30% following transition, reflecting nutrient and labour inputs rather than media costs alone. Larger producers reported that economies of scale, in-house blending and automation mitigated some cost increases. In contrast, smaller nurseries and independent growers, with lower purchasing power and limited mechanisation, reported sharper per-unit impacts.
Supply-chain and structural cost drivers
Analysis by Koseoglu and Roberts (2025) identifies several structural factors that influence the cost profile of peat-free growing media. These drivers extend beyond the headline price of individual constituents and reflect broader supply-chain characteristics.
Transport dynamics are a key consideration. Many peat alternatives differ from peat in bulk density and compressibility, affecting transport efficiency and haulage costs per usable volume. Modern supply-chain analyses and industry assessments identify transport configuration, logistics and processing requirements as significant structural contributors to cost outcomes (Hirschler and Osterburg, 2025; Koseoglu et al., 2021; Vandecasteele et al., 2018).
Processing requirements also contribute to overall cost. Producing horticulture-grade compost involves screening, grading and quality assurance steps that increase handling and infrastructure demands. Tightened contamination thresholds—particularly relating to plastics—require investment in improved screening systems and covered storage (Scottish Environment Protection Agency, 2025; Waste and Resources Action Programme, 2016). For imported materials such as coir, additional washing, buffering and long-distance freight introduce further logistical and processing inputs. In parallel, production systems historically designed for fine, flowable peat may require modification to accommodate more fibrous or structurally variable substrates, requiring operational adjustments and transitional capital investment.
Taken together, these system-level factors mean that cost outcomes are shaped not only by raw material choice but also by infrastructure capacity, logistics configuration and scale of operation. Larger manufacturers may absorb some pressures through in-house blending and automation, whereas smaller operators can experience proportionately higher impacts. Evidence suggests that some of these cost differences may reduce over time as domestic recycling and processing capacity expands and supply chains mature (Koseoglu & Roberts, 2025). However, in the short to medium term, these factors continue to influence the economic conditions under which peat-free media are produced and adopted.
Conclusions – alternative growing media
Section 5 demonstrates that peat-free growing media is now a technically viable but systemically complex transition. There is no single “drop-in” substitute for peat. Instead, successful peat-free production depends on carefully optimised blends that combine materials with complementary physical, chemical and biological properties. Wood fibre, composted bark, composted green waste (retail) and coir currently underpin most UK formulations, with other materials contributing additive, niche or developmental roles.
Evidence from stakeholder engagement and technical literature indicates that peat-free growing media must be formulated to achieve a reliable air–water balance, with crop and stage-specific adjustments driven primarily by particle-size distribution, container geometry and irrigation regime rather than a fixed recipe. Pore-size distribution governs performance: finer fractions increase water retention but may reduce aeration, while coarser fractions increase air-filled porosity and drainage. As crops move from propagation into larger containers, mixes are refined to reflect changing rooting volume and structural demand. In plugs and trays, short substrate columns retain proportionally more water and can limit air-filled porosity, while propagation substrates are typically maintained at low nutrient and soluble salt levels to avoid inhibiting germination or early root development. For ericaceous crops, maintaining a suitably low pH remains a critical constraint shaping constituent choice and limiting pH-raising inputs.
Across sustainability dimensions, performance varies primarily by provenance and processing intensity. Locally sourced woody materials and domestic organic by-products generally demonstrate more favourable environmental and social profiles, reflecting shorter supply chains, lower transport emissions and regulated labour conditions. Import-dependent materials, particularly coir and rice husk ash, remain technically effective but introduce higher transport emissions and greater risk of offshoring environmental and social impacts. Emerging materials – including farmed Sphagnum, bracken, wool and hemp – show promise in circular-economy terms but require further validation, scaling and certification before widespread deployment.
Availability is shaped less by theoretical resource abundance and more by infrastructure capacity, cross-sector competition and regulatory coherence. Forestry residues and organic waste streams provide Scotland with a strong domestic resource base, yet scaling substitution depends on investment in processing, contamination control, quality assurance and logistics. Biosecurity assurance, particularly for recycled and organic substrates, remains a critical component of system resilience.
Economic evidence confirms that cost remains a material barrier. Most growers report increased media expenditure following transition, typically in the range of 10-40%, with additional operational costs associated with irrigation, nutrition and handling adjustments. Structural supply-chain factors – including processing intensity, bulk density, transport efficiency and scale of operation – play a significant role in shaping final cost outcomes. While some cost differentials may reduce as supply chains mature, short-to medium-term pressures remain.
Taken together, the evidence indicates that Scotland’s peat-free transition will depend on coordinated expansion of domestic processing capacity, optimisation of blended formulations, strengthened quality and biosecurity standards, and continued innovation to diversify supply. Peat substitution is achievable, but it is best understood as a process of system redesign rather than simple material replacement. Table 4 summarises the relative performance of each component, drawing together the sustainability, supply, cost, and horticultural suitability metrics discussed in this section. Peat is included as a baseline for comparison; although technically reliable and historically cost-competitive, its extraction is incompatible with Scotland’s long-term peatland protection and climate objectives
Table 4: Overall summary of peat alternatives
Material
Sustainability
Availability
Relative cost signal
Technical suitability
Anaerobic digestate (AD)
Strong
Limited
Moderately higher
Functional
Composted bark
Strong
Established
Comparable/ lower
Reliable
Biochar
Mixed
Limited
Moderately higher
Functional
Composted bracken
Strong
Limited
Insufficient evidence
Functional
Coir and coir pith
Mixed
Established
Substantially higher
Reliable
Composted green waste (CGW)
Strong
Established
Moderately higher
Functional
Composted heather
Mixed
Not currently
Insufficient evidence
Functional
Hemp fibre (Cannabis sativa)
Mixed
Not currently
Insufficient evidence
Functional
Loam
Mixed
Limited
Moderately higher
Functional
Marine sediment
Mixed
Not currently
Insufficient evidence
Functional
Peat (baseline for comparison)
Significant conflict
Limited
Comparable/ lower
Reliable
Reclaimed peat
Significant conflict
Limited
Insufficient evidence
Reliable
Rice husk ash (RHA)
Mixed
Not currently
Insufficient evidence
Functional
Sheep wool
Mixed
Limited
Moderately higher
Functional
Spent mushroom compost
Mixed
Established
Moderately higher
Functional
Farmed Sphagnum
Mixed
Not currently
Insufficient evidence
Reliable
Wood fibre
Strong
Established
Moderately higher
Reliable
Table 5: Compact key for Table 4. Ratings reflect stakeholder evidence and published studies within a Scottish context.
Rating dimension
Green
Yellow
Red
White
Sustainability
Strong environmental and social alignment
Mixed/context dependent
Significant environmental or policy conflict
Availability
Established commercial supply (Scotland/UK)
Limited or emerging supply
Not currently scalable
Relative cost signal
Comparable to or lower than peat
Moderately higher*
Substantially higher
Insufficient evidence
Technical suitability
Reliable performance in peat-free blends
Functional but mainly additive/niche
Note: ‘Moderately higher’ costs typically fall within 10-40% above peat where evidence exists.
Feasibility of alternatives in Scotland
Sector context and current transition status
Horticulture in Scotland sits within the broader agricultural sector and, for the purposes of this research, encompasses ornamentals, trees for forestry and woodland creation, fruit and vegetables, and potato mini-tubers. The analysis also considers growing media manufacturers and retailers, reflecting the central role of substrate supply in peat reduction.
In 2024, potatoes, vegetables, fruit, and flowers and nursery stock together contributed an estimated £831.4 million to Scotland’s crop output, accounting for 54.5% of the total (Scottish Government, 2025b) (Figure 3). Nurseries producing plants for forestry and woodland creation generated approximately £19 million in turnover in the same year (Scottish Forestry, 2024). In the UK, household expenditure on growing media was estimated at £790 million in 2023 (Oxford Economics, 2024), underscoring the scale of the growing media market and its relevance to peat-free transition.
Figure 3: Output value Scottish potatoes and horticultural sectors, 2024 (Scottish Government, 2025b) Values represent farm output at current prices. Potatoes includes seed, ware and early potato production. Combined output from potatoes and horticultural crops accounted for approximately 54.5% of total Scottish crop output value in 2024 (Scottish Government, 2025b)
To complement published evidence, detailed interviews were conducted with 18 professional growers during Phase 2 of the research, with a further four growers engaged through stakeholder workshops in Phase 1 (total n = 22). Growers were selected to achieve broad representation across the sector, including variation in crop type, business size, and geographic location (including areas beyond the central belt (Appendix D)). This sampling approach aimed to capture a robust range of operational experiences and perspectives on peat-free feasibility.
Current transition status of Scottish growers
Across the professional growers interviewed, most remain in a peat-reduced phase rather than fully peat-free production. Peat continues to underpin commercial systems, although varying degrees of substitution with materials such as wood fibre, coir and composted bark were reported.
Ornamentals
All ornamental nurseries interviewed continue to use peat to some extent. Typical blends contain 50-70% peat for main crops, with wood fibre and coir serving as the principal alternatives. Propagation remains heavily reliant on peat-based media, often incorporating mineral components to modify drainage and structure. One micro-scale nursery reported fully peat-free production of herbaceous plants and grasses; however, they were unable to source trees, shrubs or aquatic plants that had not been propagated in peat, limiting their ability to eliminate peat entirely from their supply chain.
Trees for forestry and woodland
Among tree growers supplying forestry and woodland creation projects, two operate fully peat-free systems, while one uses a peat-reduced mix but could not specify the peat proportion at the time of interview. However, challenges remain: one peat-free grower was considering reverting to a 40% peat mix to mitigate crop losses, and another reintroduced a small proportion of peat in 2024 to address stalling growth in two species. In addition, externally sourced tree seed is sometimes stratified in peat prior to delivery, preventing complete removal of peat from the production chain.
Fruit
Fruit growers have made substantial progress toward peat-free production but expressed concern about reliance on coir as a primary substrate. Blueberries remain a notable exception due to their requirement for acidic growing conditions and are typically cultivated in a 50:50 peat-coir blend. Growers reported reluctance to reduce peat content further, citing potential risks to yield and fruit quality associated with substrate pH stability.
Mushrooms
Mushroom growers have also advanced toward peat-free production, with both businesses interviewed harvesting and marketing peat-free crops. However, transition remains at an early stage. Increased costs, reduced yields and smaller fruiting bodies were reported. As a result, both growers currently operate mixed production systems, combining peat-free and 100% peat-based substrates to maintain market supply while reducing overall peat use.
Potato mini-tubers
All surveyed potato mini-tuber growers have reduced peat use, operating at approximately 60–85% peat content. All three source media from the same manufacturer and supplement mixes with coir and wood fibre. Nevertheless, growers expressed caution about further reductions until high-performing alternative substrates are validated through trialling.
Scottish grower-led trials and experimentation
Despite continued reliance on peat overall, growers demonstrated a clear willingness to undertake on-site trials to advance peat-free production. These ranged from informal business-led experimentation to structured collaborations with researchers and growing-media manufacturers.
All eight interviewed ornamental growers had undertaken or were currently conducting trials, as were two of the three forestry tree producers. In the fruit sector, one large cooperative is trialling both novel materials and established peat substitutes as part of efforts to reduce reliance on coir as a primary substrate. All three mini-tuber producers reported engagement in internal or externally supported trials. Although both mushroom growers are already marketing peat-free crops, they described themselves as being in an ongoing learning phase, with further experimentation under way. Trial durations typically spanned one to three growing seasons, reflecting crop-specific requirements and the early stage of sector-wide transition. Trial length was frequently constrained by staff capacity and, in some cases, by cost.
Outcomes were mixed and highly crop-specific. Bedding plants, herbs, perennials and grasses generally performed well in peat-free blends incorporating wood fibre and coir. In contrast, ericaceous species and propagation-stage crops often exhibited reduced germination rates or weaker root establishment. Some growers reported that mixes containing more than 50% alternative materials were associated with reduced vigour or nutrient imbalance. Several also noted that successful transition required adjustments to irrigation and fertiliser regimes; however, these adaptations were not always implemented due to labour constraints and additional input costs. This suggests that performance outcomes depend as much on cultural and management adaptation as on substrate composition.
Despite variable results, growers consistently viewed trialling as essential to building technical confidence and practical experience. Smaller and more specialised nurseries reported greater flexibility in experimenting with new blends, whereas larger operations expressed caution due to the financial risk associated with large-scale crop loss. Encouragingly, a growing number of businesses have achieved marketable crops in fully peat-free media and continue to refine blends annually in collaboration with manufacturers. This iterative, grower-led experimentation reflects an emerging culture of innovation, even as challenges relating to media consistency, water management and cost remain.
Grower motivations for trialling and transition were shaped by a combination of anticipatory, market-driven and value-based factors. Many described experimentation as preparation for anticipated legislation, seeking to position themselves ahead of a potential peat ban. Others cited customer and supply-chain pressures, particularly from local authorities and retail groups requesting peat-free products. A smaller number framed transition as principle-led, aligned with internal sustainability commitments. Some growers also anticipated reputational or market advantages, although several reported that these had yet to translate into measurable commercial returns.
Current barriers
Barriers for professional growers
Stakeholder engagement identified a consistent set of barriers constraining professional growers’ transition to peat-free production. These span financial, technical, regulatory and structural dimensions and affect businesses across scales and sectors. A detailed account is provided in Appendix P. Overall, these findings align with published research highlighting the economic and technical complexity of peat substitution (Bek et al., 2020; Koseoglu and Roberts, 2025).
Cost and resource pressures were the most frequently cited constraint. Peat-free and peat-reduced media were cited as typically 30-40% more expensive than peat-based products, reflecting higher freight, processing and input costs. While local authorities and retailers increasingly request peat-free plants, growers reported limited willingness within the supply chain to absorb higher prices. Rising fertiliser costs and increased water demand further compound financial pressures. Transition may also require capital investment in storage, handling and irrigation systems, and in some cases new machinery to accommodate bulkier or less uniform substrates.
Technical compatibility and consistency present additional challenges. Peat-free blends, particularly those containing high proportions of wood fibre, were reported to clog or compact unevenly in automated filling and transplanting equipment. Variability between batches – linked to raw-material sourcing or processing – was frequently cited as undermining crop consistency and confidence in performance. Some growers also reported reduced structural stability in wood-based substrates over longer production cycles.
Labour and productivity impacts were widely noted. Peat-free mixes often require closer monitoring, more frequent irrigation and adjustments to nutrient regimes. In some cases, crops such as lavender required up to an additional month to reach marketable size. These factors increase labour inputs and extend production timelines, creating particular strain for smaller nurseries operating on narrow margins.
Skills and knowledge gaps continue to impede progress. Several growers reported limited understanding of substrate composition and management requirements, contributing to inconsistent irrigation and feeding practices. Training provision in production horticulture was described as limited within Scotland, restricting access to specialist technical support.
Representation and communication barriers were also identified. Some participants felt underrepresented within existing trade bodies and disconnected from UK-wide initiatives. Membership costs, limited regional engagement and a perceived emphasis on retail rather than commercial production were cited as factors limiting participation.
Business scale and geography shape adaptive capacity. Smaller and more remote nurseries face higher transport costs, minimum-order constraints and restricted supplier choice. Without the purchasing power to commission bespoke blends, many rely on generic formulations that may not be optimised for their crop range or local climatic conditions.
Finally, biosecurity and regulatory requirements introduce additional complexity. Plant-health rules governing cross-border trade and the use of certain organic materials can limit access to suitable peat-free substrates. For example, UK-Northern Ireland trade arrangements restrict the re-entry of certain wood-fibre media, while PAS 100-certified composts are considered unsuitable for some crops, such as raspberries, due to pathogen risk. In contrast, some growers rely on alternative assurance schemes, such as Dutch RHP certification, which apply more specific controls for horticultural growing media.
Barriers for media manufacturers
Published evidence on barriers specific to manufacturers remains limited. However, stakeholder engagement and sector reports consistently identify material supply, infrastructure capacity, input quality, economic viability, and policy clarity as key constraints to scaling peat-free growing media production in Scotland and the wider UK. While demand for alternatives such as wood fibre, bark, coir, and composted green waste continues to increase, feedstock reliability, processing capacity, and regulatory certainty have not developed at the same pace. A detailed account of these barriers is provided in Appendix Q.
Material supply constraints were identified as a primary challenge. Although domestic bark arisings from UK forestry and sawmilling are substantial in aggregate volume, only a proportion consistently meets the quality, particle size, and phytosanitary standards required for professional growing media. Competition for suitable bark from other sectors e.g. bioenergy, further limits availability and contributes to price volatility. Wood fibre supply is subject to similar pressures, with processing capacity constrained and feedstocks dependent on forestry outputs and wider industrial market cycles. As a result, reliance on imported alternatives – particularly coir – reflects both quality specifications and cross-sector competition, rather than absolute domestic scarcity. Tightening biosecurity requirements for bark imports add further cost and logistical complexity.
Infrastructure and logistics limitations compound these constraints. Stakeholders highlighted that even where raw materials are available, UK capacity for grading, maturation, blending, and quality control remains insufficient to ensure consistent, high-quality substrates at scale. Materials such as digestate fibre require specialised processing and extended stabilisation periods, while the bulk density and storage requirements of wood fibre and composted materials increase capital and transport costs. Both the Growing Media Taskforce (2022) and Office for the Internal Market (2023) identify infrastructure investment as critical to achieving reliable, scalable peat-free production.
Input quality and standards were also cited as significant barriers. Manufacturers report variability in wood fibre and composted materials arising from differences in source material, processing methods, and contamination levels. Green waste contamination – including plastics and persistent herbicide residues – continues to undermine confidence in recycled inputs. The absence of harmonised grading systems and clearly defined technical standards was described as a structural gap in the sector. The reformed Growing Media Association (Bragg, N., 2025, pers. comm.; HortWeek, 2025a) is developing new technical frameworks; however, stakeholders emphasised that coordinated research, independent trials, and transparent performance data are required to validate materials and support wider adoption.
Economic constraints further limit supply chain resilience. Transitioning away from peat has increased production costs, driven by new machinery requirements, higher storage needs, and increased transport expenditure. Wood fibre processing may require capital investment of £500k–£2 million per facility (Growing Media Taskforce, 2022), while expanding processing capacity for peat-free inputs such as coir may require investment of approximately £0.8–£1.2 million per plant (Office for the Internal Market, 2023). Heavier alternatives such as composted green waste incur substantially higher transport costs because of their greater bulk density, historically estimated at up to around 90% higher than peat on a per-volume basis (English Nature and the Royal Society for the Protection of Birds, 2002).
Policy uncertainty was identified as a cross-cutting barrier. Manufacturers reported that the absence of clear, harmonised timelines for peat restrictions across UK nations constrains long-term planning and discourages capital investment in infrastructure and equipment.
Barriers for plant retailers
Plant retailers play a key intermediary role in the transition to peat-free horticulture, linking consumers, growers, wholesalers and manufacturers. However, they face intersecting supply chain, economic, behavioural and policy barriers that constrain both the availability and uptake of peat-free products. Around half of retail plant businesses surveyed by the Scottish Government (2023b) expected to be negatively affected by a peat ban, underscoring the sector’s exposure to transition risks. Appendix R provides further detail.
Supply chain and infrastructure constraints were identified as a primary concern. Limited domestic processing capacity and inconsistent availability of peat-free growing media restrict the ability of some retailers to offer a fully peat-free product range. Larger businesses reported that shortages during peak trading periods could intensify competition for available volumes, potentially disadvantaging smaller outlets with less purchasing power (Office for the Internal Market, 2023). Storage and handling requirements present additional pressures. Peat-free media performance in storage varies by formulation, and trade guidance indicates that prolonged storage of bagged peat-free compost can lead to quality deterioration. Dry, covered storage and faster stock turnover are therefore recommended, potentially increasing space, handling and cost demands – particularly for smaller retailers.
Economic pressures further constrain progress. Peat-free growing media were reported by stakeholders to be approximately 30-40% more expensive than peat-based equivalents, with several retailers indicating that they absorb part of this differential to maintain competitive pricing. Smaller independent businesses, lacking the purchasing leverage of national chains, may be particularly exposed to input price volatility. Consumer price sensitivity reinforces these pressures: affordability remains a primary reason cited for continued peat use (Koseoglu and Roberts, 2025). In some cases, imported peat-based products remain cheaper than domestically produced peat-free alternatives, creating competitive imbalance within the retail market.
Quality and consistency concerns were also raised. Retailers reported variability in nutrient balance, pH, moisture retention and contamination within peat-free products. Trials conducted by the Stockbridge Technology Centre (HortWeek, 2025b) identified variability in the performance of retail media samples. Inconsistent product performance can generate negative customer feedback, reduce repeat purchases and undermine confidence. Retailers also noted that some peat-free plants may require more attentive irrigation management, increasing display maintenance demands.
Cultural and consumer barriers compound these practical challenges. Although surveys indicate that many consumers express a preference for peat-free options, this is not consistently reflected in purchasing behaviour (Dahlin et al., 2019; Office for the Internal Market, 2023). Retailers described a gap between environmental intention and consumer action, with some customers remaining sceptical regarding peat-free compost performance or perceiving it as less reliable. While experienced or sustainability-motivated gardeners often adapt successfully to peat-free systems, general awareness of best practice remains limited. Time constraints during peak seasonal trading reduce opportunities for customer education, though collaborative initiatives involving retailers, growers and manufacturers seek to address this through outreach and guidance materials (Horticultural Trades Association, n.d.).
Policy and standards gaps were identified as an additional barrier. Retailers reported that the absence of a unified certification or labelling framework for peat-free media allows wide variation in quality and environmental claims, complicating procurement decisions and consumer communication. Regulatory divergence between domestic and international markets was also highlighted: imported plants grown in peat are not currently subject to equivalent restrictions, potentially creating competitive imbalance. Clearer labelling, consistent enforcement and harmonised standards were identified as measures that could strengthen market confidence and support transition.
Sector and crop specific barriers
The transition to peat-free production is not uniform across horticulture; certain crop groups and production systems present distinct and heightened barriers, examined in greater detail in Appendix S.
Ericaceous crops – including rhododendrons, heathers and blueberries – are technically challenging to produce without peat due to their adaptation to acidic, low-nutrient soil conditions. Commercial grower monitoring in the UK identifies acid-loving ericaceous crops among those most difficult to transition away from peat (Koseoglu and Roberts, 2025). Growers cautioned that a rapid or inflexible ban could reduce plant diversity and limit the availability of specialist cultivars. These concerns are economically significant: Scotland is a major contributor to the UK berry sector, which generated an estimated £624 million in Gross Value Added (GVA) in 2023, with blueberries one of the four principal berry crops alongside strawberries, raspberries and blackberries (HortiDaily, 2025).
Experimental evidence in ericaceous systems indicates that peat-free components such as coir can support plant growth in bark-based substrates, although performance, nutrient dynamics and pH stability remain highly formulation- and management-dependent and must be considered alongside wider sustainability considerations (Kingston et al., 2020; Scagel, 2003). Industry trials have also reported encouraging results: a recent commercial peat-free trial of Inkarho rhododendrons demonstrated that well-formulated peat-free mixes can achieve satisfactory growth and quality under nursery conditions (HortWeek, 2025d).
Potato mini-tuber production – a foundational stage of the UK seed potato industry – presents distinct structural and biosecurity constraints. Scotland accounts for approximately 75% of Great Britain’s certified seed potato area, positioning it as a cornerstone of the UK seed potato supply chain (Thomson, 2024).The sector contributes substantially to the rural economy and underpins both domestic ware production and export markets. Production operates under stringent certification and plant health regimes, overseen by statutory authorities, to maintain Scotland’s high-health status and minimise the risk of pathogen introduction and spread (Scottish Government, n.d.). Within this tightly regulated context, growers are highly risk-averse to changes that could compromise crop uniformity, traceability or disease status.
Research demonstrates that substrate physical properties are critical determinants of tuber number, size uniformity and overall crop performance in controlled mini-tuber systems (McGrann et al., 2020). Variability in alternative substrates can therefore affect operational reliability in a production model where consistency is paramount. Growers reported concerns regarding handling characteristics and perceived biosecurity risks associated with unfamiliar peat-free media. While definitive evidence linking peat-free substrates to increased pathogen transmission remains limited, recent analysis highlights uncertainty around the provenance, processing and sanitisation of some peat-free constituents, reinforcing caution in high-value seed systems (Litterick et al., 2025). Higher substrate costs and limited downstream market demand for peat-free seed production were also cited as barriers, particularly within a specialised sector with limited leverage over input suppliers.
Propagation represents one of the most technically sensitive stages in peat-free cultivation across multiple crop types. Successful germination and early root development depend on tightly controlled substrate physical properties, including moisture retention, aeration, structural stability and nutrient buffering (Gruda, 2019; Schmilewski, 2008). Evidence from both academic studies and industry trials indicates that variability in peat-free constituents – particularly wood fibre and compost-based materials – can affect water dynamics and nutrient availability during early growth stages, increasing management sensitivity (Koseoglu and Roberts, 2025; Litterick et al., 2025). These challenges are especially pronounced in fine-seeded crops and pressed block systems, where structural cohesion and uniform moisture distribution are critical.
Peat-based plugs and liners remain widely used within UK propagation supply chains, and a substantial proportion of young plants are sourced from overseas production systems that continue to rely on peat-containing media (Office for the Internal Market, 2023). This constrains short-term full substitution at nursery level, even where domestic growers are transitioning. Targeted research into peat-free blocking systems highlights the technical complexity involved: trials in vegetable propagation have demonstrated that achieving sufficient block strength, stability during handling and consistent water distribution requires careful optimisation of fibre composition and processing (Eyre et al., 2022). Practical on-farm evaluations similarly report variability in cohesion and transplant performance in peat-free blocks, reinforcing the need for further refinement (Walker and Litterick, 2024). Ongoing research programmes, including work led by Coventry University (2023) aim to address these structural and performance constraints; however, growers emphasise the need for coordinated commercial-scale trials, clearer regulatory alignment and targeted investment to reduce technical and financial risk.
Evidence of viability in peat-free systems
Although significant technical and structural barriers persist in certain sectors, evidence from both stakeholder experience and published research indicates that peat-free production is already functioning effectively across a range of horticultural systems.
Peer-reviewed studies demonstrate that well-formulated peat-free substrates can achieve plant growth and quality comparable to peat-based media in ornamental and edible crops, provided irrigation and nutrient regimes are appropriately adapted (Gruda, 2019; Maher et al., 2008; Schmilewski, 2008). Recent UK-based trials similarly report satisfactory performance in container-grown systems following refinement of fertilisation and water management practices (Litterick et al., 2025; Royal Horticultural Society, 2024).
Performance outcomes appear to vary by crop type and production duration. Short-cycle crops, including bedding plants, grasses and herbaceous perennials, were widely regarded by stakeholders as comparatively lower-risk during transition, although successful establishment following planting may depend on appropriate irrigation management. Limited growing time in the substrate reduces exposure to longer-term structural degradation or pH drift, and rapid turnover minimises financial risk associated with media experimentation. Substrates incorporating bark or wood fibre typically exhibit higher air-filled porosity and improved drainage relative to peat (Gruda, 2019); for species adapted to well-drained conditions, including alpines and certain Mediterranean-origin plants, growers reported equivalent or improved performance under peat-free regimes.
Beyond agronomic outcomes, several businesses identified reputational and market alignment benefits. Growing public concern regarding peatland degradation and climate impacts has increased scrutiny of peat use in horticulture (Scottish Government, 2023b). Early adoption of peat-free systems was described by some growers as strengthening environmental credentials and supporting brand differentiation.
These findings indicate that transition feasibility is uneven across crop types and production systems. While long-cycle and mechanically intensive systems face greater constraints, many ornamental and short-cycle crops are already being produced successfully without peat. This heterogeneity reinforces the need for proportionate, sector-specific transition strategies.
What might support a successful transition for the horticultural industry in Scotland?
Standards for growing media
Evidence of need: confidence, consistency and risk
Stakeholder engagement, consultation responses and published research identify variability in peat-free growing media as a structural barrier to transition. Across professional horticulture, retail and supply chains, there was broad agreement that legislative restriction alone is unlikely to deliver reliable substitution without strengthened quality assurance (see Appendix T for more detail).
Responses to the “Ending the sale of peat in Scotland” consultation (Scottish Government, 2023b) linked inconsistent crop performance to variability in raw materials, processing standards and quality control; similar concerns were raised in England and Wales (Department for Environment, Food & Rural Affairs, 2022). One growing media organisation reported mortality rates of up to 30% in lime-sensitive species when raised on poorly buffered substrates, illustrating the commercial consequences of inadequate formulation or testing.
Published literature supports these findings. Alternative materials such as wood fibre, composted bark and coir can perform comparably to peat but require careful processing and formulation to ensure consistent physical and chemical properties (Gruda, 2019; Schmilewski, 2008). Variability in particle size distribution, salinity, pH buffering capacity and biological activity is particularly consequential in propagation systems, where tolerance for error is low (Gruda, 2019). Recent UK research has further highlighted calls for clearer national sanitisation standards and routine pathogen testing within a formal quality framework (Litterick et al., 2025).
While PAS 100 provides quality benchmarks for composted materials (Waste and Resources Action Programme, 2016), no harmonised UK-wide standard governs the full range of peat-free constituents or finished-product performance.
Sector specific requirements
Although support for strengthened standards was consistent, stakeholder requirements vary according to crop sensitivity, production system and biosecurity exposure. Table 6 summarises sector-specific risk profiles and corresponding standardisation needs.
Table 6: Sector-specific standardisation requirements to support peat-free transition
Sector/system
Primary risks
What is going wrong?
What kind of standard would help?
Professional growers (all)
Reduced efficiency and increased production risk
Inconsistent crop performance, machinery compatibility issues, greater sensitivity to irrigation and nutrient management.
Clear minimum performance standards for finished growing media (e.g. physical structure, stability, nutrient buffering and water-holding capacity).
Defined processing standards, contamination limits, input traceability requirements.
Plant retailers
Customer complaints and loss of trust leading to loss of income
Inconsistent product performance and differences between retail and professional grades.
Clear labelling and certification to distinguish tested, quality-assured products.
Ericaceous crops
Crop failure over long growing cycles
pH drift and nutrient instability affecting plant health over time.
Crop-specific performance thresholds (pH buffering capacity and low-salinity limits).
Potato mini-tuber systems
Biosecurity and yield loss
Uncertainty over pathogen status and inconsistent moisture retention affecting tuber development.
Mandatory sanitisation and pathogen testing, alongside defined water-holding performance benchmarks.
Propagation (seed systems)
Poor germination and early losses
Rapid surface drying and uneven moisture in fine-seeded trays.
Defined moisture retention and particle size standards for propagation media.
Plug plant supply chains
Limited control over substrate used in young plants
Many plugs are sourced from external or overseas propagators using peat-based media, with restricted choice due to licensing and supply arrangements.
Traceability and disclosure requirements for plug media composition, alongside incentives for peat-free propagation capacity.
Pressed growing block systems
Incompatibility with mechanised production systems
Peat-free blocks may lack strength and moisture stability for reliable mechanical transplanting, requiring more frequent irrigation and increasing nutrient loss.
Defined performance standards for block strength, cohesion and moisture retention under mechanised handling conditions.
Ornamental nurseries emphasised reliability in propagation and plug production. As one large tree and shrub nursery stated, “One bad load of compost can set you back a season – if the roots don’t take, you’ve lost that crop window.” Participants called for defined thresholds relating to particle size distribution, structural stability and microbiological status.
Soft fruit producers, many of whom have adopted coir-based systems, expressed concern regarding variability in buffering and salinity management. “Coir works for us, but only if it’s treated right,” noted one grower. Standards ensuring consistent processing and transparent sourcing were viewed as essential.
Potato mini-tuber systems adopted a more precautionary position, emphasising biosecurity and sterility as non-negotiable. Stakeholders questioned whether a single generic standard would adequately reflect pathogen sensitivity thresholds in high-risk systems.
Growing media manufacturers advocated segmentation between amateur and professional markets, reflecting tighter performance tolerances in commercial propagation and mechanised systems.
These perspectives indicate that any standards framework must accommodate differentiated performance thresholds rather than assume uniform risk tolerance across sectors.
Implementation models and pathways
Stakeholders identified both international reference models and emerging UK initiatives that could inform implementation. Several participants pointed to the Dutch RHP certification scheme as an example of structured quality assurance. RHP certifies raw materials and finished growing media products against defined and regularly updated quality standards covering physical, chemical and biological parameterrs – including water uptake, air content, pH, electrical conductivity and nutrient status – applied across the production chain. Stakeholders emphasised that the scheme’s value lies in its combination of technical thresholds, traceability and independent verification. As one ornamental grower observed, certification provides “a baseline – if it’s certified, you know what you’re working with.”
Workshop discussions outlined practical components of a potential UK-aligned pathway:
Establish defined parameter bands for key constituents and finished products, including contaminant and microbiological thresholds.
Require batch-level testing and documented growth trials, subject to third-party audit.
Differentiate standards between amateur and professional markets.
Introduce a recognisable certification mark linked to transparent compliance criteria.
Implement structured monitoring to assess the impact of standards on peat reduction rates.
Industry coordination is advancing. The regrouped Growing Media Association has initiated development of a PAS-style specification drawing on PAS 100 and PAS 110 (HortWeek, 2025a). According to stakeholders, the draft includes chemical, physical and microbiological testing parameters, defined target ranges and documented growth testing, with independent audit and corrective timelines.
Governance implications
Interview evidence indicates that stakeholder confidence is closely linked to the credibility and coordination of any standards framework. Voluntary guidance alone was widely viewed as insufficient; independent oversight and transparent verification were considered central to supporting trust in peat-free media.
Participants stressed the importance of UK-wide alignment to avoid market fragmentation, while ensuring Scottish priorities are reflected in emerging PAS-style developments. Structured knowledge exchange – including dissemination of certified product data and crop-specific guidance for high-risk systems – was identified as an important complementary measure.
Overall, stakeholder evidence suggests that effective standards will depend not only on technical specification, but on governance clarity, coordination across administrations and credible independent verification. Standards were therefore framed as an enabling mechanism within the wider peat-free transition, rather than an end point in themselves.
Growing trials
In this context, a horticultural growing trial refers to a structured comparison of alternative growing media under commercial production conditions, typically assessing crop performance, physical and chemical substrate properties, and operational compatibility over defined crop cycles.
National trial activity and capacity constraints
Evidence from stakeholder engagement and national initiatives indicates broad recognition that structured trials are essential to reducing technical risk in peat-free transition. However, commercial growers reported significant constraints in conducting robust trials independently, citing limitations in time, staffing and data-logging capacity. Several interviewees described running meaningful comparative trials as “almost a full-time job,” noting reliance on in-house agronomy rather than external research support.
The need for structured trial support has been shaped in part by the long-standing policy trajectory toward peat reduction. In 2011, the UK Government set a voluntary target to phase out peat use in professional horticulture by 2030 (HM Government, 2011). Stakeholders emphasised that pursuing this transition without coordinated trial programmes increases commercial exposure. Participants expressed willingness to trial alternative media where external agronomic expertise, supervision and data analysis were available, highlighting the importance of partnership models rather than isolated experimentation.
Views differed regarding optimal trial design. Some growers favoured on-site trials, arguing that microclimatic conditions, irrigation systems and machinery compatibility are highly site-specific. Others supported centralised research-led trials, citing benefits such as biosecurity control and methodological consistency. Across sectors, however, there was agreement that trials must be conducted at commercially meaningful scale; small-plot experiments were widely considered insufficient to influence decision-making.
Several UK initiatives provide relevant models. The AHDB-ADAS CP138 project combined predictive modelling with on-site grower demonstrations, identifying both opportunities and constraints in peat substitution (Agriculture and Horticulture Development Board, 2019). More recently, the Royal Horticultural Society’s Transition to Peat-Free Fellowship (launched in 2022) represents the largest coordinated UK trial programme to date. The five-year project partners the RHS, Defra and commercial media suppliers with multiple nurseries to test peat-free formulations across diverse crop groups, including ericaceous and other traditionally sensitive plants. Interim findings indicate that peat-free media can perform comparably to peat under standard irrigation regimes in several nursery settings, with final results expected in 2027 (Royal Horticultural Society, 2024; n.d.).
Priority crops and technical evidence gaps
Stakeholder engagement identified specific crop categories where technical uncertainty remains high and where targeted, crop-specific trials were viewed as a priority.
Ericaceous ornamentals (including rhododendrons, azaleas and heathers) were frequently cited. While short-term trials have demonstrated encouraging performance in peat-free systems (HortWeek, 2025d), growers expressed uncertainty regarding long-term pH stability and nutrient buffering over extended production cycles.
Propagation systems emerged as a consistent priority. Stakeholders emphasised the need for focused trials on plug plants and growing blocks, where physical cohesion and moisture stability are critical to mechanical transplanting and uniform root development. As one specialist noted, peat substitutes must be sufficiently cohesive to support blocking systems without crumbling during handling.
Potato mini-tuber production, however, was identified as a distinct and higher-risk category requiring targeted investigation. Given Scotland’s central role in certified seed potato production and the sector’s stringent biosecurity and traceability requirements, growers described substrate reliability and pathogen control as non-negotiable. Research demonstrates that substrate physical properties directly influence tuber number, size uniformity and crop performance in controlled systems (McGrann et al., 2020). Stakeholders therefore emphasised the need for dedicated commercial-scale trials to evaluate peat-free media under certified mini-tuber production conditions.
Several niche crops adapted to Scottish conditions – including short-lived perennials such as Meconopsis – were also flagged as requiring bespoke trial design, particularly where moisture sensitivity is pronounced. More broadly, stakeholders emphasised that priority should be given to crop systems that remain dependent on specific physical and chemical properties traditionally provided by peat. Ongoing national initiatives are testing a number of these sensitive groups, including carnivorous plants.
Support mechanisms and coordination considerations
Stakeholder engagement highlighted that future Scottish trial activity should build on existing UK initiatives rather than duplicate them. Several participants suggested formal Scottish participation within established programmes – for example, extending the Royal Horticultural Society’s peat-free trial network to include Scottish-coordinated sites – to ensure representation of local climatic and production conditions.
Interviewees emphasised that trial participation requires structured support. Suggested mechanisms included financial assistance for host nurseries, provision of agronomic expertise to design and monitor experiments, and training in data collection and analysis. Some growers proposed a “trial facilitator” model, whereby an industry-funded agronomist supports multiple nurseries with experimental setup and data logging, reducing individual administrative burden.
Clear dissemination of findings was repeatedly identified as essential. While national initiatives have produced reports and resources, stakeholders expressed concern that results are not always easily comparable across crop types and systems. Participants suggested that a coordinated Scottish knowledge platform could consolidate certified trial data, case studies and technical guidance.
Key stakeholder-identified actions include:
Embed commercial-scale trials within existing UK frameworks, ensuring Scottish sites are included where relevant to capture regional conditions.
Provide technical and financial support for host nurseries, including access to agronomic expertise and structured data collection.
Prioritise crop systems identified as high risk, including ericaceous species, propagation and potato mini-tubers.
Facilitate peer-to-peer learning, through field demonstrations, workshops and structured mentoring between early adopters and other growers.
Across interviews, stakeholders characterised the current constraint less as unwillingness to transition, and more as residual uncertainty in specific systems. Structured, collaborative trials were viewed as mechanisms to generate transferable evidence under commercial conditions. Trial outcomes were also viewed as providing an empirical foundation for the refinement of future growing media standards.
Enabling conditions for industry transition
While standards (Section 7.1) and structured trials (Section 7.2) address technical uncertainty and product consistency, stakeholder engagement identified a broader set of enabling conditions that influence the pace and stability of peat-free transition. These relate to financial exposure, feedstock availability, regulatory frameworks and knowledge infrastructure. Progress in these areas was viewed as necessary to enable sustained commercial uptake.
Financial and infrastructure considerations
Stakeholders emphasised that transition carries both capital and operational cost implications. Survey evidence from UK growers suggests that fully peat-free growing media may cost approximately 15-25% more per cubic metre than peat-reduced alternatives (Royal Horticultural Society, 2023), although reported differentials vary by crop type and contract structure. Additional costs may arise from equipment modification, irrigation adjustments, storage infrastructure and staff training. Several participants indicated that targeted, time-limited financial mechanisms – including capital grants, transitional funding or co-funded research participation – could reduce early-adopter risk in sectors operating under tight margins (Royal Horticultural Society, 2023). These suggestions were framed as short-term adjustment support during market transition rather than long-term subsidy dependence.
Feedstock competition was identified as a structural consideration. Participants noted increasing demand for wood-based materials across sectors, particularly between growing media manufacturers and biomass energy producers. Formal analysis of peat-policy impacts has similarly reported cross-sector competition for wood residues used in biomass fuel production (Office for the Internal Market, 2023). UK biomass market data indicate that the country is a major importer and consumer of wood pellets for electricity and renewable heat generation (Department for Energy Security and Net Zero, 2023), indicating that demand from the energy sector may influence the availability and pricing of wood residues and by-products used in peat-free growing media formulations.
Regulatory and supply chain constraints
Access to suitable alternative feedstocks is influenced by waste classification systems, contamination thresholds and approval processes. Stakeholders reported that regulatory complexity can delay or deter the use of secondary materials, including anaerobic digestate and recycled wood products, limiting domestic diversification of inputs.
In parallel, concerns were raised regarding contamination in green waste streams, particularly where contractual clauses permit low levels of non-organic material. Variability in compost quality affects manufacturer confidence and restricts its suitability for sensitive applications. Stakeholders suggested that clearer guidance, proportionate review of waste classifications and strengthened enforcement of contamination standards could improve supply reliability, subject to environmental safeguards.
These issues highlight that peat-free transition is not solely a matter of product reformulation, but also of regulatory coherence and supply chain infrastructure.
Limited long-term, Scotland-specific performance data across diverse crop systems.
Incomplete quantification of transition costs across different production scales.
Insufficient applied guidance on irrigation, fertiliser regimes and storage management for peat-free media.
Uneven access to structured training and peer-to-peer knowledge exchange.
While research is ongoing at UK level, participants emphasised the importance of accessible, crop-specific best-practice guidance and coordinated dissemination mechanisms. Structured knowledge exchange was viewed as complementary to standards and trials, enabling technical learning to translate into operational confidence.
Coordination and policy coherence
Across interviews and survey evidence, stakeholders framed peat-free transition as a system-level adjustment rather than a single technical substitution. Standards, trials, feedstock supply, infrastructure investment and training were described as interdependent components of a stable transition pathway.
Effective coordination across administrations and sectors was therefore viewed as important not only for regulatory clarity, but for maintaining supply-chain confidence and market competitiveness during adjustment. Stakeholders did not characterise the primary constraint as unwillingness to transition, but rather as exposure to uneven implementation conditions across crops and supply chains.
In this context, government’s role was framed as enabling coherence across these domains – ensuring that technical progress, market signals and regulatory frameworks operate in alignment. Stakeholders therefore characterised successful transition not as a question of technical feasibility, but of coordinated implementation across the wider horticultural system.
Feasibility and sequencing of transition in Scotland
The evidence presented in Sections 5-7 shows that peat-free growing media are already working in parts of Scottish horticulture. Many ornamental crops, short-cycle plants and some forestry systems are being produced successfully in peat-free or significantly peat-reduced substrates. However, full removal of peat across all sectors will take time and will not progress at the same pace in every crop group. Feasibility is therefore not a single question. It depends on three main factors:
Time needed for manufacturers to expand reliable supply of alternatives.
Time needed for growers to test and validate new mixes under commercial conditions.
Degree of policy alignment across the UK.
Taken together, these factors suggest that transition is achievable, but that sequencing and coordination will be critical.
Infrastructure and validation lead time
Media manufacturers require time to increase processing capacity for key materials such as wood fibre and composted bark. Installing new refiners, dryers and screening equipment can take two to three years. Expanding production of high-quality compost with consistently low contamination may take three to five years, particularly where additional quality controls are needed. Emerging materials, such as farmed Sphagnum, are likely to require longer development periods before they can contribute at commercial scale (c.5-10 years).
Growers also need time. Most businesses test new growing media over several seasons before adopting them fully. This reflects biological cycles rather than reluctance to change. Crops must be assessed for germination, root development, growth rate, yield and long-term health. For short-cycle ornamental crops, two to three growing seasons may be sufficient. For longer-cycle crops such as shrubs, trees, blueberries and some fruit crops, growers commonly require five years or more to confirm reliable performance.
High-biosecurity systems, particularly potato mini-tuber production, present the longest adaptation horizon. These systems operate under strict certification requirements and low tolerance for variation in substrate performance. Growers reported that multi-year validation would be essential before complete peat removal could be considered. In these sectors, shorter timelines were viewed as commercially high risk.
These lead times are therefore driven by infrastructure investment cycles and biological validation requirements, rather than by lack of technical potential.
Variation across crop systems
The transition does not affect all sectors equally. Retail growing media is already largely peat-free, and many ornamental producers have significantly reduced peat use. In the soft fruit sector, most Scottish berry production (with the exception of blueberries) is already peat-free, typically using coir-based systems. This shows that peat-free production can work at commercial scale. However, coir is imported and associated with transport emissions and wider environmental impacts. It is a functional alternative to peat, but not an environmentally neutral one.
In contrast, ericaceous crops, blueberries and other acid-demanding species remain more dependent on peat due to pH stability and nutrient-buffering requirements. While peat-free systems are being trialled, long-term performance under commercial conditions requires further validation.
Propagation systems, including plugs and pressed growing blocks also present technical sensitivity. These systems depend on precise moisture retention, particle size and structural cohesion. Although progress is being made, growers emphasised the need for continued trialling and refinement.
This unevenness suggests that a single, uniform timetable may not reflect sector realities. A phased approach that recognises crop-specific constraints would better align with the evidence presented in earlier sections.
UK alignment and competitive considerations
Several stakeholders raised concerns about moving significantly ahead of the rest of the UK. If peat-grown plants or peat-based growing media remain available in other nations, Scottish producers could face higher production costs while competing in shared markets. In addition, young plants and plugs are often sourced from outside Scotland, and in some cases from overseas production systems that continue to use peat. Without UK-wide alignment, full removal of peat at nursery level may be constrained by upstream supply chains. These issues do not undermine the case for transition. However, they highlight the importance of policy coordination and clarity to avoid unintended competitive disadvantage or carbon displacement.
Indicative phasing
Based on stakeholder evidence and the technical analysis presented earlier in this report, a broadly phased pattern of transition can be identified:
Retail and amateur markets are closest to full peat removal.
Mainstream professional crops, including many ornamentals and forestry plants, are capable of substantial further reduction in the medium term, subject to continued infrastructure expansion and trial validation.
High-sensitivity systems, including potato mini-tubers, certain propagation systems and ericaceous crops, are likely to require longer validation periods before complete peat substitution is commercially secure.
These phases are indicative rather than prescriptive. The precise pace of change will depend on infrastructure investment, research outcomes, standards development and UK policy alignment.
Indicative time horizons by sector
Stakeholder evidence provides a clearer picture of the likely time required for different parts of the industry to transition fully away from peat. Figure 4 illustrates how these sector-specific timelines translate into indicative transition windows from 2026 onwards. These estimates reflect infrastructure lead times, crop testing cycles and normal equipment replacement schedules. They are indicative and based on reported industry experience rather than fixed commitments.
Growing media manufacturers
Manufacturers highlighted that expansion of domestic processing capacity cannot occur immediately. The following timelines reflect capital investment cycles and regulatory approval processes. They relate only to those materials for which stakeholders provided specific evidence on infrastructure lead times during engagement. Not all alternative materials assessed elsewhere in this report were discussed in comparable detail in relation to scaling timelines.
Wood fibre and composted bark: typically 2-3 years to install additional refining, drying and screening equipment. Availability of horticultural-grade fine bark remains a constraint.
Composted green waste: 3-5 years to establish consistently low-contamination, PAS-100 compliant production lines at scale.
Digestate-derived materials: 3-4 years of further research, pilot work and process refinement to manage ammonium levels and ensure consistent product quality.
Coir: supply chains are established but remain import-dependent and subject to quality variability.
Farmed Sphagnum: stakeholders suggested 5-10 years before commercial-scale volumes could realistically be available in Scotland, subject to cost, sterilisation and land-use considerations.
Grower sub-sectors
Time needed for adoption varies significantly by crop type and production system.
Retail and amateur markets: largely peat-free already; remaining transition expected within 1-2 years based on current trends.
Ornamental growers: small growers reported that 2-3 growing seasons may suffice. Larger operations anticipate 5-10 years where machinery modification or infrastructure redesign is required.
Tree growers for forestry and woodland: smaller producers indicated rapid adaptation is possible if suitable substrates are available; larger nurseries suggested 3–5 years to trial mixes under site-specific conditions.
Fruit and vegetable growers: Strawberries and raspberries are largely peat-free already (coir-based systems). Blueberries and other longer-cycle fruit crops require extended validation, often beyond 5 years. Vegetable growers commonly cited around 5 years as a realistic planning horizon, subject to secure material supply.
Potato mini-tuber growers: the most cautious sector. Stakeholders suggested that full conversion of facilities could require up to 10 years, reflecting biosecurity requirements, multi-season validation and certification constraints.
Ericaceous crops: stakeholders indicated that longer timelines are likely, potentially within the 5–10 year horizon identified for high-sensitivity systems, reflecting ongoing challenges in achieving stable low-pH, peat-free systems at scale.
Overall pattern
Taken together, stakeholder evidence suggests a broadly phased trajectory beginning around 2026:
Short term (1-2 years): Retail markets and low-risk systems complete transition.
Medium term (3-5 years): Mainstream professional crops achieve substantial reduction, supported by expanded processing capacity and validated blends.
Longer term (5-10 years): High-sensitivity and high-biosecurity systems transition once multi-year evidence confirms performance and reliability.
These time horizons are contingent on infrastructure expansion, standards development, coordinated trials and UK policy alignment. Timeframes are indicative and assume transition commencing in 2026.
Figure 4: Indicative stakeholder-informed timelines for peat-free transition across grower sub-sectors. Teal bars indicate the earliest feasible transition window reported by stakeholders. Grey extensions show potential additional time required where technical or infrastructure constraints persist. Timelines are illustrative planning horizons rather than forecasts of when peat use will cease.
Conditions for effective transition
Across all sectors, stakeholders consistently emphasised that successful transition depends on coordinated implementation rather than isolated action.
Key enabling conditions include:
Clear and consistent quality standards for peat-free media;
Access to technical guidance and workforce training;
Clarity and alignment of policy across the UK.
Where these conditions are in place, evidence suggests that peat-free production can operate effectively. Where they are absent, technical uncertainty and commercial risk increase.
Overall, the feasibility of transition in Scotland is therefore best understood as a question of sequencing and coordination rather than of technical possibility. The industry has demonstrated willingness to adapt. The remaining challenge lies in aligning infrastructure, standards, research and policy to support consistent and economically stable implementation.
Conclusions
This research examined the technical, environmental, social and economic evidence on alternatives to horticultural peat in Scotlandthrough a literature review, workshops and 46 stakeholder interviews.
No single material fully replicates peat, which has a unique mix of physical, chemical and biological properties. However, stakeholder evidence consistently shows that well formulated blends – notably those based on wood fibre, composted bark and coir – already support commercial production, while others show strong development potential.
Some types of growing, particularly soft fruit production, rely on imported materials. This increases transport emissions and can create supply-chain risks, which may affect long-term environmental and economic resilience. The main challenge is therefore not a lack of alternatives, but ensuring consistent performance through effective blending of materials, suitable infrastructure, clear quality standards and adapted crop management. Across the UK, the supply of leading alternatives exceeds remaining peat use. Wood fibre alone could replace current peat use. However, a reliable supply depends on having enough processing capacity, clear grading standards and the ability to manage competition from other sectors for raw materials, as well as effective transport systems. Supply therefore depends less on whether raw materials exist, and more on investment, quality control, and coordination across the market. In the longer term, Scotland could improve environmental performance and strengthen supply security by reducing its reliance on imported materials.Different parts of the sector can move away from peat at different speeds. Retail growing media and many ornamental growers have made substantial progress in reducing peat use. Soft fruit growers operate successfully using coir-based systems for most crops, with the exception of blueberries. In contrast, some systems are more difficult to change, including ericaceous (acid-loving) crops, potato mini-tubers, and certain propagation systems. These systems face distinct challenges. Potato mini-tuber production operates under strict biosecurity (plant health) and certification requirements. Ericaceous crops require stable low-pH conditions across growing cycles. Propagation systems depend on highly controlled moisture balance and media structure during early growth stages. These differences reflect that the transition involves adapting production systems, not simply replacing one material with another. Stakeholders did not indicate resistance to change, but highlighted commercial risks where performance is uncertain.
The success of a peat-free transition depends on careful planning and realistic timing. It takes time to develop infrastructure– typically 2-5 years for core materials and longer for emerging alternatives such as farmed Sphagnum. Crop production cycles and the need to test over several seasons can take additional time – up to 5–10 years for large or sensitive systems. A single timeline for the whole sector would not reflect these differences, so a phased approach based on evidence and experience is more practical.
Overall, the evidence indicates that Scotland can move to peat-free growing. The speed of change will depend not on technical limits but on strong coordination, clear policy direction and building confidence through standards and collaboration. With the right planning, investment and alignment across the sector, Scotland can phase out peat while maintaining production and a reliable supply. The transition also offers an opportunity to protect peatlands, strengthen local recycling and reuse of materials, and support a more resilient and sustainable horticulture sector.
Next Steps
Stakeholder feedback highlights several key factors that will affect the pace and success of a peat-free transition across the Scottish horticulture sector.Clear transition planning: The sector requires a phased transition timeline based on evidence. Different parts of the industry need different amounts of time to adapt. Policy coherence across UK administrations would help reduce competitive distortion and investment uncertainty.
Domestic processing capacity: The UK needs more investment in facilities to process alternative materials, including bark grading, compost quality assurance, and blending infrastructure. Increasing domestic capacity may help ensure steady supply and reduce price volatility.
Quality assurance and biosecurity standards: The UK could develop consistent frameworks for peat-free growing media, similar to PAS 100 – the UK quality standard for compost. Frameworks should cover how materials are processed, limits on contaminants, tracking of sources, and plant-health safeguards. Clear standards could improve consistency and build trust among growers.
Coordinated commercial-scale trials: The industry requires multi-season trials to test peat-free materials in high-sensitivity sectors such as ericaceous crops, propagation systems and potato mini-tuber production. This will help generate reliable evidence of performance.
Market signals and procurement: Stronger demand signals will encourage businesses to invest. This could include public-sector procurement and sustainability-linked sourcing approaches. Visible, long-term demand could help companies plan and expand production.
Technical guidance and workforce support: Growers would benefit from better access to training and practical advice. This includes support on adapting irrigation, nutrition, and handling techniques suited to peat-free systems.
References
Abad, M., Fornes, F., Carrión, C., and Noguera, V. (2005) Physical Properties of Various Coconut Coir Dusts Compared to Peat, HortScience, 40(7), DOI: 10.21273/HORTSCI.40.7.2138
Anbarasu, M., Gurusamy, A., and Saravanan, S. (2024) Properties of different graded coir pith by Keen-Raczkowski box and Brunauer-Emmett-Teller analysis, Journal of Environmental Biology, 45(3), pp. 357-362.
Ahmad, M., Upamali Rajapaksha, A., Lim, J.E., Zhang, M., Bolan, N., Mohan, D., Vithanage, M., Lee, S.S., Sik Ok, Y. (2014) Biochar as a sorbent for contaminant management in soil and water: A review, Chemosphere, 99, pp. 19-33.
Alexander, P.D., Bragg, N.C., Meade, R., Padelopoulos, G. and Watts, O. (2008) Peat in horticulture and conservation: the UK response to a changing world, Mires and Peat, 3, article 8. DOI: 10.19189/001c.128260.
Alburquerque, J.A., de la Fuente, C., Ferrer-Costa, A., Carrasco, L., Cegarra, J., Abad, M. and Bernal, M.P. (2012) Assessment of the fertiliser potential of digestates from farm and agroindustrial residues, Biomass and Bioenergy, 40, pp. 181-189.
Ali, S.N., Aziz, A.A., Kasim, N.N., Tajuddin, S.A., Omar, N.F., and Nasirun, N. (2023) Assessing the effect of biochar addition in growing medium on plant growth performance of Bok Choy (Brassica rappa subsp. Chinensis) using sustainable soilless agriculture system, International Journal of Innovation and Industrial Revolution, 5(13), pp. 104-118.
Amaducci, S., Scordia, D., Liu, F.H., Zhang, Q., Guo, H., Testa, G. and Cosentino, S.L. (2015) Key cultivation techniques for hemp in Europe and China, Industrial Crops and Products, 68, pp. 2–16.
Baran, A., Tarnawski, M. and Urbaniak, M (2019) As assessment of bottom sediment as a source of plant nutrients and an agent for improving soil properties, Environmental Engineering and Management Journal, 18 (8), pp. 1647-1656.
Barrett, G.E., Alexander, P.D., Robinson, J.S. and Bragg, N.C. (2016) Achieving environmentally sustainable growing media for soilless plant cultivation – A review, Scientia Horticulturae, 212, pp. 220-234.
Benavent-Celma, C., McLaggan, D., van West, P., and Woodward, S. (2023) Survival of Phytophthora cryptogea and Phytophthora cactorum in Commercial Potting Substrates for Eucalyptus globulus Plants, Agriculture, 13(3), 581. DOI: https://doi.org/10.3390/agriculture13030581
Beretta, D. and Ripamonti, M. (2021) Evaluation of wood fibre as component of substrates for container nursery crops, Acta Horticulturae, 1305, pp. 77-82.
Blok, C., Eveleens, B. and van Winkel, A. (2021) Growing media for food and quality of life in the period 2020–2050, Acta Horticulturae, 1305, pp. 341-355.
Bragg, N. and Alexander, P. (2019) A review of the challenges facing horticultural researchers as they move toward sustainable growing media, Acta Horticulturae, 1266, pp. 7-14.
Caballero Mejia, C.C., Brand, M.H. and Lubell-Brand, J.D. (2025) Hemp hurd fiber as a substitute for peat in container production of petunia and geranium, HortScience, 60(8), pp. 1251-1259.
Carlile, W.R., Cattivello, C. and Zaccheo, P. (2015) Organic growing media: constituents and properties, Vadose Zone Journal, 14(6), pp. 1-13.
Carus, M. (2017) The European Hemp Industry: Cultivation, processing and applications for fibres, shivs, seeds and flowers, European Industrial Hemp Association. Available at: https://eiha.org/media/2017/12/17-03_European_Hemp_Industry.pdf (Accessed: 24 January 2026).
Calisti, R., Regni, L., Pezzolla, D., Cucina, M., Gigliotti, G., and Proietti, P. (2023) Evaluating Compost from Digestate as a Peat Substitute in Nursery for Olive and Hazelnut Trees, Sustainability, 15(1), 282. DOI: https://www.mdpi.com/2071-1050/15/1/282?
Chambers, J. (1996) Peat for purists, The Horticulturist, 5(3), pp. 11-12.
Chen, J., Jin, C., Sun, S., Yang, D., He, Y., Gan, P., Gerald Nalume, W., Ma, Y., He, W. and Li, G. (2023) Recognising the challenges of composting: critical strategies for control, recycling, and valorisation of nitrogen loss, Resources, Conservation and Recycling, 198, 107172. DOI: https://doi.org/10.1016/j.resconrec.2023.107172 (Accessed: 16 February 2026).
Chrysargyris, A., Tzortzakis, N., Prasad, M. and Menexes, G. (2020) Biochar type, ratio and nutrient levels in growing media affect seedling production and plant performance, Agronomy, 10(9), 1421. DOI: 10.3390/agronomy10091421
Dahlin, J., Beuthner, C., Halbherr, V., Kurz, P., Nelles, M. and Herbes, C. (2019) Sustainable compost and potting soil marketing: private gardener preferences, Journal of Cleaner Production, 208, pp. 1603-1612.
da Silva Alves, L., Tolardo, G., Caitano, C.E.C., Vieira Júnior, W.G., Gomes Freitas, P.N. and Cunha Zied, D. (2024) Use of spent mushroom substrate for cherry tomato seedlings; a potential alternative to peat in horticulture, Biological Agriculture & Horticulture, 40(2), pp. 127-140.
Dias, G.C., Machado, R.M., Alves-Pereira, I., Ferreira, R.A. and Gruda, N.S. (2025) Potential of Pine Bark to Replace Perlite in Coir-Based Substrates: Effects on Nutrient Uptake, Growth and Phytochemicals in Lettuce Under Two Salinity Levels, Plants, 14(16), 2577. DOI: 10.3390/plants14162577
Domeño, I., Irigoyen, I. and Muro, J. (2009) Evolution of organic matter and drainages in wood fibre and coconut fibre substrates, Scientia Horticulturae, 122(2) pp. 269-274.
Evans, M.R., Konduru, S. and Stamps, R.H. (1996) Source variation in physical and chemical properties of coconut coir dust, HortScience, 31, pp. 965-967.
Ferrans, L., Schmieder, F., Mugwira, R., Marques, M. and Hogland, W. (2022) Dredged sediments as a plant-growing substrate: estimation of health risk index, Science of the Total Environment, 846, 157463. DOI: https://doi.org/10.1016/j.scitotenv.2022.157463
Fielding,D., Pakeman, R.J., Newey, S., and Smith, S.W. (2025) The impact of moorland cutting and prescribed burning on early changes in above-ground carbon stocks, plant litter decomposition and soil properties, British Ecological Society: Ecological Solutions and Evidence, 6(3), 70112. DOI: https://doi.org/10.1002/2688-8319.70112.
Fratini, C., Anselmi, S., and Renzi, M. (2025) Dredge Sediment as an Opportunity: A Comprehensive and Updated Review of Beneficial Uses in Marine, River, and Lagoon Eco-Systems, Environments, 12(6), 200. DOI: https://doi.org/10.3390/environments12060200
Frederickson-Matika, D., Schiffer-Forsyth, K., Hedley, P.E., Cock, P.J.A. and Green, S. (2024) Detection of oomycete pathogens in UK peat-free growing media and implications for plant health, Journal of Horticultural Science and Biotechnology, 100(2), pp. 272-283.
Gabryś, T. and Fryczkowska, B. (2022) Using Sheep’s Wool as an Additive to the Growing Medium and its Impact on Plant Development on the Example of Chlorophytum comosum, Journal of Ecological Engineering, 23(6), pp. 205-212.
Gardner, M., Reed, S., and Davidson, M. (2020) Assessment of Worker Exposure to Occupational Organic Dust in a Hemp Processing Facility, Annals of Work Exposures and Health, 64(7), pp. 745-753.
Ganesan, K., Rajagopal, K., and Thangavel, R. (2008) Rice husk ash blended cement: Assessment of optimal level of replacement for strength and permeability properties of concrete, Construction and Building Materials, 22(8), pp. 1675-1683.
Gaudig, G., Fengler, F., Krebs, M., Prager, A., Schulz, J., Wichmann, S., & Joosten, H. (2014) Sphagnum Farming in Germany – a Review of Progress, Mires and Peat, 13, 08. DOI: https://doi.org/10.19189/001c.129422
Gaudig, G., Krebs, M., Prager, A., and Wichmann, S. (2017) Sphagnum farming From Species Selection to the Production of Growing Media: A Review, Mires and Peat, 20, Article 13. DOI: https://doi.org/10.19189/MaP.2018.OMB.340
Gitea, M.A., Borza, I.M., Domuta, C.G., Gitea, D., Rosan, C.A., Vicas, S.I. and Pasca, M.B. (2024) A Sustainable Approach Based on Sheep Wool Mulch and soil Conditioner for Prunus domestica (Stanley Variety) Trees Aimed at Increasing Fruit Quality and Productivity in Drought Conditions, Sustainability, 16(17), 7287. DOI: https://doi.org/10.3390/su16177287
Godwin, R.J., White, D.R., Dickin, E.T., Kaczorowska-Dolowy, M., Millington, W.A., Pope, E.K. and Misiewicz, P.A. (2022) The effects of traffic management systems on the yield and economics of crops grown in deep, shallow and zero tilled sandy loam soil over eight years, Soil and Tillage Research, 223, 105465. DOI: https://doi.org/10.1016/j.still.2022.105465
Growing Kent and Medway (2025) Mushroom Crop Waste and Valorisation: The potential of mushrooms by-products for a biobased circular economy. Available at: https://www.growingkentandmedway.com/reports/ (Accessed: 31 January 2026).
Gruda, N. and Schnitzler, W.H. (2004) Suitability of wood fiber substrate for production of vegetable transplants: I. Physical properties of wood fiber substrates, Scientia Horticulturae, 100 (1-4), pp. 309-322.
Gruda, N.S. (2019) Increasing sustainability of growing media constituents, Agronomy, 9(6), 298. DOI: 0.3390/agronomy9060298
Gruda, N. and Bragg, N. (2020) Developments in alternative organic materials for growing media in soilless culture systems, in Gruda, N.S. (ed.) Advances in horticultural soilless culture. London: Burleigh Dodds/Taylor & Francis.
Gwenzi, W. (2025) Potential environmental and human health risks of biochar systems: a call for comprehensive health risk assessments, Biochar for Environmental Remediation, pp. 433-445.
Habeeb, G.A., and Mahmud, H. (2010) Study on properties of rice husk ash and its use as cement replacement material, Materials Research, 13(2), pp. 185-190.
Hashemi, F., Mogensen, L., van der Werf, H.M., Cederberg, C. and Knudsen, M.T. (2024) Organic food has lower environmental impacts per area unit and similar climate impacts per mass unit compared to conventional, Communications Earth & Environment, 5, 250. DOI: https://doi.org/10.1038/s43247-024-01415-6
Herfort, S., Pflanz, K., Larsen, M-S., Mertscgun, T. and Grüneberg, H. (2023) Influence of Sheep’s Wool Vegetation Mats on the Plant Growth of Perennials, Horticulturae, 9(3), 384. DOI: https://doi.org/10.3390/horticulturae9030384
Hill, J. (2022) Wool you look at that? Sheep wool pellets as fertilizer in container-grown crops. MSc thesis, Swedish University of Agricultural Sciences. Available at: https://stud.epsilon.slu.se/17669/3/hill-j-20220413.pdf (Accessed: 8 October 2025).
Hirschler, O. and Osterburg, B. (2025) Achieving peat-free hobby gardening for climate mitigation in Germany: Insights into prices of growing media constituents, potting soils and policy options, Resources, Conservation and Recycling, 220, 108330. DOI: https://doi.org/10.1016/j.resconrec.2025.108330
Horticultural Trades Association (2022a) Growing Media Monitor Report: Trends in the composition of UK growing media supplied 2011-2022. Available at: https://hta.org.uk/growingmediamonitor (Accessed: 9 October 2025).
Hospido, A., Carballa, M., Moreira, M., Omil, F., Lema, J.M. and Feijoo, G. (2010) Environmental assessment of anaerobically digested sludge reuse in agriculture: potential impacts of emerging micropollutants, Water Research, 44(10), pp. 3225–3233.
Hossain, M.T., Zaman, M., Sakib, S., and Ikhtiar Mahmud, S.M. (2024) Hazard Assessment of Rice Husk Ash Generated from Rice Mills in Bangladesh and Way Forward to Overcome or Adopt the Hazards, IOP Science, 1305, 012016. DOI: 10.1088/1757-899X/1305/1/012016
International Renewable Energy Agency (2024) Renewable Energy and Jobs Annual Review 2024, International Renewable Energy Agency, Abu Dhabi, and International Labour Organization, Geneva.
Jobin, P., Caron, J. and Rochefort, L. (2014) Developing new potting mixes with Sphagnum fibers, Canadian Journal of Soil Science, 94(5), pp. 585-593.
Johnson, T. and Di Gioia, F. (2023) Spent mushroom compost as an alternative to peat-based soilless media for greenhouse potted basil production, Acta Horticulturae, 1426, pp. 317-324.
Kaur, G. and Kander, R. (2023) The Sustainability of Industrial Hemp: A Literature Review of Its Economic, Environmental, and Social Sustainability, Sustainability, 15(8), 6457. DOI: https://doi.org/10.3390/su15086457
Kennard, B. (2020) Sustainable Uses of Bracken & Wool in the Black Mountains Area: Feasibility Study. Black Mountains Land Use Partnership: Managing Resources Sustainably in the Black Mountains Sustainable Management Scheme Project. Available at: https://www.blackmountains.wales/wp-content/uploads/2021/03/Sustainable-Use-Report.pdf (Accessed: 15 February 2026).
Kingston, P., Scagel, C., Bryla, D., and Strik, B. (2020) Influence of perlite in peat- and coir-based media on vegetative growth and mineral nutrition of highbush blueberry, HortScience, 55(5), pp. 658-663.
Kisvarga, S., Farkas, D., Boronkay, G., Neményi, A. and Orlóci, L. (2022) Effects of Biostimulants in Horticulture, with Emphasis on Ornamental Plant Production, Agronomy, 12(5), 1043. DOI: https://doi.org/10.3390/agronomy12051043
Komorowska, M., Niemiec, M., Sikora, J., Gródek-Szostak, Z., Gurgulu, H., Chowaniak, M., Atilgan, A. and Neuberger, P. (2023) Evaluation of Sheep Wool as a Substrate for Hydroponic Cucumber Cultivation, Agriculture, 13(3), 554. DOI: https://doi.org/10.3390/agriculture13030554
Koseoglu, N. and Roberts, M. (2025) Supply Chain Dynamics of Moving from Peat-Based to Peat-Free Horticulture, Sustainability, 17(13), 6159. DOI: https://doi.org/10.3390/su17136159
Lavoie, J., Dunkerley, C.J., Kosatsky, T., and Dufresne, A. (2006) Exposure to aerosolized bacteria and fungi among collectors of commercial, mixed residential, recyclable and compostable waste, Science of the Total Environment, 370(1), pp. 23-28.
Lehmann, J. and Joseph, S. (2015) Biochar for Environmental Management: Science, Technology and Implementation. Second Edition. London, Routledge.
Leiber-Sauheitl, K., Bohne, H. and Böttcher, J. (2021) First Steps toward a Test Procedure to Identify Peat Substitutes for Growing Media by Means of Chemical, Physical, and Biological Material Characteristics, Horticulturae, 7, 164. DOI: 10.3390/horticulturae7070164
Li, M., Ning, W-P., Gao, T-T., Fazry, S., Othman, B.A., Najm, A.A.K., and Law, D. (2024) Rice husk ash based growing media impact on cucumber and melon growth and quality, Scientific Reports, 14, 5147. DOI: 10.1038/s41598-024-55622-4.
Litterick, A.M., Holmes, S., Frederickson-Matika, D.E. and Green, S. (2025) How safe are peat-free growing media?, Plants, People, Planet, 7(6), pp. 1684-1699.
Lu, W., Sibley, J.L., Gilliam, C.H., Bannon, J.S. and Zhang, Y. (2006) Estimation of U.S. bark generation and implications for horticultural industries, Journal of Environmental Horticulture, 24, pp. 29-34.
Macci, C., Vannucchi, F., Peruzzi, E., Doni, S., Lucchetti, S., Waska, K., Heřmánková, M., Scodellini, R., Cincinelli, A., Nicese, F.P. and Azzini, L. (2025) A low impact sediment and green waste co-compost: can it replace peat in the nursery sector?, Environment, Development and Sustainability, 27(5), pp. 10761-10788.
Macdonald, R. (2024) Site visit notes: Beadamoss, Wright Farm Produce, 19th November 2024.
Maher, M., Prasad, M. and Raviv, M. (2008) Organic soilless media components, in Raviv, M. and Lieth, J.H. (Eds.) Soilless Culture: Theory and Practice. Amsterdam: Elsevier, pp. 459–504.
Mansour, E., Loxton, C., Elias, R.M., and Ormondroyd, G.A. (2014) Assessment of health implications related to processing and use of natural wool insulation products, Environment International, 73, pp. 402-412.
Marrs, R.H. and Watt, A.S. (2006) Biological flora of the British Isles: Pteridium aquilinum (Bracken), Journal of Ecology, 94(6), pp. 1179-1206.
Marrs, R.H. and Watt, A.S. (2006) Biological Flora of the British Isles: Pteridium aquilinum (L.) Kuhn, Journal of Ecology, 94(6), pp. 1272-1321.
Mattei, P., D’Acqui, L.P., Nicese, F.P., Lazzerini, G., Masciandaro, G., Macci, C., Doni, S., Sarteschi, F., Giagnoni, L., and Renella, G. (2017) Use of phytoremediated sediments dredged in maritime port as plant nursery growing media, Journal of Environmental Management, 186, pp. 225–232.
Medina, E., Paredes, C., Pérez-Murcia, M.D., Bustamante, M.A. and Moral, R. (2009) Spent mushroom substrates as component of growing media for germination and growth of horticultural plants, Bioresource Technology, 100(18), pp. 4227–4232.
Miserez, A., Pauwels, E., Schamp, B., Reubens, B., De Nolf, W., De Nolf, L., Nelissen, V., Grunert, O., Ceusters, J., and Vancampenhout, K. (2019) The potential of management residues from heathland and forest as a growing medium constituent and possible peat alternative for containerized ornamentals, Acta Horticulturae, 1266, DOI: 10.17660/ActaHortic.2019.1266.55
Müller, A., Schmidt, J., Maiberg, V., Gehring, O., and Schikora, A. (2025) Microbial communities and substrate properties influence the fate of a human pathogen in horticultural substrates with different peat content, Frontiers in Horticulture, 4. DOI: https://doi.org/10.3389/fhort.2025.1568055
Mwangi, R.W., Mustafa, M., Kappel, N., Csambalik, L., Szabó, A. (2024) Practical applications of spent mushroom compost in cultivation and disease control of selected vegetables species, Journal of Material Cycles and Waste Management, 26, pp. 1918-1933.
Negrini, G., Ferrante, A. and Pagano, M. (2020) Performance of greenhouse tomatoes in coir-based substrates compared with peat, Acta Horticulturae, 1273, pp. 87-94.
Nemati, M.R., Fortin, J.-P., Beaulieu, C., Lemke, R., Thériault, G. and Simard, R.R. (2014) Potential use of biochar in growing media, Vadose Zone Journal, 13(10). DOI: 10.2136/vzj2014.06.0074
Nerlich, A., Karlowsky, S., Schwarz, D., Förster, N. and Dannehl, D. (2022) Soilless Tomato Production: Effects of Hemp Fiber and Rock Wool Growing Media on Yield, Secondary Metabolites, Substrate Characteristics and Greenhouse Gas Emissions Horticulturae, 8, 272. DOI: 10.3390/horticulturae8030272
Nicese, F.P., Azzini, L., Lucchetti, S., Macci, C., Vannucchi, F., Masciandari, G., Luca Pantani, O., Arfaioli, P., Imran Pathan, S., Pietramellara, G. and Manzini, J. (2024), Co-Composting of Green Waste and Dredged Sediments Can Reduce the Environmental Impact of Potted Nursery without Affecting Plant Growth, Applied Sciences, 14(4), 1538. DOI: https://doi.org/10.3390/app14041538
Nilsson, M. (2022) Biochar and hemp as peat substitutes in organic growing media: effects on nutrient availability and uptake. MSc thesis, Swedish University of Agricultural Sciences. Available at: http://urn.kb.se/resolve?urn=urn:nbn:se:slu:epsilon-s-18348 (Accessed: 24 January 2026).
Noble, R. and Roberts, S.J. (2003) A Review of the literature on eradication of plant pathogens and nematodes during composting, disease suppression and detection of plant pathogens in compost. Banbury, UK, The Waste and Resources Action Plan. Available at: https://www.r-e-a.net/wp-content/uploads/2023/05/LitReviewPlantPathogensNematodes.pdf (Accessed: 16 February 2026).
Noble, R. and Roberts, S.J. (2004) Eradication of plant pathogens and nematodes during composting: a review, Plant Pathology, 53(5), pp. 548–568.
Omar, N.F., Kasim, N.N., Zainal Abidin, S.Z., Ali, S.N., and Abdul, A. (2023) The impact of rice husk ash (RHA) as soilless growing medium on Sawi Caixin Giant (Brassica parachinensis) growth performance, International Journal of Innovation and Industrial Revolution, 5(13), pp. 49-64.
Othman, N.Z., Sarjuni, M.N.H., Rosli, M.A., Nadri, M.H., Yeng, L.H., Ying, O.P., and Sarmidi, M.R. (2020) Spent Mushroom Substrate as Biofertilizer for Agriculture Application, Valorisation of Agro-industrial Residues – Volume I: Biological Approaches, pp. 37-57.
Pakeman, R.J. (2023) A Rapid Evidence Review of the Implications of Not Controlling Bracken with Asulam in Scotland. Aberdeen: James Hutton Institute. DOI: 10.5281/zenodo.8011214
Pathmeswaran, P., Lokupitiya, E., Waidyarathne, K.P., and Lokupitiya, R.S. (2018) Impact of extreme weather events on coconut productivity in three climatic zones of Sri Lanka, European Journal of Agronomy, 96, pp. 47-53.
Peano, L., Loerincik, Y., Margni, M., and Rossi, V. (2012) Comparative life cycle assessment of horticultural growing media based on peat and other growing media constituents: Final report. Quantis, Switzerland.
Pearson, C., Littlewood, E., Douglas, P., Robertson, S., Gant, T.W., and Hansell, A.L. (2015) Exposures and health outcomes in relation to bioaerosol emissions from composting facilities: a systematic review of occupational and community studies, Journal of Toxicology and Environmental Health, Part B, 18(1), pp. 43-69.
Pitman, R.M. and Webber, J. (2013) The character of composted bracken and its potential as a peat replacement medium, European Journal of Horticultural Science, 78(4), pp. 145-152.
Poudel, P., Duenas, A.E.K. and Di Gioia, F. (2023) Organic waste compost and spent mushroom compost as potential growing media, Frontiers in Plant Science, 14, 1229157. DOI: https://doi.org/10.3389/fpls.2023.1229157
Prasad, R., Redmile-Gordon, M., Gush, M.B. and Griffiths, A. (2024) Characterisation of peat-free growing media, Acta Horticulturae, 1389, pp. 153-162.
Prasara-A, J., and Gheewala, S.H. (2017) Sustainable utilization of rice husk ash from power plants: A review, Journal of Cleaner Production, 167, pp. 1020-1028.
Rangel-Buitrago, N., Rizzo, A., Neal, W.J., and Mastronuzzi, G. (2023) Sediment pollution in coastal and marine environments, Marine Pollution Bulletin, 192. DOI: https://doi.org/10.1016/j.marpolbul.2023.115023
Raviv, M. (2013) Composts in Growing Media: What’s New and What’s Next? Acta Horticulturae, 982, pp. 39-52.
Renella, G. (2021) Recycling and Reuse of Sediments in Agriculture: Where Is the Problem? Sustainability, 13(4), 1648. DOI: https://doi.org/10.3390/su13041648
Renewable Energy Association (2021). A future built on renewable energy and clean technology. London: Renewable Energy Association. Available at: https://www.r-e-a.net/wp-content/uploads/2021/02/REA_Strategy_Exec_Summary_February_2021.pdf (Accessed: 7 October 2025).
Responsible Sourcing Scheme (n.d.) Responsible Sourcing Criteria. Available at: https://responsiblesourcing.org.uk/responsible-sourcing-criteria/ (Accessed: 7 February 2026).
Restrepo, A.P., García, J.G., Moral, R., Vidal, F., Pérez-Murcia, M.D., Bustamante, M.A., and Paredes, C. (2013) A comparative cost analysis for using compost derived from anaerobic digestion as a peat substitute in a commercial plant nursery, Ciencia e Investigacion Agraria, 40(2), pp. 253-264.
Robertson, S., Douglas, P., Jarvis, D., and Marczylo, E. (2019) Bioaerosol exposure from composting facilities and health outcomes in workers and in the community: A systematic review update, International Journal of Hygiene and Environmental Health, 222(3), pp. 364-386.
Robroek, B.J.M., Jassey, V.E.J., Payne, R.J., MartÍ, M., Bragazza, L., Bleeker, A., Buttler, A., Caporn, S.J.M., Dise, N.B., Kattage, J., Zajac, K., Svensson, B.H., van Ruijven, J. and Verhoeven, J.T.A. (2017) Taxonomic and functional turnover are decoupled in European peat bogs, Nature Communications, 8, 1161. DOI: https://doi.org/10.1038/s41467-017-01350-5.
Sahu, N., Parida, C. and Mishra, J. (2019) Study on health hazards of workers in coir industry, The Pharma Innovation Journal, 8(6), pp. 28-30.
Sax, M.S., and Scharenbroch, B. (2017) Assessing Alternative Organic Amendments as Horticultural Substrates for Growing Trees in Containers, Journal of Environmental Horticulture, 35 (2), pp. 66-78.
Scagel, C.F. (2003) Growth and Nutrient Use of Ericaceous Plants Grown in Media Amended with Sphagnum Moss Peat or Coir Dust, HortScience, 38(1), pp. 46-54.
Scarlat, N., Dallemand, J.-F. and Fahl, F. (2018) Biogas: Developments and perspectives in Europe, Renewable Energy: An International Journal, 129, pp. 457-472.
Schmilewski, G. (2008) The role of peat in assuring the quality of growing media, Mires and Peat, 3(2), pp. 1-8.
Schmilewski, G. (2014) Producing growing media responsibly to help sustain horticulture, Acta Horticulturae, 1034, pp. 299-306.
Schmilewski, G. and Nordzieke, B. (2019) Researched, developed and commercialized: GreenFiber, Acta Horticulturae, 1266, pp. 361-368.
Scottish Environment Protection Agency (2025b) Waste from all sources generated and managed 2023: An Official Statistics Publication for Scotland. Available at: https://data.gov.scot/sepa/waste/wfas.html (Accessed: 11 February 2026).
Sdao, A.E., Gruda, N.S. and De Lucia, B. (2025) Beyond Peat: Wood Fiber and Two Novel Organic Byproducts as Growing Media – A Systematic Review, Plants, 14(13), 1945. DOI: https://doi.org/10.3390/plants14131945
Shackley, S., Hammond, J., Gaunt, J. and Ibarrola, R. (2014) The feasibility and costs of biochar deployment in the UK, Carbon Management, 2(3), pp. 335-356.
Smith, J.L., and Lee, K. (2003) Soil as a Source of Dust and Implications for Human Health, Advances in Agronomy, 80, pp. 1-32.
Solbraa, K. (1979) Composting of bark: Different bark qualities and their uses in plant production, Meddeleser fra Norsk Institutt for Skogforskning, 34 (13), pp. 281-333.
Sonneveld, C. and Voogt, W. (2009) Plant nutrition of greenhouse crops. First edition. Dordrecht: Springer.
Snellings, R., Cizer, O., Horckmans, L., Durdziński, P.T., Dierckx, P., Neilson, P., Van Balen, K. and Vandewalle, L. (2016) Properties and pozzolanic reactivity of flash calcined dredging sediments, Applied Clay Science, 129, pp. 35-39.
Sradnick, A., Werner, M. and Körner, O. (2023) Make a choice: A rapid strategy for minimizing peat in horticultural press pots substrates using a constrained mixture design and surface response approach, PLOS ONE, 18(7), e0289320. DOI: https://doi.org/10.1371/journal.pone.0289320.
Steiner, C. and Harttung, T. (2014) Biochar as growing media additive and peat substitute, Solid Earth, 5, pp. 995-999.
Stelte, W., Reddy, N., Barsberg, S., and Sanadi, A. (2022) Coir from coconut processing waste as a raw material for applications beyond traditional uses, BioResources, 18(1), pp. 2187-2212.
Stichnothe, H. (2022) Life cycle assessment of peat for growing media and evaluation of the suitability of using the Product Environmental Footprint methodology for peat, The International Journal of Life Cycle Assessment, 27(12), pp. 1270-1282.
Sulaiman (2025) ‘Rice Husk, Rice Husk Ash, and Their Applications’, in Jawaid, M., and Parmar, B. (Eds.) Rice Husk Biomass: Processing, Properties and Applications. Singapore, Springer, pp. 43-54.
Tambone, F., Scaglia, B., D’Imporzano, G., Schievano, A., Genevini, P. and Adani, F. (2010) Assessing amendment and fertilizing properties of digestates from anaerobic digestion through a comparative study with digested sludge and compost, Chemosphere, 81(5), pp. 577-583.
Toboso-Chavero, S., Madrid-López, C., Villalba, G., Gabarrell Durany, X., Hückstädt, A.B., Finkbeiner, M. and Lehmann, A. (2021) Environmental and social life cycle assessment of growing media for urban rooftop farming, The International Journal of Life Cycle Assessment, 26(10), pp. 2085-2102.
Tozzi, F., Del Bubba, M., Petrucci, W.A., Pecchioli, S., Macci, C., Hernández García, F., Martínez Nicolás, J.J. and Giordani, E. (2020) Use of a remediated dredged marine sediment as a substrate for food crop cultivation: Sediment characterization and assessment of fruit safety and quality using strawberry as a model species of contamination transfer, Chemosphere, 238, 124651. DOI: https://doi.org/10.1016/j.chemosphere.2019.124651
Vandecasteele, B., Muylle, H., De Windt, I., Van Acker, J., Ameloot, N., Moreaux, K. and Debode, J. (2018) Plant fibres for renewable growing media: reducing N drawdown and pathogens via defibration, acidification or biocontrol fungi, Journal of Cleaner Production, 203, pp. 1143–1154.
Vandecasteele, B., Hofkens, M., De Zaeytijd, J. and Melis, P. (2023) Towards environmentally sustainable growing media for strawberry cultivation: Effect of biochar and fertigation on circular use of nutrients, Agricultural Water Management, 284. DOI: 10.1016/j.agwat.2023.108361
Viancelli, A., Comelli, C., Maria Nogara, C., De Araujo, V., and Michelon, W. (2024) The impact of pesticides: Assessing residue persistence, environmental contamination, and human health risks, Journal of Toxicological Studies, 2(2), 1667. DOI: https://doi.org/10.59400/jts.v2i2.1667
Waller, P. (2012) The rise and fall of peat in UK horticulture. In: Peatlands in Balance – Proceedings of the 14th International Peat Congress, 2012, Stockholm, Sweden. International Peatland Society. Available at: https://peatlands.org/document/the-rise-and-fall-of-peat-in-uk-horticulture/ (Accessed 9 October 2025).
White, E. V., Gatersleben, B., Wyles, K. J., Murrell, G., Golding, S. E., Scarles, C., and Xu, S. (2021) Gardens and wellbeing during the first UK Covid-19 lockdown (Research Report No. 1). Available at: https://www.surrey.ac.uk/sites/default/files/2021-07/garden-report.pdf (Accessed: 8 October 2025).
Wichtmann, W., Schröder, C., and Joosten, H. (Eds.) (2016) Paludiculture – productive use of wet peatlands: Climate protection – biodiversity – regional economic benefits. Stuttgart, Germany, Schweizerbart Science Publishers.
Wissner, P., Bohne, H., Heumann, S., and Emmel, M. (2017) Plant biomass from heathland management: a possible peat substitute? Acta Horticulturae, 1168, DOI: 10.17660/ActaHortic.2017.1168.4
Woznicki, T., Kusnierek, K., Vandecasteele, B. and Sønsteby, A. (2024) Reuse of coir, peat and wood fibre in strawberry production, Frontiers in Plant Science, 14, 1307240. DOI: https://doi.org/10.3389/fpls.2023.1307240
Yadav, T.C., Singh, Y.P., Yadav, S., Singh, A. and Patle, T. (2023) Spatial variability in soil properties and site-specific management delineation using fuzzy clustering, International Journal of Plant & Soil Science, 35(6), pp. 49-78.
Yin, M., Li, X., Liu, Q. and Tang, F. (2022) Rice husk ash addition to acid red soil improves the soil property and cotton seedling growth, Scientific Reports, 12, 1704. DOI: 10.1038/s41598-022-05199-7
How to cite this publication:
Macdonald, R., Hinchliffe, W., Elliot, M., Everett, R. and Hinchliffe, E (2025) ‘ Transition to peat-free horticulture in Scotland’, ClimateXChange. DOI https://doi.org/10.7488/era/7009
While every effort is made to ensure the information in this report is accurate as at the date of the report, no legal responsibility is accepted for any errors, omissions or misleading statements. The views expressed represent those of the author(s), and do not necessarily represent those of the host institutions or funders.
This work was supported by the Rural and Environment Science and Analytical Services Division of the Scottish Government (CoE – CXC).
The appendices of this report are available in PDF from the link below. If you require them in an alternative format, please contact info@climatexchange.org.uk or 0131 651 4783.
Research shows the majority of people agree that climate action is urgent and important, but few are taking the action required to meaningfully reduce their emissions (Scottish Government, 2025). ClimateXChange, on behalf of the Scottish Government, commissioned this research to better understand how communications and marketing can either support or hinder the translation of climate concern into climate action.
The research examined three target behaviours: installing a heat pump, switching to an electric vehicle (EV), and using public transport more instead of driving. This research focused on citizens who are concerned about climate change, but had not engaged in one of these three target behaviours. In order to focus on the motivational and behavioural impact of communications, participants were recruited on the basis that they reported no major economic or practical barriers to engaging with the target behaviour.
The aim was to explore how target audiences respond to different types of communication and messages prompting people to take ‘warm-up’ behaviours. Warm up behaviours are the first steps toward larger changes in how they heat their homes and travel.
Findings will be used to inform the Scottish Government’s climate communication plans, policy levers to drive behavioural change, and public engagement on climate change more broadly.
Key Findings
Moments of change drive action, not communications alone
Across all three behaviour sets, changes in personal circumstances – such as the need to replace a gas boiler or buy a new car – as well as external factors – such as a change in public transport policy – are the primary drivers of action. Communications alone are insufficient to bridge the gap between intention and meaningful contemplation or warm-up actions. The strategic role of communications should be to prime the audience to consider the overarching behaviour ahead of the next crucial moment. They can build positive attitudes and beliefs that support these behaviours as sensible, practical, and financially viable.
Social norms are critical for heat pumps and electric vehicles
For both EVs and heat pumps, shifting the audience’s perception from seeing these as potential future norms to viewing them as part of the current norm is essential. Communications should focus on driving social norms and positioning these behaviours as desirable, everyday options being chosen by people across different segments of society. Using ‘real people’ as messengers, featuring heat pumps and EVs in everyday domestic settings, and highlighting increasing popularity proved most effective. For EVs, this includes avoiding luxury framing.
Financial and practical concerns outweigh climate benefits
Although the sample participants reported a desire to do more for the climate, taking action to reduce carbon emissions was not a strong motivator of warm-up behaviours. Participants were aware that gas and oil heating and driving internal combustion engine (ICE) vehicles were significant sources of emissions, but practical and financial considerations, along with social norms, were much more effective in prompting consideration. Communicating about climate benefits works best when mentioned as co-benefits alongside more practical arguments. For EVs, avoiding overly moral climate messaging is important.
Heat pumps require education and myth-busting
Low baseline awareness and knowledge among many participants highlighted the need for communications to educate the public about heat pumps. Key messages should focus on:
Financial benefits including government grants and running cost savings such as exclusive energy tariffs for heat pump customers
Installers offering to handle retrofitting work and grant applications, reducing non-financial costs
Credibility of messenger is critical due to high levels of cynicism around government grants and the energy sector. Consistent messaging across government sources, trusted brands, consumer advice brands, and industry voices is essential. Adopting a factual, confident tone is most effective and communications should avoid futuristic framing or qualifying statements like ‘up to’.
Electric vehicles need range and infrastructure messaging
Myth-busting and prompting re-consideration of current attitudes is important for building interest in EVs. Many participants held outdated views. Key message themes to highlight included:
Improved range of current-generation EVs compared with earlier models
Increased availability of EV charging infrastructure across Scotland
Reduced up-front costs of some newer EV models
Lower running and maintenance costs versus ICE vehicles
Authentic, everyday framing using real customers as spokespeople and Scottish examples proved particularly effective. Providing interactive tools such as route planners and charging maps helps people visualise EV ownership.
Public transport requires challenging entrenched attitudes
For driving less and using public transport more, attitudes were more entrenched. Participants viewed driving as the norm and usually drove as a default action. Coordination between public transport operators and government will amplify positive stories. Communications should focus on:
Taking advantage of policy, service or infrastructure improvements to challenge negative beliefs
For more entrenched car users who seldom used public transport, promoting one-off leisure journeys as a more achievable ask than changing commuting habits
Using influencers and social media to present relatable, human examples and highlight benefits
Adopt a straightforward, factual tone; avoid over-confidence or idealised depictions
Who is this relevant for?
The actionable insights contained in this report are relevant for the Scottish Government’s climate communications teams, policy makers developing behaviour change strategies, public engagement professionals, and partner organisations including energy providers, transport operators, consumer advice bodies, and local authorities involved in delivering Scotland’s net zero ambitions.
Introduction and approach
Introduction
Quantitative survey data demonstrates an intention-action gap among the public. The majority of people agree that climate action is urgent and important, but few are taking the action required to meaningfully reduce their emissions (Scottish Climate Survey 2024). Understanding what can drive people’s transition from latent climate concern to climate action is important for informing Scottish Government climate communications and public engagement.
There is a significant evidence base on the barriers and motivators to taking climate action. However, there is a lack of in-depth research on the role of communications and marketing in influencing people to act on their latent climate concern. In particular, there is a need for actionable insight around the role of communications in relation to “moments of change” where motivation and opportunity to act are higher than usual.
ClimateXChange, on behalf of the Scottish Government, commissioned this research to better understand how communications and marketing can either support or hinder the translation of climate concern into climate action. In this context, action refers to the immediate steps, or warm-up behaviours, someone might take after seeing a climate campaign – for example, visiting a campaign website, researching renewable heating systems, or booking a test drive for an electric vehicle. The research focused on citizens who are concerned about climate change and face no major socio-economic barriers to taking meaningful action yet are not currently doing so. These warm-up behaviours were grouped according to three overarching target behaviours – installing a heat pump, switching to an EV, and using public transport more instead of driving.
The aim was to explore how target audiences respond to different types of climate communication and message framing that prompt people to take warm-up behaviours that can serve as the first steps toward larger changes in how they heat their homes and travel. Framing refers to how a particular message is presented in order to influence how it is perceived by the audience, such as by choosing which additional information is included or omitted, or by presenting the message within a narrative.
Findings from this research will be used to inform the Scottish Government’s climate communication plans, policy levers to drive behavioural change to reach mitigation and adaptation goals, and public engagement on climate change more broadly.
Approach
Our research was split into four sequential phases:
A review of existing literature and evidence to identify:
Key barriers and motivating factors related to the overarching behaviours identified.
Behavioural theories that help us to explain inaction on climate change and how these can be used to prompt change
The effect of different communications, i.e. what works and doesn’t work to motivate overarching behaviours which reduce emissions, looking at message framing and content
The findings were used to develop and refine a set of hypotheses – see Appendix A – about the potential effects of a range of message themes associated with the core behavioural areas of focus. These hypotheses were then tested with research participants.
Six online focus groups were held with 30 participants who: agreed that it is important to take climate action; are willing to take more action than they currently do; and stated that money or other practical barriers do not prevent them from taking more action.
A two-part homework task where the research participants from phase 2 were asked to:
Reflect and think about what they’d seen and discussed in the focus groups and consider how that made them feel and think about the overarching and associated warm-up behaviours
Then, a week after the first task, consider taking a warm-up action(s) – recording their experience and thoughts on what they might/would do as a result of their chosen warm-up action, and add their thoughts on a variety of communication examples.
In depth interviews with each of the research participants to probe in detail their reflections on the whole research process – on what works and what does not work by way of climate communications and other relevant marketing-related interventions in connection with each overarching behaviour and associated warm-up actions.
For full details of the methodology please see Appendix B.
Throughout the research process we used behavioural theory to help us reflect on and analyse our findings. We used the:
Stages of change model (Prochaska & DiClemente, 1983) to help us think about where participants were on their journey to adopt a behaviour / undertake a warm-up action. The stages in the model are pre-contemplation (not ready to change), contemplation (considering change), preparation (planning to change), action (making changes), maintenance (sustaining change), and termination (no longer tempted).
Theory of Planned Behaviour (Ajzen, I., 1991) to understand how different potential communications and messaging would affect participant attitudes, subjective norms and perceived behavioural norms and therefore their intention / likelihood to adopt a behaviour / undertake a warm-up action.
See Appendix D for detail on both theories.
This report sets out the findings from the primary research, informed by learnings from the literature review. Fieldwork was conducted between July and November 2025. The main research findings are presented for each set of behaviours separately – that lead to installing a heat pump, switching to an EV and using public transport more instead of driving.
Behaviour set 1: Heat pumps
Context
Product/offer
For participants, the decision to replace a heating system is generally driven by necessity rather than aspiration, with typical moments of change being the end of the current system’s lifespan, moving home to a property with an older system installed, or renovating a current property. The infrequency of deciding on a new heating system often meant that participants’ attitudes were formed based on information gathered some years ago. Typically, they had little motivation to research the topic until they approached a moment of change. In this context, a moment of change refers to an instance where a combination of external and internal factors align, making a person more receptive to marketing and communications on a particular topic. This in turn meant that some participants had last looked at home heating in-depth at a time when heat pumps were far less widely available.
Choosing a heating system is a high-involvement decision. Participants were keenly aware of the potential negative consequences of making a poor choice to replace their current system, such as higher day-to-day running costs, or greater need for maintenance and the associated cost of this. This meant that a period of information gathering and comparison was the norm in the lead-up to the final choice of heating system. In the context of looking to change behavioural norms around heat pumps, this provides a useful opportunity – if heat pumps were established as a credible option, many participants would be motivated to include them in this information search.
Viewed as a product, heat pumps were considered costly in purely financial terms, particularly in comparison to equivalent gas/oil systems. In addition, heat pumps were associated with non-financial costs which are not required for replacing a gas boiler. These were typically linked to the additional work needed to retrofit a home to a standard suitable for a heat pump. Participants who were aware of the need to retrofit tended to anticipate having to plan and research multiple tradespeople, along with general disruption to the home as a result of plumbing, heating and insulation work.
Market considerations
At present, the market for heat pumps in Scotland is at a relatively early stage. Larger brands in the energy/home heating sector (e.g. Octopus, OVO) are beginning to focus more on heat pumps in their commercial and marketing strategies. Heat pumps themselves were still considered to be a relatively niche choice, even by participants who had greater background knowledge around them.
Consumer trust in the market was an important factor, and the choice of messenger had a pronounced impact on how communications were received. Due to the recent energy pricing increases across Scotland and the wider UK, participants indicated mistrust towards the utility sector, but certain trusted brands could be an exception to this view. Similarly, some participants were wary of messaging around grants and incentives for heat pumps due to high-profile scams linked to cavity wall insulation, double glazing or solar panels which were reported widely in national UK media, for example on BBC Morning Live (2025)[1].
Social norms
With low levels of awareness and background knowledge among most of the participants, there was not a strong sense of social norm or “norm in waiting” around heat pumps. Gas boilers are a very well-established heating norm. Participants with greater knowledge tended to view heat pumps as a niche product which may suit people with sufficient financial means and a specific type of home. Meanwhile, those with lower knowledge were most likely to default to gas boilers without actively researching heat pumps if triggered to look into a new heating system.
Moments of change: where the audience was most receptive to intervention
Participants highlighted several opportunities or changes of circumstance which played an important role in prompting contemplation and action. These moments were capable of shifting participants from a pre-contemplation state where a new heating system was not being considered at all, through to contemplation and ultimately preparation.
Moments of change broadly fit into two categories: moments arising from personal changes in circumstance, and those associated with wider external factors affecting the home energy or heating markets in Scotland.
Knowledge/awareness
Across the sample, levels of self-reported understanding and knowledge of heat pumps tended to be low. Participants who had some awareness tended to lack more specific knowledge around how heat pumps worked or the benefits of having one over a gas/oil system. Participants who reported greater background knowledge on heat pumps were often people who had looked into a heating system more recently. Those with the lowest reported knowledge of heat pumps had often been using the same gas-powered heating setup for longer periods of time without seeing a need to change.
A contributing factor to this low level of background knowledge was a perceived lack of visibility and interest in both the product category in general, and heat pumps as a specific product. Few participants expected to be frequently having organic discussions about heating systems with peers, outwith the preparation/information gathering phase of making a purchase decision. Some participants were unsure whether they had seen a heat pump before, as they lacked sufficient familiarity to identify a heat pump outside a building.
“I think just lack of knowledge, like I didn’t even know it [Heat Pumps] was out there to… I just thought you got a boiler and that was it. Do you know what mean? I didn’t really think much into it until this research. So [now], it’s kind of on my radar a little bit more than it was before.” (F, 30-39, C1)
Behaviour change starting point for heat pumps
Taking the contextual information into account, most participants were at the pre-contemplation stage of the stages of change model, and had not seriously considered a heat pump. A few had reached a moment of change more recently having moved towards contemplation but ruled themselves out of further action.
At the outset of the project, pre-contemplation participants tended to feel that if they had reached a moment of change such as a boiler breakdown, they would most likely to go through the steps of researching and choosing a new gas heating system. They would not consider heat pumps as an option. This has implications for any potential communications strategy, as education and building familiarity are likely to be an important first step in driving greater uptake.
Within the pre-contemplation audience, the overall lack of knowledge around how heat pumps work meant that many had not yet formed attitudes and beliefs about their effectiveness beyond very top-level information. This means that there is an opportunity to shape attitudes towards heat pumps while also building familiarity and knowledge.
Key milestones and opportunities at a national or market level, such as more widespread adoption of heat pumps, can play a role in establishing heat pumps as an option to be considered. Participants felt that as consumers become more aware of increased heat pump uptake in their local area, this could potentially turn pre-contemplation into contemplation. Personal moments of change tended to create a greater sense of urgency than changes at a national or market level, and therefore had greater potential to motivate warm-up action, moving people from contemplation to preparation in the Stages of Change model.
Personal moments of change
Given the expense and upheaval of replacing heating systems, these personal moments of change tended to occur either at the end of an existing heating system’s lifespan, or at moments where the friction and upheaval of a large home improvement would be lessened. Examples from participants included:
Breakdown of the currently used heating system, which necessitates a replacement.
Buying a new home (particularly one with a heating system nearing the end of its lifespan or warranty) was seen as an opportune moment to upgrade a heating system, as a period of upheaval and redecorating is expected and can be planned around fitting a new system.
Deciding to renovate or significantly modify a property was also seen as a good time to consider heating upgrades and other disruptive work.
A secondary personal crucial moment, which was less likely to inspire warm-up behaviours but had a social norming effect, was seeing friends, family or neighbours getting a heat pump installed. Seeing peers modelling the overarching behaviour and potentially hearing positive word-of-mouth was mentioned by some participants, who felt this would make them more likely to consider a heat pump alongside the more familiar heating options.
External/market moments of change
Cost was one of the most important factors participants considered when making a decision to purchase a new heating system. The upfront cost of the system and associated work to install it were often compared with any potential running cost savings over the lifespan of the system. Participants tended to be keen to explore any potential cost savings. This means that any changes to government policy, utilities pricing or the pricing of heat pumps themselves would present communications opportunities to establish heat pumps as a cost-effective option:
Any improvements or changes to government financial incentives/grants (e.g. broader eligibility criteria, increased grant amount)
Any reduction in up-front heat pump costs (e.g. due to market competition)
Any changes to energy pricing which favour electricity over gas
Another set of potential future communications opportunities emerged around milestones in uptake. Publicising the increasing popularity of heat pumps in Scotland or at a more local or regional level had the potential to build a credible social norm around heat pumps, as well as countering concerns about their ability to handle colder weather. Milestones of uptake around the associated financial incentives could offer similar opportunities to present heat pumps as a popular choice, as well as creating interest for consumers wishing to avoid missing out on incentives.
Lastly, with some participants holding the view that heat pumps were a new technology which was still developing, any improvements to heat pump technology which challenge some of the negative attitudes and beliefs around them could help establish them as an option worth considering. Examples of this type of improvement in the discussions included heat pump units becoming smaller, becoming easier to install or retrofit, or becoming even more energy efficient.
Associated warm-up behaviours
In the research discussions and homework tasks, participants identified a range of warm-up behaviours which they associated with researching/deciding on a new heating system. This insight gives an indication of the target behaviours which could be modelled or encouraged in communications to encourage heat pump uptake alongside the primary call to action of switching away from gas or oil heating:
Information searching online via search engines, or increasingly via AI//Large Language Model assistants
Reading consumer advice articles or product reviews to help weigh up pros and cons
Reading news articles linked to energy prices or heating systems
Figure 1: Home Energy Scotland educational web content (participant submission)
Speaking to friends and family, especially those with a heat pump
Seeking advice from tradespeople
Engaging with other online content, such as short-form social media videos, was also mentioned by some
Message themes which had the potential to move participants towards action
The following themes were most likely to prompt participants to consider or engage in warm-up behaviours. With most participants’ starting point being pre-contemplation, the most effective messages tended to be ones which focused on building awareness of key benefits or incentives, and/or contributed to establishing heat pumps as part of the norm for home heating. We have used the Theory of Planned Behaviour (Ajzen, I., 1991) to underpin analysis and identify messages which could build intention to act through subjective norms, attitudes and perceived behavioural control.
Presenting heat pumps as an increasingly popular choice
This emerged as a key messaging theme which could underpin a successful communications strategy on heat pumps. The lack of a strong subjective norm around heat pumps presented a barrier for most participants. Findings indicated that shifting the public’s perception of heat pumps from a relatively niche solution to an option which is already popular across Scotland would be essential if greater uptake is to be achieved.
This core communications proposition was relevant at both the pre-contemplation and contemplation stages. Perceiving heat pumps as an increasingly popular choice among “people like me” made pre-contemplation participants want to learn more. Contemplation stage participants who saw heat pumps as one of the default choices tended to be motivated to seek information in more depth, comparing the benefits of heat pumps to gas or other alternatives.
Often, participants’ views on the positives of gas central heating systems were strengthened by the perception that they are effective in providing the desired level of warmth in the majority of Scottish homes. If communications can help to establish a similar level of norm around heat pumps, it may add to the credibility of other messaging around the benefits of installing one.
Communications examples which were linked to this messaging theme included:
Communications from messengers with both trust and brand recognition in the sector (such as energy providers, manufacturers of gas boilers, or local installers)
Communications which used real heat pump owners as messengers, especially when supported by images of heat pumps in everyday domestic settings
Visual depictions of heat pump uptake (such as NESTA’s “Visit a heat pump” website, which included an interactive map showing where their heat pump champions were based) helped to build a sense of local norm.
Communications example in focus: Local manufacturers
In the homework tasks, participants often gravitated towards advertising (Fig.1) from trusted local installers or prominent names in manufacturing (e.g. Worcester). These brands are associated with the current norm of gas central heating, which meant that participants who saw them appearing to embrace heat pumps as part of their offer were more receptive to the idea that heat pumps are part of a current norm. Additionally, the trust felt towards these brands was important in avoiding cynicism about the other co-benefits such as running costs or financial incentives.
Running costs were an important factor in choosing a new heating system
Figure 2: Local boiler and heat pump installer (The Edinburgh Boiler Company, 2025)
Participants were generally price sensitive when making decisions about home heating, with discussions often returning to energy costs. Cost efficiency is an important factor in forming positive or negative attitudes about heating systems, with almost all participants holding the view that a “good” heating system is one which offers value for money. This aligned with the desk review insight around the importance of pricing to both barriers and motivators (see Appendix A). The potential to save money was therefore a strong motivator for consideration, and even participants who harboured some doubts over the effectiveness of heat pumps tended to be motivated enough by potential cost savings to at least conduct some further research. A key example of this from the stimulus materials used in group discussions was Octopus Energy’s heat pump campaign, which highlighted an exclusive energy tariff for heat pump customers.
Conversely, group discussions and interviews found that financial barriers are key in determining perceived behavioural control over the decision to invest in a heat pump. Even with a positive overall attitude to heat pumps, people are unlikely to engage further if they believe they are not affordable to run day-to-day. This finding highlights a major challenge for communications around heat pumps. Current energy pricing in Scotland means that running cost savings are not guaranteed by switching to a heat pump. However, any future change in energy pricing which would enable a claim around cost savings to be made would present a significant opportunity to increase the appeal of heat pumps versus gas boilers.
Credibility of messenger was an important factor in messaging on this topic. Claims from less trusted sources, such as unfamiliar installers or energy firms with perceived low customer satisfaction, were much more likely to be met with cynicism. Many participants had a favourable view of the utility firm Octopus, which lent credibility to their claims about heat pumps and their running costs. Alternatively, trusted brands in the consumer or financial advice space such as Which? or Martin Lewis played a valuable role in shaping attitudes for those beginning to seek out information on heat pumps.
Communications examples in focus: “Real people” case studies and champions
Examples from NESTA and Home Energy Scotland, both of which opted to present real-life owners of heat pumps as their spokespeople, had the advantage of contributing to building the norm around heat pumps and also offered credible claims about running costs. They combined an approachable, confident tone with realistic imagery depicting heat pumps in domestic settings (in the case of NESTA these were often supplied by the homeowners themselves, which added to the sense of authenticity).
Figure 4: Home Energy Scotland heat pump case study / hero (Home Energy Scotland, 2025)
Figure 3: NESTA’s visit a heat pump info page & visit a heat pump online portal (Nesta, 2025)
Highlighting financial incentives and grants which subsidise up-front costs
As with the theme of lower running costs, the price-sensitive nature of home heating decisions meant that financial incentives had strong motivational potential for participants. Highlighting the availability of financial support for heat pump installations was a prevalent theme in the media reviewed during the desk review (see Appendix A). Given the higher up-front cost of heat pumps in comparison to gas boiler systems, offering to subsidise this tended to positively influence attitudes towards heat pumps, and increased participants’ perceived behavioural control by making them feel more affordable. For many participants, the potential savings offered by incentive schemes would be enough to prompt some warm-up action, even if some cynicism about other benefits of heat pumps persisted.
A related sub-theme around financial incentives was identified. Some installers at both local and national level offered to support clients with the grant process, which further reduced the non-financial cost of installing a heat pump.
This messaging theme generated a degree of cynicism, particularly around the prevalence of scams linked to government grant schemes. In interviews and group discussions, anxiety or concern about scams tended to be triggered by the tone or word choice. Participants were alert to the use of phrasing associated with a sales pitch, or the use of qualifying phrases in claims, and typically reported that this type of phrasing damaged overall trust in the message.
The credibility of the messenger themselves also had an impact on the effectiveness of grant and incentive messaging. Government agencies were trusted to be factual about the terms and conditions, although some participants had a degree of wariness about the use of qualifying phrases in some messaging. In particular, some participants felt that the prominent use of the phrase “up to” in communications about grants led to the assumption that the quoted maximum grant amount would be difficult to qualify for.
In addition, some participants found the grant amount itself to be demotivating, as they assumed that the government would not sanction a large incentive unless the overall cost of installing a heat pump was sufficiently expensive to deter consumers.
To avoid the cynical response which some communications received here, there is a need to be up-front and honest about eligibility and avoid over-use of qualifying phrases like “up to £X” or “you could save”. Findings indicated that the most effective communications approach would be to leverage credible messengers such as government agencies, consumer advice brands and trusted suppliers where possible.
“I’m not so sure about the ones that talked about grants. Now, does everybody qualify for that grant? Because often when you click on these things you’re not eligible and next minute you’ve got 40,000 emails and phone calls from companies wanting to sign you up to their solar panels and everything, so I’m always very wary of these kind of things.” (M, C1, 50-75yrs)[2]
Installers offering to take care of preparatory work
This messaging theme tended to be less effective for the pre-consideration audience. However, for participants who were at the consideration stage, it did have some potential to move them closer to warm-up action.
This theme is linked to the non-financial costs associated with heat pump installation, for example additional research and information gathering, planning retrofitting works and applying for financial support. Participants who had considered heat pumps in more depth than the pre-considerers tended to view these additional tasks as adding significant friction to the process of switching to a heat pump. Conversely, replacing their gas boiler like-for-like with another boiler was anticipated to involve less additional effort on the part of the consumer. As with the purely financial incentives, warm-up behaviours were motivated by a perceived opportunity to avoid cost, and the additional effort and time required to retrofit a property.
Challenging the existing belief that heat pumps are disruptive or difficult to install proved to be an effective message, especially when paired with a credible messenger with a link to the energy or heating industries. For some participants, the idea that a trusted organisation was willing to handle some of the administrative burden of planning and securing financial support increased their perceived behavioural control.
“I quite like the first one [Octopus] because it did everything for you. You don’t need to go in and source it. You don’t need a separate company to come in and do the electrics. Everything is done for you from start to finish.” (M, C1, 50-75yrs)
Again, trust in the messenger is an important factor in ensuring messaging was received without cynicism, as the offer had some similarities with scams (e.g. around insulation or solar panels). Having a trusted brand to underpin messaging and providing a rough figure for the overall cost of retrofitting helped reassure participants.
Communications example in focus: Octopus Cozy Heat Pump
Reducing non-financial cost was a core message and part of the communications mix used by the UK energy firm Octopus to launch their heat pump offer. The credibility of their brand was high for many participants, which contributed to an overall positive reception for their communications when tested in the group discussions. The communications mix for this effective campaign featured messages which did more of an educational job about heat pumps and their benefits in comparison to gas boilers. It also included an offer to support with grant applications and retrofitting works alongside financial savings messaging.
Figure 5: Octopus Energy heat pump ad (Octopus Energy, 2025)
“I really like the Octopus one, purely because I am an Octopus customer. I think they’re really good at what they do. And I think for the last few years, energy companies in general have got so much bad press. I would be a bit nervous about going somewhere else for a heat pump and dealing with somebody that I didn’t know.” (F, AB, 50-75yrs)
Message themes which did not move participants towards action
The following message themes were not found to be effective in prompting participants to consider heat pumps and also did not help to motivate warm-up action. In some cases, these themes have potential as supporting or educational messages, either to increase the public’s familiarity with heat pumps or to reinforce the idea that those who have made the switch made the right choice.
Highlighting the potential to increase property values by installing heat pumps
While this was considered to be a potential benefit of heat pumps by some participants, the primary issue was simply lack of awareness of this as a reason to switch to a heat pump. There was not a perceived social norm around installing heat pumps as an investment to increase property value, as no participants in group discussions had heard of people switching to a heat pump for this reason. Similarly, none of the participants were aware of any media featuring messaging which framed heat pumps as a means of increasing property value. Participants understood that in a scenario where gas heating was close to being phased out as a viable option this message would be more motivational.
These findings are enough to suggest that this message theme could be tested for motivational value again in future if heat pumps become part of the norm, but at present the benefit was too hypothetical to have a significant impact on participants’ intention and action. In some discussions, this message theme had a demotivating effect, as it prompted participants to consider other home improvements they could make for a similar outlay, and often with less disruption to the home.
Highlighting heat pumps’ greater energy efficiency in comparison to gas boilers
The key issue undermining this message theme was around the audience’s understanding of what “efficiency” meant in a home heating context. For most participants, an “energy efficient” heating system was synonymous with cost efficiency, as they think of heating their home primarily as a household utility. For those who understood the difference more clearly, energy efficiency was simply far less relevant to their day-to-day lives unless it also translated to a reduction in household bills.
Further complicating the use of this theme is the fact that many participants noted that modern gas boilers are frequently advertised as being highly “efficient”, which led them to question whether this was a unique benefit of heat pumps.
Presenting gas boilers as a technology which is being phased out
While most participants agreed with the basic premise of this message theme, they tended to deflect the need for action due to an expectation that this would take place over a long timescale. The long lifespan of the average gas boiler meant that a “wait and see” attitude was prevalent among participants who were more aware of heat pumps.
Instead of motivating action at the next crucial moment, the response in discussions was often around the idea that consumers would be sensible to make their next heating system a modern gas boiler and consider making the switch at the next moment of change after that, in the hope that technology had improved further and the up-front and daily running costs had improved by this point.
As with messaging around increasing property values, there is some value in the idea of re-testing this message in future if a larger proportion of Scottish homes have switched away from gas central heating.
Having a heat pump instead of fossil fuelled heating improves air quality at home
This message theme lacked motivational value for almost all participants due to a lack of recognition of any air quality problems caused by gas boilers. Participants were unaware of any health issues as a result of gas or oil systems. Although coal fires were occasionally mentioned as an antiquated fuel source which was associated with poor air quality, participants did not link these issues to gas heating.
Highlighting the climate benefits of heat pumps
Desk insight showed that this type of messaging was prevalent in media promoting heat pumps (see Appendix A), however the primary insight did not indicate a positive impact on intentions or action. Although a reduction in carbon emissions was seen as a positive benefit of heat pumps by most participants, it was not sufficiently motivational to serve as a core message for communications aimed at increasing heat pump uptake. Given the current context of the home heating market and wider concerns about the cost of living, price sensitivity and worries about running costs were prioritised over climate change goals.
For some participants, typically those with lower background knowledge about heat pumps, there could be a demotivating effect if climate benefits are presented as a core benefit for switching. This was because climate-friendly behaviours (e.g. electric vehicles or recycling) were associated with making sacrifices, both financially and in terms of convenience. Presenting heat pumps as primarily a choice made for climate reasons had negative connotations for these participants, who assumed that heat pumps would be a more expensive and/or less convenient product compared to gas heating.
Presenting heat pumps as “cosier” or providing more consistent warmth than gas boilers
Many participants did not fully understand this messaging theme. Similarly to messaging on air quality, the promise of “cosier” or more consistent warmth did not cut through as a strong benefit of heat pumps. This was because few participants had issues with the performance of their existing gas system in terms of providing warmth. The idea of providing affordable heat was far more salient and motivational than the idea of consistency for most participants.
Figure 6: UK Government Heat Pump Campaign (Group discussion stimulus)
How choice of messenger impacted on heat pump communications
The ideal communications approach would employ consistent messaging from a wide variety of sources with some credible connection to the home heating or home energy sectors. With levels of trust and credibility varying from one participant to the next, consistency and breadth of sources will be important if cynicism is to be avoided.
Industry sources
Credible industry sources are important, but not only for practical information on cost, performance or installation. Seeing prominent brands in the gas heating industry offering heat pumps also contributes to the sense that the norm is shifting towards heat pumps. Energy providers are an important voice in the sector, although consumer trust is highly variable between brands. They play a key role in speaking about cost and affordability, which are important factors in the decision-making process for heating systems. Heating system manufacturers were similarly credible here, as their communications were seen as an endorsement of the viability of heat pumps, helping to position them as a choice alongside gas boilers.
“It’s from Octopus Energy, isn’t it? So, it’s from a reliable energy company. It’s not from some third-party kind of thing.” (M, C1, 50-75yrs)
Government
The Scottish/UK governments, and their associated brands (e.g. Home Energy Scotland), can play a key role in educating the public about heat pumps, and especially in promoting financial support. Government communications will also have opportunities to help build the norm around heat pumps, by highlighting anywhere that they are being adopted in the public sector.
Given the need for consistent messaging across sources, there is a potential strategic communications role behind the scenes for government, in helping to coordinate and support/incentivise industry sources to promote heat pumps.
Word-of-mouth
Word of mouth recommendations are important drivers of social norms and can be deemed more trustworthy than messaging from commercial or government sources. Friends, family and tradespeople were all mentioned as key in shaping attitudes and beliefs. However, most participants would only be likely to spontaneously discuss heat pumps if they were already in the process of weighing up a decision.
News sources
Trusted news sources varied from one participant to the next, but stories highlighting benefits of heat pumps and milestones in uptake helped to build the norm. Positive media coverage is also important to counter other stories which highlight the drawbacks of heat pumps in favour of gas and other fossil fuelled systems.
Consumer organisations/influencers
Consumer organisations and influencers (such as Which? or Martin Lewis) are important sources due to their perceived impartiality and expertise. Most participants associated these channels with unbiased information and tended to consult their reviews and other content when deciding on large purchases. Homework discussions indicated that smaller micro-influencers in the home improvement space could also play a role in driving norms by modelling the overarching target behaviour and presenting heat pumps in a favourable light.
How tone impacted on heat pump communications
Participants consider buying a heat pump to be an important decision requiring careful consideration of pros and cons. Therefore, participants responded best to a factual, confident tone in communications.
Tones which were effective in promoting heat pumps
A confident tone was common throughout the commercial and government communications which were received positively. This tone tended to speak positively and authoritatively about the benefits of heat pumps, while avoiding over-promising. Celebrating and highlighting the benefits of heat pumps was not associated with cynicism, as long as a “sales pitch” tone is avoided.
Adopting a tone which presented heat pumps as established, every day or normal was also effective, especially when looking to build the norm around them or challenge the existing norm around gas heating. The more heat pumps are framed as a popular choice, or as one of the default options available to consumers, the more likely they are to be considered when a moment of change occurs.
A factual, honest and unbiased tone is also essential when making claims about heat pumps. Many participants were wary of over-promising and scams. Communications which aim to build awareness for the pre-consideration audience should aim to strike a balance between acknowledging barriers such as up-front cost and being confident about benefits.
Tones to avoid when promoting heat pumps
Due to the prevalence of mistrust and cynicism, particularly around grants and financial support, communications should avoid the use of “sales pitch” phrasing or any terms which could be associated with clickbait or misleading advertising. Participants were very alert to the use of qualifying phrases in headlines and written content, and tended to react negatively to these. Examples of this type of phrasing included terms such as “up to” or “you could save”.
“Oh, I don’t like that bit where it says, “up to £7,500”. It would put me off applying. You just know it’ll be almost impossible to actually get the full amount. It makes me wonder if I’d get anything at all!” (F, AB, 30-39yrs)
With some participants adopting a “wait and see” attitude around heat pumps, which was in effect a soft rejection of the call to action, communications should avoid an overly futuristic tone. Positioning heat pumps as new or advanced technology risks reinforcing this attitude and reducing motivation to act at the next crucial moment.
Behaviour set 2: Electric vehicles
Context
Product/offer
Participants viewed the decision to buy or lease a new car as a high-involvement decision. As with a change of home heating system, participants expected to engage in extensive information gathering as part of the process. The potential to avoid unnecessary costs or inconvenience associated with purchasing an unreliable or unsuitable car offered a significant incentive to research a purchase. This was not a decision which participants expected to make frequently, which meant that knowledge and attitudes were not always updated without reaching a moment of change and beginning the process of contemplation and preparation. This factor became apparent in initial group discussions, with some participants surprised to learn about technological improvements made to EVs in recent years. Improvements to range and battery performance were particularly effective in prompting a change of attitude.
Cars were viewed as a relatively high interest, aspirational product. Some participants drew a comparison with heat pumps to illustrate that cars, and by extension EVs, possessed a greater degree of social value. Although practical concerns remained the critical deciding factors in choosing a car, participants reported that aspiration played a role in the decision. Participants reported that they were more likely to notice and/or comment on friends, family or neighbours getting a new car. There was a sense in group discussions and interviews that the aspirational value attached to new cars could be a useful tool in promoting EVs.
Despite the aspirational and social dimensions of the decision, getting a new car was still a decision which was typically driven by necessity, with events such as breakdowns or reaching the end of a lease agreement identified as typical moments of change.
Perceptions of infrastructure also played an important role in shaping participants’ attitudes to EVs as a product. With ICE vehicles still considered the norm, perceived lack of access to charging infrastructure was an important consideration, although participants often had not researched this in depth to confirm their suspicions.
Market considerations
The market for EVs was viewed by participants as established, but still growing. ICE vehicles are still perceived as being the norm in Scotland, but EVs are not considered to be an unusual choice. In part, this was due to the increasing visibility of EVs in public and in the media.
The initial group discussions revealed that industry communications had shaped participants’ views on EVs. In particular, the prominence of luxury or higher-end brands such as Tesla in the EV sector led some participants to view EVs as a luxury/premium product, reinforcing assumptions about their higher up-front cost. Some of the stimulus materials included promotional media from EV manufacturers at a lower price point to facilitate probing around this assumption.
“I’ve always had the impression they were more expensive cars in general. Some of them look brilliant but I sort of assumed they would be too dear for our budget.” (M, C1, 40-49)
Social norms
EVs were viewed by most participants as a future norm and as a choice which was becoming increasingly popular as a replacement for ICE vehicles. While ICE remains the default choice, most participants expected these vehicles to reduce in popularity in the coming years. While this lent itself to a positive view of EVs, this belief was also associated with the idea that EVs are still technology in an early development phase. Participants tended to expect the performance of EVs to improve further in the future, as well as hoping for their price relative to ICE vehicles to reduce. These attitudes lent themselves to a “wait and see” attitude among participants, which encouraged deflection or dismissal in favour of delaying a switch to EVs.
Moments of change: where the audience was most receptive to intervention
Knowledge/awareness
At a basic level, self-reported awareness of EVs was high across the sample. As such, participants tended to have formed attitudes and beliefs about EVs based on what they had seen and experienced themselves. As cars were typically an infrequent purchase, this meant that some cynicism or negative attitudes and beliefs were linked to information gathered some years ago. Beyond having a basic understanding that they were battery-powered and had to be recharged by plugging into the electricity grid, participants tended to report less detailed knowledge around EVs. Questions tended to focus on:
Range limitations
Running costs relative to ICE vehicles
Suitability for different lifestyles and driving needs, such as those who frequently drove longer distances
Suitability for different geographic locations, especially parts of Scotland where poor driving conditions and lower temperatures are likely
Rather than being linked to battery performance in colder temperatures, this concern was often voiced by more rural participants who had experienced road closures due to snow. This led to potential “range anxiety” if the overall travel distance was increased without warning.
Behaviour change starting point for EVs
With awareness of EVs high across the sample, participants at the pre-contemplation phase of the Stages of Change model were primarily those who had ruled out the idea of buying an EV at an early stage of decision-making, rather than being simply unaware of EVs as an option. Typically, their reasons for doing so centred on either financial costs or perceived practical unsuitability. Attitudes about key barriers were often based on older information and could be out-of-date in the context of contemporary EVs. A “wait and see” attitude also often came through, as pre-contemplation audiences defaulted to petrol cars while not outwardly rejecting the idea of owning an EV in future.
The overall impact of this among pre-contemplation participants was that compared to ICE vehicles, EVs were more likely to be ruled out of the decision-making process at an earlier stage based on assumptions about their relative expense or inconvenience. Communications can potentially play an educational role in updating knowledge and challenging negative attitudes, as well as in positioning EVs as part of the current norm.
Participants who were at the contemplation stage were not likely to outright dismiss the idea of making their next car an EV. Often, these were people who had historically reached the contemplation or preparation phase before deciding against an EV. As with the pre-contemplation audience, this group may hold views about cost and performance based on outdated information which necessitates a myth-busting approach in communications. As they were more likely to have conducted some research in the past, this group tended to be more knowledgeable about EVs and were therefore more receptive to communications which highlighted the benefits of EVs in more detail.
Personal moments of change
Personal moments of change for a new car tended to be linked either to the lifespan of the current car or changes in life circumstance. For participants who preferred to finance their car through hire purchase or similar, reaching the end of a payment plan or lease agreement often triggered consideration of a new car. For those who owned a car outright, noticing more frequent or more expensive maintenance needs was often the cue to begin researching a replacement.
Some participants highlighted changes to work or life stages as moments of change. For example, having a baby or having children leave the family home could be a prompt to consider upsizing or downsizing the family car. A change in working requirements was also mentioned, with people who expected to drive more or less frequently in a new job, or who expected to be driving in different conditions were often prompted to consider a replacement.
External/market moments of change
At market/society level, key moments in the development of EV technology, uptake of EVs, and changes to pricing and financial incentives all factored in the decision-making process. Changing social norms were also a notable moment of change for attitudes and beliefs. While they were less likely than personal moments of change to prompt immediate action, participants often spoke about the positive impact of seeing more EVs and EV infrastructure in their local area. Similarly, friends and family swapping an ICE vehicle for an EV was mentioned in some discussions as a trigger for contemplation.
With perceived lack of charging infrastructure often mentioned as a barrier, becoming aware of the increasing number of charge points across Scotland had the potential to prompt contemplation. Similarly, any reduction in the up-front cost of EVs, or improvements to the various financial incentives offered by government and manufacturers had the potential to nudge participants towards finding out more.
Milestones of uptake could also serve as moments of change if highlighted in communications. Being presented with evidence that EVs are increasingly being chosen over their ICE equivalents helped to challenge the “wait and see” attitude. This also helped to position EVs as part of the current norm rather than an incoming one. A similar effect was also observed around milestones in uptake for grants and incentives by creating a “fear of missing out”.
Associated warm-up behaviours
Participants highlighted a range of warm-up behaviours which would form part of their typical preparation for buying a new car. For the most part, these did not differ significantly from what they would expect to do if researching a new ICE vehicle:
Online information searches (primarily through search engines)
Reading consumer advice and reviews (including those from specialist motorist-focused publications, e.g. Autotrader)
Word of mouth, including speaking with friends or family who own an EV, but also in some cases seeking advice from professionals (such as mechanics)
Booking a test drive was associated with being further downstream in the decision-making process as it involved more effort and therefore was typically reserved for deciding between individual models of car.
Figure 7: Arnold Clark search result page for EVs (Participant submission)
Message themes which had the potential to move participants towards action
Presenting EVs as part of the norm in Scotland
This core communications proposition was important for pre-contemplation and contemplation audiences. Challenging the perception that ICE vehicles were the norm and positioning EVs as part of this norm had a strong effect on their likelihood to engage in warm-up behaviours. The idea that “people like me” were already making the switch away from ICE vehicles played an important role in priming participants to engage in warm-up behaviours when they next reached a crucial moment. Participants who reported taking warm-up action over the course of the research often mentioned seeing more EVs in their local area or engaging with friends and family who owned one when asked about factors which influenced their action.
Communications example in focus: Volkswagen Stories
One of the most effective stimulus materials in prompting consideration and increasing the likelihood of action, was this video series produced by Volkswagen UK to promote their ID range of EVs. The videos feature real customers who made the switch to an EV and tend to focus on the benefits of EVs in everyday driving. Using the drivers themselves as spokespeople and avoiding a heavily stylised depiction of the car helped to ground the messages. One particularly impactful example featured a Scottish couple who regularly travelled between Oban and Glasgow. Participants praised the authenticity of this approach, and the use of a recognisably Scottish example of a long journey felt more memorable than simply quoting a figure to illustrate the car’s range.
Figure 8: Tom’s VW story (Volkswagen UK, 2025)
“I really liked the one that explained about the chaps that were taking people from the hospital. I just liked that it sort of gave that confidence that it could be used. It’s giving you actual real-life scenarios from a real-life situation that’s happening…the importance of their journeys as well, and they trust that car to be reliable enough to do that.” (M, C1, 25-49yrs)
If this sense of norm can be created and reinforced, it is likely to boost the credibility of other messaging as well as prompting re-consideration of previously held beliefs. For example, those in rural or semi-rural locations may be prompted to reconsider their views on range and charging infrastructure if they begin to perceive the local norm shifting towards EVs. To achieve this, communications which presented EVs in normal everyday situations, and that spotlighted people with lifestyles that did not fit with the negative view of EVs, were particularly useful.
Raising awareness of improvements to EV range
This messaging theme evidenced the importance of communications in a myth-busting role for both the pre-contemplation and contemplation audiences. One of the most frequent reasons participants gave for not choosing an EV was the belief that they would require frequent recharging in order to cover the distances the participant expected to cover. This was usually contrasted with the ability of ICE vehicles to cover large distances on a single tank of fuel. Messaging from car manufacturers included in the desk review often highlighted range as a key feature for current-generation EVs (see Appendix A).
As cars were an infrequent purchase, discussions often revealed that participants had based this view on information which had been available the last time they reached a crucial moment. Frequently, this meant that participants were surprised to learn how far contemporary EVs are able to travel on a single battery charge.
“I didn’t realise you could probably get to Glasgow and maybe back on some of the newer ones. For me that’s something I’d be interested in finding out a bit more about.” (F, 50-59, AB)
Communications example in focus: Which? online EV quiz
This interactive advice resource from the consumer advice brand Which? was presented as a quiz. Users answered a short series of questions about their living circumstances and driving habits and received tailored advice on whether an EV would be a viable choice for them. This medium was useful in prompting participants to revisit assumptions about the range of EVs, as well as prompting some contemplation about the change of habit required to keep an EV charged up in contrast to their existing habits around filling up at a petrol station. The brand credibility of Which? as a perceived neutral party helped to foster trust in the advice given. It was possible for users to receive advice that recommended against buying an EV, which could be demotivational. However, some participants noted that the fact this was a possible outcome added to the sense of impartiality.
Figure 9: Which? EV feature and quiz (Which?, 2025)
Successfully challenging the perception of low range reduced the impact of other barriers. Based on this message, participants reported that the perceived lack of charging infrastructure, and the “hassle” associated with expecting to re-charge an EV more often than an ICE vehicle would need refuelled, were less of a concern. Likewise, as low range was associated with the belief EVs were a technology that was still in development, myth-busting on range helped to dispel the “wait and see” attitude.
Linked to this wider theme, some communications examples which encouraged participants to think about the distance required to cover a single week of average driving helped to re-position the range of EVs as sufficient for everyday needs.
Highlighting EVs with lower up-front costs
This messaging theme was effective at both the pre-contemplation and contemplation stages, as it challenged the belief that EVs were a premium product with a high up-front price. Challenging this view was essential to moving the pre-contemplation audience towards contemplation, as perceived high up-front costs tended to encourage dismissal early in the decision-making journey. For those who were contemplating an EV, being made aware of the options at lower price points increased their perceived behavioural control and encouraged further research to explore their options further.
This core communications proposition also has the potential to increase the sense of EVs as the incoming norm. The perception of EVs as a high-end product was in part linked to the strong impact of brands such as Tesla in popularising earlier generations of EVs. In contrast, promotional communications for more affordable EV models often focus significantly on price. For participants, seeing a wider variety of manufacturers, including mid-market or cheaper brands, helps to drive the idea that EVs are becoming increasingly popular across society rather than just for an affluent subset of the population.
Raising awareness of improvements to charging infrastructure and performance
This theme focuses on drawing attention to the increasing proliferation of public EV charging across Scotland. A sub-theme is around raising awareness of the increased availability of rapid charging. The impact of this was similar to messaging around range, prompting participants to revisit their beliefs about whether owning an EV would be a practical choice over an ICE vehicle.
For the pre-contemplation audience, the benefits of this messaging theme lie in reducing the risk of rejecting EVs as an option altogether. Participants who felt that public chargers were easily available locally tended to be more receptive to the idea of considering an EV for their next car. Additionally, some of the follow-up interviews indicated that discussions on the topic had primed participants to notice charging infrastructure in their local area, reinforcing the idea that EVs were part of the wider norm.Interactive online tools proved to be an impactful way to communicate this message to the contemplation audience, largely because they encouraged participants to reconsider beliefs about local infrastructure. Urban residents assume public chargers will be busy, while rural residents assume there will be few chargers nearby. Visually showing the number of available chargers on a map often prompted participants to change their view. Likewise, case studies and/or “real people” as spokespeople in communications added a sense of local authenticity to messaging which highlighted access to charge points.
“I imagine peak time in the Highlands it would be tough to get a space to charge. If you’re on the North Coast 500 basically any time between March and October, it’s just going to be constant [public chargers in use].” (F, 40-49, C1)
An important sub-theme linked to this topic was the need to explain how EV charging works to an audience who are familiar with petrol infrastructure and its associated habits. Participants tended to assume that public chargers would be a significant part of meeting their charging needs. Explaining that for many EV owners, home charging is the primary source of energy, with public chargers acting as a top-up for longer journeys or busy moments will be important to reduce concern about access to infrastructure.
Communications example in focus: ChargePlace Scotland
This interactive route planner allows users to plan journeys and check the availability of public chargers across Scotland. It shows the location of charging points and also uses a traffic light system to indicate which chargers are in use in real time. For participants who had reached the contemplation stage, this tool helped to build their sense of familiarity with local infrastructure, reducing “range anxiety” and also prompting them to plan out the journeys they might expect to make.
Figure 11: ChargePlace Scotland map
Highlighting financial incentives/grants
Although less impactful than range, infrastructure and cost, the availability of financial incentives was often sufficient to generate some interest among participants. This was associated with a specific warm-up behaviour. Rather than being linked directly with intention to purchase an EV, participants often reported that, as a result of communications focused on grants, their warm-up behaviour began and ended with a quick check of eligibility.
Similarly to messaging about lower than expected retail prices, there is potential for this message theme to increase perceived behavioural control by lowering the expected up-front cost of an EV.
Figure 12: BBC News article highlighting EV grant scheme (Group discussion stimulus)
There was a potential drawback to this core communications proposition linked to participants’ assumptions about why a government incentive would be deemed necessary. As with similar messaging on heat pumps, some participants took the presence of a financial incentive as confirmation that the up-front cost of an EV would be off-putting, reinforcing one of the main barriers to adoption.
“My first thought there is, if they’re offering you something like three grand off the price of a new electric car, how much is it in the first place?” (M, 50-59, C1)
As a sub-theme, some communications around EVs specifically highlighted grants or other incentives towards installing home charge points. Incentives focused on home charging tended to be received more positively than larger incentives which subsidised the cost of the car itself. This was due to participants who were sceptical about a larger incentive believing that that they were more likely to qualify for a smaller incentive.
Messaging which highlights growing uptake of financial incentives to buy an EV can also help to build the overall sense of social norm around EV ownership.
One further risk of this core communications proposition was linked to eligibility. Some participants who took action during the research project were disheartened to learn that they did not meet the criteria for a grant. This tended to reduce their motivation to pursue further information-gathering on EVs. Effective targeting and clear communication on criteria will be required to mitigate this.
Highlighting lower running/maintenance costs versus ICE vehicles
This message was more relevant to those at the contemplation stage, as maintenance and running costs tended not to be an important issue in comparison to range, infrastructure and cost. The theme still had some value as a sub-message for pre-contemplation participants, as it helped to position EVs as an advantageous choice and added to the list of potential benefits. As with other financial message themes, the potential to save money was often enough to merit a quick initial search, even for those who were still unconvinced by other benefits.
For those actively comparing ICE to EVs, reduced running costs presented an attractive proposition which felt worth looking into. Participants tended to associate the idea of running costs with potentially paying less tax, spending less on maintenance, or paying less per mile travelled in comparison to an ICE vehicle. Where EVs feel like the more affordable choice day-to-day, perceived behavioural control was likely to increase. Participants who felt EVs might offer lower day-to-day costs often felt that this could justify spending more up front. For participants with negative experiences around reliability in an ICE car, this was a strong argument to consider an EV.
The most effective media for this message tended to be more long-form and written content, including articles from consumer organisations or reviews from car magazines/sites. Word of mouth was also highly valuable here, and participants reported that the experiences and views of other EV drivers or mechanics were potentially influential.
“I was doing a bit of reading, and it seems that you can get a tariff for your energy bills that makes it cheaper to charge your car up overnight. I still don’t know if that would actually add up for me, but it’s food for thought.” (M, C1, 30-39yrs)
Message themes which did not move participants towards action
Presenting EVs as advanced/superior technology in comparison to ICE vehicles
While the idea of a better driving experience and owning the latest technology was positive for participants, it did not tend to prompt changes to attitudes or behaviour. The key flaw in this core communications proposition was its lack of specificity. Without specifically addressing their negative attitudes and beliefs around cost, range and infrastructure, there was not enough to convince participants to re-evaluate their existing views.
Focusing on climate benefits of EV ownership
Participants reported that this message theme alone was not enough to overcome their reservations about financial and practical factors. While most participants did not reject the idea entirely, climate benefits fit best as a co-benefit which could help reinforce the decision to buy an EV once it had already been made.
In some discussions, there was a degree of cynicism around the environmental credentials of EVs, for example about the climate impacts of the wider EV supply chain.
“We’d all love to have an electric car and do our bit for the climate, but when there’s expenses elsewhere maybe a big cost on a car isn’t top priority.” (M, C1, 30-39yrs)
Highlighting potential improved local air quality from EV ownership
This messaging theme lacked perceived relevance for most participants. There was a tendency not to recognise air quality in Scotland as an issue requiring significant action. This was particularly true for participants living in rural or semi-rural areas. As participants’ main front-of-mind concerns around EV ownership were financial and practical, improved air quality was perceived as a minor co-benefit at best.
“It’s like when they started adding Low Emission Zones in Edinburgh. I had to change my car as well, but I don’t see the effect that it’s actually had on the air, it still seems the same to me!” (M, C2, 30-39yrs)
Presenting ICE cars as likely to be phased out in the coming years
While this message generally felt credible to participants, it was not sufficient to prompt contemplation or warm-up action. The credibility of the messaging was reinforced by recent policy changes, such as the introduction of low emission zones in large cities. However, participants did not anticipate ICE vehicles to become significantly less viable in the short-term. Coupled with the long period expected between car purchases, this theme was associated with the “wait and see” attitude for most participants, reinforcing the idea that delaying the switch to an EV was the best course of action.
It’s fair to say [petrol] is on the way out. As it stands though, I think it’s not likely my next car will be electric. Maybe the one after that? (M, C2, 30-39yrs)
How choice of messenger impacted on EV communications
Given the importance of establishing a social norm around EVs, consistent messaging across a diverse mix of sources will be required. Additionally, the need for education or myth-busting to update and challenge existing attitudes around EVs means that messengers with a reputation for fairness and balance will be particularly useful.
Industry sources
One of the most important factors in driving the perceived social norm around EVs at a national level will be the visibility and credibility of recognised brands in the automobile industry. Seeing major manufacturers promoting EV models alongside or instead of ICE models was interpreted by participants as a strong signal that EVs are a popular and viable choice. Messaging from car manufacturers increasingly frames EVs as an option rather than a special category. In addition, the increased presence of mid-market and more affordable brands in the EV market is likely to help challenge the perception of EVs as a luxury item.
Consumer organisations/influencers
Both general (e.g. Which?) and specialist car review brands (e.g. Autotrader, What Car) were frequently mentioned in discussions and interviews. For many participants, they are an essential part of the information search for those considering a new car. This gives them an important role in shaping opinion, driving norms, and educating their audience.
Online social media influencers can play a similar role. Some participants highlighted this in the homework tasks. In particular, content which emphasised the normality of EV ownership or offered insight on the day-to-day running of an EV helped to prompt deeper consideration and normalise the idea of owning an EV.
Word of mouth
Participants highlighted the importance of personal networks in shaping their decision on which car to buy. Some participants reported a positive recommendation from a friend or relative as having had a strong motivational effect, as they felt they could be trusted to honestly report on the advantages and drawbacks of owning an EV. Similarly, some participants mentioned asking mechanics, taxi drivers or other professionals about the reliability and costs of EVs as a way of tapping into their greater experience.
Government
Government communications around EVs can play a key role in education, myth-busting and in drawing attention to policy changes or milestones of uptake that can serve as a crucial moment. Government also has a potential role in amplifying any positive stories about grants/incentives, or improvements to infrastructure which reduce the friction of EV ownership.
News sources/PR
Mainstream news media was highlighted as a useful channel for reinforcing norms or introducing narratives which counter negative attitudes around EVs. For example, articles which highlight milestones of uptake or improvements to EV technology were potentially useful in shaping a more positive view of EVs in the general public.
How tone impacted on EV communications
Tones which were effective in promoting EVs
Many of the advertising and promotional materials from EV manufacturers which were well received adopted a confident tone, presenting their product as stylish and effective. For participants, this matched their expectations from car advertising in general, which contributed to the sense that EVs are part of the norm. Likewise, an aspirational tone which depicts EVs as a desirable product with social as well as practical value could be similarly effective in the specific context of advertising, especially when coupled with messaging which highlights affordability.
Adopting a more overtly “everyday” tone was also an effective choice. Putting the spotlight on real people or presenting EVs in straightforward, relatable situations was a useful way to reinforce the norm. Visually depicting how EVs can fit into a typical person’s life helped to prime participants to consider their own driving habits and whether they would be compatible. Communications which included a recognisably Scottish example were particularly effective.
For communications focusing more on an educational or myth-busting role, participants reacted positively to a reassuring tone, which felt like a good fit for the content.
Tones which were less effective in promoting EVs
Although higher end car manufacturers often emphasise luxury and advanced technology, this tone did not suit a wider audience. It risks reinforcing the belief that EVs are prohibitively expensive or only suitable for an affluent subset of the population.
Tones which focused more on the morality or ethics of EVs using a climate change framing were less effective in prompting action or encouraging participants to re-think their existing views. Participants were all aware that fossil fuels are detrimental to the environment, and that EVs are a way to reduce emissions. This led to communications being perceived as “preachy” or patronising by some participants.
Behaviour set 3: Drive less/use public transport
Context
Product/offer
In contrast to the previous two overarching behaviours considered as part of this research, reducing private car use and making more extensive use of public transport requires a change in everyday habit as opposed to an infrequent, one-off decision. For participants, this tended to seem like a larger, more complex call to action, as they had to consider how to adapt to and maintain the new behaviour.
Broadly, participants outlined two main contexts for driving less and using public transport more: commuting and leisure travel. For both, participants tended to favour reliability, convenience and value for money. Commuting tended to be viewed as more stressful, with greater time pressure than leisure travel. The decision here was often dominated by participants’ attitudes and beliefs towards the public transport offer in their immediate area. The perceived quality and value for money of public transport varied considerably between areas. Levels of service provision and infrastructure also significantly differ depending on area of residence, so these attitudinal barriers were often linked to practical barriers.
The key benefits highlighted in the communications promoting public transport which were used in the research stimulus include:
Additional free time gained versus having to concentrate on driving
Avoiding the inconveniences of driving such as parking and heavy traffic
The environmental benefits of choosing public transport
Most participants tended to have already considered the public transport offer and had formed a preference for travelling by car instead. Often, this meant their driving habits were engrained, and they tended to have a positive view of driving, perceiving it to offer a greater level of door-to-door convenience and better value for money than public transport.
Knowledge/awareness
Knowledge and lived experience of using public transport was ubiquitous across the sample. This meant that participants tended to hold well-established attitudes and beliefs, which were often based on their personal experiences of using local bus or train services. Communications promoting public transport use instead of driving face a considerable challenge in shifting these attitudes without being able to evidence material change or improvements to the services themselves.
Market considerations
The public transport sector in Scotland is highly developed. Participants had high awareness of both nationally and locally relevant providers. Often, public transport operators have an effective monopoly on particular routes or areas. This in turn means that their reputation and credibility have a strong influence on local people’s attitudes towards reliability, convenience and value for money.
Overall, participants tended to report low levels of trust in public transport providers and often had an unfavourable opinion of their services. The recruitment criteria for this research offers a potential explanation for the high degree of reported cynicism around public transport. Participants were recruited on the basis that there were no significant practical or financial barriers to using public transport more than they already did. This likely led to a sample who opted not to use public transport based on attitudes and beliefs. As a sub-audience, their views pose a challenge for communications promoting the benefits of public transport.
Social norms
While use of public transport is already part of the social norm across Scotland, private car travel is more prevalent and normalised. The degree to which public transport is part of the norm varies regionally, with reliance on public transport often considered less normal in rural or semi-rural areas. In some cases, participants who had moved between rural and urban environments identified a link between the perceived level of availability and service coverage and the prevailing social norm of using public transport.
“When I used to stay in Glasgow as a student, I would use the bus all the time, but now I’m back up in Inverness I don’t think they’re nearly as good, so most people I know don’t bother.” (M, C2, 30-39)
Behaviour change starting point for driving less and using public transport more.
Participants who were at the pre-contemplation stage for driving less tended to be people who held well-established negative attitudes about the quality and value of their local public transport offer, while also having a positive view on the relative convenience and value for money of travelling by car. This meant they defaulted to driving when planning a journey and were likely to dismiss the idea of travelling by public transport without much consideration. Consequently, the communications focus for this audience has to be on challenging existing attitudes and beliefs in order to prompt a re-evaluation of the benefits of public transport. Policy or infrastructure changes often provided the best opportunities to do this.
For participants who do contemplate reducing their driving in favour of public transport, the challenge is more around supporting the change of habit. Often, participants in this group believed that they already used public transport as often as it makes sense for them to do. Highlighting new ways to use public transport, especially for leisure journeys, offered a potential route to move them from contemplation to preparation.
Moments of change: where the audience was most receptive to intervention
Knowledge/awareness
Knowledge and lived experience of using public transport was ubiquitous across the sample. This meant that participants tended to hold well-established attitudes and beliefs, which were often based on their personal experiences of using local bus or train services. Communications promoting public transport use instead of driving face a considerable challenge in shifting these attitudes without being able to evidence material change or improvements to the services themselves.
Behaviour change starting point for driving less and using public transport more.
Participants who were at the pre-contemplation stage for driving less tended to be people who held well-established negative attitudes about the quality and value of their local public transport offer, while also having a positive view on the relative convenience and value for money of travelling by car. This meant they defaulted to driving when planning a journey and were more likely to dismiss the idea of travelling by public transport without much consideration. Consequently, the communications focus for this audience has to be on challenging existing attitudes and beliefs in order to prompt a re-evaluation of the benefits of public transport. Policy or infrastructure changes often provided the best opportunities to do this.
For participants who do contemplate reducing their driving in favour of public transport, the challenge is more around supporting the change of habit. Often, participants in this group believed that they already used public transport as often as it makes sense for them to do. Highlighting new ways to use public transport, especially for one-off leisure journeys, offered a potential route to move them from contemplation to preparation.
Personal moments of change
At a personal level, opportunities to swap driving for public transport were often prompted by changing work or study requirements. As a change of job/study location means having to plan out a new commute and a potential change of daily routine, it offers a moment where existing habits must change regardless of the mode of transport chosen. Moving house offered a similar moment of upheaval where new habits are required. For both of these examples, the potential to motivate action on driving less was increased if the new location was perceived as having better public transport links than the old location.
Another key moment of change for participants was linked to eligibility for discounts. Reaching milestones associated with national or local discount schemes (e.g. an older person’s bus pass, or student discounts) typically prompted participants to engage in warm-up behaviours to explore the potential savings.
“I’ve been thinking about my daughter’s situation, going to university, and rather than taking the car, because she’s under 22, they get, like, free buses. So that’s a massive encouragement for her. And if she misses the bus, she’ll often get the train, and them cutting the peak fares, that’s made a big difference to the cost as well.” (F, 50-59, C1)
External/market moments of change
Negative attitudes about public transport among participants were typically based on perceptions of poor reliability, lack of service in the local area, or low value for money. This meant that any improvements to infrastructure or service, and any changes to policy which made pricing more affordable, afforded crucial opportunities to challenge these attitudes. Where communications were able to frame their messaging around a significant change like this, even the more cynical participants were likely to engage in some warm-up behaviours.
Associated warm-up behaviours
Participants reported a range of warm-up behaviours associated with journey planning, which were essential to use of public transport regardless of whether they were planning a one-off leisure journey or considering a change of commute. These included:
Online information searches using search engines and increasingly the use of AI assistants
Route planning through map applications on smartphones or websites
Route planning through public transport operators’ apps or websites
Message themes which had the potential to move participants towards action
Challenging existing beliefs about public transport services
As participants at both the pre-contemplation and contemplation stages held at least some negative attitudes and beliefs towards public transport, communications which were able to prompt a re-evaluation of views were crucial. Perceived behavioural control was often low, especially for participants living in places that they believed to be poorly served by public transport. These participants reported that becoming aware of service improvements, such as additional routes or more frequent services, could prompt them to re-consider.
Public transport was widely believed to offer worse value for money than private car travel, meaning it is necessary to challenge this belief by highlighting value for money wherever possible e.g. through discount cards, price promotions, changes to fare policy. Participants tended to assume they were aware of the current options for discounts and savings, which meant that they were unlikely to engage in warm-up actions linked to researching pricing without becoming aware of new discounts or changes to existing pricing structure. An example of this type of messaging which proved effective was ScotRail’s announcement of the removal of peak time rail fares.
Without material changes or improvements to frame messaging, public transport brands may struggle to challenge negative attitudes directly due to trust issues, with bus services in particular tending to have a low level of public trust. Some of the more human-focused social media content which was used as stimulus proved to be more effective at softening negative views on public transport than direct communications from public transport operators.
In contrast, participants tended to reject or dismiss claims which were not backed by a policy change (e.g. simply stating that public transport offered good value rather than highlighting a discount or price change). For many participants, the ScotRail example was one of the few communications pieces which was sufficient to prompt warm-up action by itself, although there remained some cynicism around other factors such as reliability and convenience.
“[ScotRail] actually have a calculator that I used to see how much I could potentially save by taking the train, so yeah, I did take action when I saw this” (F, 30-39, C1)
Communications example in focus: ScotRail peak fares announcements
Participants were shown several pieces of communication promoting ScotRail’s pricing changes at peak times, including promotional videos and PR/news headlines. The effectiveness of these communications lay in offering a straightforward, factual piece of information which challenged an existing negative attitude about value for money. Communications included examples of the money which could be saved travelling on some of Scotland’s busiest routes at peak times, which generated interest among participants. The ScotRail website featured a price calculator tool which was used by some participants in the homework tasks to explore the potential cost of commuting by rail.
Figure 14: ScotRail price change (ScotRail, 2025)
Highlighting improvements to public transport policy, infrastructure, or service
This messaging theme was closely related to the previous theme around challenging existing beliefs. With participants’ views often deeply entrenched and based on prior experience, they were most receptive when confronted with a clear positive change to the public transport offer.
From a communications strategy perspective, the drawback to this theme is the fact that it requires a change to occur in order to provide a compelling reason to engage with the message. Improvements which have the potential to prompt re-consideration for people who have negative views about value for money, reliability or service coverage should be treated as a major opportunity. Coordination with public transport operators and colleagues in local or national government will be important to ensure these opportunities are used to their fullest advantage.
The type of changes or improvements which participants identified as likely to prompt a re-think of their current views included:
The announcement of new bus, train or cycle routes in their local area
A change of bus operator in contexts where participants held a strongly negative view of the current operator
Changes to timetables or schedules which allowed for more frequent journeys, faster journey times, or extended operating hours
The announcement of new discount schemes, price promotions or similar
“I kind of have to drive to work, where I work in an industrial estate. I think it’s about two buses to get there, so it’s obviously less convenient. So really the push for myself to get to work via public transport is obviously less. But I think with the peak fares going, it’d be nice to go down to Edinburgh or Glasgow via the train. I always end up driving because the cost of the train tickets, it’s just really so expensive. So, yeah, peak fares going would really appeal to me” (F, 30-39, C1)
Focusing on leisure travel and “one journey at a time”
The effectiveness of this messaging theme lay in avoiding the deflection and dismissal associated with changing daily driving habits and instead focusing on encouraging participants to choose alternatives to private car travel when planning one-off journeys, especially leisure trips. For an entrenched driving audience, the idea of taking occasional leisure trips by train was a much smaller ask in comparison to replacing daily journeys to and from work, and was also something many participants had not considered doing for some time.
Communications which featured this theme tended to meet with less resistance than those proposing a change of habit. Participants were more likely to report warm-up behaviours as a result, helping to normalise greater use of the public transport. For those with entrenched negative views based on past experiences of public transport, this approach offered an opportunity to challenge these beliefs through new experiences.
One-off leisure travel was a more accessible call-to-action than commuting, as participants felt that the more infrequent occasional nature and lack of time pressure reduced the impact of barriers like perceived low reliability or cost. Some participants also engaged positively with the added value offered by using public transport to get to and from social or cultural events. For example, not having to drive home at night, or being able to drink alcohol at a concert.
Communications example in focus: Instagram influencer @thechaoticscot
This example highlighted the potential of travel influencers to encourage their audience to use public transport more and drive less. The example tested with participants featured a leisure trip to Rosslyn Chapel which involved multiple journey legs. Presented in a personable, relatable vlog style, the influencer highlighted the value for money and convenience of public transport and combined travel advice with recommendations for food, drink and attractions. The inclusion of recognisable Scottish landmarks and public transport brands often prompted consideration of similar leisure trips among participants.
Figure 15: The Chaotic Scot, 2025
Highlighting the additional free time gained by using public transport instead of driving
This messaging theme was less effective for the pre-contemplation audience, but participants who were already at the point of contemplating more use of public transport found it to be encouraging. It was prevalent in messaging aimed at commuters by rail and bus operators in the desk insight (see Appendix A). For many participants, framing the journey itself as free time was a novel benefit which they had not considered before.
The main flaw in this messaging theme was that while it had the potential to build positive attitudes towards public transport, it did not directly address the major barriers of perceived low value for money, reliability and convenience. This meant those with low perceived behavioural control (e.g. people who believed they could not realistically make more use of public transport) were likely to reject messaging along this theme.
In addition, participants tended to associate the benefit of free time more with rail travel than bus travel, as buses tended to be perceived as more crowded and less relaxing than rail.
“I do sort of like the idea of getting time back to do your own thing, you could check a few emails in the morning and stuff like that.” (M, AB, 25-49yrs)
Message themes which did not move participants towards action
Re-framing the costs of car ownership to include maintenance and other bills
Some communications examples sought to prompt re-evaluation of the perceived value for money offered by private car travel (see Appendix A). When comparing costs between driving and public transport, participants tended to focus on fuel costs for their car, which often compared unfavourably with the price of an equivalent bus or train ticket. This messaging theme aimed to re-frame the price comparison so that it accounted for a wider range of costs associated with owning and running a private car, such as insurance, tax, maintenance and parking.
While participants acknowledged the idea that there were other costs beyond fuel, this core communications proposition was not particularly motivating. This was linked to the perceived sunk costs of car ownership, as participants who were very unlikely to give up owning a car would still have to pay road tax, monthly car payments and maintenance costs even if they decided to make greater use of public transport.
Some participants also brought up the idea of car sharing in response to this, as multiple people sharing the fuel cost of a single journey often represented a considerable cost saving, further increasing the perceived value of driving versus buying individual tickets on public transport.
Highlighting the drawbacks of private car use
This messaging theme focused on highlighting some of the inconvenient or stressful aspects of private car travel, which have often become normalised and accepted among habitual drivers. While this type of messaging was relatable and prompted some discussion among participants, it was not strongly motivational. This was due to the lack of a positive case for public transport as an alternative.
The overall effect of highlighting the drawbacks of car use was to prompt reflection on the stresses and problems of travel in general, especially in a commuting context. Some participants felt that this messaging theme had greater potential as a supporting message or sub-theme paired with messaging which highlighted the benefits of public transport.
There was also some outright rejection of messaging which presented public transport as inherently less stressful than travelling by car. Participants who had negative views of the reliability of public transport often highlighted the stress of late or cancelled services. Buses were also specifically mentioned by participants who associated them with stressful or negative experiences, typically the behaviour of fellow passengers.
“[The FirstBus ad] is quite fun and I like that. But if you’ve ever been on a FirstBus in Glasgow when it’s full of school kids I don’t think you’d say that’s less stressful than driving! (F, 50-59, C1)
Highlighting climate change benefits of reducing car use
While the basic premise behind this core communications proposition was not rejected outright, participants tended to report little motivation to engage in warm-up actions based on communicating climate benefits alone. There was also little impact on attitudes, due to a perceived lack of new information. Participants generally felt that they were already aware of the emissions they were generating by driving, but without a compelling case for the practical and financial advantages of public transport, this knowledge was not sufficient to prompt a change in behaviour.
Figure 16: FirstBus campaign in Glasgow which focused on emissions (Participant submission)
A few participants in the group discussions were defensive on this issue and tended to point out the use of “dirty” fuels in public transport, especially diesel for trains or buses. Highlighting the increasing prevalence of electric buses and trains could help to minimise deflection based on this point.
Highlighting the ease of journey planning using digital tools
This was a proposition which was tested as a way to highlight the convenience of modern public transport. Some of the desk review media examples focused on the ease of use of booking and planning software as a core part of their proposition (see Appendix A). Participants agreed that the widespread adoption of map and journey planning applications on smartphones had made planning easier. However, with almost all participants reporting a high level of familiarity with digital journey planning tools, messaging which focused on this did not present a new, compelling argument to revisit public transport.
Given the familiarity of map and journey planning applications, this was highlighted as one of the easiest and most accessible warm-up actions for public transport use. Participants therefore tended to feel this theme was better suited to being framed as a call to action, rather than a benefit of public transport.
How choice of messenger impacted on communications promoting driving less and using public transport
Industry sources
Although participants often reported low levels of trust towards prominent public transport brands, they remain a key messenger for information about the services they provide. In particular, there was appetite from participants to learn about any improvements to services, which would enable public transport brands to challenge the perception of unreliability, inconvenience and/or poor value for money.
Given the importance of leisure travel as a more achievable call to action for participants, there is also a role here for messengers from linked industries (e.g. hospitality, entertainment). These messengers can help to frame public transport as a default way to get to and from events, reinforcing the idea of leisure travel as a “soft launch” for driving less overall.
Influencers/social media
This type of messenger stood out in the research as a particularly effective option for highlighting the benefits of public transport in a relatable way. The ability of influencers to add a human face and story as a framing device allowed them to circumvent cynicism about public transport. The use of vlogs and similar “real life” techniques helped to model the overarching target behaviour and allowed benefits to be highlighted as part of a lifestyle, with public transport framed as a positive choice.
Government
As material improvements to services and pricing were the most effective framing for a challenge to negative attitudes, government sources are likely to play an important role in communications to encourage more use of public transport. Government messengers were credible sources of information and can help to amplify and highlight any positive stories which have the potential to prompt a re-evaluation of the benefits of public transport.
News sources/PR
Trusted news sources can play a similar role to government, as a channel which allows people to be made aware of positive changes to the public transport offer. Given some participants’ cynicism towards messages which came directly from public transport brands, using media outlets to amplify messaging also has the advantage of presenting information from a neutral third party.
How tone impacted on communications promoting driving less and using public transport
Tones which were effective in promoting driving less and using public transport
Communications seeking to take advantage of improvements to policy or infrastructure to challenge attitudes on public transport were best suited to a factual, straightforward tone. While projecting confidence was important, it was equally important to avoid relying on unqualified claims to minimise cynicism.
For less factual communications, such as social media influencer content, the most effective tone was approachable, confident and inspiring. The idea of trying something new with public transport was one of the most compelling ways to introduce leisure travel to participants. The approachable style used by travel vloggers helped to model the overarching target behaviour and associated warm-ups for the audience while also highlighting key benefits.
Tones which were less effective in promoting driving less and using public transport
Some of the communications examples used humour to highlight the drawbacks of private car travel or the benefits of public transport. The response to this was mixed, and often the most cynical participants were the most dismissive of humour being used in this context. Overall findings indicated that a more matter-of-fact tone offered a less risky approach.
Another tone to avoid was over-confidence, especially when the messenger is a public transport provider. Given the tendency of participants to hold entrenched negative views, there was often a negative response to communications which represented the public transport experience in an idealised or unrealistically positive way.
Conclusions and actionable insights
The role of communications in prompting action across the three behaviour sets
Moments of change are key drivers of action, rather than communications
Across all three behaviour sets, the key finding which could underpin an effective communications strategy is that moments of change and other external factors are the primary drivers of action. Often, communications alone were not sufficient to “bridge the gap” between intention and meaningful contemplation or warm-up actions for people who are concerned about the climate and have the means to take action. Insights showed that communications can play a key role in driving warm-up behaviours by priming the audience to contemplate the overarching behaviour ahead of the next crucial moment. Communications can also be employed to build positive attitudes and beliefs to support the idea that the overarching behaviours are sensible and practically and financially viable.
Communications should look to prime the audience ahead of moments of change, and support this by building positive attitudes
In order to prime the audience ahead of moments of change, our findings indicate that communications should focus on driving social norms. Messaging should position the overarching behaviour as a desirable, everyday option that is being chosen by people across different segments of society. For both EVs and heat pumps, this means shifting the audience’s perception from seeing the overarching behaviour as a potential future norm, towards viewing it as part of the current norm. For the third behaviour set, negative attitudes towards public transport tend to be more entrenched. Communications encouraging driving less and using public transport more need to prompt the audience to re-evaluate their views. Findings indicated that the most effective ways to do this were to take advantage of positive changes to policy and infrastructure, and to encourage the audience to try swapping their car for public transport for one-off leisure journeys.
Reducing emissions was not motivating enough to present as a primary benefit in communications
Although the sample reported a desire to do more for the climate, taking action to reduce carbon emissions was not a strong motivator of warm-up behaviours for these three big changes. Participants were all aware that gas or oil central heating and driving ICE vehicles were significant sources of carbon emissions. They also tended to be positive about the idea of doing more to reduce their emissions. However, practical and financial considerations, along with social norms, were much more effective in prompting consideration of the three behaviour sets.
There was some evidence from the group discussions and interviews that suggested climate benefits could serve as a co-benefit alongside more practical arguments. Messaging on climate benefits could also potentially reinforce the decision to switch to an EV, heat pump or public transport once it is already being strongly considered.
For heat pumps and EVs, the communications should focus on driving social norms and build positive attitudes towards the overarching target behaviours
Both EVs and heat pumps represent infrequent, expensive purchases, which participants associated with the need for extensive personal research to avoid the consequences of making the wrong choice. With an audience who have a strong incentive to engage in warm-up behaviours ahead of their decision, the strategic goal should be to prime the audience, establish the warm-up behaviour as a valid option in each category in advance of the moments of change that prompt action.
The trigger for these warm-up behaviours tends to be a change in circumstance or other event which means the existing product or habit needs to be replaced, or which means that some of the major barriers to adoption are negated. Examples included reaching the end of a car lease agreement for EVs, or the breakdown of a current heating system for heat pumps.
Another important area of focus for communications on EVs or heat pumps should be around building positive attitudes and beliefs and increasing perceived behavioural control of the decision to purchase. This can be achieved primarily by focusing on financial and practical concerns, as these tended to be the strongest barriers to action. Heat pumps in particular were still not fully understood by many participants, which means educational or awareness-building communications will still be required. Similarly, effective communications should look to play a myth-busting role, as the infrequent nature of car and heating system purchases offers opportunities to challenge negative beliefs by highlighting where the offer has improved since the audience last researched the overarching behaviour.
For driving less and using public transport more, communications should focus on challenging existing negative attitudes to prompt a re-think
Because the audience’s attitudes towards public transport were more entrenched, findings indicated that communications to encourage the public to swap driving for public transport should focus on taking opportunities to challenge these attitudes. The most important opportunities to do so are presented by changes to the public transport offer which increase its appeal or contradict beliefs about low value for money, inconvenience or lack of service. In addition to a lack of positive attitudes, perceived behavioural control was often low for this audience, especially among those who believed public transport to be unaffordable or felt their area was under-served.
Participants tended to view driving as the norm and usually drove as a default way to travel for both commuting and leisure. As commuting habits were viewed by participants as much harder to change, supporting communications should look at focusing on leisure travel and one-off journeys. This presents a more achievable call to action and had the potential to encourage infrequent users of public transport to re-familiarise themselves, possibly reducing negative attitudes based on past experience in the process.
Gatersleben, B. & Uzzell, D. (2007). Affective Appraisals of the Daily Commute Comparing Perceptions of Drivers, Cyclists, Walkers, and Users of Public Transport. Available at 10.1177/0013916506294032
Krishna, G. (2021). Understanding and identifying barriers to electric vehicle adoption through thematic analysis. Available at https://doi.org/10.1016/j.trip.2021.100364
Prochaska, J. O., & DiClemente, C. C. (1983). Stages and processes of self-change of smoking: Toward an integrative model of change. Journal of Consulting and Clinical Psychology, 51(3), 390-395. http://doi.org/10.1037/0022-006X.51.3.390
Pamidimukkala, A., Solovyev, V., Prabhakar, A., Kermanshachi, S., & Ghosh, S. (2024). Barriers and motivators to the adoption of electric vehicles. Available at https://doi.org/10.1016/j.geits.2024.100153
Ramos, É. M. S., Bergstad, C. J., & Nässén, J. (2020). Understanding daily car use: Driving habits, motives, attitudes, and norms across trip purposes. Available at: https://doi.org/10.1016/j.trf.2019.11.013 1369-8478/
Rasca, S., & Saeed, N. (2022). Exploring the factors influencing the use of public transport by commuters living in small cities and towns. Available at: https://doi.org/10.1016/j.tbs.2022.03.004
Saleh, H. N., Maupa, H., Cokki, Sadat, A. M. (2025) Factors Affecting the Intention to Buy Electric Vehicles Through Integration of Technology Acceptance Model and Prior Experience. Available at https://doi.org/10.47738/jads.v6i2.730
Xue, Y., Zhang, X., Zhang, Y., & Luo, E. (2024). Understanding the barriers to consumer purchasing of electric vehicles: The innovation resistance theory. Available at https://doi.org/10.3390/su16062420
Barriers and Motivators to the target climate behaviours
Tackling climate change depends heavily on changing human behaviour, as positive individual and collective action plays a major role in reducing harm to the environment. However, driving meaningful behaviour change in the context of climate change can be challenging. Climate-related actions can require immediate effort for long-term benefits, can feel overwhelming due to the vast scale of the crisis, and often involve changing longstanding habits/routines and social norms. Meanwhile, the negative impacts of climate change can feel distant and are easy to ignore – making it easy to postpone behaviour change. Understanding the underlying attitudes and social factors towards climate behaviours can help to bridge the gap between climate communication and climate action.
Below are the barriers and motivators found within the literature for the three separate target behaviours – installing a heat pump, buying an electric vehicle, and driving less and using public transport. Understanding the behavioural, psychological and emotional factors that drive and prohibit these climate behaviours will help us to develop communications to encourage people to take positive steps towards action.
Installing a heat pump
Barriers
Money and cost are the key barriers to retrofitting a home
Generally, it was found that many are worried about the upfront costs of making changes to their homes, while others believe that the running costs of an electric heating system will be too great (Department for BEIS, 2022; Chapman, O., Kapetaniou, C. and Gabriel, M., 2021). In a survey conducted by Nesta (2021), 52% are worried about the upfront costs and just under half of respondents (45%) said that upfront costs are more important than the running costs when considering making changes to their home (Chapman, O., Kapetaniou, C. and Gabriel, M., 2021). However, the recent rise in electricity costs compared to gas does cast some doubt for some, as to whether moving from gas to electric heat pumps would reduce bills (Chitchyan, R., 2025).
Level of hassle/disruption of building work puts people off upgrading their heating system
If people are thinking about upgrading their property, they expect it to be time-consuming and disruptive, as such the ‘hassle-factor’ and inconvenience play a significant role in the low uptake of low-carbon heating technologies (LGA & The Behaviouralist, 2022 & IPPO, 2024). The hassle-factor of installing low-carbon heating is reduced at moments of disruption, such as renovations/refurbishments in the home and moving home (Behavioural Insights Team, 2012). These moments of change have been identified as ideal opportunities to encourage heat transition (The Behavioural Insights Team, 2023).
Individuals can be put off looking into the home heating due to the hassle of having to do the research and make decisions
The effort required to research energy efficiency and green heating measures can put people off seriously thinking about upgrading their heating system (Chapman, O., Kapetaniou, C. and Gabriel, M., 2021). Additionally, a large proportion of people don’t know where to start looking into energy efficiency measures and 34% of people surveyed strongly agreed that it would take a lot of effort to research and manage the installation of new energy efficiency measures (Chapman, O., Kapetaniou, C. and Gabriel, M., 2021). As such, this can be an obstacle to making decisions about installing new heating systems (Chapman, O., Kapetaniou, C. and Gabriel, M., 2021). With this in mind, several research reports have found that most people say they would only replace their heating system when their current one breaks down or becomes difficult to maintain (Caiger-Smith, D. and Amal, A., 2020 & Department for BEIS, 2022). This poses a potential opportunity to encourage a heating change, as an individual will be primed to carry out research and look into replacing their heating system. For those who are considering installing a heat pump, a simple research process is preferred such as a website with a list of links and grant information, a ‘one stop shop’, and a checklist of key points to consider for specific improvements (Chitchyan, R., 2025).
Uncertainty whether some types of homes are suitable for a heat pump
For some, there is a general perception that it may not be possible to install a heat pump in their home (Department for BEIS, 2022; IPPO, 2024). This is a particular obstacle for flat owners, in which people in Scotland are significantly more likely to live in compared to the rest of the UK (Caiger-Smith, D. and Amal, A., 2020). In addition, a common reason cited for not installing a low-carbon heating system is a lack of space for a heat pump/water tank (Caiger-Smith, D. and Amal, A., 2020).
The familiarity of gas boilers deters some from switching to more unfamiliar technologies
The perceived benefits of gas heating, such as reliability, convenience, and ease of use, are a deterrent for switching to low-carbon heating (Chapman, O., Kapetaniou, C. and Gabriel, M., 2021). Those without low-carbon heating systems are generally concerned about the cost and performance of these unfamiliar technologies and would prefer to opt for the familiarity and convenience of a gas boiler (Caiger-Smith, D. and Amal, A., 2020).
There is some scepticism about adopting new technology and a lack of knowledge about heat pumps
Generally, recent evidence has shown that there remains a lack of knowledge and trust in heat pump technology, the installation process, and proposed benefits (E.ON, 2024). People lack understanding about how heat pumps work and some common misconceptions remain. Namely, that they take a long time to heat a home, they can only provide heating, not hot water, and cost more to run (E.ON, 2024). The importance of longevity and whether new heating systems will be ‘fit for the future’ and able to keep up and adapt to new technologies is also a concern for some (Beaglehole, J. and Patel, R., 2016). As such, there is a preference to wait and see how the technology develops over time (Beaglehole, J. and Patel, R., 2016). Additionally, there is scepticism about the supply chain being sufficiently advanced to enable installation, maintenance, and general support to consumers (ARUP & Imperial College London, 2022).
Some consider heat pumps noisy and ugly to live with
A common concern with heat pumps is around noise, including concerns about noise within the home and whether the wider community could be affected by noise pollution (Beaglehole, J. and Patel, R., 2016). It is a common perception that heat pumps are noisy and due to their size, also not that attractive to look at (The Behavioural Insights Team, 2023; Caiger-Smith, D. and Amal, A., 2020).
There is a lack of trust in reliability and independence of advice and providers
When it comes to heat pump installation, a barrier cited frequently within the literature is the inconsistent or overly complex advice, along with low trust in information sources (IPPO, 2024). A consumer survey in Scotland conducted by the Energy Saving Trust suggests that the majority of Scots (65%) do not fully trust the UK Government, Scottish Government or local councils to give impartial advice, often believing that these institutions have hidden or mixed motives (Colley, K. & Craig, T. P., 2014). Furthermore, research conducted by The Energy Saving Trust (2010), found that energy suppliers are amongst the least trusted by the Scottish public, with less than 10% of Scottish households saying they trust energy suppliers.
Motivators
Saving money is a primary motivator
Concerns about energy bills rising are a motivator for people to switch to a more energy efficient and cost-saving heating system (LGA & The Behaviouralist, 2022). Marketing efforts should focus on emphasising any economic savings, comfort benefits and environmental benefits of heat pumps, in that order (Sustainable Energy Authority of Ireland, 2020).
Financial incentives may encourage a switch to low-carbon heating
It was very apparent within much of the literature that money and cost are the main barriers for consumers to install low-carbon heating systems (Chapman, O., Kapetaniou, C. and Gabriel, M., 2021; Beaglehole, J. and Patel, R., 2016 & Colley, K. & Craig, T. P., 2014). Furthermore, upfront costs appear to be considered more important than running costs for the majority of people (Sustainable Energy Authority of Ireland, 2020). As such, incentives for people to switch to green energy (receiving subsidies and grants) can be motivating (Chapman, O., Kapetaniou, C. and Gabriel, M., 2021; Behavioural Insights Team, 2012).
Warmth and comfort are key factors when considering heating systems
Research has shown that, when choosing a heating system, people are less concerned about the long-term running costs and prioritise comfort, familiarity, and reliability (Sustainable Energy Authority of Ireland, 2020). Most consumers focus on the outcomes of a system rather than the system itself, i.e. a warm and comfortable home heated by a system that is easy to run and use (ARUP & Imperial College London, 2022). Additionally, flexibility has been cited as a key characteristic of a heating system; consumers say they want the ability to control the temperature (Beaglehole, J. and Patel, R., 2016; Energy Saving Trust, 2022; & Furtado, J., 2019).
A desire to be energy efficient/protect the environment is a driver for low-carbon heating
Many of those who have installed low-carbon heating already, have been motivated by environmental benefits in an attempt to make their home more environmentally friendly (Energy Saving Trust, 2022 & ARUP & Imperial College London, 2022). Consequently, the top motivators to install a low-carbon heating system relate to energy efficiency and the environment (Chapman, O., Kapetaniou, C. and Gabriel, M., 2021).
Low-carbon technology can improve the value of homes
Research conducted by Savills (2022) (the property firm) found that 59% said they would be willing to pay more for a home if at least 75% of a property’s energy as powered by renewable sources. Further, analysis of average values of homes transacted between 2019 and 2021 shows that newer, cleaner methods of energy have a higher price tag. The same research found that properties utilising community heating schemes demand the highest average prices, followed by homes supplied by heat pumps, and homes that use oil. Property value has been found as a motivator for switching, where 58% of landlords and 36% of homeowners would invest in a heating system that would increase the house price (Sanders, J., 2025)
Visibility of others adopting the technology can be a motivator
The uptake of unfamiliar technologies is usually relatively slow as they are perceived as complex. Carmichael (2019) suggests that peer effects and observing others using this technology or being able to test the technology before investing in it could improve public uncertainty and increase adoption (Carmichael, R., 2019). This allows for better visibility of the costs, benefits, and relative advantages for the consumers’ own home. As such, evidence has shown that peer influence in local communities can encourage more homeowners to retrofit their homes (SEAI Behavioural Economics Unit, 2020).
Buying an electric vehicle
Barriers
Expensive upfront costs make purchasing an electric vehicle unrealistic for some
EVs often have a higher purchase price than ICE vehicles, making purchasing an EV financially challenging for many. These financial barriers are felt more acutely in lower-income households (Pamidimukkala, A., et al., 2024). Interestingly, a YouGov poll found that EV hesitant high-income British consumers are even more likely than average to see the high upfront cost as a deterrent (60%) (YouGov, 2024).
The perceived lack of public charging availability and infrastructure can be a barrier
One of the most frequently cites barriers globally is the lack of, or perceived lack of, sufficiently available public charging stations for electric vehicles (EVs) (Pamidimukkala, A., Solovyev, V., Prabhakar, A., Kermanshachi, S., & Ghosh, S., 2024; Consumer Scotland., 2024). Evidence shows that this is especially apparent in less affluent areas, where infrastructure for electric vehicles is disproportionately unavailable to those living in these areas (Pamidimukkala, A., et al., 2024). Limited access to charging stations reduces public confidence in their ability to use an electric vehicle as flexibility and easily as a non-electric vehicle.
Domestic charging points are often not an option leading to higher charging expenses
The above point, re public charging points, is compounded by the fact that a large proportion of the population would theoretically have to rely on public charging points as domestic charging points are simply not an option for many. It is illegal to run a charging cable along a pavement, meaning only those with driveways or other off-street parking can use domestic charging (Stonehaven, 2025). Additionally, public charging points tend to be significantly more expensive than charging an electric car at home, making electric vehicles less feasible for those in lower socioeconomic groups. Many believe it only makes sense to own an electric car if they had access to cheaper at-home charging stations (Krishna, G., 2021; Consumer Scotland., 2024).
The perceived hassle of owning an EV – driving distance and charging times – compared to a standard petrol car
The limited driving distance of EVs is a common barrier to adoption. Compared to ICE vehicles, most EVs have a shorter driving range, which can lead to concerns or anxiety among potential consumers about the impact on their flexibility and the need to plan ahead for driving longer distances, at risk of being stranded somewhere without charge (Pamidimukkala, A., et al., 2024). In addition to this, many are put off the idea of an EV due to the length of time it takes to charge. As the process of charging an EV is more time-consuming compared to refuelling a more conventional vehicle, the hassle-factor associated with this can be a barrier to adoption (Krishna, G., 2021; Pamidimukkala, A., et al., 2024).
Some experience resistance to adopting new/unfamiliar technology or innovations
There continues to be a reliance on ICE vehicles and the familiarity with the technology. Innovation resistance theory explains the resistance some people feel around adopting new innovative products, services, and technology. People can intentionally refrain from adopting new technologies or products in order to maintain familiarity (Xue, Y., Zhang, X., Zhang, Y., & Luo, E., 2024; Saleh, H. N., Maupa, H., Cokki, Sadat, A. M., 2025). In the context of EV adoption, some of the barriers discussed above, such as concerns over driving range and charging infrastructure contribute to this feeling of discomfort around adopting the new technology.
Motivators
The availability of financial incentives and support can motivate an EV purchase
Financial incentives are one of the key motivators for EV adoption. Purchase subsidies have been found to be one of the most motivating factors for EV adoption among consumers across numerous countries. Similarly, tax reductions, such as road tax exemptions can also be a motivating factor (Pamidimukkala, A., et al., 2024; Consumer Scotland., 2024).
Many are motivated by the lower running costs of EVs
Despite the higher purchase rate, the costs of running an EV are cheaper than that of ICE vehicles. Subsequently, the lower running costs have been found to be the most popular reason for going electric, according to a YouGov poll (YouGov, 2025). The same poll also found the cost of fuel to be highly impactful in people’s decision to purchase an EV.
The reduction in air pollution by purchasing an EV is a motivator
One of the most frequently cited motivators for purchasing an EV is the environmental benefits, and reduced local emissions compared to petrol/diesel cars (Pamidimukkala, A., et al., 2024; YouGov, 2025). Consumers concerned about climate change and motivated by environmental values are more inclined to choose EVs over more conventional vehicles (Naseri, H., Waygood, E.O.D., Patterson, Z., & Wang, B. 2024).
Having access to the infrastructure needed for an EV makes the decision to purchase one more straightforward
For those with the appropriate means, situational factors such as the availability of home charging stations, off-street parking, or nearby public charging infrastructure can act as motivators (Consumer Scotland., 2024). While stability and ease of use in every-day environments increases adoption likelihood (Pamidimukkala, A., et al., 2024).
Social norms and exposure effects of knowing people with an EV can increase familiarity and normality
To overcome resistance to the unfamiliar technology, or those who are more hesitant to switch to an EV, increasing visibility or familiarity with EVs through community charging hubs or car-sharing programmes have been found to foster normalisation and uptake (Pamidimukkala, A., et al., 2024). Previous experience of driving an EV increases the likelihood of preferences for EVs (Naseri, H. et al., 2024; Saleh, H. N., Maupa, H., Cokki, Sadat, A. M., 2025). Furthermore, knowing someone with an EV, e.g. friends or family, can be a motivating factor as it increases the familiarity with the new technology. This can reduce apprehensions around some of the barriers identified such as driving range and charging time.
Driving less and switching to public transport
Barriers
Driving can be a largely habitual behaviour for some that can be challenging to break
Due to its convenience, driving can be a habitual behaviour. Using the car for routine journeys tends to be an ingrained habit that can be difficult to change, as people don’t tend to think about their routine/partly sub-conscious behaviours. Additionally, research has shown that people who use the car frequently tend to neglect alternatives modes of travel (Ramos, É. M. S., Bergstad, C. J., & Nässén, J., 2020).
The perceived low cost of a car day-to-day can be a motivator to use compared to public transport
Although people are aware that owning a vehicle is expensive, the day-to-day costs of running a car are usually absorbed into regular outgoings. As such, some feel that using a car on a daily basis feels free, especially when travelling short distances where a tank of petrol can last for a long time (Possible, 2022). The rising cost of public transport on the other hand, can be a deterrent. Research commissioned by Campaign for Better Transport found that 97% of drivers want cheaper rail fares (Campaign for Better Transport, 2023) and in a separate survey, that 71% of people said cheaper train fares would make them more likely to travel by train Campaign for Better Transport, 2025).
Public transport can be unreliable and more of a hassle to use compared to cars
Public transport can be much more unreliable, compared to other methods of transport, making using public transport less convenient and harder to rely on for many (Scottish Centre for Social Research, 2010). For example, many have experienced delays and cancellations when using the train and the timings not always convenient (Possible, 2022). Other hassle-factors involved in using public transport such as route planning where individuals need to know the stop to get off at and the timing of either the bus/train, and can also put people off, opting for the ease and familiarity of the car.
Cars can feel safer, comfortable and more convenient than public or other modes of transport
Although people are aware of the risks of driving a car, the safety of a car was especially felt after dark by women and for those with children, where public transport can feel less safe (Possible, 2022). Research has shown that women often list safety concerns as a barrier using public transport (Consumer Scotland, 2024). The convenience of a car is also a strong barrier to switching to public transport for some journeys – as distances increase, public transport becomes less convenient and more time-consuming (Rasca, S. & Saeed, N., 2022). The perceived reliability and convenience of being able to use a car whenever necessary, with little thought is a key reason people use a car over other means of travel (Possible, 2022). Overall, many feel that having a car saves them time and makes life generally easier as it allows people to predict journey times more accurately and travel whenever needed. For those with babies or young children, a car is a safe space which can be used for napping, breastfeed, and managing the logistics of travel with essential items such as prams, and changing bags (Possible, 2022). The refuge of a car can feel important, compared to busy buses or trains.
Motivators
Taking public transport can make commuting less stressful and more relaxing
For many, experiences of unsafe driving from other drivers, congestion, and unexpected diversions can make travelling by car a stressful experience (Possible, 2022). Studies have found that car commuters find their journey more stressful than any other mode of transport (Gatersleben, B. & Uzzell, D., 2007). Evidence shows that taking public transport is significantly less stressful, second only to active modes of travel (Gatersleben, B. & Uzzell, D., 2007). Taking public transport frees up time for other activities such as reading a book, working, or just relaxing. In addition, in many areas, public transport can also be the quicker option with fast-track lanes for buses and quick trains, avoiding traffic and congestion.
Owning a vehicle is more expensive overall than travelling by public transport regularly
Ultimately, owning a vehicle is expensive, and although driving can feel free on a day-to-day basis, the cost of owning a car does add up when including petrol, insurance, tax, monthly payments, parking etc. Public transport costs significantly less than owning and operating a car. Going Car Free (Possible, 2022) is a study which followed ten people who trialled going car free for three weeks without significantly changing their routine and everyday commitments. The findings suggest that public awareness needs to be raised on how comparatively expensive car ownership is, alongside societal and environmental costs of private car ownership.
People can be motivated for environmental reasons to reduce their car use and opt for public transport
Environmental concerns were not found to be a key motivator for switching to public transport. However, protecting the environment has been cited as a co-benefit to reducing car use and using public transport more frequently (Consumer Scotland, 2024). Evidence shows that the majority of Scottish consumers would like to reduce their carbon emissions by using more environmentally sustainable public transport methods, however face significant barriers to doing so, are unsure of how to do so, or are unconvinces that their behaviour changes could have an impact (Consumer Scotland, 2024).
Framing of target associated warm-up behaviours in public communications
The below observations are taken from a selection of recent public-facing communications about each of the three target behaviours. Key messages are set out for each target behaviour alongside an analysis of the tone, call to action and choice of messenger.
Themes across all three behaviours
The urgency of earlier comms has been replaced by a lighter persuasive tone that emphasises personal choice
In our 2020 analysis of communications on climate change, a major theme in the messaging from government, media and academic sources was urgency. Climate change was often framed as a “climate emergency” and parallels to the Covid-19 pandemic were used to advocate for immediate action to cut carbon emissions at scale (ClimateXChange, 2020).
The overall tone of the more recent communications reviewed as part of this paper contrasted with this. The reviewed communications typically present the benefits of target behaviours in a more neutral, factual tone. This less emotive tone lends itself to a more rational framing of choices, encouraging consumers to weigh up their options and make the right choice for them. While climate benefits are still very much part of the messaging toolkit, they are presented as one of many reasons to engage in target behaviours rather than an overriding urgent concern.
Climate benefits are often presented as a co-benefit, as communications focus on the practical or financial benefits of target behaviours at a personal level
While the reviewed communications often included messaging on climate benefits, these were not typically presented as a primary reason to engage in a target behaviour. Instead, financial and practical benefits such as cost savings, convenience, and health benefits.
Comms often seek to create a sense of changing social norms, with high emission options being “phased out” and low emission technology growing in popularity
A prevalent theme across communications for all three target behaviours was around changing social norms, with the target behaviour positioned as a future norm, in opposition to the outgoing high-emission option. This enables communications to frame behaviours which are currently the norm, such as buying an ICE vehicle ownership or gas boiler, as outdated in comparison. This tends to be supported by messaging around legislation, messaging which highlights new or improved technology associated with low-emission options, or messaging which points to increasing demand for low-emission options.
Messaging is often framed around prompting reconsideration, tackling pre-existing beliefs about the drawbacks of low carbon options, and/or highlighting the pain points associated with high emission choices
Another common communication theme across each of the target behaviours was around prompting the audience to reconsider low-emission choices. Often, this took the form of myth-busting, with messages focusing on challenging beliefs about target behaviours which could pose a barrier (such as the belief that of EVs or heat pumps were more expensive to run than fossil-fuelled equivalents). There were also some communications which focused on emphasising the pain points and disadvantages of higher-emission choices, especially private ICE vehicle ownership.
Communications observations: Installing a heat pump
Communications around heat pumps tended to include basic educational information in order to improve awareness and understanding of how the systems work. The messaging tended to be focused on mitigating financial and practical barriers, and on enhancing the appeal of motivators such as financial support and reliable performance.
Barriers addressed by communications
Lack of consumer understanding about heat pumps (e.g. air source vs ground source, suitability for climate)
Up-front cost of installation is high
Gas boilers may still be cheaper to run due to electricity prices
Process (determining whether a heat pump is the right option, applying for grants, additional home upgrades may be needed) seems long and complex
Motivators addressed by communications
Financial support is available from the government to help with installation costs
Heat pumps have very high rates of customer satisfaction
With the right tariff, heat pumps can be cheaper to run than fossil-fuelled systems
Some heat pump manufacturers can handle the whole process from start to finish
Heat pumps are very energy-efficient, and have no direct carbon emissions
Communications on heat pumps are still looking to educate the public on the basics of the technology
Communications from government (UK Government, 2025), manufacturers (Octopus Energy, 2025) and consumer advice organisations (Money Saving Expert, 2025) were often presented as a primer or beginner’s guide. In addition to highlighting the benefits, information online often opened by offering a basic explanation of the technology, including types of heat pump system, how they work, and why they are considered to be a more climate-friendly option. An element of myth-busting is often present, challenging misinformation which makes heat pumps seem less attractive. For example, the belief that they are unsuitable for winter weather in Scotland.
In comparison to communications about electric vehicles, which tended to assume more knowledge on the part of the audience, this indicates that educating potential owners is still a priority for these information sources. Often, interactive tools were presented as part of this, as a way to simplify the process of learning whether a heat pump would be suitable for the audience’s home.
Financial support from government remains a key message to promote heat pumps
One of the core messages which was used to promote heat pumps across all reviewed sources was the availability of significant support from the UK and/or Scottish government, in the form of grants or interest-free loans. Eligibility for these financial incentives is often presented as a key factor to consider when exploring whether to install a heat pump at home, and as a major benefit to acting on an intention to install. This messaging is often framed as a counter to the high up-front costs of installation, which can otherwise be a barrier to further action.
A recent national news article from the BBC explicitly linked the UK Boiler Upgrade Scheme (BUS) to a large increase in demand for heat pumps nationwide (BBC, 2025). This also enabled the story to present heat pumps as a potential future norm, with demand increasing year on year.
Figure 17: BBC News article headline highlighting high uptake of the UK Government heat pump grant
Messaging around cost savings is prevalent, with pro-heat pump sources re-framing this as including maintenance
The other main financial incentive presented in communications is around running costs. While some sources acknowledge that current energy prices mean utility savings potential may be limited, messaging on the benefits of heat pumps often highlights potential for savings versus older and less efficient systems.
Consumer information provider Money Saving Expert created web content encouraging readers to compare the cost of running a heat pump against a range of other options, highlighting that older models of boiler and other heat sources like electric storage heaters, LPG and oil boilers may be more expensive to run (Money Saving Expert, 2025).
Switching to a heat pump is often presented as a high involvement decision in communications
Communications on heat pumps tend to present the decision to switch to a heat pump as a highly involved process which requires multiple factors to be weighed up. The key factors mentioned are typically suitability of the building itself, the type of heating system currently installed, age and specifications of radiators and water tanks, and eligibility for funding support.
Online content often features quizzes, checklists or interactive tools intended to streamline this process. These online tools are a warm-up behaviour which features frequently as a call to action. (UK Government, 2025)
Figure 18: gov.uk heat pump suitability checker
One large UK manufacturer has made reducing the administrative burden of heat transition a key part of their messaging.
The energy supplier Octopus has recently entered the heat pump market with an “all in one” product/service offer (Octopus Energy, 2025). A prominent message in their promotional communications has been around the lack of third-party involvement in the process, with the manufacturer providing survey, design, installation and also offering to apply for funding support on behalf of the customer. This core communications proposition may be worth exploring further with research participants as the time cost of the decision-making and administrative process involved in getting a heat pump has been identified as a potential barrier.
Some communications are making use of “real people” as messengers, inviting their audience to hear from lived experience
Figure 19: Octopus Energy promotional communications
Both the UK government and Nesta have opted to use people who already own a heat pump as messengers for some of their communications. The UK Government’s energy efficient home campaign features video and text-based testimonials from heat pump owners with different housing types and lifestyles speaking about how they made their decision and speaking positively about the installation process and experience of living with the new system (UK Government 2025a). Nesta have taken a more grassroots approach to peer messengers, setting up a service which connects people considering a heat pump with nearby people who already have one (Nesta 2025). This enables local people to act as champions for heat pump systems.
Figure 20: Nesta heat pump visit process
Both of these approaches help to build a sense of social norm, by making the behaviour more visible to those who are considering it. Visiting in person, or seeing video content of homes with heat pumps, is aimed at boosting familiarity with the technology to enhance motivation.
Narratives around consumer satisfaction are being highlighted to emphasise the positives
Data from heat pump owners has suggested higher rates of consumer satisfaction in comparison to gas boilers (MCS Foundation, 2025). This has enabled a narrative around consumer satisfaction to be presented in communications, such as the UK Government’s “Warm and fuzzy” campaign (UK Government, 2025). This narrative combines benefits such as reliability, cost savings and low emissions to present heat pumps as an attractive option.
Climate benefits of heat pumps are often de-emphasised in communications
While reduced emissions versus older fossil-fuelled systems are still frequently mentioned across reviewed sources, this is seldom presented as the core benefit of installing a heat pump. Instead, more practical, individual benefits such as cost savings, financial support, and reliable heat generation tend to be highlighted as key messages. Overall, this feeds into the wider framing of heat pump installation as an involved, rational decision which requires a range of factors to be considered, rather than a more emotional choice based on the urgent need for climate action.
Calls to action
The calls to action for heat pump communications tended to focus on warm-up behaviours, typically those linked to information gathering rather than more practical actions such as booking a survey visit.
Explore financial incentives like grants and interest-free loans from the government
Use an online quiz to find out how much it could cost to install a heat pump in your home
Find a local tradesperson who can give you an installation quote
Find out if your home is ready for a heat pump, or if other steps (like insulation or radiator upgrades) need to be taken first
Use a service that lets you arrange a visit with someone near you who has a heat pump to ask questions first-hand
Compare energy tariffs to see whether switching away from gas could save you money
Watch video content of people who own a heat pump to see what their experience was like
Communications observations: Buying an electric vehicle
Electric vehicle communications tended to position EVs as modern and innovative. Messaging often sought to address barriers which were linked to the performance of older models (such as the perception of limited range), and to present EVs as a “norm in waiting” that was rapidly replacing ICE vehicles.
Barriers addressed by communications
EVs still perceived as an expensive luxury item
Range of EVs can be seen as too short for people who drive longer distances, or who commute every day
Charging infrastructure for EVs is still developing
Motivators addressed by communications
EVs are quiet and offer a great driving experience
EVs are modern and innovative
Many EVs come with extra entertainment and safety features
With the right electricity tariff, home charging can be cheaper than running a petrol/diesel car
Financial support is available from the government and industry to subsidise home charging
Some makes and models of EVs are now available at similar prices to a new ICE car
Some manufacturers are re-framing EVs as an affordable choice, rather than a luxury product
While luxury is still a prevalent theme in some promotional campaigns for EVs, it is typically associated with products at a higher price point, such as Tesla. However, some manufacturers who are more recent entries to the UK market appear keen to make value for money a key part of their proposition. MG launched a mid-sized fully electric SUV in 2022 with a campaign which presented their product as affordable and accessible, while still emphasising modern technology and features (M3 Agency, 2022). The campaign was built around the idea that “Electric is for everyone” with messaging which highlighted the price point, range, and features such as wireless phone charging. Similarly, Dacia’s communications promoting the Dacia Spring describe it as “Europe’s most affordable new electric car” (Dacia UK, 2024)
Figure 21: Advert for a new MG Electric Vehicle
Figure 22: Which? EV quiz results (2025)
Pro-EV sources are keen to challenge the belief that limited range is still a problem
The improved range of current-generation EVs is a prevalent theme in promotional communications from manufacturers and consumer organisations. Communications tend to mention the range a car can cover on a single charge. Often, prospective buyers are encouraged to consider their daily or weekly driving habits, with the message that an EV will often be able to cover a typical week of driving with a single battery charge.
An example from Energy Saving Trust, an organisation focused on supporting energy efficient decisions to reduce emissions, uses an interactive online quiz to help potential EV owners to consider key factors before making a purchase. The quiz offers tailored messaging to users. Even if the largest possible values for weekday (over 25 miles per day) and weekend (over 200 miles) driving distance are input, the message is still that modern EVs have sufficient range to be a good fit (Energy Saving Trust, 2025)
Framing EVs as an incoming norm is a common promotional message
Manufacturer communications often frame EVs as being innovative and technologically advanced. Often, this is part of a wider framing which positions EVs as a new norm which is replacing the existing norm of ICE vehicles. Online promotional communications from the EV manufacturer Cupra frequently emphasise the growth of the electric car sector (Cupra UK 2025). The technology behind the vehicles is described as constantly improving, alongside the associated infrastructure.
Comparing maintenance costs between ICE and EVs is often positioned as a factor in decision-making
Pro-EV sources often make the claim that due to the reduced number of moving parts, EVs are often cheaper to maintain and repair than their ICE counterparts (Volkswagen Ireland 2025). While more neutral sources such as consumer organisations have questioned this claim, the overall effect is to encourage potential EV owners to consider the difference in maintenance needs versus an ICE car (Which?, 2025).
Communication on EVs often focuses on availability of charging infrastructure as key to making a purchase decision
Another key factor which is commonly presented as an essential part of the decision between EVs, and other options is access to charging infrastructure. Consumer guide Which? published an FAQ-style online guide for people who were considering purchasing an EV. The guide recommends charging at home or at work, if possible, due to the convenience and potential cost savings, and points out that relying on public charging points may be costlier than refuelling a petrol-powered car.
EV manufacturers such as Volkswagen also tend to present charging infrastructure as an important consideration. The landing page for EVs made by Volkswagen in Ireland offers a digital route planner tool which allows potential customers to visualise the availability of charging points on familiar journeys (Volkswagen Ireland, 2025). This tool helps to increase perceived behavioural control by enabling users to plan out how an EV would fit into their lifestyle before committing further.
Quiet/smooth running is positioned as a key advantage over ICE vehicles
EV manufacturers often highlight the fact EVs offer a less noisy or “smoother” driving experience in comparison to ICE vehicles, due to the lack of engine noise and automatic transmission (Cupra UK, 2025) (Tesla, 2025).
Figure 23: Description of EVs being smoother and quieter than traditional vehicles
Some communications are making use of “real people” as messengers, inviting their audience to hear from lived experience
Some EV manufacturers make use of a more authentic messenger by using real customers as spokespeople. Volkswagen UK’s “Your Volkswagen Stories” is an interactive online promotional campaign which features 14 video case studies from UK customers who chose an EV (Volkswagen UK, 2025). The choice of messenger reflects a diverse mix of lifestyles and stages (such as families with multiple children or a retired couple).
The campaign often includes a narrative of sceptical people being pleasantly surprised by the performance and overall driving experience of owning an EV. One example features an older couple based in Argyll and focuses on reliability and range as key selling points, for people travelling to and from rural areas. This framing enables EVs to be presented as a credible solution for a variety of audience segments who may be less likely to consider one.
Figure 24: An example of Volkswagen UK’s “Your Volkswagen Stories”
Climate benefits of EV ownership are often de-emphasised in communications
While communications about EVs frequently mention climate benefits such as zero direct carbon emissions, these are typically presented as a co-benefit, with performance, range, running costs, reliability and extra features more likely to be the primary focus of persuasive messaging. Often “above the line” communications such as advertising omit climate change messaging altogether. TV/digital advertising for Tesla (2025) and MG (2022) neglected to mention emissions or climate benefits entirely, positioning their products as a sensible choice for consumers rather than an environmental necessity.
Calls to action
EV manufacturers tended to focus on booking test drives or planning behaviours (such as interactive maps of charging stations). Consumer information sources were more likely to signpost to further information instead, or to direct the audience to interactive tools to guide them through the decision-making process.
Book a test drive of an EV
Take an interactive quiz to see if an EV is right for you
Use an online route planner to explore charging stations along your typical driving routes
Explore different models and specifications of EV to see which works best for you
Use a calculator tool to see whether an EV would be cheaper to run than an ICE vehicle
Explore financial incentives, like salary sacrifice schemes or grants to install home charging
Watch video content of people who own an EV to see what their experience was like
Communications observations: driving less and using public transport
Communications looking to encourage less driving and greater uptake of alternatives like public transport often focused on re-framing driving. Existing beliefs about the convenience and freedom of private car use are challenged, while communications also highlight practical advantages of alternatives.
Barriers addressed by communications
Private car use is perceived as offering personal freedom compared to sharing space on public transport
Private car use can be convenient as it enables door-to-door travel
Some people may not be able to access public transport easily
Driving may be quicker than alternatives
Public transport may be seen as cheaper than fuel costs for driving, especially on a journey-by-journey basis
Motivators addressed by communications
When maintenance, parking and fuel are factored in, public transport is often cheaper than driving over a longer period of time
As a passenger on public transport, you have free time to do whatever you like, instead of focusing on driving
Public transport can get passengers straight into town and city centres quickly and efficiently
Using public transport avoids the stresses associated with driving, like aggressive drivers and traffic jams
Multi-modal transport can help reduce the amount you drive and reduce geographic barriers
Active travel instead of driving has health and wellbeing benefits
Messaging often sought to challenge the belief that private car travel offers more personal freedom than public transport
A common theme in public transport promotional communications is around deconstructing the belief that travelling in a private car allows more personal freedom than shared travel options. Messaging may point out how certain aspects of private car travel which can limit personal freedom (such as having to concentrate on driving for the entire journey or having to find and pay for parking) have been normalised. The audience is prompted to consider whether an option such as bus or train travel could give them more control over how they choose to spend their journey.
Rail operators such as ScotRail (2025) and LNER (2024) have both focused on “freedom” as a theme in recent advertising campaigns targeting both commuters and leisure travellers. Both campaigns highlight the ways rail travellers can choose to use their journey time for work or leisure.
Figure 25: FirstBus #CarFree campaign materials
FirstBus (2024) ran a multimedia campaign in Glasgow which challenged the normalisation of private car travel with a creative concept based on a support group for “car addicts”. The campaign used humour to highlight the normalisation of negative aspects of driving, including expensive parking, road rage and high carbon emissions.
Messaging on cost encouraged drivers to consider wider costs of car ownership and longer periods of time
Public transport campaigns encouraged consumers to consider the savings offered by public transport over multiple journeys. ScotRail (2025) highlighted multi-journey savings, while FirstBus (2024) encouraged their audience to factor in other costs of driving, such as repairs, maintenance and parking, when comparing with public transport.
Figure 26: LNER promotional comms to choose the train
Public transport was often presented as a convenient option with direct access to city centres
Another frequent core communications proposition which enables public transport to be compared favourably to private car travel was convenience. Rail and bus operators highlight the frequency of services on major routes and the option to travel directly to town centres as an advantage (LNER, 2024) over both private car travel and flying.
Highlighting the stress of driving was a common message aimed at commuters
Related to the idea of challenging the perceived freedom of private car travel, this core communications proposition was focused more on the stresses of modern driving. Traffic delays and stressful encounters with other motorists are highlighted, with public transport presented as an alternative free from these issues. It encourages reflection on the stresses of driving and potentially primes the audience to consider a switch away from private car travel in future moments of stress. This core communications proposition featured in the ScotRail (2025), LNER (2024) and FirstBus (2024) campaigns.
Active travel is promoted as an alternative to driving with additional health and wellbeing benefits
Choosing to walk, wheel or cycle instead of driving is frequently promoted using a health and wellbeing framing. Messaging focuses on the benefits of fitting in more physical activity to overall health as well as mood and mental health. Campaigns such as Transform Scotland’s “A Wee Walk Works Wonders” (Transform Scotland, 2024) often incorporate this type of health and wellbeing framing, alongside messaging around saving money and reducing emissions.
Evaluation of the campaign found that the messages which highlighted health benefits and the fact that only a brief walk can make an impact were more memorable to audiences. Just over 6 in 10 (63%) of evaluation respondents spontaneously remembered the health and wellbeing message, whereas around 1 in 10 (11%) remembered the messaging around benefits to the climate (JRS, 2024)
Digital meetings are sometimes framed as an alternative to driving, which could prompt resistance to other target behaviours
Communications created by the Energy Saving Trust presents public transport and active travel as part of a hierarchy, with air travel and ICE vehicle travel as the most environmentally harmful (Energy Saving Trust, 2024). This notably includes digital communication (e.g. video calling) and presents this as being the least impactful option on the climate.
Figure 27: Active travel hierarchy from the Energy Savings Trust
While the overall narrative supports public transport and active travel as sustainable choices, and their online content highlights benefits of both, the idea that digital communication is also an alternative to travelling in person could potentially lead to online meetings or similar being viewed as competition to the target behaviour.
Multi-modal transport is presented as a way to reduce emissions, save money and fit in additional exercise
Another messaging theme which can reduce perceived barriers to driving less is multi-modal transport (such as park and ride schemes). Messaging encourages people who usually drive to explore ways to combine public transport, active travel and private car travel in order to reduce the amount of time they spend driving in favour of other options (Energy Saving Trust, 2024). This is presented as a way to mitigate geographic barriers (e.g. lack of access to public transport) as well as an option for those looking to try active travel without committing to long distances walking, wheeling or cycling.
Calls to action
Communications promoting public transport as an alternative to private car travel were often more direct in their calls to action than EV or heat pump communications. Frequently the main call to action was simply to try using public transport.
Try taking the train for leisure travel as well as commuting (or vice versa)
Use a route planner to find out how easy it could be to get to work with alternate transport
Compare pricing to find out whether public transport would be cheaper than driving (and parking) every day in a private car
Consider what you might be able to do with the free time on your commute if you went by public transport instead
– Hypotheses – message themes/territories
The following tables contain the list of hypotheses associated with each of the three behaviour sets. Each theme represents a particular message or idea intended to prompt consideration or warm-up action on the overarching target behaviour. These were developed from the desk research findings (see Appendix A). They served as a checklist to ensure media examples being considered for use in stimulus covered a broad range of themes and messages, and were also used to underpin development of the discussion guides and homework tasks.
Heat Pump
Messages /comms themes FOR Getting a Heat Pump
Saving money on heating bills
Financial incentives/ grants to switch to low-carbon heating
Quality of warmth and comfort from a heat pump
Reliability of heat pumps
Energy efficiency- protecting the environment through low-carbon heating
Low-carbon technology can improve the value of homes
Seeing that heat pumps are becoming more popular
Expecting gas heating to be phased out over the next few years
Installers can take care of all necessary work- making it easy to get a heat pump
There are benefits for the environment
Messages /comms themes AGAINST Getting a Heat Pump
Money and cost of the installation and retrofitting a home
Hassle/disruption of building work required
The hassle of having to do the research and make decisions
Being unsure if your home would be suitable for a heat pump
The familiarity of gas boilers over unfamiliar heat pumps- just don’t know enough about heat pumps
Scepticism about adopting new technology and whether it will work as advertised
Concerns about heat pumps being noisy and ugly
Lack of trust in reliability and independence of advice and providers
Concerns about the running costs compared to gas boilers
Electric vehicles
Messages /comms themes FOR Getting an Electric Vehicle
Financial incentives and support to buy an EV
The lower running and maintenance costs of EVs
Costs of EVs are coming down
The reduction in air pollution and helps the environment
Having clear access to the infrastructure needed for an EV
The range of EVs has improved a lot in recent years
Seeing that more and more people are getting EVs
Expecting petrol and diesel cars to be phased out over the next few years
Messages /comms themes AGAINST Getting an Electric vehicle
Expensive upfront costs
Lack of public charging availability
Domestic charging points are often not an option leading to higher charging expenses
Hassle of owning an EV – driving distance and charging times – compared to a standard petrol car
Nervousness about unfamiliar technology
Public Transport More Car Less
Messages /comms themes FOR Using Public Transport more and Your Car Less
Taking public transport can make travel (esp. in busy times) less stressful and more relaxing
Being able to make use of your journey time instead of having to concentrate on driving
With modern apps it is easier to plan journeys through public transport than ever
Scrapping of peak fares making rail travel cheaper at key times for commuting
Owning a vehicle is more expensive overall than travelling by public transport regularly
Environmental reasons to reduce car use
Messages /comms themes AGAINST Using Public Transport more and Your Car Less
Difficulty of breaking the habit of using the car- as car is part of daily routine
Low cost of a car day-to-day
Justifying the upfront cost of a car by using it
Unreliability of public transport
Hassle of using public transport compared to cars
Cars feel more comfortable and more convenient than public transport
– Methodology
ClimateXChange commissioned JRS to undertake this research. The work was split into four sequential phases:
Desk Research – reviewing existing evidence and communications encouraging people to take steps towards installing a heat pump, buying an EV, and/or using public transport more and driving less. This phase of the research was not conducted as a full academic literature review. It was a rapid evidence review that served to identify existing literature, evidence, and media and communications examples which could form the basis of the primary research. Particular focus was placed on:
Key barriers and motivating factors related to the key climate actions identified to prompt positive climate behaviours within similar audiences
Behavioural theories that help us to explain inaction to climate change and how these can be used to prompt change
The effect of different communications, i.e. what works and does not work to motivate positive climate action, looking at message framing and content
The resources were identified through discussion with the steering group and independent online searches. Online searches utilised Google Scholar for academic literature, and Google Search for media and messaging examples. The research team also had access to an existing bank of background materials accumulated over prior projects relating to communicating on climate change, and selected some sources for review directly from this. Scholar searches employed a range of climate change focussed search keywords/phrases including: ‘climate communications’, ‘climate action’, ‘intention-action gap’, ‘pluralistic ignorance’, ‘climate behaviours’, ‘climate action communication campaigns’, ‘climate action tipping points / moments of change’. Resources were drawn from current and recent (mostly from 2020 onwards) national and local Government publications and communications, research from academia, communications from third sector organisations, UK media articles, and communications / promotional material from organisations within the energy, car and transport industries.
An analysis framework was drawn up to identify key insights in relation to climate communication, messaging and framing and its impact on prompting people to take warm-up behaviours as the first steps toward larger changes in how they heat their homes and travel. The framework was populated using the following process:
Search conducted Google Scholar using selected keywords for academic sources. Compiled initial long list of media and communications examples using Google Search.
Supplementary sources were added from the research team’s existing bank of literature
Abstract and conclusions from each academic source were reviewed to filter out less relevant sources
Remaining academic sources were reviewed in depth to produce the final selection of 21
Final media and communications examples were selected based on relevance to insight from the selected academic sources
The findings were used to develop and refine a set of hypotheses about the potential effect of a range of message territories associated with of the core behavioural areas of focus. These provided a foundation for testing with research participants in the primary research (see Appendix A)
Qualitative research – to better understand consumer attitudes, beliefs and behaviours around the three target area behaviours and how communications can help encourage people to undertake warm-up actions / steps towards these target behaviours. A total of 6 online 90-minute group discussions took place, attended by 30 participants.
In the discussion groups, participants were asked to reflect on a range of past and current communications related to the three target behaviours, their attitudes towards these actions, what and where their moments of change would be for undertaking next steps/warm-up behaviours and the potential impact/efficacy of the hypotheses/ message territories developed from the desk research.
Sample
The sample focussed on people who agree that it is important to take climate action; are willing to take more action than they currently do; and state that money or other practical barriers do not present a meaningful barrier to them taking more action.
Specifically, the groups were set up to ensure that all respondents:
Had not seriously undertaken any of the core warm up behaviours in relation to one of the three core behaviours (installing a heat pump, buying an EV, and/or using public transport more and driving less)
In each group, had not seriously undertaken any of the core warm up behaviours in relation to at least one of the other two core behaviours
In this context, warm-up behaviours include:
Talking to friends/family/colleagues about the behaviour and or campaigns in relation to the relevant behaviour
Visiting relevant websites or comparison tools – either to take the relevant action or to determine if there is financial support available through government schemes in relation to the relevant behaviour
Doing further research on the topic of the relevant behaviour
Taking any other concrete steps towards the shift in behaviour
In addition to these behavioural aspects, the sample considered a mix of age, ethnicity, lifestage and urban versus rural living.
Group 1 – Heat pump
male/female mix
younger- 25-49yrs (pre kids/pre-teen kids only)
all to qualify for heat pump discussion
and to qualify for at least one of EV or drive less discussions
Group 2 – Heat pump
male/female mix
older- 50-75yrs (teen or older kids/no kids/empty nester)
all to qualify for heat pump discussion
and to qualify for at least one of EV or drive less discussions
Group 3 – EV
male/female mix
younger- 25-49yrs (pre kids/pre-teen kids only)
all to qualify for EV discussion
and to qualify for at least one of heat pump or drive less discussions
Group 4 – EV
male/female mix
older- 50-75yrs (teen or older kids/no kids/empty nester)
all to qualify for EV discussion
and to qualify for at least one of heat pump or drive less discussions
Group 5 – Drive less/public transport more
male/female mix
younger- 25-49yrs (pre kids/pre-teen kids only)
all to qualify for drive less/pt more discussion
and to qualify for at least one of heat pump or EV discussions
Group 6 – Drive less/public transport more
male/female mix
older- 50-75yrs (teen or older kids/no kids/empty nester)
all to qualify for drive less/pt more discussion
and to qualify for at least one of heat pump or EV discussions
Inclusiveness across sample:
recruited from across Scotland- urban and rural (note- it is unlikely that the very rural parts of Scotland will be represented much)
include target 5 me respondents
A two-part homework task
Research participants from phase 2 were asked to:
Reflect and think about what they’d been shown and discussed in the focus groups and how that made them think about the target and warm-up behaviours
Each group of participants were asked via an online survey -to reflect over a three-day period about the core behaviour sets/behaviours they had been discussing in their focus groups then fill out questions to probe their subsequent interest, desire, and motivation towards undertaking any next steps / warm up behaviours. The idea was that this would encourage respondents to stay at the moments of change created within the group discussions and to deeply consider relevant motivations and barriers at societal/collective; practical/rational; and individual emotional levels.
Then, a week after the first task, respondents were asked to consider taking warm-up actions for two behaviour sets – again via an online survey – and record their experience and thoughts on:
what they might/would do as a result of these actions
the associated communications and information encountered as part of the warm up actions
other communication examples encouraging warm up/key behaviour actions.
This homework task was designed to probe the role and potential impact/ efficacy of communications / communication elements.
In depth – 60 minute online – interviews with each of the research participants
These probed in detail their reflections on the whole research process – on what works and what does not work in climate communications and other relevant marketing in connection with each behaviour and associated warm-up actions. The discussions looked specifically at messaging content and framing; tone, style, and imagery; and who are relevant, credible and trusted messengers.
There were 27 people who participated in the homework and depth interviews:
Analysis
Client discussion and the findings from the desk review were used to develop:
A set of hypotheses for each of the three core behavioural areas of focus. Each hypothesis consisted of a statement about the potential for a particular message or proposition to prompt contemplation or action
The required discussion/topic guides, homework tasks and supporting stimulus material.
As each research phase progressed and moved to the next, the JRS research team followed a staged approach to analysis, with each moderator reviewing and analysing their own groups before coming together to discuss and synthesise findings.
How was ‘data’ gathered from participant reflections analysed?
At both stages of homework, participants’ notes were returned to JRS via an online survey platform, using WhatsApp or email
These were then distributed to the relevant researcher who undertook the final stage depth interview with the participant
From this, the individual JRS researchers supplemented their version of the hypotheses grid with insights gathered through the homework.
The JRS research team then came together to share their learnings from the initial group discussions and the homework exercise. The central hypotheses grid was then updated by the project lead, with all insights gathered.
This updated hypotheses grid was shared with the client team to provide the starting point for development of the topic guide and stimulus materials for use in the final stage of the primary research (depth interviews).
Use of Behavioural Theory
Throughout the research process we used behavioural theory to help us reflect on and analyse our findings. We used the:
Stages of Change Model (Prochaska & DiClemente, 1983) to help us think about where participants were on their journey to adopt a behaviour / undertake a warm-up action.
Theory of Planned Behaviour (Ajzen, I., 1991) to understand how different potential communications and messaging would affect participant attitudes, subjective norm and perceived behavioural norms and therefore their intention / likelihood to adopt a behaviour / undertake a warm-up action.
See Appendix D for a full explanation.
Research limitations
In the desk review, observations and insight were drawn from 21 resources. This was a short exercise to find and review relevant communications encouraging people to take steps towards installing a heat pump, buying an EV, and/or using public transport more and driving less. It was not a full literature review on the topic in question.
The qualitative methods delivered in the primary research offered in-depth insight into how individuals think and feel climate change actions and the role/impact of messaging and communications but with a sample of 30 participants it cannot tell us how many other people in the population feel or think in these ways.
Also, we were aware and recognised in running the follow-up depths and subsequent analysis that for the homework tasks the fact that the whole research exercise was about considering a range of warm-up behaviours will have influenced participant behaviours to a degree i.e. encountered the Hawthorne effect.
All the research adhered to UK GDPR legislation and the Market Research Society Code of Conduct.
– Use of behavioural theory
Stage of Change Model – A model for mapping behaviour change as a process
The Stages of Change Model (Prochaska & DiClemente, 1983), also known as the Transtheoretical Model, describes stages of behaviour change including: Pre-contemplation (not ready to change), Contemplation (considering change), Preparation (planning to change), Action (making changes), Maintenance (sustaining change), and Termination (no longer tempted). This model recognises that change is a process, not an event, and different strategies are effective at each stage.
In our research:
This proved to be useful in thinking about where people were at in terms of adopting a behaviour / undertaking warm up actions
Often, respondents were at the pre-contemplation stage, where they don’t see a need to do anything differently
The Action stage would be getting a heat pump, EV or changing your travel habits to drive less
Figure 28: The Stages of Change Model (Prochaska & DiClemente, 1983)
Preparation is where the warm-up behaviours take place
For the purposes of this project, we focussed on the first three stages in particular.
Theory of Planned behaviour – How we unpicked the impact of communications on intention and action
The theory of planned behaviour (Ajzen, I., 1991), outlines three key variables that affect people’s attitude-behaviour relationship:
The attitude toward the behaviour (the stronger the better)
Subjective norms (the support of those we value)
Perceived behavioural control (the extent to which we believe we can actually perform the behaviour).
These three factors jointly predict our intention to perform the behaviour, which in turn predicts our actual behaviour.
In our research:
For each communications hypothesis/theme, we looked at how these affected:
Attitudes and beliefs about the primary behaviour (Heat pumps/EVs/drive less)
Subjective norms associated with the primary behaviour
Perceived behavioural control
Challenging negative attitudes and building positive ones was a recurring theme throughout
Subjective norms are crucial. This was where pluralistic ignorance applied – where people believe others not to be taking action at scale
Notably, although we recruited participants based on the absence of practical/financial barriers, perceived behavioural control was often lower.
Figure 29: The theory of planned behaviour (Ajzen, I., 1991)
How to cite this publication:
Morton, C; Cuthbert, M; Fraser, L; Howick, M; Mowat, C. (2025) ‘Bridging the gap between climate concern and climate action’, ClimateXChange. DOI https://doi.org/10.7488/era/6842
While every effort is made to ensure the information in this report is accurate as at the date of the report, no legal responsibility is accepted for any errors, omissions or misleading statements. The views expressed represent those of the author(s), and do not necessarily represent those of the host institutions or funders.
This work was supported by the Rural and Environment Science and Analytical Services Division of the Scottish Government (CoE – CXC).
This source was not specifically referred to by participants. It has been selected as an illustrative example of the type of media coverage which was discussed by focus group participants. ↑
Quote labels reference participant gender, socio economic classification and age bracket. ↑
Community benefits are additional benefits offered by renewable energy developers to support communities. Examples include community benefit funds and in-kind benefits provided by developers such as investment in local infrastructure improvements or funding for education programmes. Community benefits currently operate on a voluntary basis in Scotland. The Scottish Government has published Good Practice Principles for onshore and offshore energy in Scotland, which are currently under review.
Within the context of that overarching review, the primary aims of this research were:
To understand how different renewable energy technologies affect the provision of community benefits. This included developing and testing a socio-economic analysis framework to understand the factors that influence the nature and level of community benefits associated with different renewable energy technologies.
To understand how mandating community benefits could work in practice for onshore renewable energy technologies.
To help identify any necessary adjustments to Scotland’s current voluntary community benefits approach for onshore and offshore to better support communities and industry as part of a just transition.
The study methodology incorporated an evidence review, qualitative interviews, and the design and testing of a socio-economic analysis framework. This research focused on the factors influencing how different renewable energy technologies affect developers’ provision of community benefits, rather than on the experiences and perspectives of recipient communities. Interviews were therefore conducted with renewable energy developers.
The Scottish Government is gathering other non-industry perspectives on community benefits, including the views of community members, through a public consultation on the Good Practice Principles.
Understanding the ability of different technologies to offer community benefits
One of the ways this research explored how renewable energy technologies affected developers’ ability to offer community benefits was to develop and test a socio-economic analysis framework. This framework set out the parameters assumed to influence the level and nature of community benefits. An initial set of seven draft parameters were developed by the Scottish Government and the research team. Following an assessment of the feasibility of measurement and feedback from renewable energy developers, four parameters were recommended for further consideration (and which are subsequently referred to as “the framework”). These were:
Technology maturity (i.e. more mature technologies, with well-established supply chains and business models, may better allow developers to build community benefit provision into their project plans compared to newer technologies).
Market maturity (i.e. maturity may influence investor confidence, competition between developers, and certainty in supply chains which may in turn determine predictability of financial plans and therefore ability to deliver community benefits).
Deployment and operating costs (i.e. the costs associated with developing and operating different renewable energy technologies may impact the financial capacity to provide community benefits).
Revenue and profit (i.e. a project’s revenue and profit will impact on its overall financial viability which may impact on its ability to delivery community benefits).
This study identified significant challenges in developing a single framework to assess how different technologies affect developers’ provision of community benefit. For such a framework to work as a practical, decision-making tool, quantitative data on the economics of different renewable energy technology projects would be required. However, existing public data is sparse and of inadequate quality and many developers were unable or unwilling to share commercially sensitive data about their projects. A further limitation was that existing data (e.g. on the value of community benefits from individual renewable energy projects) is based on actual provision rather than an assessment of potential. Additionally, data available is largely historical and therefore challenging to use when anticipating new technologies and emerging economic and regulatory models.
However, it was clear from interviews with developers that the financial aspects of a renewable energy project (costs, revenue and financial viability) were key factors impacting community benefit levels. They noted that projects with higher amounts of revenue, and more robust and predictable financial returns are better positioned to offer significant community benefits. Conversely, if the financial viability of a development is low, then it is unlikely it can offer monetary community benefits without the project becoming non-viable. Developers noted that both technology maturity and market maturity can have an impact on a project’s financial viability and are therefore, indirectly, also linked to a project’s ability to deliver community benefits. However, this was based on qualitative interviews and was not possible to measure using quantitative data.
Developers also reported that it is easier to offer community benefits for projects involving more established technologies like onshore wind, compared to newer technologies, due to the latter’s comparatively lower profit margins. Less mature technologies (e.g., floating offshore wind, hydrogen) can have higher risks, higher delivery costs, less predictability in cost and performance, and lower investor confidence which can impact on their ability to offer benefits.
Although not necessarily directly impacting the level of benefit offered, developers identified community engagement as key factor for effective delivery. Developers emphasised the importance of levels of community engagement and capacity to effectively manage and deliver benefit funds. Interviewees highlighted the importance of community engagement, consultation and feedback in moulding community benefit initiatives, ensuring more meaningful and tailored contributions. This is difficult to quantify and would therefore be challenging to include in a socio-economic analysis framework.
How mandating community benefits could work in practice (for onshore renewable technologies)
The available literature does not enable a comparison of the real-world impacts of mandatory, as opposed to voluntary, provision of community benefits. Mandatory community benefits as part of renewable energy infrastructure development exist in Denmark and Ireland, specifically for wind projects. However, the literature reviewed does not allow for a satisfactory comparative analysis of the in-practice impacts of mandatory versus voluntary approaches.
Existing onshore developers felt that the following factors should be considered:
clear guidance on what the financial expectation attached to mandating is to avoid any potential for confusion;
allowing for the differences between individual onshore technologies to be taken into account;
retaining a degree of flexibility, particularly in terms of allowing for community benefits to be designed around the needs of communities;
avoiding overly burdensome processes. For example, in relation to restrictions on how communities should spend the money.
The power to mandate community benefits is reserved to the UK Government. In May 2025, the UK Government published a working paper seeking views on a mandatory community benefits scheme for low carbon energy and mechanisms for shared ownership of onshore renewables[1]. This includes the option to utilise existing powers to mandate offering shared ownership.
Any necessary adjustments to Scotland’s current voluntary community benefits approach for onshore and offshore
This research has not identified any obvious adjustments that need to be made to Scotland’s current community benefit approach.
The literature highlights that the Scottish Government is leading the way across the UK in highlighting the role of communities in the development of renewable projects. While there are examples in the literature of other approaches to community benefit provision outside of Scotland (e.g. in Ireland and Denmark), there is limited evidence directly comparing how different approaches have impacted the level of community benefits delivered. Therefore, there are no clear lessons from these international approaches suggesting a need to change the current approach in Scotland.
Guidance from the Scottish Government, in the form of Good Practice Principles and a recommended community benefit contribution of £5,000 per installed MW per year for onshore projects, was highlighted in interviews with developers as being a strength of the current process. They felt it provided a degree of predictability while also allowing for flexibility in application. However, for projects of emerging and/or non-generative technologies, developers noted that more targeted guidelines would be beneficial, noting that there is no established industry standard approach.
Conclusion and recommendations
The intention was that the framework examined in this study could inform policy decisions on the appropriate levels of community benefit for different renewable energy technologies. However, further development and more complete data is needed to be functional for this purpose. Collating the required data would need considerable resources and rely on information that developers perceive to be commercially sensitive. Considering data gaps, collection challenges, the difficulty in sourcing data specifically focused on future ability to offer benefits (rather than actual performance), further research and/or alternative approaches would be required. For these reasons, the approach explored here does not provide a robust enough evidence base to underpin a framework for use as a decision-making tool.
The report highlights existing measurement tools and guidance that can be used to understand where a project sits in relation to certain parameters, such as technology and market maturity. Further data collection work would be needed to make the most of these tools for robust socio-economic analysis. This would involve collecting relevant data for a large number of projects across metrics with established measurement tools. This would require a significant time and resource commitment and may not be a practical option.
To better understand how different renewable energy technologies affect developers’ provision of community benefits further research, beyond the financial indicators highlighted, would be needed. Considering the challenge of sourcing quantitative data on project economics, further qualitative research may be the most feasible option. Ideally this would be with a larger selection of developers across the full technology spectrum (including those that had not been able to deliver community benefits), direct engagement with communities, and wider stakeholder engagement (e.g. project investors, funders and other partners that have assisted in project development). This type of engagement would add to and build on the insights from developers gathered in this study.
Introduction
This report presents findings from research exploring opportunities for providing community benefits from renewable energy projects using different technologies in way that is fair and consistent. The research was carried out by Ipsos on behalf of ClimateXChange and the Scottish Government.
Background to the project
The Scottish Government has set ambitious targets for achieving net zero emissions by 2045, emphasising the importance of renewable energy technologies in this transition. The Climate Change Plan update (2020)[2] sets out Scotland’s ambition of a transformed energy system, which supports sustainable economic growth across all regions of Scotland.
Communities are at the heart of the energy transition in Scotland. Community benefits are additional benefits offered by renewable energy developers to support communities, offering them an opportunity to work with renewable energy businesses to secure long-term benefits. They provide an opportunity to share in the benefits of the energy resource and can have lasting social and economic impacts[3].
The Scottish Government published Good Practice Principles for the onshore[4] and offshore[5] energy sectors to outline how they can achieve a positive legacy for local communities. The approach and nature of community benefits operates on a voluntary basis in Scotland, with the guidelines allowing for flexibility in benefits arrangements offered by industry. Decisions on mandating community benefits are reserved to the UK Government. In May 2025, the UK Government published a Working Paper on community benefits and shared ownership for low carbon energy infrastructure, seeking views on whether mandating is the right approach and if so, to inform the design of future policy proposals.
Good Practice Principles have been widely adopted, but the approach to community benefits has not been wholly consistent across developments. In recognition of this, and of the rapidly changing sectoral and policy landscape, the Scottish Government is undertaking a review of the Good Practice Principles to ensure that guidance continues to help communities and developers get the best from community benefits.
This research sits within that overarching review. It was designed to help the Scottish Government understand more about different approaches to providing community benefits and to explore the opportunities for providing community benefits in future in a way that is fair and consistent for industry and communities. The findings from this research will help to inform a refresh of the Good Practice Principles.
Aims and objectives
The primary aims of this research were:
To understand how different renewable energy technologies affect developers’ provision of community benefits. This included developing and testing a socio-economic analysis framework to understand the factors that influence the nature and level of community benefits associated with different renewable energy technologies.
To understand how mandating community benefits could work in practice for onshore renewable energy technologies.
To help identify any necessary adjustments to the Scottish Government’s current voluntary community benefits approach for onshore and offshore to better support communities and industry as part of a just transition.
The findings aimed to support policy development and further refinement of guidelines and frameworks to help ensure that community benefits are effectively and fairly integrated into Scotland’s net zero energy system and strategy.
Methodology
The research involved a mix of desk research, qualitative interviews with developers and data analysis, as outlined below (detailed methodology is in Appendix A):
A desk-based evidence review that explored examples of community benefits from onshore and offshore renewable energy technologies in the UK and other countries. Literature sources reviewed included 12 peer reviewed academic papers, 20 reports, 2 guidance documents from grey literature (e.g., renewable energy developers, private consultancies) and 1 policy document. These were all published between 2011 and 2024, with 22 documents from the last 5 years.
Initial scoping interviews with four industry representative bodies to understand their views on current community benefit approaches and to explore options for sourcing data that could support socio-economic analysis on community benefits.
Design of a socio-economic analysis framework to help understand the factors which are likely to affect the level and nature of community benefits.
In-depth interviews with 21 industry developers from a range of renewable energy technologies (see Appendix A). As the focus was on how different renewable energy technologies affect provision of community benefits, qualitative research with developers was carried out to help understand the views of those with direct experience of working with projects and benefits. Interviews helped to understand industry perceptions towards community benefits arrangements, collect feedback on the proposed analytical framework, and to understand availability of relevant data for socio-economic analysis.
Assessment of the suitability of a framework to act as a tool for the Scottish Government to understand what type and level of community benefit may be suitable for different renewable energy technologies, based on data availability and feedback from interviews.
Definitions
Community benefits are defined in this research in line with the Scottish Government’s Good Practice Principles:
Community benefits are additional benefits, that are currently voluntary, which developers provide to the community. The Scottish Government does not currently have the power to legislate for community benefits, which lies with the UK Government. A community benefit fund is considered to be a fundamental component of a community benefit package, though other measures may be considered such as in-kind works, direct funding of projects, or any other voluntary site-specific benefits. Community benefits are not compensation for impacts on communities or other interests, including commercial interests, arising from renewable installations and they are not taken into account in a decision over whether a consent for a development is granted.
Community benefit in Scotland is distinct from shared ownership. Shared ownership provides community groups or members of a community the opportunity to make an investment in a commercially owned renewable energy project. This includes any structure which involves a community group as a financial partner benefitting over the lifetime of a renewable energy project. As shared ownership is not considered a form of community benefit in Scotland, it has not been included within this research.
In this report renewable energy technologies have been interpreted as the range of technologies outlined in the Scottish Government’s draft Energy Strategy and Just Transition Plan[6]. This includes onshore wind, offshore wind (both floating and fixed), solar, hydro, pumped hydro storage, battery energy storage system (BESS), hydrogen, and carbon capture, utilisation and storage (CCUS).
Limitations
This study was limited by data availability. Existing public data (for example on community benefit values, project costs and revenue) is sparse and of inadequate quality to effectively measure the parameters within a socio-economic analysis framework. Many developers were unable or unwilling to share commercially sensitive data about their projects. A further limitation was that existing data (e.g. on the value of community benefits from individual renewable energy projects) is based on actual provision rather than an assessment of project’s potential capability. Additionally, existing data are largely historical and therefore challenging to use when anticipating new technologies and emerging economic and regulatory models. Consequently, data gaps mean it was not possible to develop a fully functioning socio-economic analysis framework as part of this study.
A further limitation is that this research draws on the views of a relatively small sample of developers. These represent one group of perspectives on community benefits, albeit from different organisations, working with different technologies. Non-industry perspectives, including those of community members themselves, were not included in the remit of this study and would not be expected to fill the data gaps highlighted above.
Current community benefit arrangements
This chapter details the current arrangements for delivering community benefits, based on findings from the literature and from the qualitative interviews with renewable energy technology developers. At various points, examples of community benefit projects identified in the literature are shown to help illustrate the findings.
Key findings
The literature highlights that the Scottish Government is leading the way across the UK in highlighting the role of communities in the development of renewable projects and in providing good practice guidelines.
Community benefits from renewable energy projects in the UK mainly involve community benefit funds[7], but there are also examples of in-kind benefits such as investment in education and infrastructure programmes. Community benefit funds are not as extensively adopted outside of the UK.
Onshore wind has more established community benefit practices than other onshore and offshore technologies. However, a key similarity is that all projects, regardless of technology, tended to adopt both community benefits funds and in-kind contributions.
There is limited evidence directly comparing how different approaches in the UK and in other countries have impacted the level of community benefits delivered.
Guidelines for community benefits
According to the reviewed literature, the Scottish Government is leading the way across the UK in highlighting the role of communities in the development of renewable projects. The Good Practice Principles for Community Benefits from Onshore Renewable Energy Developments (updated in 2019) and the draft Good Practice Principles for Community Benefits from Offshore Renewable Energy Developments (2018) outline how the energy sector can achieve a positive, lasting legacy for local communities, and a range of successful community benefit projects have been implemented to date.[8] These guidelines have been widely adopted across the renewables industry, providing best practice for the sector.[9]
The voluntary guidelines suggest practices like conducting impact studies to identify affected communities, engaging in consultations, and tailoring benefits to local context and needs. These principles aim to ensure benefits are well-targeted and meet community expectations, which could be seen as markers of a well-designed scheme.[10]
Example 1.
Beatrice Offshore Windfarm’s Community Benefits Fund used the Scottish Government’s Good Practice Principles to guide the development of the fund. The Beatrice Community Benefits Fund also undertook innovative analysis of the potential wider impacts of the community benefits funding, using a Social Return on Investment methodology.[11] This illustrates the ability of the Good Practice Principles to be applied alongside other models and approaches.
In Scotland, the Scottish Government also established the Community Benefits Register,[12] managed by Local Energy Scotland. It can be viewed online and offers a form of third-party reporting and public recognition.[13] Best practice guidance also exists in England, Ireland, the Netherlands and Germany (see Table 2 in Appendix B).
Approaches used in the UK and elsewhere
The literature provided examples of different approaches to designing and implementing community benefits schemes. However, most examples are from onshore wind farms, with some examples given from offshore wind technologies. There is very little to no reference to other renewable technologies such as hydrogen, hydro, solar, wave, thermal, or BESS.
Community benefit mechanisms referred to in the literature included[14]:
Financial contributions to a community benefit fund, to be used as directed by the community to invest in local initiatives[15];
In-kind contributions to local infrastructure, facilities, or services[16];
Grants, scholarships, or donations to support community initiatives[17];
Electricity discounts or subsidies for local residents[18];
Provision of environmental or recreational amenities.[19]
While these approaches share many similarities, there are some notable differences and ambiguities. These include varying interpretations of what constitutes the “local community” (especially for offshore projects)[20] and differing emphasis on the rationale for providing benefits (e.g., impact mitigation).
This section describes the different approaches to community benefits in more detail. Differences between the UK and other countries are noted, where available.
Community benefit funds
Community benefits from renewable energy projects in the UK are primarily delivered through community benefit funds. The UK onshore wind industry, in particular, has well established approaches for this.[21] Through this mechanism, developers voluntarily contribute a certain amount of funding to local communities. In some cases, the level of funding is linked to the amount of installed capacity of the project or the amount of energy produced. For example, in Scotland, it is the industry norm for onshore wind projects to typically deliver £5,000 per megawatt (MW) of installed capacity per year in alignment with the Good Practice Principles for Onshore Renewable Energy Developments.[22] However, the per MW model is not the only approach used and the total amount provided is based on the agreement between the developers and the community.
Example 2.
Crossdykes Wind Farm near Lockerbie, Scotland (developed by Muirhall Energy) offered an industry-leading £7,000 per MW per year for a community benefit fund, well above the industry standard of £5,000 per MW per year. The project provided an Initial Investment Fund of £100,000 to support community projects during the wind farm’s construction phase, showing a proactive effort to deliver early benefits.
Example 3.
Brechfa Forest West Wind Farm in Wales (owned by RWE Renewables), is an example of a community-administered community benefit fund which is expected to provide £11 million in community benefit funding, administered by the local enterprise agency and a volunteer panel of residents.[23]
Regarding offshore wind, the concept of community benefits in the UK is relatively newer and more flexible than for onshore, reflecting the evolving nature of the industry.[24] Some, predominantly near-shore English and Welsh wind farms (e.g. North Hoyle and Rhyll Flats off the North Wales coast) have followed the pattern of the onshore wind farms, with benefits pro rata to MW size, although at a much lower rate.[25] However, in many cases, and for some of the large North Sea distant offshore wind farms, the benefits packages have been more ad hoc and much smaller (pro rata) than for onshore projects.[26] Several challenges have been identified with providing community benefits funds for offshore wind projects, including defining the relevant community to be targeted.[27]
Example 4.
The Hornsea/Race Bank East Coast Community Fund, off the Norfolk coast, is managed independently by a specialist grant-making charity, GrantScape, on behalf of the developer Orsted. This enables an arms-length, transparent allocation process.[28]
According to a number of the literature sources, allocation and spending of community benefit funds are usually determined by developers, in collaboration with the local communities, often through local trusts or organisations. Developers often strive to tailor the benefits based on local priorities identified through community engagement.[29] Community benefit funds can take different forms, ranging from local funds – investments in communities nearest to developments to enhance services, assets and activities of residents – to regional funds – investment in transformational projects to provide socio-economic growth for wider communities.[30]
The evidence reviewed suggests that community benefit funds are not as extensively adopted outside of the UK. There are some instances of community benefit funds in Europe. Notably, in Denmark, from 2008-2018, the state-run “Green Scheme” mandated payments per kilowatt per hour of production to host communities. As of 2020, Danish developers must pay fixed amounts per MW installed into green funds for affected municipalities under the “Green Pool” scheme and make annual payments to neighbouring residents under the “VE-Bonus” scheme, with amounts determined by the Danish Energy Agency.[31] In Ireland, renewable energy auctions require developers to contribute €2 per MW hour to a community benefit fund, with defined spending allocations.[32]
Among the developers interviewed for this research, flexible community benefit funds were the most common approach being taken to community benefits in Scotland. The exact sum delivered through these funds varies project-by-project. Onshore wind developers said that they follow, and often exceed, the Good Practice Principles guidelines of £5,000 per MW per year. For other technologies, which developers said often have greater financial uncertainty and/or smaller margins than onshore wind, the levels of community benefit are less predictable. Developers said that the level of benefit is often closely linked to the project’s costs and financial returns, which varies.
“We typically work backwards from what we think the returns in the scheme are going to look like. And that’s very site specific, dependent on abnormal costs, grid costs, land rights costs…Depending on what that looks like, we’ll then generate a number to determine what we can reasonably offer local communities.” – BESS developer
In a number of cases, these funds are administered by Foundation Scotland, a charitable organisation that helps to support communities to set up, manage and distribute their funding. This has particularly been the case where local communities may lack the capacity to manage significant financial resources independently. Some projects also have established their own governance arrangements, involving boards constituted of local community members to determine the allocation of these funds.
Other community benefit mechanisms
Other examples of community benefits mechanisms that appeared in the literature include tax revenues or fiscal contributions from wind farm developers, which go directly into funding local infrastructure and community services. From the documents reviewed, this is common practice in Germany, Poland, Croatia, France and Italy. [33]
Example 5.
The Block Island offshore wind farm development in Rhode Island, USA, is an example of fiscal contributions being made to support local infrastructure. In this case, a formal Community Benefit Agreement was developed in which the wind farm company pays for improvements to town infrastructure where the cable comes ashore. This project was also highlighted in the literature as an example of community engagement resulting in locally appropriate community benefits and high levels of support for the development from the local community. As part of the public consultation on the project proposals, the developer, Deepwater Wind, collaborated with the town council to invite stakeholders and hired consultants from the local community to represent local interests. This helped establish trust and perceptions of fairness in the process.[34]
The literature also identified Australian examples of neighbourhood benefit programmes.[35] These programmes aim to address concerns around fairness that can arise when local residents receive no direct benefits from a renewable energy project which affects their experience of their place and community.[36] Examples of the types of benefits provided via these neighbourhood benefit programmes include support towards home energy efficiency measures, the installation of residential solar PV, and contributions to electricity bills for neighbours or neighbourhood community facilities (e.g. local hall, local fire-fighting facilities).
The reviewed literature suggests that the involvement of local authorities in the delivery of community benefits varies by country. In some European countries (including Denmark, Germany, France, Italy and Spain), the local municipality plays a significant role and often decides funding priorities of community benefits. In the UK and Ireland, local authorities generally decline involvement to avoid conflicts of interest in the planning process. However, Highland Council recently set out plans for a different approach to community benefit decision making and fund distribution and Shetland Council approved a new set of principles around community benefit.
Developers interviewed also described the types of in-kind benefits they offer communities. Examples included:
Employment and education programmes. This includes providing funding towards training in green technologies, especially in areas that are reliant on traditional energy industries rather than renewable energy.
Electricity discount schemes, with money coming off local residents’ bills.
Investment in environmental and net zero initiatives, including activities designed to reduce carbon footprint and support biodiversity in communities, along with awareness-raising around these issues.
Infrastructure improvements such as broadband access, roads and pathways, and community recreational facilities.
Impact of different approaches on the level of community benefits delivered
Based on the literature reviewed, there is limited evidence directly comparing how the different approaches in the UK and in other countries have impacted the level of community benefits delivered.
Among the documents reviewed, the only source that explicitly offers comparative analysis between approaches in the UK and European countries was the Department of Trade and Industry report conducted by the Centre for Sustainable Energy, which involved detailed case studies of major wind farms in the UK, Germany, Denmark, Ireland and Spain. The following points are drawn exclusively from this report:
The overall levels of benefits accruing to communities from wind projects in Denmark, Spain and Germany tend to be higher than in the UK. However, it is important to note that in such countries, community benefits are mostly associated with shared ownership practices, and therefore economic and financial benefits are linked to those practices. Shared ownership is not included in the Scottish Government definition of community benefits and it is also worth noting that developments outside of the UK will have different policy contexts and market conditions to those in the UK, making it difficult to directly compare.
While the authors do not find robust evidence that higher benefits directly lead to higher levels of support for developments, they suggest that they are likely an important factor in sustaining long-term acceptance of projects.
Lessons from community benefits projects
Common themes emerged from the literature and interviews around what constitutes good practice in community benefit:
Early community engagement. Establishing trust, building relationships with local residents and identifying concerns and priorities early on can lead to smoother running of the project and help dispel fears of community members early on.[37]
Ensuringcommunity representation in the co-design and administration of community benefits[38] as this can help establish trust and lead to higher levels of sustained support for the project.[39]
Providing broad and flexible community benefit. Literature and interviews highlighted the value of funds being used to support a wide range of community priorities like infrastructure, schools, housing, elderly care, environment, etc. that improve quality of life for residents.[40]
Community capacity was noted by developers as a factor that can impact on their ability to deliver community benefits. Not all communities were seen to have the resources or expertise needed to administer funds efficiently. They noted that the existence of strong community councils or Community Development Officers to help generate ideas have helped contribute to successful community benefit funds.
Ensuring transparency of communication and providing full information to communities through trusted messengers is seen in the literature as a crucial step in securing support from communities.[41]
The reviewed literature also suggests that formalising benefit commitments and monitoringprogress can promote accountability and sustainability over the long-term. It helps ensure developers deliver on promises made to communities.[42]
There is also evidence that partnering and aligning with local government, NGOs and other companies allows projects to leverage additional resources and maximise the scale and impact of their community investments.[43]
Understanding how different renewable energy technologies affect the ability to offer community benefits
One of the ways this research explored how renewable energy technologies affect the level of community benefits offered by developers was to develop and test a socio-economic analysis framework. This framework set out the parameters assumed to influence the level and nature of community benefits provided. This chapter outlines the steps taken to develop and test a framework and the extent to which this tool could help to understand how different renewable energy technologies affect the level community benefits provided by developers.
Key findings
Within the scope of this study, the available evidence did not support a single framework to robustly determine how different technologies affect the provision of community benefits. For such a framework to work as a practical, decision-making tool, quantitative data on the economics of different renewable energy technology projects would be required. However, existing public data is insufficient to effectively measure the parameters in the framework, and it was not possible within this study to gather the level of quantitative data that would be needed for robust socio-economic analysis.
However, it was clear from the interviews with developers that the financial aspects of a renewable energy project (costs, revenue and financial viability) were key factors impacting community benefit levels.
Developers’ feedback also highlighted that it is easier to offer community benefits for projects involving more established technologies like onshore wind, compared to other technologies (e.g. offshore wind, solar and battery storage) due to the latter’s comparatively low profit margins.
Original framework parameters
The initial parameters identified at the scoping phase of the project are outlined in Table 1. The following section sets out the feedback received from developers in response to this framework, and the extent to which these parameters are measurable within a framework.
Table 1 Initial list of identified parameters affecting provision of community benefits
Parameter
Justification for inclusion
Technology maturity
More mature technologies like onshore wind and solar PV have well-established supply chains and business models, allowing for community benefit provision to be built in to project plans. The more mature technologies are also more reliable in terms of return on investment (ROI), than less mature technologies. Emerging technologies have less predictability in costs and revenues, affecting community benefit schemes and their provision.
Market maturity
The level of market maturity can determine the provision of community benefits by influencing investor confidence, increased competition between developers, robust supply chains and solidified regulatory frameworks. These all determine predictable project economics and financial plans, increasing the likelihood and scale of community benefits being provided.
Project size/energy yield
The energy yield of a project is a critical factor that can influence the revenue and, consequently, the level of community benefits provided. Smaller projects may have small absolute margins and so may be less able to provide the same level of community benefits as larger projects.
Deployment and operating costs
The costs associated with developing and operating different renewable energy technologies can impact the financial capacity to provide community benefits. If one technology has higher upfront costs or operating expenses, this might reduce the scope of benefits a developer can offer, as well as the timing of delivering these benefits.
Revenue and profit
The amount of revenue generated by a project, or the profits it generates, could also have an impact on a project’s ability to deliver community benefit and on the level and nature of community benefits that can be delivered.
Land use, visual, environmental and social impacts
Wind farms, especially onshore ones, can have a significant visual impact and may occupy large areas of land which can influence the local community’s perception, and the level of benefits expected. This may differ for offshore wind. It may also influence the type of community benefit provided (environmental, social, economic). In contrast, solar PV installations typically are less sensitive to visual impacts than wind turbines but could be associated with higher land use impacts.
Wider economic impact of the project and its distribution
The economic returns from projects may also influence the level of benefits provided through community benefit schemes. Projects which require a large workforce for ongoing maintenance and operation will provide economic benefits to the local area through jobs and investment which is multiplied through other sectors and amenities required by residents. It can be theorised that a developer’s contribution to the wider economy may reduce their overall willingness to community benefit commitments, though it is unlikely that this contribution would affect their ability to provide monetary commitments.
Community benefit value
There is a lack of data on the level of community benefits offered by renewable energy projects. The Local Energy Scotland Community Benefits Register is currently the most comprehensive data source for capturing the community benefits monetary measures. However, this is not exhaustive and does not cover the full range of renewable energy technologies.
Further steps were therefore taken to identify additional and more up-to-date data for this research. Firstly, data was requested from developers taking part in interviews, but not all were willing or able to share this (either because they could not access the data, or due to commercial sensitivities). Secondly, online searching for publicly available information on monetary values of community benefits was carried out. While data for some projects is available publicly, this requires a significant time commitment to source since it is not held in a central source nor in a consistent format. Therefore, data gaps remained after taking these steps. For the framework to be robust, a more complete set of data on community benefit value is required.
Technology maturity
Technological maturity is a widely used metric for gauging a technology’s development and readiness for deployment.
Developers generally felt that this could have an impact on the viability of a project, and as a result affect the level of community benefits. Some agreed that, compared to mature technologies (e.g., onshore wind), technologies such as floating offshore wind, BESS and hydrogen can have higher risks, higher delivery costs, less predictability in cost and performance and lower investor confidence. However, some onshore wind developers argued that more mature technologies do not always have more secure financial models because recent cost increases in their supply chains have made viability harder to predict.
Technology maturity is suitable for quantitative measurement using the NASA Technology Readiness Level (TRL) scale (see Appendix E for details). To accurately assess a technology’s TRL, it is recommended that individual projects are approached directly for scoring, as they may employ different versions of the technology. If direct assessment is not possible, it would be possible to utilise the International Energy Agency’s ETP Clean Energy Technology Guide, which evaluates and provides comprehensive information on each technology’s current development stage across the energy system.
This parameter could be included in a socio-economic analysis framework, provided there was sufficient data available or one of the existing guides outlined above could be used.
Market maturity
Factors influencing market maturity include established supply chains, business models and supporting physical and regulatory infrastructure (ports for deployment of offshore wind, standards for solar farms, etc.).
Developers felt that emerging technologies and immature markets face difficulties determining an appropriate level of community benefits because of uncertainty around securing investment and finances. However, some onshore wind developers also noted that their more mature market can still experience challenges with supply chains, especially in relation to costs of deployment (e.g. turbine costs have increased).
Market maturity could be measured using existing tools. The Adoption Readiness Level (ARL) framework, developed by the U.S. Department of Energy, is a tool for assessing the commercialisation risks of new technologies. It helps identify potential roadblocks to market adoption, such as cost-competitiveness, regulatory landscape, public perception and infrastructure availability. It also helps evaluate market demand by identifying the target market, understanding customer needs, and assessing the competitive landscape.
The ideal approach to understanding this parameter would involve project-level assessments via direct engagement with project owners, using the scoring framework available online[44]. However, given the large number of projects, this endeavour would be challenging. The decision to pursue this should weigh the uncertainties about the parameter’s significance in determining community benefits, with the time commitment needed to collect this information.
This parameter would be suitable to include in a socio-economic analysis framework, but the ability to source the level of data required is challenging.
Project size or energy yield
This measure is quantifiable, based on the level of energy capacity installed for each project expressed in MW. This data is available on the Local Energy Scotland’s Community Benefit Register and the Renewable Energy Planning Database (REPD). To enable a comparison between different technologies, it is important to convert installed capacity to expected energy yield as each technology has different levels of efficiency.
Capacity and energy yield are both inputs in the estimation of gross revenue. Therefore, inclusion of these metrics as stand-alone parameters in the framework would be duplicative and would correlate very highly with any revenue estimations. For this reason, these metrics would not need to act as stand-alone parameters in an analysis framework but could be used as inputs to the revenue estimation.
Deployment and operating costs
The total costs of developing and operating a renewable energy project captures an important financial aspect assumed to influence the level of community benefit commitment.
Developers noted that the developmental and operating costs impact the financial capacity for a project to provide community benefit. As with revenue, obtaining precise cost figures would involve direct input from project owners. Again, due to commercial sensitivities and challenges in accessing this data, estimating total cost of production might need to rely on publicly available sources. This can be done for a selection of technologies using the Department for Energy Security and Net Zero’s Levelised Cost of Electricity (LCOE) estimates.[45] It is worth noting that not all REPD project technologies are included in this resource, and hence, some projects will require mapping to the closest matching technology category. Despite this challenge, a basic methodology for estimating LCOE from generation technologies is outlined in Appendix D.
When looking at non-generation projects, i.e. storage projects, it is important to reflect the differences to generation projects in the calculation of costs. An analogous version of the LCOE is the Levelised Cost of Storage (LCOS), which uses charging cost as fuel cost and uses the discharged electricity instead of generated electricity. Given the lack of access to the necessary data it is not possible to accurately estimate LCOS for storage projects.
Given that project costs provide a direct link to the financial aspects that are assumed to influence community benefits, it is recommended to include this parameter in a socio-economic analysis framework.
Revenue and profit
Developers agreed that the amount of revenue generated by a project has an impact on their ability to deliver community benefits and the level of community benefits that can be offered.
Ideally, obtaining precise revenue figures would involve direct input from project owners. However, due to commercial sensitivities and challenges in accessing data, estimating revenue might need to rely on publicly available sources. It is important to note that this approach is based on significant assumptions that might not hold true over time. Estimating future revenues is particularly challenging because it depends on projected electricity prices, which are notoriously difficult to predict with accuracy or extend into the future. Despite these challenges, a basic methodology for estimating revenues from generation technologies is outlined in Appendix D.
When it comes to non-generation projects, revenue estimation becomes even more complex and uncertain. These types of projects may involve diverse sources of income and variables, requiring a more nuanced approach to estimation. Battery storage projects generate revenue through a variety of mechanisms, often stacked together to maximise returns. Key revenue streams include arbitrage (buying electricity when prices are low and selling it back to the grid when prices are high), grid services (e.g. frequency regulation, voltage support), capacity market participation and ancillary services (e.g. black start capability). The lack of publicly available data for each of these revenue streams make it challenging to estimate revenue for non-generation projects.
Given that revenue estimation provides a direct link to the financial aspects that are assumed to influence community benefits, it is recommended that consideration is given to including this parameter in a socio-economic analysis framework.
Land use, visual and environmental impacts
There are several challenges associated with quantitatively measuring land use, visual, environmental and social impacts:
Quantifying land use involves assessing the physical footprint of a project, which can vary significantly based on the type and scale of the renewable technology employed. Further challenges arise in comparing land use impacts across different technologies, such as wind farms versus solar arrays, as each may occupy land differently (e.g., spacing between wind turbines versus solar panel coverage). These differences between technologies were also noted by developers.
Visual impact assessments are inherently subjective and can vary depending on individual perspectives and local landscape characteristics. Moreover, accurately quantifying visual impacts requires sophisticated modelling tools and surveys that consider factors like visibility range, landscape context, and viewer sensitivity.
Comprehensive environmental impacts involve a multitude of factors, including potential effects on local wildlife, ecosystems, water resources, and biodiversity. Data collection for environmental impacts may be inconsistent and require long-term monitoring to capture seasonal or cumulative effects accurately.
Social impacts can include effects on local communities, employment opportunities, and cultural shifts, which are difficult to measure quantitatively and may require qualitative research approaches. In addition, assessing social impacts often involves engaging with communities and stakeholders, which can introduce variability and complexity in data collection and interpretation.
Each of these aspects often interacts with others, making it challenging to isolate and assess impacts individually without considering cumulative or synergistic effects. Variability in methodologies and data availability can also lead to inconsistent measurements and comparisons.
For these reasons, this parameter is not suitable for a socio-economic analysis framework.
Wider economic impact of the project and its distribution
Renewable energy projects, especially large-scale ones, often generate significant economic benefits. For example, they may create high-value jobs through operation and maintenance, enhance the local supply chain and attract inward investments. These contributions can lead to substantial regional development and improved economic resilience.
However, there are notable challenges in confining these benefits strictly to the local communities most directly impacted by the projects. Economic effects often extend beyond the immediate vicinity. Moreover, quantifying these impacts presents difficulties, often necessitating self-reported data from projects. Such data can be subject to bias and may not fully capture the comprehensive economic changes occurring in the region. These challenges were reflected in interviews with developers. They noted that projects can add a lot of value to an area through high-value jobs, contribution to the supply chain and driving inward investment. However, they noted that it would be difficult to define this parameter, since the economic impacts may not be contained to the specific community in question. Projects can also incur wider costs, such as seabed option fees and rental fees for offshore wind renewable energy developments and these funds can have a wider economic impact.
Additionally, this metric’s applicability varies with different project types. For instance, projects involving CCUS often repurpose existing infrastructure, without necessitating a new workforce. As a result, the direct local economic impacts of such projects might be limited, underscoring the need for careful consideration when using this metric to assess community benefit commitments.
Wider economic impact provides a valuable lens for understanding potential benefits. However, the challenges and variability associated with measuring and applying this parameter across project types should be carefully evaluated to ensure fair, accurate and consistent community benefit determinations. For these reasons, this parameter is not suitable for a socio-economic analysis framework.
Community involvement and capacity
During interviews, developers suggested that community involvement and capacity influence the ability to provide community benefits and should be considered as part of a framework. This parameter focuses on the role of communities in both shaping and managing the benefits derived from renewable energy projects. Interviewees highlighted that placing community needs at the core is essential for ensuring that the type and level of benefits align with local priorities. They emphasised the importance of community engagement, consultation, and feedback in moulding these initiatives, arguing that this involvement leads to more meaningful and tailored contributions.
Additionally, while not directly impacting a developer’s ability to offer community benefit, the capacity of communities to effectively manage and deliver agreed benefits was seen as important. Interviewees pointed out that variations in the size and organisation of community councils or other community groups can significantly impact their ability to administer benefits. Hence, recognising these differences allows developers to support and enhance the local capacity, fostering increased participation and benefit realisation from the projects.
However, there are several challenges to quantitatively measuring these aspects. Quantifying community engagement and feedback is subjective, as perceptions of effective engagement vary among stakeholders. Communities often have diverse and evolving needs, making standardisation difficult. Additionally, while the number of consultations can be counted, assessing their quality requires qualitative data, which is harder to quantify. Asking the community to accurately capture and record this data would put significant burden on individuals who quite often are volunteers in the community. Moreover, community needs can change over time, necessitating ongoing updates and flexible metrics.
Due to these challenges, it is not recommended to include this parameter as a stand-alone element in a socio-economic analysis framework.
Conclusion
Following the assessment outlined above, four parameters were deemed suitable to be considered in a socio-economic analysis framework. These were:
Technology maturity
Market maturity
Deployment and operating costs
Revenue and profit.
To demonstrate how a framework could be used in future, socio-economic analysis has been carried out based on a sample of data on renewable energy projects (see Appendix C). The parameters in scope of this analysis are restricted to those which have been deemed feasible to measure and for which a suitable method to measure them has been identified. This analysis is based on data available from the Community Benefits Register Database, supplemented with additional data sourced through desk research. Due to the data sources available, it only includes onshore wind, offshore wind and hydro technologies.
Key findings from that analysis are:
Industry alignment and policy influence: While many onshore wind and hydro projects in Scotland are clustering around the recommended annual £5,000 per MW capacity for community benefits for onshore technologies, more than half of the onshore wind and hydro projects analysed in the available data set commit less than the recommended amount.
Revenue-benefit correlation: A positive correlation exists between gross project revenue and total community benefit commitments, with larger projects providing bigger packages. However, this relationship weakens for high-revenue projects, suggesting a potential plateau effect.
Costs and benefit packages: There is a positive correlation between total cost of production and total community benefit packages across all project sizes, suggesting that as total costs increase, so does the size of the overall commitment to community benefits. While this may appear contrary to the views of developers shown earlier (i.e. those who said that high costs can impact on financial viability and therefore their ability to offer community benefits) it should be noted that this data analysis is based only on projects already providing monetary benefits. It excludes those that had not yet provided any community benefits. It can therefore be assumed that the dataset excludes those projects that were deemed not financially viable enough to enable community benefit provision.
In interpreting these findings and considering next steps it is important to acknowledge the distinction between the willingness of projects (measured by actual provision) to provide community benefits and their ability to provide community benefits. The analysis above is based on actual provision of community benefits. It could be assumed that these commitments are indicative of both willingness and some inferred level of ability, but the data does not allow for an assessment of the capability of projects (and different technologies) to offer these benefits. The UK Government’s Contracts for Difference (CfD) scheme is the main support mechanism for renewable energy projects. It is important to acknowledge that although community benefit funds are not recognised costs in the CfD framework, they are often treated as part of a project’s overall cost base and priced in to CfD bids.
Robust analysis of the capability to provide community benefits would require detailed project-level data. To collate the data needed will require considerable resources and will also require renewable energy technology developers to share data they perceive as commercially sensitive, which may be unrealistic. This work has highlighted considerable data gaps, challenges collecting data in the future and difficulty in sourcing data specifically focused on future ability to offer community benefits rather than actual performance. Therefore, the approach explored here does not provide a robust enough evidence base to underpin a framework for use as a decision-making tool.
To better understand the capacity for projects to provide community benefits, it is suggested that further research and / or alternative approaches may be needed. This could take the form of qualitative research with a larger selection of projects across the full technology spectrum, to understand perceived barriers or enablers of moving from willingness to ability. This should offer insights into the practical challenges faced by projects. Longitudinal case studies may prove beneficial to understand how changes in policy, economic conditions or market incentives could have influenced both the willingness and perceived capacity to make these commitments.
Exploring mandatory community benefit arrangements
This chapter looks at current approaches to mandating found in the evidence review and the views of the industry on how mandating community benefits for onshore technologies could work in practice, based on qualitative research with developers.
Key findings
Mandatory community benefits approaches exist in Denmark and Ireland, as part of renewable energy infrastructure development for wind projects. However, the literature reviewed does not allow for a satisfactory comparative analysis of the in-practice impacts of mandatory versus voluntary approaches.
Existing onshore developers felt that the following factors would need to be considered for mandating to work in practice:
clear guidance on the financial expectation attached to mandating
accounting for differences between individual onshore technologies
retaining a degree of flexibility, particularly in terms of the ability for community benefits to be designed around the needs of communities
avoiding overly burdensome processes.
Current approaches to mandating community benefits
Mandatory community benefits as part of net zero energy infrastructure development exist in Denmark and Ireland, specifically for onshore and offshore wind projects. Other countries have mandated approaches for shared ownership, special taxes, energy subsidies, or monetary compensations, but not community benefits as defined here. This includes Germany, France, Taiwan, and the Philippines [46].
Denmark has a history of various mandates relating to community benefits. For example, until 2018, the “Green Scheme” required the Danish state to pay hosting communities a fixed amount per kWh of production from new turbines. This applied to offshore wind farms built outside the tender process and within 8km of shore.[47] More recently, as of June 2020, regulations require offshore wind developers to pay fixed amounts per MW installed into green funds for affected municipalities. The payment is DKK 115,000 per MW (around €15,500).[48] Additionally, in Ireland, renewable energy auctions mandate that developers contribute €2/MWh to a community benefit fund, with defined criteria for how the funds must be spent.[49]
Other mandated approaches similar to community benefits include special taxes imposed on developers, that are distributed to local authorities, and electricity subsidies for “host communities”. The former approach has been implemented in France and Germany. The French Maritime Wind Turbine Tax is imposed on offshore wind farms, and is allocated to local authorities to finance local projects, per a defined formula. Germany requires that tax revenue generated from offshore wind farms in the Exclusive Economic Zone is distributed to coastal states. Energy subsidies for host communities have been implemented in the Philippines and Taiwan. Since 2008, the Philippines has required that 80% of money generated from royalties, or government shares in renewable projects, must be used to subsidise the electricity costs of communities affected by these projects.[50] In Taiwan, the Electricity Assistance Fund (EAF) is distributed to communities affected by power plant projects (including, but not limited to renewable energy) according to a pre-defined formula. For example, in the case of offshore wind, 30% of EAF funds are provided to “local project fund pools” for the benefit of residents, community groups, and civil society organisations, and 70% is provided for councils and fishery associations.[51]
Although shared ownership is seen distinct from community benefits in Scotland, some other countries have mandated shared ownership or compensation payments. For example, in Denmark, the 2008 Renewable Energy Act mandated developers to offer at least 20% of shares in wind projects for sale to local households within 4.5km of a turbine.[52] Similarly, in Germany, several states have required that between 10% and 25% of wind farm shares be offered to local residents and municipalities. Mandated compensation payments to nearby residents and community funds have been implemented in Denmark and Ireland. Since 2020, Irish legislation obliges wind farm developments to provide an annual contribution to nearby households and communities.
While some of the literature reviewed implies that mandated approaches are more robust,[53] no clear evidence is provided of their outcomes and impact compared to voluntary approaches. The literature does not allow for a satisfactory comparative analysis of the in-practice impacts of mandatory versus voluntary approaches.
Developers’ perspectives on how mandating community benefits could work in practice
Industry stakeholders shared their views on the potential for mandating community benefits for onshore technologies. Mandating was explored in both the scoping interviews with representative bodies and in the main interviews with developers. Developers highlighted some key considerations that they felt should be borne in mind for how mandating could work in practice.
For mandatory community benefits to work in practice, developers felt that there would need to be clear guidelines on what the financial expectation is to avoid any potential for confusion. It was suggested that the community benefit value attached to any mandated approach should be realistic and determined in collaboration with industry to help clarify what the expectations are for developers and for communities.
To work in practice, it was felt that mandatory community benefits would need to take into account the differences between different technologies. For example, by having different levels of benefits that technologies are expected to contribute. Specifically, some interviewees highlighted the different operating contexts and economies (e.g. different capital costs) between some technologies. Further, it was suggested that hydrogen and CCUS should be treated differently because they are designed to complement renewable technologies by operating only when needed. Therefore, it was argued that it is difficult to tie community benefits to specific metrics for these.
“[If] it would be used to set an X amount per megawatt, [then] that would need to be split into different technologies because it’s not a clear cut case for all technologies. It has to show this is what it is for BESS, what is for wind, what is for solar. Because if you get that number wrong, you can make the scheme unviable or unattractive and therefore it will not come forward.” – BESS stakeholder
It was also felt that for mandating to be practical, the approach to community benefits should retain some degree of flexibility and the ability to be designed around the needs of individual communities. For example, one onshore and offshore wind developer said if mandating were to happen it should be around the amount of funding that should be provided and not how communities spend the money. This view echoes findings of a report by BiGGAR Economics (2023) that states that the current voluntary system has allowed communities and developers to be flexible in their arrangements, and has enabled the “formation of mature, collaborative relationships” between parties. [54]
Related to the point above, some developers felt that, in practice, mandates could mean a more bureaucratic process which could slow things down, in turn impacting developers’ ability to deliver benefits. Stakeholders made contrasts with the current system, which was perceived as “fairly simple” and “flexible”. Therefore, it was suggested that approaches to mandates should avoid overly burdensome processes and bureaucracy. For example, it was suggested that it should avoid having too many restrictions around timescales or conditions on how communities should spend the funding.
Another view from developers was mandating might impact on the existing relationships between developers and communities, as it could move away from a collaborative process to one where there is a firmer expectation around what developers are required to give. Therefore, the approach would need to consider the relationships between developers and communities. Developers particularly felt it important to avoid community benefits appearing like compensation. For example, it was felt that creating a mandated system through which a certain amount is paid made directly to homeowners could lead to the system feeling like a form of compensation.
“If it’s mandated, it absolutely can’t be attributed as compensation to the community. If money had to be paid to compensate people for the effects of a wind farm, then the wind farm shouldn’t be being built.” – Multi-technology stakeholder
Aside from practicalities, a key concern raised was that mandating community benefit provision could risk investor confidence. Some developers felt that mandatory community benefits would have an impact on financial viability of projects, which could make investors less confident to invest. It was suggested that they may choose to invest in projects in other countries that do not have a community benefit mandate or in which they feel the approach is more straightforward.
“The danger with [mandating] is that it creates investor concerns. There’s a lot of competing geographies around the world that want money for renewable energy projects…If one country becomes difficult or the risks are harder to understand, they’ll move that investment to another country where they understand it. And the UK, and especially Scotland, runs a real risk of upsetting investor confidence, which is already very delicate because of the situations with the grid at the moment.” – Solar PV stakeholder
As the scope of this research was focused on understanding how different renewable technologies influence the level of community benefits offered by developers, interviews were conducted with a sample of renewable energy developers. A wide range of other stakeholders will have views.
Adjustments needed to Scotland’s current voluntary community benefits approach
This chapter sets out the extent to which any adjustments are required to the current voluntary community benefits approach based on findings from the literature review, interviews with developers and the design and testing of a socio-economic analysis framework.
Key findings
This research has not identified any obvious adjustments that need to be made to Scotland’s current community benefit approach. Developers felt that the current system could better acknowledge the different realities of different technologies, but they were not specific about what the best future approach should be.
Developers felt that guidance from the Scottish Government, in the form of Good Practice Principles and a recommended level of community benefit for onshore projects was a strength of the current process. However, for projects of emerging and/or non-generative technologies, developers noted that more targeted guidelines would be beneficial, noting that there is no established industry standard approach.
The intention was that the framework in this study could be used by Scottish Government to determine an appropriate expectation of the level and types of community benefit required for different renewable energy technologies. This work identified significant data gaps, challenges collecting data in the future, and the difficulty in sourcing data specifically focused on future ability to offer community benefits rather than actual performance. For these reasons, the framework explored here is not robust enough to use as a decision-making tool.
Lessons from literature and developers’ views
Based on the literature reviewed, there is limited evidence directly comparing how the different community benefit approaches in the UK and in other countries have impacted the level of community benefits delivered. Similarly, there is limited evidence to compare the impacts of mandated and voluntary approaches. International examples do not therefore provide any obvious lessons for the current approach in Scotland.
Onshore wind developers interviewed as part of this study were largely satisfied with the current arrangements. They felt that having a recommended standard (of £5,000 per MW per year for onshore) works well, helping them to predict what the cost associated with each project will be. Since it is a recommended, rather than compulsory standard, they also felt that it also allows for a degree of flexibility, meaning that the community benefit contribution can be responsive to both project and local community needs.
“That financial outlay [£5,000 per MW per year] is much more predictable in our models that we bake in during development…we actually really try to make sure that we can deliver it and protect it.” – Multi-technology developer
Developers of some less well-established technologies (e.g. hydrogen and pumped hydro storage) expressed a desire for clearer guidance from government on the appropriate levels of community benefit for these technologies. They suggested that new guidelines around levels of community benefit should take into consideration the differences in scale and impact between projects like pumped storage and hydrogen generation, which can be more expensive and less visible than wind projects. Those from non-generative technologies (e.g. BESS) felt that it is more difficult to determine the amount of community benefits (funds) that can be delivered from these projects because they have lower level of return (they do not yield energy) and serve a different function in the energy market than generation projects.
Developers also suggested that further structure and support for communities could help them to manage funds more effectively. They felt that community-led decision-making was vital for ensuring the funds meet local needs, but that this should be balanced with adequate administrative support to prevent the misuse or underutilisation of funds.
“There is also a misconception that communities are underspending this funding. Our analysis shows that if we invest and empower communities, then they are very capable of delivering impactful projects.” – Multi-technology developer
Lessons from testing a framework approach
As noted earlier, to effectively measure parameters identified in the proposed framework, project-level data would be required on costs, revenue, technology readiness levels and market maturity. Data on these metrics is not currently available and collecting this data would be a significant task.
Developers felt that certain parameters (see chapter 4) were considered suitable for a socio-economic analysis framework. However, their limited testing means that the framework would need more comprehensive data to fully model these parameters’ effects on community benefits. This is especially true for community benefit commitment data (£/MW/yr) which currently is only reported in the Community Benefits Register Database for onshore wind and hydro projects.
When discussing the idea of such a framework, developers noted that community benefits should not have a one-size-fits-all approach and should be reflective of specific circumstances of each technology and each project. Concerns were raised by some interviewees that a framework might lead to overly prescriptive approaches which could risk stifling development and deterring investment.
“Each [parameter] is relevant and I can see why they have been captured as things that would influence the value and viability of community benefits […] It all depends on an individual project basis, depends on what else is happening in terms of landscape and development.” – Multi-technology developer
Interviewees also questioned whether sufficient data would be available to support the framework and there was some concern about using historic data to understand future community benefit levels. A few interviewees also highlighted concerns about data sensitivity and need for any information to be carefully handled.
Considering the data gaps, challenges collecting data in the future, and the difficulty in sourcing data specifically focused on future ability to offer community benefits rather than actual performance, a single framework may not be the most appropriate approach.
Conclusions
This research looked at current and future approaches to community benefits to help inform decisions around future provision of community benefits in a way that is fair and consistent. This chapter draws conclusions around the three broad research aims:
To understand how different renewable energy technologies affect the capacity of developers to provide community benefits, including developing and testing a socio-economic analysis framework.
To understand how mandating community benefits could work in practice for onshore renewable energy technologies.
To help identify any necessary adjustments to the Scottish Government’s current voluntary community benefits approach for onshore and offshore to better support communities and industry as part of a just transition.
Understanding how different renewable energy technologies affect community benefits
Within the scope of this study, the available evidence did not support a single framework to robustly determine how different technologies affect community benefits. For such a framework to work as a practical, decision-making tool, quantitative data on the economics of different renewable energy technology projects would be required. However, existing public data is sparse and of inadequate quality to effectively measure the parameters within a framework and many developers were unable or unwilling to share commercially sensitive data about their projects. A further limitation was that existing data (e.g. on the value of community benefits from individual renewable energy projects) is based on actual provision rather than an assessment of project’s potential ability. Additionally, data available is largely historical and challenging to use when anticipating new technologies and emerging economic and regulatory models.
However, from data that was available, it was clear that the financial aspects of a renewable energy project (costs, revenue and financial viability) were key factors impacting the developers’ offer of community benefits. Projects with higher amounts of revenue and more robust and predictable financial returns are better positioned to offer significant community benefits. Conversely, if the financial viability of a development is low, then it is unlikely developers can offer community benefits without the project becoming non-viable. Developers noted that both technology maturity and market maturity can have an impact on a project’s financial viability and are therefore, indirectly, also linked to a project’s suitability to deliver community benefits. As discussed above, while there are existing tools for measuring technology and market maturity, data gathering is challenging.
Developers’ feedback also highlighted that it is easier to offer community benefits for more established technologies like onshore wind, compared to other technologies (e.g. solar and battery storage) due to the latter’s comparatively low profit margins. Less mature technologies (e.g., floating offshore wind, hydrogen) can have higher risks, higher delivery costs, less predictability in cost and performance, and lower investor confidence which can impact on their ability to offer benefits.
While not directly impacting on the level of community benefits offered, developers noted the importance of community engagement and capacity to effectively manage and deliver benefit funds. Interviewees highlighted the importance of community engagement, consultation and feedback in moulding community benefit initiatives, ensuring more meaningful and tailored contributions. However, this is difficult to quantify and would therefore be challenging to include in a socio-economic analysis framework.
How mandating community benefits could work in practice (for onshore renewable technologies)
The literature reviewed does not allow for a satisfactory comparative analysis of the in-practice impacts of mandatory versus voluntary approaches. Mandatory community benefits approaches exist in Denmark and Ireland, as part of net zero energy infrastructure development for wind projects. While the literature provides examples of where this was happening outside of the UK, it was less clear on the extent to which mandating had an impact on the level and nature of community benefits when compared with voluntary approaches.
Developers felt that for mandating to work in practice, a number of factors would need to be taken into consideration. It was felt that any future mandating approach should allow for the differences between technologies to be accounted for by setting, for example, different recommended levels of community benefit fund value. For mandating to work in practice, it was also felt that flexibility was key, particularly in terms of how communities could make use of the funding provided. Practicalities aside, there was some concern that mandating could potentially pose a risk to projects, by placing a financial burden on some projects (particularly those with smaller financial returns such as solar and BESS technologies) which could pose a risk to investors.
Any necessary adjustments to Scotland’s current voluntary community benefits framework for onshore and offshore
This research has not identified any obvious adjustments that need to be made to Scotland’s current community benefit approach.
Guidance from the Scottish Government, in the form of best practice principles and a recommended level of community benefit for onshore projects was highlighted in interviews with developers as being a strength of the current process. However, developers’ feedback suggests the current system needs to better acknowledge the different realities of different technologies. Developers of emerging and non-generative technologies suggested that more targeted guidelines for these newer technologies would be beneficial, noting that there is no established industry standard approach. However, while they suggested some areas for consideration, they were not specific about what the best future approach should be.
The intention was that the framework in this study could be used by the Scottish Government to determine an appropriate expectation of the level and types of community benefit required for different renewable energy technologies. The parameters that were considered suitable for the framework could provide a useful understanding of the factors that influence ability to offer community benefits. However, this would be dependent on data gaps being addressed. Ideally, it would have up-to-date data on community benefit value covering the full range of renewable energy technologies, with at least 50 projects for each technology.
This study has identified data gaps, challenges collecting data in the future and the difficulty in sourcing data specifically focused on future ability to offer community benefits rather than actual performance. The approach explored here does not provide a robust enough evidence base to underpin a framework for use as a decision-making tool.
Recommendations and next steps
The report highlights existing measurement tools and guidance that can be used to understand where a project sits in relation to certain parameters, such as technology and market maturity. To make the most of these tools, further data collection work would be needed before they could be used for robust socio-economic analysis. This would involve collecting relevant data for a representative sample of projects across the metrics that have already established measurement tools. This would require a significant time and resource commitment and may not, therefore, be a practical option.
To better understand the factors influencing the level of community benefit, beyond the financial indicators highlighted in this study, further research would be needed. Considering the challenge of sourcing quantitative data on project economics, further qualitative research may be the most feasible option. Ideally this would be with a larger selection of developers across the full technology spectrum (including those that had not been able to deliver community benefits), direct engagement with communities, and wider stakeholder engagement (e.g. project investors, funders and other partners that have assisted in project development). This type of engagement would add to and build on the insights gathered from developers in this study.
Glossary / abbreviations table
Acronym/Abbreviation
Definition
ARL
Adoption Readiness Level
BESS
Battery energy storage system
BWE
German Wind Energy Association
CCUS
Carbon capture utilisation and storage
EAF
Electricity Assistance Fund
ESG
Environmental, Social, and Governance
GW
Gigawatt
IEA ETP guide
International Energy Agency’s Energy Technology Perspectives guide
LCLO
Local Community Liaison Officer
LCOE
Levelised Cost of Electricity
LCOS
Levelised Cost of Storage
MW
Megawatt
NASA
National Aeronautics and Space Administration of the United States
REPD
Renewable Energy Project Database
SROI
Social Return on Investment
TRL
Technology Readiness Level
References
Anchustegui, I. H. (2021). Distributive justice, community benefits and renewable energy: The case of offshore wind projects.
Arsenova, M., & Wlokas, H. L. (2019). Local Benefit Sharing in Large-Scale Wind and Solar Projects. IFC.
Arsenova, M., Skyt, P., & Qadeer, A. (2024). The Strategic Value of Community Benefits in Offshore Wind Development. IFC.
BiGGAR Economics. (2023). Baseline report on Community benefit and shared revenue from onshore wind projects to communities in the south of Scotland.
BiGGAR Economics. (2024). Developing a new model to maximise local economic benefits from development in Moray and Highland. Report to Moray Council and Highland Council.
BiGGAR Economics. (2024). Impact Assessment of the Rosehall and Achany Wind Farm Community Benefit Funds.
Centre for Sustainable Energy (CSE), & Garrad Hassan. (2005). Community Benefits from Wind Power: A Study of UK Practice and Comparison with Leading European Countries.
Chen, H., Esram, N. W., Johnson, A., Harmon, D., Phelan, P., & Fraser, A. (2024). Aligning Community Benefits with Decarbonization Goals: Lessons Learned from Development of Community Benefit Plans for IRA Funds. American Council for an Energy-Efficient Economy.
Cowell, R., Bristow G., Munday, M. (2011) Acceptance, acceptability and environmental justice: the role of community benefits in wind energy development, Journal of Environmental Planning and Management.
Department for Energy Security and Net Zero (2023) Electricity Generation Costs (2023)
Devine-Wright, P., Devine-Wright, H., & Cowell, R. (2015). What do we know about overcoming barriers to siting energy infrastructure in local areas?
Ejdemo, T., Söderholm, P. (2015). Wind power, regional development and benefit-sharing: The case of Northern Sweden., Renewable and Sustainable Energy Reviews.
Égré, D., Roquet, V., & Durocher, C. (2007). Monetary benefit sharing from dams: A few examples of financial partnerships with Indigenous communities in Québec (Canada).
Energy UK. 2024). Energy in Action: Community benefits from local infrastructure.
Glasson, J. (2020). Community Benefits and UK Offshore Wind Farms: Evolving Convergence in a Divergent Practice.
Klain, S.C., Satterfield, T., MacDonald, S., Battista, N., Chan, K.M.A. (2017). Will communities “open-up” to offshore wind? Lessons learned from New England islands in the United States.
Kerr, S. (2018). Community benefits schemes – Fair shares or token gestures?
Kerr, S., Johnson, K., & Weir, S. (2017). Understanding community benefit payments from renewable energy development. International Centre for Island Technology, Heriot Watt University.
Lane, T., & Hicks, J. (2019). A Guide to benefit sharing options for renewable energy projects. Akin Consulting; Community Power Agency.
le Maitre, J. (2024). Price or public participation? Community benefits for onshore wind in Ireland, Denmark, Germany and the United Kingdom.
Manitius. (2023). Community Benefits Programs & Clean Energy.
Munday, M., Bristow, G., & Cowell, R. (2011). Wind farms in rural areas: How far do community benefits from wind farms represent a local economic development opportunity?
San Martin, O., Morales, E., Antas, J., Seumas, S., & Wallace, J. (2022). The winds of change: The role of community engagement and benefit-sharing in wind farm developments. Statkraft.
Scottish Government (2018). Scottish Government Good Practice Principles for Community Benefits from Offshore Renewable Energy Developments.
Scottish Government. (2019). Scottish Government Good Practice Principles for Community Benefits from Onshore Renewable Energy Developments (updated).
Toledano, P., Albin-Lackey, C., Andres, M. D., & Brauch, M. D. (2023). Community Benefit Sharing and Renewable Energy and Green Hydrogen Projects: Policy Guidance for Governments. Columbia Center on Sustainable Investment.
Van den Berg, K., & Tempels, B. (2022). The role of community benefits in community acceptance of multifunctional solar farms in the Netherlands.
Van der Waal, E. C. (2020). Local impact of community renewable energy: A case study of an Orcadian community-led wind scheme.
Walker, C. (2013). Towards Greater Acceptance of Wind Energy: A Review of Community Benefits Models.
Welsh Government (2022) Guidance for developers, local communities & decision-makers: Local and shared ownership of energy projects in Wales.
Wind Europe. (n.d.). Compendium of wind success.
Appendices
Appendix A – Methodology
Evidence review
Aims and objectives
The aims of the evidence review were to:
Explore best practice on community benefits in the UK and internationally in relation to renewable energy technologies.
Explore how community benefit schemes operate and examine their funding arrangements in the UK and internationally.
Provide examples of where community benefits have been mandated and what impact this has had on industry, communities and the delivery of renewable energy technologies.
Inform the socio-economic analysis in terms of identifying key parameters and contexts that impact the propensity to supply community benefits at varying scales.
Identify data sources for the socio-economic analysis.
Defining the research questions
To ensure the evidence review is useful in summarising best practises and informing the socio-economic analysis the following research questions were defined:
Research Question 1 – What is the best practice on community benefits from onshore and offshore renewable energy technologies internationally?
Research Question 2 – How does the UK differ from international counterparts on the processes on the provision of community benefits? How does this impact the level of community benefits?
Research Question 3 – Which (if any) countries mandate community benefits as part of net zero energy infrastructure construction? What impact has this had on the provision of community benefits? What impact has this had on communities and the delivery of net zero energy policies?
Additional Scoping – What data is available on the levels of community benefits, and their corresponding technologies/market maturities/technology maturity and other hypothesised parameters which influence the provision of community benefits?
Scope of the literature search
The literature search included the identification of relevant sources from:
Existing research into/evaluations of community benefit schemes
Academic literature
Grey literature
Policy documents
Media publications
The search for literature was primarily done through using Google and Google Scholar but also used sources such as JSTOR, Scopus, and organisational websites where necessary. Whilst we did not take a strict view on the geographical scope of our search, we favoured countries which are contextually similar to the UK (European countries, US, Australia) as it is likely these findings will be more relevant to the UK.
We explored literature relevant to onshore and offshore renewable energy technologies. This included, but was not limited to, wind, solar, hydro, wave, thermal, pumped hydro storage, bioenergy, battery storage, hydrogen, Negative Emission Technologies (NETs) and transmission infrastructure. The ability to look at these internationally was dependent on the context and energy mix of the countries in question. It was decided that it would also be useful to assess levels of community benefits for technologies which may be emerging in the UK but are more established elsewhere, bringing in the Three Horizons approach featured in the proposal.
Search Terms
Some initial search terms for covering the aforementioned specifications and research questions were developed and are presented in the table below:
Search Term (Google/Google Scholar)
Relevance/comments
“[insert technology] community benefits best practice [international/UK/insert country]”
All technologies and internationally. This will support answering RQ1 and part of RQ2 by allowing for a comparison between countries.
“[insert technology] community benefits monitoring [international/UK/insert country]”
All technologies and internationally. This will support answering RQ1 and part of RQ2 by allowing for a comparison between countries.
“[insert technology] community benefits evaluation [international/UK/insert country]”
All technologies and internationally. This will support answering RQ1 and part of RQ2 by allowing for a comparison between countries.
“[insert technology] community benefits lessons [international/UK/insert country]”
All technologies and internationally. This will support answering RQ1 and part of RQ2 by allowing for a comparison between countries.
“[insert technology] community benefits impacts [international/UK/insert country]”
All technologies and internationally. This will support answering RQ1 and part of RQ2 by allowing for a comparison between countries.
“[insert technology] community benefits funding arrangements [international/UK/insert country]”
All technologies and internationally. This will allow us to understand the structure of community benefit funds, supporting RQ1 and RQ2
“[insert technology] community benefits management arrangements [international/UK/insert country]”
All technologies and internationally. This will allow us to understand the structure of community benefit funds, supporting RQ1 and RQ2
“[insert technology] mandate/mandated/mandating community benefits [international/UK/insert country]””
All technologies and internationally. This will provide an answer to RQ3, where we can begin to assess the impact of mandating community benefits and what this looks like in practise
“[insert technology] community benefits press release”
This search supports the scoping of what is feasible for the socio-economic analysis. At this stage, a high-level search will be conducted, with more in depth web scraping for data (if possible) to be completed as part of the socio-economic analysis.
Prioritisation approach
A long list of 86 sources were initially identified which were then prioritised using the prioritisation criteria set out below:
Based on existing evidence: Does the document focus on existing practice/examples of renewable projects/developments?
Focus on community benefits: Is the main focus of the document around the provision of community benefits (as opposed to for e.g. broader discussions of social acceptability of renewable energy developments OR community engagement)?
Policy guidance: Does the document include policy recommendations/best practice guidance/reflections on lessons learned?
Geographical scope: Does the geographical scope of the document include Europe, the UK or US?
Peer reviewed / grey literature: Peer reviewed sources were prioritised over grey literature sources.
Additional considerations:
Ensuring the inclusion of evidence on a wide spread of renewable technologies.
Ensuring the inclusion of evidence from both voluntary and mandatory community benefits schemes.
Ensuring the inclusion of evidence from a wide spread of types of community benefits.
Additional sources were added to the short-list of literature as suggested by Scottish Government and stakeholders in the scoping interviews. A total of 35 sources were reviewed in-depth. The final list of literature sources reviewed included 12 peer reviewed academic papers, 20 reports, 2 guidance documents from grey literature (e.g., renewable energy developers, private consultancies) and 1 policy document. The publication years of the reviewed documents ranges from 2011 to 2024, with 22 documents from the last 5 years.
Evidence extraction
The prioritised literature sources were then reviewed and findings relevant to the research questions were extracted into an excel sheet. Ipsos Facto, a Large Language Model, was used to assist with identifying and summarising relevant data.
Scoping interviews
In parallel to the evidence, we conducted four in-depth scoping interviews with industry bodies, trade associations, and members of developer groups to enhance the findings from the evidence review.
The aim of these interviews was twofold:
to understand their views on different types of community benefits and their perceptions of current / best practice arrangements related to community benefits;
to explore options for sourcing data from the industry, including the types of information they think businesses will / will not be prepared to share with us.
Learnings from the scoping interviews were used specifically to inform the design of the subsequent stakeholder engagement and framework development.
Developer interviews
In-depth interviews were conducted with 21 industry developers. Interviewees covered a range of technologies including onshore wind (7), offshore wind (7), solar PV (5), battery storage (6), grid stability (1), hydro (3), pumped hydro storage (3), hydrogen (6 including 2 green hydrogen) and carbon capture, utilisation and storage (2). Among interviewees, 11 were mostly multi-technologies developers and 10 were single-technology developers.
The objectives of the interviews were threefold:
To gather qualitative data on the types of community benefits they have delivered/plan to deliver, views on current arrangement for community benefits and potential different approaches (including mandating for onshore), and what factors have contributed to the provision/ success of their community benefits (i.e. to help inform what parameters are most important in informing potential future community benefits). This will help contextualise the socio-economic analysis and the findings in the report.
To gather quantitative data that we will then use in our analysis, using the parameters set out in the framework (these will be developed further based on CXC/SG feedback). This will include information such as the cost of developing the project(s), value of community benefits, proportion of those values in comparison with turnover/profit, employment impacts etc.
To help reframe/revise the socio-economic analysis framework as required, based on their views on what parameters/variables are important
Ahead of the interview, stakeholders were also requested to complete a ‘Data request sheet’ that aimed to gather data for the socio-economic analysis (see below).
Framework development
The development of the framework to assess the influence of various parameters on community benefits involved a systematic approach following stakeholder interviews. Each initial parameter underwent a comprehensive evaluation to determine the feasibility of its measurement and potential impact on community benefit commitments.
Assessment of measurement challenges. Initially, each parameter was scrutinised to identify any inherent challenges or limitations in its measurement. This involved examining the complexity, availability of data, and any factors that could hinder accurate quantification.
Identification of pre-existing measures. For parameters where it was determined that measurement challenges were minimal or non-existent, existing methodologies and measures were sought. This step involved a thorough review of established metrics and tools already in use.
Development of proxy measures. In cases where no established measures were applicable, proxy measures were devised. This involved identifying the closest available data that could serve as a stand-in to approximate the parameter’s influence on community benefits. These proxies were selected based on their relevance and potential to offer meaningful insights.
Throughout this process, each parameter’s potential to influence community benefits was evaluated. This iterative methodology ensured a robust and nuanced framework, capable of effectively guiding future assessments and decisions concerning community benefit commitments.
Socio-economic analysis
To illustrate the application of the framework, a socio-economic analysis was conducted using a sample dataset of renewable energy projects. This analysis examined the relationship between the parameters detailed in Section 5 and the levels of community benefits, employing the methodologies outlined in the framework.
The analysis focuses on parameters deemed feasible to measure with available methods, specifically revenue and costs, along with technology type. Technology type was used as a proxy for technology maturity, given the current uniformity of maturity levels within each technology. The analysis relied on data from the Community Benefits Register Database, supplemented by additional information obtained through desk research.
For this analysis, the scope included onshore wind, offshore wind, and hydro technologies. These were chosen based on their data availability and relevance to the parameters evaluated.
Appendix B Examples of community benefit-sharing initiatives
Table 2 Examples of community benefit-sharing initiatives and related guidance for renewable technologies in selected European countries (from O San Martin et al. (2022)
Country
Guidance document
Scope of initiative
Scotland
Scottish Government: Onshore Wind Policy Statement (2017); Scottish Government: Good Practice Principles for Community Benefits from Onshore Renewable Energy Developments (2019 Update); and Good Practice Principles for Community Benefits from Offshore Renewable Energy Developments (2018)
Wind farm operators currently utilise both community funding options and shared ownership, both are seen as good practices and responsive to the local community’s specific wishes.
England
Community Benefits from Onshore Wind Developments: Best Practice Guidance for England (2021)
Both a community benefit fund and community shared ownership are recommended. Noted that many developers are providing funds significantly below the recommended amount.
Ireland
Code of Practice for Wind Energy Development in Ireland Guidelines for Community Engagement; and Best Practice Guidelines for the Irish Wind Energy Industry (2012)
ORESS 1 Community Benefit Fund – Rulebook for Generators and Fund Administrators (2023)
Irish wind farm operators currently offer both community funding options and shared ownership; both are seen as good practices.
Netherlands
Dutch Wind Energy Association (NWEA): Code of Conduct for Acceptance & Participation of Onshore Wind Energy (2016)
Both a community benefit fund and community shared ownership are acceptable, but shared ownership is generally preferred and expected by local communities.
Germany
German Wind Energy Association (BWE):
“Collectively Winning – Local Wind Energy”: Framework Paper for the topics added value, public participation, and acceptance (2018);
“Citizen-owned Wind Energy” – Energy from the region for the region (2013)
Best practice in Germany heavily tends towards community stakes/shared ownership in wind farms as the main model of how communities benefit. In contrast, the community funding model is less well-received in Germany.
Appendix C Socio-economic analysis results
To demonstrate how the framework could be used in future, socio-economic analysis was carried out based on a sample of data from net zero energy projects. This analysis explores the relationship between the parameters outlined in chapter 4 and the levels of community benefits, using the methods outlined in the framework.
The parameters in scope of this analysis are restricted to those which have been deemed feasible to measure and for which a suitable method to measure them has been identified These include revenue and costs, as well as technology type (which serves as a proxy for technology maturity, as maturity levels do not vary within technologies currently). It should be noted that this analysis is based on data available from the Community Benefits Register Database, supplemented with additional data sourced through desk research. Due to the data sources available, it only includes onshore wind, offshore wind and hydro technologies.
The subsequent analysis in this chapter presents the relationships between the measurable parameters for which data is available and the level of community benefits.
Key findings
Industry alignment and policy influence. Many onshore wind and hydro projects in Scotland are clustering around the recommended annual £5,000 per MW capacity for community benefits for onshore technologies. However, a significant number of onshore wind and hydro projects (more than half of those analysed in the available dataset) commit less than the recommended amount.
Revenue-benefit correlation. A positive correlation exists between gross project revenue and total community benefit commitments, with larger projects providing bigger packages. However, this relationship weakens for high-revenue projects, suggesting a potential plateau effect.
Costs and benefit packages. There is a positive correlation between total costs and total community benefit packages. For projects costing less than £25 million, when comparing onshore wind and hydropower projects of the same energy capacity and with equivalent community benefit budgets (£5,000 per MW annually), onshore wind offers greater community benefits per pound spent on energy production.
Analysis of community benefit commitments
Many onshore wind and hydro projects in Scotland are aligning with the recommended community benefits package of £5,000 per MW capacity. The clustering of commitments around the recommended amount suggests that policy guidelines are influencing industry behaviour, but full compliance among onshore projects has not yet been achieved. This is observed in Figure 1 by the number of projects committing less than the recommended amount. Of the 282 onshore wind and hydro projects analysed, 177 were committing less than the recommend amount.
There exists a small but notable group of projects that have committed to providing community benefits from onshore renewable energy developments above the recommended £5,000 per MW capacity. These projects may be setting new benchmarks for corporate social responsibility. The strong concentration around the £5,000 figure could indicate an opportunity for standardising community benefit packages across the industry, potentially simplifying expectations for both developers and communities.
Figure 1 Distribution of Annual Community Benefit Commitments per MW – Onshore Projects
Source: Community Benefits Register Database
Figure 2 below illustrates where most of the data points are concentrated and the variation in the data. There are distinct patterns in community benefit commitments across the two different onshore renewable technologies shown. Figure 2 shows that hydro projects commitments range between £456 and £5,000 per MW per year, while onshore wind commitments range between £60-£20,000 (the upper end of this range is not visible in Figure 2 below as this distorted the shape and scales of the figure).
There is a concentration of commitments around the £5,000 figure for both hydro and onshore wind which aligns with the recommended amount (as demonstrated by the width of the violin plot), indicating a level of industry-wide acceptance of this guideline for land-based projects.
Figure 2 Distribution of Annual Community Benefit Commitments per MW by Onshore Technology
Source: Community Benefits Register Database
Figure 3 below shows the distribution of community benefit commitments among offshore projects. It should be noted that there was very low coverage of offshore wind projects captured in the register, and hence efforts were made to manually collect benefits data through desk-based research. This may have resulted in some discrepancies in actual provision versus what projects would have reported through the register. Figure 3 shows offshore wind projects notably committing lower amounts compared to onshore wind and hydro projects, with a range between c.£20-£2,000 per MW per year. It is acknowledged here that this analysis is based on 21 projects out of a possible 47 operational offshore wind projects in the UK[55] and therefore figures should be treated with caution.
Figure 3 Distribution of Annual Community Benefit Commitments per MW – Offshore Projects
Source: desk research
There are several reasons why offshore wind projects might be committing lower amounts than their onshore counterparts. Most importantly, onshore renewable energy projects in Scotland are encouraged to offer community benefits, typically around £5,000 per megawatt of installed capacity annually. This is a voluntary guideline, not a requirement, specifically for onshore projects, and does not apply to offshore projects. Beyond this, offshore wind farms, being located further from communities, might be perceived as having less direct impact on local populations, potentially justifying lower community benefit packages. The offshore wind sector in Scotland is also at an earlier stage of development compared to onshore technologies, with community benefit standards still being defined. This technological and market immaturity means standards for community benefits are still evolving within this sector. In contrast, onshore wind technologies are more established and benefit from years of development and market experience. The advanced state of onshore wind technology may allow for greater efficiency and cost reduction, enabling more substantial community support relative to their offshore counterparts. Moreover, the scale of offshore wind projects may mean that while there are lower per-MW commitments, the overall total community benefits package may still be substantial.
Analysis of community benefit parameters and their impact
Revenue and profit
Figure 4 below illustrates the relationship between estimated gross revenue and total community benefit commitments over the project lifetime. The relationship is split and visualised by revenue levels due to the variation in the strength of the relationship as revenue changes. Blue dots represent projects that have committed £5,000 per MW per year, while red dots represent any figure other than the recommended £5,000 per MW. There is a clear positive correlation between gross project revenue and total community benefit commitments across all renewable energy projects in Scotland. This suggests that as projects become more financially substantial, they tend to provide larger community benefit packages. As project size increases in revenue terms, there is a widening range of community benefit amounts. This indicates that larger projects have more diverse approaches to community support. The relationship between gross revenue and community benefits appears to weaken for larger revenue projects. This suggests a potential plateau effect where community benefit increases do not keep pace proportionally with revenue growth beyond a certain point.
Small (under £35m gross revenue) and medium-sized (£25-250m gross revenue) projects frequently demonstrate commitment to the recommended £5,000 per MW amount, suggesting strong guideline adherence among projects of these scales. Across these sized projects, there are few instances of commitments exceeding the recommended amount relative to their revenue, suggesting a general reluctance to exceed standard guidelines.
Figure 4 Community Benefits Package by Gross Revenue Bucket (Under £25M, £25M-£250M and £250M+ Gross Revenue)
Source: See appendix F (Recommended data sources)
Deployment and Operating Costs
Figure 5 below shows the relationship between estimated total cost of production, expressed as the average cost of producing one unit of energy (LCOE – £/MWh) multiplied by total expected production over the project lifetime, and total community benefit commitments over the project lifetime. As above, the relationship is split and visualised by total cost of production levels due to the variation in the strength of the relationship as total cost changes. There is a positive correlation between total cost of production and total community benefit packages across all project sizes, suggesting that as total costs increase, as does the size of the overall commitment to community benefits. The correlation between total cost and total community benefit are relatively strong (Pearson correlation coefficient[56] = 0.56) at lower total cost levels (under £25M total cost). This increases to 0.62 for mid-sized projects (£25-250M total cost). However above £250M total costs, there is no correlation (Pearson correlation coefficient=-0.002), indicating that total cost plays less of a role in determining community benefits at large cost levels.
While this may appear contrary to the views of developers shown earlier (i.e. those who said that high costs can impact on financial viability and therefore their ability to offer community benefits) it should be noted that this data analysis is based only on projects that were already providing monetary community benefits. It excludes those that had not provided any benefits. It can therefore be assumed that the dataset excludes those projects that were deemed not financially viable enough to enable community benefit provision.
This analysis goes further to explore whether there are any differences by technology class within onshore projects only (offshore projects have been removed at this stage as the recommended £5,000/MW applies only to onshore technologies). In order to do so, it is important to control for project size (as measured by MW capacity), so as not to produce spurious results. Figure 6 illustrates how many pounds (£) are allocated to community benefits for every pound (£) spent producing energy, categorised by the project’s size in capacity (MW). Blue dots represent projects that have committed less than the recommended £5,000 per MW per year, while green dots represent projects that have committed more than the recommended amount and red dots represent project that have committed the recommended £5,000 per MW. For projects with total production costs under £25 million, when comparing hydro and onshore wind projects of the same capacity that both allocate £5,000 per MW annually to community benefits, onshore wind projects are actually providing more community benefits per pound (£) spent on energy production than hydro projects.
Figure 5 Community Benefits Package by Total Cost of Production Bucket (Under £25M, £25M-£250M and £250M+ Total Cost)
Source: See appendix F (Recommended data sources)
Figure 6 Community Benefits Package by Total Cost of Production Bucket (Under £25M, £25M-£250M and £250M+ Total Cost)
Source: See appendix F (Recommended data sources)
Appendix D Methodologies for estimating revenue and costs
Expected Generation (MWh) = Capacity (MW) * Capacity Factor* Hours in a year
Breaking down these components:
Installed Capacity (MW): This represents the maximum power output of the project under ideal conditions. This data is readily available from the Renewable Energy Planning Database (REPD).
Capacity Factor: This represents the actual output of a project as a percentage of its maximum potential output over a specific period. Historical capacity factors for certain technologies (onshore wind, offshore wind, hydro, landfill gas, and sewage sludge digestion) in Scotland can be found in the Energy Trends: UK Renewables publications[57].
Addressing Missing Capacity Factors: For technologies where Scotland-specific capacity factors are unavailable (e.g., solar PV, tidal, wave, biomass), several approaches can be used:
UK-wide Proxies: Use UK average capacity factors as a starting point, acknowledging this as a limitation and potential source of error.
Technology-Specific Adjustments: Adjust UK proxies based on technology and location characteristics. For example, solar PV capacity factors are influenced by latitude and solar irradiance. Tools like PVGIS can provide location-specific solar irradiance data to refine estimates (this approach is out of scope for the analysis in this study).
Average Annual Electricity Price (£/MWh): This represents the average price received for each MWh of electricity generated over a year. Given the difficulty of obtaining project-specific PPA data, the wholesale market price serves as a practical proxy.
Wholesale Price Data Sources: While real-time wholesale price data requires plugging into Elexon’s BMRS API, a simplified approach for this framework should entail using Ofgem’s published weekly wholesale day-ahead price data[58] to calculate annual averages. These are GB-wide averages, and hence regional variations should be recognised as a limitation.
Simplified CfD Approach (for CfD-supported projects): For projects under a Contract for Difference (CfD) the strike price is a guaranteed price. This figure is a conservative estimate of returns, as actual revenue could be higher if market prices exceed the strike price. CfD data is available from the Low Carbon Contracts Company (LCCC).
Estimating Future Revenue (also applicable for projects not yet operational) – Generation Projects
For revenue in future years, or for projects under development or construction, estimating future revenue requires additional considerations:
Project Lifetime Assumption: Specify a reasonable assumed operational lifetime for the technology (e.g., 25 years for offshore wind, 20-25 years for solar PV). This assumption directly impacts total revenue calculations.
Future Capacity Factor Estimation: Project future capacity factors based on recent trends and technological advancements. If historical capacity factor data for the specific technology in Scotland (or a similar region) is available, this trend should be analysed over the past years.[59] This trend should be extrapolated outward to estimate future capacity factors. For less established technologies with limited historical data, the technology’s maturity should be considered. Rapidly evolving technologies may see more significant performance improvements expected while more mature technologies might expect to see more stable future performance anticipated. For example, floating offshore wind might be expected to see larger capacity factor gains in the coming years compared to a more established technology like onshore wind.
Future Electricity Price Estimation: Given the volatility of electricity markets, projecting future prices is challenging. For projects supported by a Contract for Difference (CfD), the strike price offers a guaranteed future revenue stream and can be used as a conservative estimate. For non-CfD projects, where future revenue is directly exposed to market price fluctuations, a simplified approach involves using the average annual CfD strike price for the corresponding technology in each future year. However, it’s essential to acknowledge that:
CfD strike prices are influenced by auction dynamics and may not perfectly represent the market value of electricity from non-CfD projects.
Not all technologies are represented in CfD auctions.
Using CfD strike prices as proxies across all non-CfD projects might result in a somewhat conservative revenue estimate, as market prices could exceed the strike price in some years.
Prices beyond the latest future year reported in the CfD auction reports are set at the price in the latest year for the respective technology. For example, if CfD auction strike prices are set for the year 2027, the strike price in all future years will be set at the prices in 2027 for that technology. It is acknowledged these prices are unrealistic, however, they serve as the most appropriate benchmark against which to extrapolate.
Discounting Future Cash Flows: To compare projects and scenarios, discount future revenue streams to their present value using an appropriate discount rate that reflects project risk. We propose using the technology-specific discount rate of 10% used by DESNZ in their Levelised Cost of Electricity (LCOE) methodology documents.
Total Cost of Production Calculation
Total Cost of Production Calculation – Generation Projects
Estimating the total lifetime cost of production across the range of projects in scope requires a consistent and transparent method to apply cost assumptions across different generation technologies. To support this, we use benchmark Levelised Cost of Electricity (LCOE) estimates published by DESNZ.
DESNZ’s LCOE values represent the average lifetime cost (£/MWh) of generating electricity for each technology type. These figures include all relevant capital, operational, fuel, and decommissioning costs, spread over the expected lifetime electricity output of a project. As such, LCOE is a useful and well-recognised benchmark for comparing the cost-effectiveness of electricity generation technologies in the UK.
Importantly, we are not re-estimating or recalculating LCOE. Instead, we are using DESNZ’s published LCOE values as input parameters in our framework to estimate total cost of production across different project configurations. Specifically, we apply the LCOE estimates to the expected energy output of each project to calculate a total cost figure. This calculation can be expressed as:
Total Cost of Production (£) = LCOE (£/MWh) x (Installed Capacity (MW) x Load Factor x Annual Operating Hours x Project Lifetime (years))
This approach allows us to derive a consistent estimate of total production cost, using technology-specific LCOE values as cost rates, scaled by the expected energy output of each project over its lifetime.
The process for estimating total cost of production is as follows:
Technology categorisation: Categorise REPD projects to align with the technology categories used in the UK Government’s LCOE estimates file. This may involve mapping project types to the closest matching category in the government data.
Energy Output Calculation: Estimate the annual energy output (MWh) for each project based on its capacity and typical capacity factors for the relevant technology.
Total calculation: Using the scaled cost components and estimated energy output, we will calculate the total cost for each project using the formula. It’s important to note that the UK Government’s LCOE estimates are provided for projects with commissioning dates in 2025, 2030, 2035, and 2040. Therefore, our total cost calculations will need to be based on the estimate that most closely matches each project’s expected commissioning date. We will assign each project to the nearest available estimate year based on its planned commissioning date.
Inflation-adjustment: Furthermore, all costs in the UK Government’s estimates are reported in 2021 prices. To ensure consistency and accurate comparisons across projects with varying commissioning dates, we adjust these figures to a common base year using HM Treasury GDP deflators. These temporal adjustments will help ensure that our total cost calculations accurately reflect the economic conditions and technological advancements expected at the time of each project’s commissioning, within the constraints of the available data.
Appendix E Socio-economic scoring mechanisms
Table 3 NASA Technology Readiness Levels
TRL
TRL Summary
1
Basic principles have been observed and/or formulated: Lowest level of technology readiness. Scientific research begins to be translated into applied research and development (R&D). Examples might include paper studies of a technology’s basic properties.
2
Developing hypothesis and experimental designs: Invention begins. Once basic principles are observed, practical applications can be invented. Applications are speculative, and there may be no proof or detailed analysis to support the assumptions. Examples are limited to analytic studies.
3
Specifying and developing an experimental Proof of Concept (PoC): Active R&D is initiated. This includes analytical studies and laboratory studies to physically validate the analytical predictions of separate elements of the technology. Examples include components that are not yet integrated or representative.
4
PoC demonstrated in test site/initial evaluation of costs and efficiency produced: Basic technological components are integrated to establish that they will work together. This is relatively “low fidelity” compared with the eventual system. Examples include integration of “ad hoc” hardware in the laboratory.
5
Technology/process validated in relevant environment: Fidelity of breadboard technology increases significantly. The basic technological components are integrated with reasonably realistic supporting elements so they can be tested in a simulated environment. Examples include “high-fidelity” laboratory integration of components.
6
Technology/process validated in operational environment: Representative model or prototype system, which is well beyond that of TRL 5, is tested in a relevant environment. Represents a major step up in a technology’s demonstrated readiness. Examples include testing a prototype in a high-fidelity laboratory environment or in a simulated operational environment.
7
System complete and qualified: Prototype near or at planned operational system. Represents a major step up from TRL 6 by requiring demonstration of an actual system prototype in an operational environment (e.g., in an aircraft, in a vehicle, or in space).
8
Product/technology in manufacture/process being implemented: Technology has been proven to work in its final form and under expected conditions. In almost all cases, this TRL represents the end of true system development. Examples include developmental test and evaluation (DT&E) of the system in its intended weapon system to determine if it meets design specifications.
9
Product/service on commercial release/process deployed: Actual application of the technology in its final form and under mission conditions, such as those encountered in operational test and evaluation (OT&E). Examples include using the system under operational mission conditions.
Fully Mature Market: A fully mature market is characterized by high levels of competition, well-established regulatory and policy frameworks, and a global supply chain. The technology is fully integrated into the energy system, and investment is based on market forces rather than policy incentives. The market operates efficiently with clear pricing signals. Hydropower, especially conventional dam-based installations, has a fully mature market with a global presence and long history of integration into energy systems.
4
Established Market: Established markets have a stable and supportive regulatory environment, a robust and competitive supply chain, and a broad base of stakeholders. Investment is seen as lower risk, and financing models are well understood. There is strong competition, and the technology is a significant part of the energy mix. Onshore wind and solar PV have both reached this level of market maturity, with widespread adoption and a solid market presence.
3
Growing Market: At this stage, markets are experiencing noticeable growth in demand and investment. The regulatory environment is becoming more supportive, with clearer policies and standards. The supply chain is expanding, and costs start to decrease as economies of scale are realized. There is a healthy level of competition with several established players. Fixed-bottom offshore wind is at this stage, with a growing number of projects and increasing investor confidence.
2
Emerging Market: Markets at this stage have begun to establish some regulatory frameworks and attract early adopters. The supply chain is forming but may not be fully reliable or cost-effective. There is a growing interest from investors, but financing often depends on policy incentives. Competition is limited, but there are signs of market growth. Floating offshore wind, which is beginning to see commercial interest and investment, but lacks the extensive market presence of fixed-bottom offshore wind, would fall into this category.
1
Nascent Market: The market at this stage is in its infancy. There are few, if any, regulatory standards or guidelines, and the supply chain is undeveloped. Investment is highly speculative, and there are very few players in the market. The technology may still be reliant on grants or government support with no established commercial financing models.
Appendix F Recommended data sources
The following below provides a summary of the key data sources currently available to measure framework parameters. However, these are not complete and additional work is required to fill gaps.
Parameter
Measurement item
Recommended data source
Community Benefit
Community benefits monetary value (£)
Community Benefit Register Database. Since the database does not cover all technologies, this would need to be supplement with data from individual developers, either through requesting this directly or sourcing it from company reports (where available).
Technical maturity
Technology maturity scoring
NASA TRL Scale
IEA ETP Clean Energy Technology Guide. While the database is comprehensive in its technology classification, there is likely to be some mis-classification of REPD projects to specific IEA ETP technologies. Ideally, project TRLs should be sourced directly from project owners.
Project revenue
Installed capacity
Community Benefit Register Database and REPD
Capacity factor
Energy Trends: UK Renewables publications. Historical capacity factors are only available for certain technologies. Newer technologies are therefore not captured and will need to be sourced directly from projects.
Electricity price
Elexon
Ofgem wholesale day-ahead price
CfD strike price
Low Carbon Contracts Company
Capital and operating costs
Technology categorisation
UK Government’s LCOE estimates. This data source captures LCOE for a selection of common technologies. More niche/newer technologies are not captured within this data source and therefore should be collected directly through projects.
Energy output
REPD
Energy Trends: UK Renewables publications
How to cite this publication:
Mulholland, C., Jones, R., Tapie, N. and Stow, C. ‘Renewable energy technologies and community benefits’, ClimateXChange. http://dx.doi.org/10.7488/era/6396
While every effort is made to ensure the information in this report is accurate as at the date of the report, no legal responsibility is accepted for any errors, omissions or misleading statements. The views expressed represent those of the author(s), and do not necessarily represent those of the host institutions or funders.
This work was supported by the Rural and Environment Science and Analytical Services Division of the Scottish Government (CoE – CXC).
Community benefit funds typically mean that developers will voluntarily contribute a certain amount of funding to local communities. In some cases, the level of funding is linked to the amount of installed capacity of the project or the amount of energy produced. ↑
Kerr et al (2017), Anchustegui (2021), Kerr & Weir (2018), O San Martin et al (2022), Scottish Government (2022), Scottish Government (2019), Scottish Government (2018) ↑
In the reviewed literature, shared ownership was a common practice in countries outside the UK, notably in Germany and Denmark. However, this is not outlined here as shared ownership is not part of the Scottish Government’s definition of community benefits. ↑
le Maitre, 2024; Toledano, et al., 2023; O San Martin, et al., 2022; ↑
Four operational offshore wind projects were in Scotland, two in Wales and fifteen in England. ↑
The Pearson correlation coefficient measures how strongly two variables are linearly related, ranging from -1 (perfect negative correlation) to 1 (perfect positive correlation), with 0 indicating no linear relationship. ↑
It is recommended to aim for a minimum of 5 years of historical data. This provides a reasonable basis for identifying trends and patterns, while also smoothing out short-term fluctuations or anomalies. ↑
Minimising peat excavation is crucial in order to avoid carbon emissions, protect biodiversity and ensure downstream water quality. Built development on peatlands results in the excavation and disturbance of peat. In order to ensure evidence-based planning and consenting decisions there is a need to gather evidence on the impacts and opportunities regarding the reuse of excavated peat. This will help to inform how best to balance the benefits of renewable energy with the need to protect and restore peatland habitats, ensuring sustainable development practices.
This project investigates the opportunities, impacts, and challenges associated with the reuse of excavated peat from windfarm construction sites. It provides a greater understanding of the current knowledge concerning wind farm development on peatland, peat and peaty soils across Scotland. We propose a hierarchy of peat reuse options based on environmental impact and offer recommendations for data collection and monitoring to enhance the evidence base.
The research combined a review of published evidence with stakeholder engagement and site visits.
Findings
We found very little academic research specifically investigating best practice for the reuse of peat on windfarms. We therefore used stakeholder discussions and site visits to understand the current situation, what is occurring at different sites within Scotland, and likely environmental costs and benefits of different reuse options.
Key issues
Avoidance of peat excavation: Minimising peat excavation is crucial. As a critical first step of the mitigation hierarchy, different stakeholders agree the need to limit volumes to protect peatland, biodiversity, and maintain hydrological connectivity.
Preparation and planning issues: Site surveys often lack the requisite detail to effectively avoid deep peat areas during construction. It also leads to problems with planning how to reuse greater volumes of peat than expected. Additional training for construction operatives would enable them to minimise peat disturbance and maintain the excavated peat’s structure.
Carbon storage: Accurate carbon calculations are needed to fully understand the impact of the wind farm. However, this study found that more peat is often excavated than planned, highlighting the need for greater accuracy in carbon excavation measurements. Monitoring the condition of reused peat is also necessary to enable better understanding of carbon storage and other ecosystem services.
There are a range of construction activities that result in the excavation of peat, such as the construction and maintenance of roads and tracks, compounds and substations, crane pads and turbine blade laydown areas, cabling, drainage ditches and borrow pits. The main reuse methods include borrowpit reinstatement, restoration activities and landscaping. These reuse options may have varying environmental outcomes (Table 1), consideration for which needs to be part of the planning process when constructing a wind farm and planning the reuse of excavated peat within the project.
Recommendations
Recommendation 1: Guidance on excavation peat reuse
Because detailed evidence to confirm the different environmental outcomes is not available, we recommend a simple hierarchy of peat reuse options accompanied by additional guidance and requirements, which are essential for maximising environmental outcomes. We recommend this comprises:
Recommendation 1a: Preparation and planning steps:
Avoid / minimise peat excavation wherever possible and
Appraise site circumstances and locally relevant potential reuse options
Recommendation 1b: Hierarchy of peat reuse
Recommendation 1c: Peat reuse implementation principles: to guide the site-specific choice of methods and implementation to maximise environmental outcomes.
The hierarchy is not useable as a standalone guide – it must be accompanied by the additional components – as shown in Figure 1 below.
To ensure the multiple potential environmental benefits of peat reuse are considered, avoiding a single-issue focus.
To ensure a balanced approach to peat reuse, we recommend targeting the following environmental outcomes:
Minimising carbon loss: Reducing carbon emissions from excavated peat.
Positive biodiversity outcomes: Achieving biodiversity goals at both local and national levels.
Ensuring downstream water quality: Minimising sediment and nutrient load in water bodies.
Recommendation 3: Enhanced monitoring of environmental outcomes from reuse of peat
Enhanced research and monitoring are required to improve and inform the reuse hierarchy and implementation of best practice techniques going forward:
Post-construction assessment: Providing accurate peat excavation volumes at the end of construction to build a dataset to be used within the sector for more accurate carbon calculations and reuse planning.
Post-construction monitoring: Regular monitoring of wetness of the peat, carbon fluxes and vegetation surveys to understand the broader environmental impact of peat reuse.
Data sharing and collaboration: Encouraging greater data sharing and collaboration between energy companies and the academic community to refine the reuse hierarchy and best practice in the field.
Next steps and future research
These results highlight our current understanding of peat reuse methods occurring in wind farm construction in Scotland. We have highlighted which environmental issues are critical and how the reuse of peat can maintain the habitat, allowing for environmentally conscious construction techniques to take precedence.
However, a clear conclusion from the information gained during this process is that planning prior to construction is key, as well as ensuring that stakeholders work together to achieve best practice.
After these main outcomes from the hierarchy, the attention needs to focus on delivering site specific reuse. It also became apparent that although there is a lot of knowledge within the peatland and wind farm sectors, there have been limited studies collecting data to inform best practice. This needs to be encouraged to understand current research gaps and advise on the right management methods to reduce peatland degradation in the long term.
Table 1: Synthesis of reuse options and simplified overview of potential environmental outcomes (Note: this table summarises potential outcomes indicated by research during this study, but evidence is limited and site-by-site circumstances vary significantly so currently this differentiation on environmental grounds cannot be fully reflected in the recommended ‘hierarchy of peat reuse’.)
Method of reuse
Carbon store
Hydrology connectivity
Availability
Comment
Borrow pit reinstatement
++
Low risk of carbon loss
Low chance of carbon sequestration (carbon increase) in the long term
+
Only if well planned, with impermeable layers and outflows built in
+++
Large storage potential, should have capacity for all excavated peat, however where there is more (or less) peat than planned may lead to issues
Borrow pits have potential to provide an environmentally robust reuse option, however only if best practice is followed and there are contingencies in place if changes in planned volumes occur
Around turbine foundations and crane pad verges
—
High risk of carbon loss through peat drying out and erosion
–
When constructed these areas will automatically have drainage channels cut. The reuse of peat here will likely be impacted by this drainage
+
Small volume
Use to encourage vegetation re-growth around construction areas. Often used as a way of merging the built infrastructure with the surrounding landscape
Side of road/ track or “landscaping”
–
Risk of carbon loss through peat drying out and erosion, however if vegetation regrowth occurs this is less likely
–
Addition of peat should connect the reused peat with wider environment to maintain hydrology, however this depends on flow patterns and drainage channels across roads
+
Small volume
If vegetation regrowth occurs and there is limited bare peat this has potential to become part of the wider landscape
Incorporation of peat in restoration / reinstatement projects
+++
Low risk of carbon loss, has potential to build carbon (dependent on restoration / reuse project)
+++
If well planned, should have hydrological connectivity with landscape
+
Small volume
Usually these projects are highly monitored to assess progress – useful for data gathering in the short term alongside the benefits of using excavated peat in areas that may have been degraded previously
Glossary
Acrotelm
The upper of two layers in peatland system. Acrotelmic peat consist of fresh or newly decomposed peat forming vegetation and is generally quite fibrous This layer possesses some tensile strength and depending on the height of the water table can be anoxic.
Arisings
Excavated material that is created during excavation and construction activities.
Blanket Bog
A type of peatland that is relatively rare globally, however, commonly found in Scotland, due to its cool, wet climate. Blanket bogs are characterised by a peat depth of 0.5 to 3m, situated on flat or gentle slopes and have poor drainage (see ‘Raised Bog’ below as alternative type).
Borrow pit
In windfarm development, an excavation site (or quarry) where materials like soil, gravel, or rock are dug up for use in the construction. These materials are typically used for building access roads, turbine foundations, and other infrastructure.
Catotelm
The lower of two layers in a peatland system. Catotelmic peat consist of waterlogged, highly decomposed dense organic material with low tensile strength. This layer is highly amorphous and tends to disrupt completely on excavation causing difficulty with handling and storage.
Dissolved organic carbon
Organic carbon compounds that can pass through a filter with a maximum pore size of 0.7 micrometres.
EU Habitats Directive (92/43/EEC)
A European directive for the protection and conservation of natural habitats and of wild fauna and flora which has been transposed into Scottish legislation through the Habitats regulations, amended in 2021 post EU exit. https://eur-lex.europa.eu/eli/dir/1992/43/oj/eng
Peat
Peat is an organic material that forms in cool, waterlogged conditions. It consists of partially decomposed organic matter, primarily plant material and no mineral fraction. Over time, the accumulation of this organic material creates a peat and peaty soil that are rich in carbon.
Peat soil
Also referred as organic soil, in Scotland it is defined as soil with a surface peat layer with more than 60% organic matter and of at least 50cm thickness.
Peaty soil
Organo-mineral soil which have a shallow peat layer at the surface (less than 50cm thickness) over mineral layers.
Peatland
Peatland is defined by the presence of peat soil or peaty soil types. This means that “peat-forming” vegetation is growing and actively forming peat, or it has been grown and formed peat at some point in the past. It is a type of wetland ecosystem where peat material accumulates. These areas are characterized by waterlogged conditions that slow down the decomposition of organic matter, leading to the formation of peat. Peatlands have a specific type of vegetation, are rich in biodiversity and play a crucial role in carbon storage. Peatlands can include blanket bog, upland raised bog, lowland raised bog and fens.
Peatland Management Plan
A Peatland Management Plan used in development projects on peat typically includes several key components to ensure the sustainable use and conservation of peatland ecosystems. The plan describes baseline peat conditions, detail on excavation and reuse volumes and potential impact, how the peat will be handled, stored, or reused once extracted. This is an integral part of consent conditions.
Piled foundations
Deep foundations that use long, thin columns (piles) driven or drilled into the ground to support wind turbine structures. These foundations are essential for ensuring stability, especially in areas with weak or variable soil conditions and high-water tables. Also reduce the volume of peat needed to be excavated.
Priority peatland habitat
Peatland habitats can be divided into four broad classes (blanket bog, upland raised bog, lowland raised bog and fen), depending on the types of plants that formed the peat. Priority peatland habitats are sub-sets of these broad habitats which have been recognised under the Scottish Biodiversity Framework as being important to protect for their conservation and biodiversity value.
Raised Bog
A type of wetland characterized by a dome-shaped surface of peat, formed by the accumulation of partially decayed plant matter, which rises above the surrounding groundwater levels and is primarily fed by rainfall rather than groundwater.
Reinstatement
Using peat and/or peatland vegetation that has been removed or excavated during the construction of a development, often surrounding infrastructure. This form of peat use involves protecting excavated peat, and returning it to where it was taken from, in its original order (acrotelm overlying catotelm). This should aim to reinstate the hydrology of the returned material to support peatland function following best practice, although full return of function is very difficult to achieve.
Restoration
Carrying out interventions which in combination with natural processes restores the hydrological function, coverage and condition of peatland habitat vegetation, resulting in a peatland that is actively forming peat and hence sequestering carbon. Further detail will be stated in the forthcoming Scotland’s Peatland Standard.
Revegetation
Using excavated peat and/or vegetation in the surrounding construction infrastructure or for landscaping. This form of peat use will often result in revegetation but may not result in functioning peatland. Nevertheless, it can have a role in protecting the surrounding peatland conserving carbon and biodiversity providing that best practice is followed.
Abbreviations
CO2
Carbon dioxide
DOC
Dissolved organic carbon
ECoW
Ecological Clerk of Works
GHG
Greenhouse Gas
IUCN
The International Union for Conservation of Nature
ha
Hectares
HRA
Habitats Regulations Appraisal
km
Kilometres
kWh
Kilowatt-hour
m
meters
MW
Megawatt
NPF4
National Planning Framework
PEAG
The Scottish Government’s Peatland Expert Advisory Group
PMP
Peatland Management Plan
POC
Particulate organic carbon
REA
Rapid evidence assessment
SEPA
Scottish Environment Protection Agency
WMLR
Waste Management Licensing (Scotland) Regulations
Introduction
Aims and scope
This project explored opportunities, impacts and challenges for the reuse of excavated peat from windfarm development sites. It is intended to inform application of National Planning Framework 4 (NPF4), regarding the development of wind farms on peatland, peat and peaty soils. It aimed to provide recommendations for a hierarchy of peat reuse options based on environmental impact along with recommendations for data collection and monitoring to continually improve and update the evidence base.
The project focused on gathering evidence of impacts and opportunities for excavated peat reuse on-site but also considered potential for positive off-site opportunities. Evidence of environmental costs and benefits in terms of emissions, peatland function, habitat, biodiversity, hydrology, stability and structure in relation to reuse practices was evaluated.
Defining ‘reuse of peat’ for this report
This report was commissioned to understand the reuse of peat on wind farm sites during the construction process. We recognise there are differing definitions of “reuse”.
Throughout the study we adopted the definition of “reuse” of peat as:
the use of peat and/or peatland vegetation that has been excavated during the construction of a wind farm.
In this context, the “reuse” of peat can involve reinstatement, revegetation or restoration processes both onsite and offsite, during the construction of a wind farm.
Research methods
A combination of research methods were used:
A Rapid Evidence Assessment to gather and evaluate the academic literature and other relevant studies.
Desk-based evaluation of existing wind farm developments on peatland in Scotland to understand current practices.
Site visits to active and completed wind farm developments on peatland to observe examples of reuse practices in situ.
Stakeholder engagement, via discussions during site visits, individual research interviews and a workshop to complement desk-research.
It was anticipated that there was limited literature available – in the absence of this, the site visits and stakeholder engagement were critical to the project. Full details of methods are provided in the Appendices.
Background
Scotland is committed to reaching net zero by 2045, how we use and manage our land is vital to achieving this, including the use of land to produce renewable energy. Balancing the benefits from renewable energy with land-based emissions and nature and biodiversity goals is vital, particularly where wind farms intersect with sensitive habitats, like peatland and on carbon-rich soils.
Globally, peatlands are the largest terrestrial carbon store estimated to hold 660 gigatonnes of carbon and 10% of non-glacial freshwater, however, only 17% of these ecosystems are protected (Austin et al., 2025). Globally, 20% of all blanket bogs are located within the UK and Ireland[1]. In Scotland alone, blanket bogs cover around 1.8 million hectares, which is 23% of the land area (Ferretto et al., 2019). Situating new wind farms in the right location is crucial. Although wind farm developments are expected to save carbon emissions by offsetting fossil energy sources (Renou-Wilson and Farrell, 2009), where wind farms are situated on peatlands, there is a risk of land-based carbon emissions, negating the reduction associated with offsetting fossil energy sources. The quality of the peatland habitat is an important factor, as areas that are already degraded and emitting carbon, could be improved through restoration of the whole environment. When applications are made for wind farm construction there are often enhancement conditions attached to these new developments leading to restoration, but some restoration may have been necessary without the wind farm construction occurring. Peatland condition categories[2] range from pristine, near natural, modified, drained and actively eroding in relation to GHG emissions and restoration potential. Historically, Scotland’s peatlands have not been protected across the whole habitat, with afforestation being prioritised up until recently. Wind farm construction in these areas, is likely to lead to environmental improvements, with stakeholders working together to reduce peatland degradation and ambitious programmes of peatland restoration being undertaken.
Overall, the literature searches presented over fifty academic studies and governmental reports, which provided useful information related to the impact of landscape management on peatland as well as some interactions between peatland and wind farm developments. However, there were no empirical studies monitoring changes in reused peat on windfarm developments over time. This is a major research gap. Understanding how the reuse of peat may change the peat itself had to be extrapolated from studies measuring changes within laboratories or evaluations of the landscape scale after a number of years since wind farm construction had occurred. Studies did consider the impact of peat excavation on the environment, hydrology and risks of erosion or the degradation of the peatland habitat. The literature did present a large number of studies focusing on the restoration of peatland habitats, however, these were not readily extrapolatable to the current study on reuse of peat, as the parameters related to restoration are substantially different. A large number of the papers and reports were focused on the Scottish environment which suggests that Scotland is leading the way in this area of research.
Summary of stakeholder engagement achieved
We obtained contributions from 31 individuals during our stakeholder engagement (for a more in-depth synopsis of stakeholder engagement findings see Appendix). Stakeholders highlighted what they viewed as the positive features of some reuse options, such as where the water flows in borrow pits (one method of peat reuse) have been managed to keep the water table near the surface. Stakeholders we spoke to were aware of the gaps in evidence and lack of specific studies and so based their views on their own observations or monitoring on sites they were involved with. Overall stakeholders agreed that a number of factors need to be considered carefully to have any chance of achieving optimal environmental outcomes from reuse of peat on windfarm sites – simply putting peat in a convenient location on site would not be beneficial as peat would dry out, erode or lose its structure and functioning. Key considerations were – what was the condition of peat prior to excavation, the need to plan how to minimise disturbance, handling, drying and transport of peat after excavation, consideration of the water levels and flows, vegetation cover and the stability of reused peat in situ.
Summary of site research conducted
During five site visits across varied locations in Scotland, a range of different peat reuse practices were observed including:
different approaches to infilling borrow pits,
use in landscaping (for example alongside tracks or to cover cables),
infill of other site features including historical peat cuttings,
incorporation of peat into peatland restoration.
Across sites the condition of peat prior to excavation and reuse varied, as did the nature of reuse even where the same general type of reuse was used, for example borrow pit size, shape, fill level, structure, hydrology and vegetation varied across sites where this practice was used. For more information related to site visits see the Appendix.
Summary of literature and stakeholder research findings
In Scotland, peatlands store over 2,735 million tonnes of carbon covering approximately two million hectares (Smith et al., 2007), equating to around 25% of Scotland’s land area. These peatlands are often considered good candidates for onshore wind farms due to the windy and exposed environments they are located in and because they are often considered poor (or unprofitable) for other land uses, like forestry and farming activities.
The main construction activities which result in substantial disturbance for a wind farm development are track construction for maintenance and access roads, trenches for cabling, quarried aggregate extraction (borrow pits) and turbine foundation excavation. This large-scale disturbance can affect peat stability, degradation (such as habitat condition, plant assemblages, carbon storage, etc), as well as the hydrology of the habitat. Other disturbances are related to building infrastructure to support the wind farm development like crane pad constructions, temporary and permanent compounds, as well as substations to join the electricity generated to the grid. Estimates of the direct disturbance to the peatland habitat per wind turbine vary greatly but have been reported to be between 0.2 to 1 hectare per turbine, with the turbines within a wind farm usually taking up less than 10% of the wind farm area (Sander et al., 2024). However, if this area is on deep peatland, there will be greater environmental impact, than on shallow peat or mineral soils.
Larger turbines, which are more widely spaced (typically on a 300-500 m grid, with the distance between turbines around five times rotor diameter), capture energy on a much smaller spatial ‘footprint’ than smaller ones on wind farms (Renou-Wilson and Farrell, 2009). However, this is also site-dependent and varies if repowering occurs, as repowering may use the same footprint as the previous turbines, or it could locate the turbines at a new area within the development, thus increasing the environmental impact.
Construction of a wind farm requires a significant array of associated infrastructure to be installed, this infrastructure may have impacts on the surrounding peatland either through the removal of peat from that habitat, removal and replacement of peat in less suitable locations or reducing the quality of the environment within the area the peat was moved to, compression, flooding, drainage, erosion or mass movement of the peat (Lindsay, 2018). Active peatlands are hydrologically linked and naturally stabilised therefore if hydrologically disrupted, the stability can be lost (Wawrzyczek et al., 2018). An unstable habitat can lead to wider environmental problems, with issues greater than just carbon loss, for example peat slides.
Peat and windfarms in Scotland
Peat is an amorphous organic deposit, considered to be the largest terrestrial carbon store. Peat is highly compressible and porous consisting of up to 90% water by volume. Active peat-forming mire has also been found to be effective in delaying storm run-off, reducing soil erosion and retaining inorganic nutrients when it is undrained (Bragg, 2002).
Across Europe it has been calculated that 25% of peatlands are degraded (Tanneberger et al., 2021). Under the EU Habitats Directive (92/43/EEC), there are 36 European regions with designated blanket bogs and of these, 12 have wind farm developments, including 644 wind turbines, 253 km of vehicular access tracks and an affected area of ~208 hectares, mainly in Ireland and Scotland where the extent of peatland is also higher (Chico et al., 2023). However, when this is compared to the Scottish soil maps, the extent of wind farm developments in Scotland on peatland is even higher, with 1,063 wind turbines and 635 km of vehicular access tracks on peatland in Scotland alone according to national inventory data (Chico et al., 2023).
Currently, 48% of wind farms in Scotland have already been built on peat[1] with this number likely to increase in the future. Wind farm developments can have an impact on the peatland habitats and emissions, during construction, operation, and decommissioning stages. This reduces the wind farms’ ability to reach the goal of net zero. Using a carbon calculator[2] to assess the carbon saving of wind farm developments compared to carbon lost through construction on Scottish peatland provides guidance on a wind farm’s carbon footprint. However, due to the heterogeneity of peatlands and the lack of detail at the required scale when completing peatland surveys pre-planning, it has been found that the amount of peat excavated is often more than the amounts used within the carbon calculations.
Both in discussion with stakeholders and within the literature, the instability of peat deposits was highlighted, with small movements leading to slope terracing, slumps or the collapse of peat banks – these events are relatively common. Furthermore, disturbed peat can lose more than 50% of its strength compared to undisturbed peat and, in many cases, behaves as a viscous material that will readily flow, particularly when affected by high rainfall (Jennings and Kane, 2015). These inherent properties of peat carry risk and need to be considered during the wind farm construction process as the destabilisation of peat mass through drainage or excavation operations could lead to an increase in landslides / bog flow events (Dykes, 2022).
From discussions with stakeholders, it is clear that the exact volume of peat to be excavated can differ from estimates calculated in the EIA at application stage. This is usually due to a combination of initially unknown factors prior to the construction process – the exact depth, viscosity and bulk density of the peat material that needs to be excavated. Calculations are usually based on predefined excavation requirements for the size of the turbine alongside average peat depths for the area provided by preliminary site surveys, using an interpolated model of a peat depth probe survey. However, the depth of peat can also vary significantly over time, with changes in the peatland hydrology, leading to peat shrinkage occurring during drought conditions (Morton and Heinemeyer, 2019). Thus the timing of peat surveys may affect peat excavation calculations, as well as the scale of the survey and heterogeneity of the habitat. Table 2 describes common reasons for excavation as part of the construction process and how they differ in approach.
Table 2. Common reasons for excavation on site and how they differ in approach when applied to peat and peatland.
Excavation types
Approach
Construction and maintenance of roads and tracks
Significant lengths of tracks need to be created linking wind turbines and wind farm infrastructure. The main methods that can be implemented are either cut and fill or to introduce floating roads. These roads will impact the drainage of the surrounding peatland by blocking or modifying flow and if floating the peat below can also be compressed, exacerbating drainage issues.
Construction of crane pads
Crane Pads are usually located adjacent to the turbine foundations to facilitate turbine components being lifted during turbine erection and future maintenance or repairs. Depending on the load, crane pads are usually unpaved, however, compacted with layers of gravel. For some installations, the turbine foundation is used as a crane pad after initial construction.
Turbine blade laydown areas
A designated space near the turbine foundation where large components are stored before installation. These are often temporary excavations and reinstated after construction.
Cabling
Usually installed along tracks so typically does not require additional excavation, although may require a small amount of disturbance and/or influence the scheduling of any reinstatement following tracks.
Turbine base
The digging of the foundations of turbine bases generates large volumes of peat that need to be reused. They also introduce alkaline concrete into the environment which may impact the pH of the surrounding habitat and may require drainage installation to protect the foundation and avoid uplift.
Compounds and substations
Temporary compounds provide facilities for workers and equipment. Substations are usually permanent installations, often with steel frames and cladding, crucial for power collection and transmission. The peat needs to be removed, before a hardstanding area is laid, using gravel. These areas also need to be linked to the access roads early in the construction process.
Drainage ditches
Drainage is necessary around wind turbine foundations and wind farm infrastructure to maintain integrity and is usually a permanent feature of the windfarm. Often this leads to a lowering of water levels associated with drainage around infrastructure. Drainage may impact a much wider area than the drain margin and as well as lowering water levels surface subsidence may also occur.
Borrow pit
The volume of peat excavated depends on the depth at which usable aggregate materials are found. The quantity and quality of aggregate in the borrow pit can be hard to judge before the pit is opened so the volume of excavated peat may be higher or lower than anticipated.
Roads and tracks
Construction and maintenance roads and tracks are the most extensive direct impact of a wind farm on peatland as the roads need to allow access to every turbine, plus all the other infrastructure buildings but could also provide access to areas for restoration and enhancement activities. Initially, roads were just cuttings made on shallower peat down to the mineral base. However, this meant that the roads were lower than the surrounding peatland and frequently led to drainage issues.
Construction methods have adapted from just cuttings to the ‘cut and fill’ method (where the peat is dug out until the mineral subsoil is reached and backfilling the trench with aggregate until the road is around the same level as the surrounding bog surface (Lindsay, 2018)) or the preferred method of floating roads (using a geotextile mesh on top of deep peat). Floating roads have limited peat removal as a geotextile mesh is laid on top of the peat, with aggregate poured on top. Another geogrid may then be added with more aggregate before the final ‘running surface’ is laid (Lindsay, 2018).
Stakeholders described how the design of the road network through a wind farm is largely driven by the placement of the turbines (often on ridges which may be where the deepest peat is located) and following the contours of slope (increasing the distances of the road network within the peatland habitat). Tracks also need to bear large weights, for example, the cranes used for wind turbine construction can weigh up to 200 tonnes (this also has implications for the construction of crane pads). A study showed the orientation of the road in relation to the flow of water within a peatland had a large impact (Elmes et al., 2022) and led to flow obstruction and changes to the overall hydrology when running perpendicular to the flow in comparison to parallel. However, this sort of nuanced planning is rarely discussed as part of the construction process. Infrastructure like work compounds and substations also require access roads (with drainage). Thus, the size of the area of peat that is disturbed by the development may be greater than first considered.
Drainage
It was highlighted by stakeholders – and during the site visits – that drainage is usually the first construction activity occurring when developing wind farm infrastructure and is often necessary around the turbine bases and accompanying roads and tracks to reduce the risk of surface flooding. Drainage ditches are also excavated around wind farm foundations to improve the stabilisation of the turbine foundations and to protect machinery. This process of draining peatlands is known to be detrimental, causing subsidence through oxidation of the peat (Williams-Mounsey et al., 2021) and carbon loss. However, peat further away from the drainage ditch (> 1m) will only lose 20% of its previous moisture content, with the main effect of peatland drainage leading to removal of surface water rather than deep water-table drawdown (Lindsay, 2014). Drying of the peat may also lead to cracking, which may lead to rainwater penetrating the base of the peat and lubricate the interface between the peat and the mineral subbase (Lindsay, 2018).
Excavation works
Other large-scale disturbances of the peat are through excavation works. This can be for granular material used during construction (taken from borrow pits); excavation of the wind turbine foundations (although piled foundations can reduce the overall negative impact); and trenches for laying cabling/pipework, leading to substantial quantities of peat that may need to be stored prior to reuse. Piled foundations are usually built over deep peat, rather than excavating large quantities of peat; long, thin columns (piles) are driven or drilled into the ground to support wind turbine structures. These foundations reduce the volume of peat needed to be excavated whilst ensuring stability of the structure. Turbine towers experience large forces and must be placed on a solid foundation embedded within the underlying mineral subsoil or bedrock (Lindsay, 2018). Stakeholders said that often large quantities of peat may be deposited on nearby surfaces temporarily, if trucks aren’t continuously available to receive the excavated material, or dependent on the stage of the construction process. However, it is best practice to only move the peat once (to maintain structure and water content) thus, if the requisite planning is in place, a reuse strategy can be implemented where excavated material is moved to its final location in one step.
Stockpiling peat occurs where peat has been excavated and may need to be temporarily stored prior to reuse due to logistical constraints. As well as becoming a potential source of GHG emissions due to its exposure to aerobic conditions, when peat is stored, changes have been observed within its hydrochemistry, leading to it becoming less acidic and less nutrient-rich (Detrey, 2022). Over time, dewatering also occurs, which alters the hydrophysical properties (porosity) of the peat, these are key for sustaining critical peatland ecohydrological functionality (Lehan et al., 2022).
Ground preparation for stablishing crane pads and turbine blade laydown areas often requires excavating peat to create a stable foundation, leading to the removal of substantial peat volumes, with similar issues as discussed related to other excavation works. This will expand the area of impact further away from the turbine, with underlying changes to the hydrology, potential for release of GHG emissions, vegetation changes and degradation of peatland (Wawrzyczek et al., 2018). Some of these areas are temporary. For example, at some sites visited, areas which had previously been turbine blade laydown areas had peat reinstated and vegetation was able to naturally regenerate. However, this only occurs if it is part of the plan created by the developers, as some laydown areas will remain as areas with stable foundations which are available for future use.
Current practices: use of excavated peat – reuse practices
Excavated peat needs to be moved from the excavation site and is often initially stockpiled until an appropriate time for reuse. The time peat is stockpiled can vary substantially and will be impacted by where it was excavated from, the volume, and timing of the excavation related to overall construction of wind farm site. Lehan, et al., (2022) undertook a restoration study, to assess the impact of time on the hydrophysical properties of peat blocks that were stockpiled for 3, 7, 11, and 14 months. In this study, stockpiling peat was differentially impacted dependent on whether it was shallower or deeper peats, where limited impact from stockpiling was observed in the shallower peats, regardless of stockpiling time; however, in the deeper peats as stockpiling time increased there was a decrease in microporosity as well as mobile porosity (drainable porosity) (Lehan et al., 2022). It may be necessary to rewet the peat or aim to keep it wet whilst stockpiled.
Peat that has started to dry out will be less likely to function when reused. When the surface of the peat starts to dry out development of a hydrophobic layer may occur which causes irreversible changes to the ability of peat to be fully rewetted and reduces the infiltration capacity of the peat (Evans et al., 1999), increasing the desiccation of the peat overall and exacerbating the issue over time. There could also be a similar issue occurring around drainage channels, changing the overall hydrology of the habitat. There are a number of different potential reuse practices that occur on site, with varying quantities of peat, depth of peat and aims (Table 3).
Table 3. Generalised overview of current and potential future reuse practices for excavated peat
Reuse practice – onsite
Approach
Borrow pit reinstatement
Borrow pit reinstatement is one of the main sites for the reuse of peat. Guidance from SEPA highlights the WMLR[1] paragraph 9(1)b restriction that spreading on land subject to man-made development including quarry restoration should not exceed up to a maximum of 2 metres depth of material.
Use to reinstate the natural habitat and to encourage vegetation re-growth. Often used as a way of merging the built infrastructure with the surrounding landscape.
Side of road/ track or “landscaping”
This often occurs as a way of managing levels within the wind farm area, particularly where tracks have been constructed as floating and sometimes will become higher than the surrounding peatland. Vegetation at the side of the road and in the deposited material is not often considered and it is assumed natural regeneration will occur.
Incorporation of peat in restoration / reinstatement projects
This is not standard practice and has to date only occurred as part of research trials in areas directly adjacent to wind farm construction sites, where peat is used as a substrate for other restoration work. Often these sites are already partially disturbed due to the construction process or historically (through forestry, man-made drainage or cuttings).
Examples from stakeholder discussions:
used as a substrate to fill drainage ditches as part of wider restoration efforts within previously forested sites
used as a substrate in the construction of dams to slow water down and hold within the landscape
used to infill sites of historical peat cuttings (between turbines)
hag infill in small areas within a degraded peat landscape
Incorporating a layer of excavated peat in formerly forested sites undergoing restoration
Offsite use
Literature review referred to some potential ways to reuse peat off-site, but we found no evidence these are practiced in Scotland. All stakeholders stated that offsite reuse of peat does not occur. Suggestions have been made that peat could be used offsite, but these are largely hypothetical.
When excavating peat, it is imperative that the different layers are kept separate (acrotelm, catotelm) and not mixed with the underlying mineral substrate. This is because of the different properties of these layers and mixing will degrade the peat and reduce its function. Although peat excavation during wind farm construction is likely to occur, large excavations of peat should be avoided. Peatland management plans are mandatory when submitting planning applications for wind farm developments on peaty soils (as part of Policy 5 of the NPF4 framework). These plans provide a draft outline of the volume of peat to be excavated and the reuse activities that will be performed as part of the development. The reuse of peat is unlikely to have wider environmental benefits in areas that are not already disturbed by the wind farm construction or considered degraded; depositing excavated peat on undisturbed vegetation is likely to be detrimental.
To prevent the loss of carbon and the increase in GHG emissions which would occur from the degrading peat, it is essential that a considerable time is spent planning prior to the excavation process – reducing the distance the peat is moved, keeping the times the peat is moved to a minimum and understanding the volumes of peat involved. From discussions with a number of stakeholders it was suggested that, although the level of planning and motivations of the energy companies to reuse peat without degrading it is high, it is often dependent on the capabilities and understanding of the operators doing the work. A number of training courses have been organised for the construction sector specifically to improve this. However, these courses are voluntary. Training the construction sector in the importance of peatlands, restoration techniques and sensitivity during construction, will enable greater preservation of this valuable resource. In almost all discussions with stakeholders the reuse of peat occurred onsite, there were discussions regarding offsite use, but these were more abstract in terms of what was possible, rather than what was occurring. The reasoning given that the majority of reuse is on site is because the SEPA guidance[1] states that unless the excavated peat is used for construction purposes in its natural state on the site from where it is excavated, it will be subject to regulatory control and considered waste.
Overall, although the terminology is the same between different wind farm construction sites – the reuse of peat within borrowpits, landscaping or restoration, it is always site specific. There may be commonalities between the sites, for example, the need to maintain hydrological connectivity, and the importance of peatland vegetation. There will also be significant differences related to volume of peat excavated, previous habitat conditions and use, weather conditions and water table level, knowledge and preparedness of the contractors. Within 3.5.2, 3.5.3 and 3.5.4 we present case studies representing recent site visits.
Quantities of peat excavated during wind farm construction
Reviewing a number of reports, for example the “Good Practice during Wind Farm Construction” (NatureScot), “Research and guidance on restoration and decommissioning of onshore wind farms” (NatureScot), “Developments on peatland: guidance on the assessment of peat volumes, reuse of excavated peat and the minimisation of waste” (SEPA[1]), “Developments on Peat and Off-site uses of waste peat” (SEPA), as well as habitat management plans for specific wind farms, all state the importance of collecting relevant and detailed site investigation data at an early stage of the application process to enable a full understanding of the site character and to inform a more accurate design process. This is in full agreement with the academic literature (e.g. Jorat et al., 2024) and discussions with stakeholders. During the planning process the amount of peat that needs to be excavated and how it will be reused is identified (see Table 3 for an example of the average areas involved in excavations). However, due to the heterogeneity of the environment and the lack of granularity of peat depth survey’s there is some ambiguity related to total peat volumes until excavation has started.
[1] Scottish Renewables, Scottish Environment Protection Agency. 2012. Guidance on the Assessment of Peat Volumes, Reuse of Excavated Peat and the Minimisation of Waste
Table 4. Area of turbines adapted from Albanito et al., 2022, also includes calculation of the average volume of peat per turbine taken from reviewed peatland management plans of operational wind farms in Scotland
Wind farm capacity (megawatts, MW)
Input
<10 MW
>10 to <50 MW
>50 MW
Average length of turbine foundations (m)
10
15
22.18
Average width of turbine foundations (m)
10
15
22.18
Average surface area of turbine foundation (m2)
100
225
492
Average depth of excavated peat (m)
1.455
1.365
1.350
Average volume of turbine foundations (m3)
145.5
307.13
664.14
Length of access track (or floating road) (m)
418
6513
32490
Width of access track (or floating road) (m)
5.66
5.66
5.66
Average surface area of access track (m2)
2366
36,864
183,893
Floating road depth (m)*
0.53
Average volume of floating road (m3)*
1254
Length of hard standing (m)*
37.99
Width of hard standing (m)*
32.29
Average surface area of hard standing (m2)*
1226.7
Extend to drainage around drainage features at site (m)*
60
Average volume** of peat per turbine (m3) anticipated to be excavated (includes road network and cabling linking turbines to grid)
8060 (± 1464)
Average volume* per wind farm (m3)
328,446 (± 59,650)
*Independent of wind farm capacity (MW)
**Average taken from reviewed peatland management plans of operational wind farms in Scotland.
Case studies – Borrow pit reinstatement
To successfully reinstate peat within borrow pit excavations, it is important to consider the borrow pit location, hydrological connectivity, depth, vegetation cover, and to preserve the layering of the peat (Figure 2). It is best practice to reinstate the borrow pit profile to a comparative level to the surrounding landscape, with gentle slopes that blend into the landscape, it’s design should maintain hydrological connectivity with the wider environment whilst also holding water within the peat soil. Often “cells” are created within the borrow pit to enable easier reinstatement, these cells are sometimes lined with clay to reduce the permeability through to the underlying parent material. This is to enhance the hydrological connectivity of the reinstated borrow pit and aims to keep the area wet. However, an outflow is also needed so that the area doesn’t become permanently waterlogged (Figure d). It is assumed that natural regeneration of peatland vegetation will occur, therefore seeding is not usually part of the PMP, however if seeding were to occur this would usually be two years after construction as part of the planning conditions process.
a)
b)
c)
d)
e)
f)
Figure 2. Examples of borrow pits a) newly completed (< 1 year); b) in the process of being in-filled, one cell completed – cell wall construction (light coloured) and peat infill (dark coloured); c) 15-year old borrow pit with examples of functional peatland vegetation (from natural revegetation); d) 15-year old borrow pit that was not designed with drainage, has led to waterlogging (arrow indicates ponding); e) 10-year old borrow pit, quite dry, with more of an acidic grassland habitat; f) newly completed (< 1 year) situated on a slope, quite shallow peat.
Case studies – roadside verges / landscaping
Peat deposited alongside roadside verges often occurs more in terms of landscaping rather than for preservation of the peat (and carbon within it) (Figure 3). However, the volumes are relatively small compared to borrow pit reinstatement. If the peat does not become integrated with the surrounding hydrology, it will likely dry out and decompose over time, releasing CO2 into the environment and possibly erode away.
a)
b)
c)
d)
Figure 3. Example of peat reused along roadside as part of landscaping process, a) drainage and indication of below ground cabling visible, vegetated peat reused for this infill; b) drainage channels and depth of floating road visible (newly constructed < 1 year), c) newly constructed (<1 year) landscaping, mixing of peat and mineral soil visible; d) Established peat at edge of floating road (15 years after construction), has maintained level and has peatland vegetation growing on it through natural revegetation. (Photographic permissions granted)
Case studies – incorporation within restoration projects
The reuse of peat is not considered for peatland restoration in the majority of cases. However, there are some examples where excavated peat has been used as part of the restoration process but this has only been permitted as an experimental approach. This is because once the peat is excavated (in the quantities it is being removed for wind farm construction), it has often lost structure and hydrological connectivity, and left as a stockpile until reinstatement begins (which varies from site to site).
Thus, the excavated peat has likely started to degrade, using this for restoration is unlikely to improve the habitat to the same level restoration with non-degraded peat would do. However, on some sites there are opportunities for reuse that could enable restoration if the appropriate planning and coordination between experts occurs. An example can be seen in Figure 4 (a and b). Key to the success of this kind of trial is planning how to implement it, for example a) efforts were made to move the peat only once – from excavation to reuse site; b) the layers of peat were kept separate and maintained across translocation; c) training was provided to the contractors involved in this reuse and restoration project. At a different site, excavated peat was used to infill peat cuttings that had occurred previously, however this infill can still be seen 10 years later (Figure 44c – differences in vegetation).
Although there are differences still visible in vegetation, the process for infilling used in situ vegetation. When reinstating the peat within the cuttings, the existing vegetation was stripped off and placed aside, the cuttings were then filled with acrotelmic peat generated from the excavation of nearby turbine bases. The vegetation was then replaced to reinstate the area and stabilise the peat. Although this may not have restored the peatland habitat to equivalent to undisturbed areas, as differences in vegetation are still visible. As the degradation was separate to wind farm construction, comparisons need to be made with how the environment was prior to wind farm construction, rather than comparison to pristine peatlands. Understanding whether the reuse of peat has been successful in maintaining a functioning peatland or at least preventing the loss of peat (and carbon) is very important, vegetation and water table monitoring occurs on some sites regularly to assess this (Figure 44d).
a)
b)
c)
d)
Figure 4. Examples of incorporation in restoration projects – a) Restoration trial (as part of the forest to bog project), where excavated peat was deposited at the side of a constructed track. However, to enhance restoration, prior to peat addition, vegetation was removed and the site ‘smoothed’, before the excavated peat was layered on top (to a depth of 150 mm or 300 mm dependent on trial site), after which the vegetation was put back on top of the reused peat. B) Zoomed in photo of trial site in a) peat vegetation covering trial site, with very little bare peat. C) Landscape restoration through the infill of furrows – here infill is within peat cuttings (but similar infill also occurs within the furrows of former forested sites). D) Dip well monitoring of water levels to assess success of peat reuse. (Photographic permissions granted)
Offsite use of excavated peat
Throughout this research it was discussed with stakeholders whether excavated peat could be used offsite from the wind farm construction; as to date only one paper was found. Balode et al., (2024) discussed various off-site novel uses for peat within the energy sector, building materials and additives, as well as agriculture and the wider environment (Figure 5); however, the paper does not focus solely on reuse and hence these uses are unlikely to occur within wind farm construction industry as the quantities involved in reuse are not going to warrant the creation of a comprehensive supply chain.
It is important to note that throughout the stakeholder consultation, it was repeatedly stated that reuse of peat off-site did not generally occur. Mainly this is due to two reasons, firstly classification – if the peat was taken off-site, it would be categorised as waste, which would likely entail a cost; secondly the necessary volumes of peat and the logistics of transportation would make it too costly to the project. If the reuse of peat offsite from wind farm construction was to be encouraged than new SEPA guidance and recommendations would need to be developed.
Figure 5. Novel applications of peat from Balode et al., (2024).
Environmental outcomes of peat reuse
The results of the literature review indicates that all anthropogenic activities within a peatland will impact the fate of nutrients. The fluctuating water table, local geochemistry and hydrology are the main drivers of a peatlands’ groundwater chemistry and discharge (Monteverde et al., 2022). Wind farm construction can increase the fluvial macronutrient loading of catchment streams (Heal et al., 2020), however, forest felling has been shown to lead to greater dissolved organic carbon (DOC) within felled areas compared to wind farm catchments (Zheng et al., 2018). It is important to note that often wind farms are developed on felled forest sites that were previously peatland, e.g. Whitelees and Camster, however it has been calculated that nearly 14 million trees have been cut down as part of wind farm construction projects over the last 20 years (2000 – 2020)[1]. Thus, academic studies comparing habitats as if they are discrete categories like a felled forest compared to a wind farm development need to include previous land use as part of their analysis. In other words, undisturbed peatland to forestry to felled forest and windfarm may produce different results compared to an undisturbed peatland to wind farm, but if only considering the final use they would be classed as having the same management factors influencing them. It is also unclear whether the environmental perturbations are additive and would likely occur if the area hadn’t previously been changed? Also the timing of monitoring is important, for example a newly constructed wind farm showed 5 g m2 losses in dissolved organic carbon (compared to control samples) over an 18-month period (Grieve and Gilvear, 2008) but it is unclear if losses reduce over time – this is a research gap. Is there an initial flush that quickly dissipates? Or are those losses continuous without signs of improvement. Grieve and Gilvear (2008) believe this 5 g m2 loss represents between 25% and 50% of annual carbon sequestration in peatlands in central Scotland, so it is quite substantial.
The structure and hydrology of removed and replaced peat will not resemble that of the undisturbed peat and likely undergo further degradation through settlement and oxidation (Lindsay, 2018). Excavated peat is often used to blend the transition from undisturbed areas to those which are part of the construction. The disturbance to the peat results in negative impact to the habitat (Jorat et al., 2024), however using excavated peat to link undisturbed areas with disturbed areas will encourage vegetation regrowth in keeping with the surrounding landscape and may stablise the disturbed peat. Error! Reference source not found. provides an overview of the potential environmental outcomes for some of these reuse options.
Understanding how each reuse option impacts the wider environment will inform the hierarchy. Repowering of wind farms, upgrading the turbines and technology used within a wind farm site once it has reached the end of use-limit, is one method of reducing disturbance on peatland. However, this still requires extensive planning, as the newer turbines are often larger, needing different spacing between turbines and larger foundations. Approximately 30% more land surface area will be disturbed for repowering using a new rather than reengineered foundation (Waldron et al., 2018). If the surrounding peatland has not recovered from the previous development, this could lead to greater degradation than using new locations.
It is unsurprising that wind farm construction leads to wide-scale changes to the peatland habitat, which are known to be sensitive habitats with unique attributes related to their hydrology and carbon richness. Within this report we have been focused solely on the impact of wind farms on the excavation of peat and its reuse, however once in situ wind farms may still have an impact on the surrounding peatland. For example, a study by Moravec et al., (2018) showed that wind turbines can affect ground surface temperatures (which has the potential to change soil hydrology); and these changes varied with proximity to wind turbine (Armstrong et al., 2016). These impacts may also last for the lifetime of the wind farm, a large-scale review of the impacts of pipeline construction on soil and crops found that pipelines caused soil degradation for years and decades following installation and that soil compaction and soil horizon mixing detrimentally impacted soil function (Brehm and Culman, 2022).
Table 5: Synthesis of reuse options and simplified overview of potential environmental outcomes (Note: this table summarises potential outcomes indicated by research during this study, but evidence is limited and site-by-site circumstances vary significantly so currently this differentiation on environmental grounds cannot be fully reflected in the recommended ‘hierarchy of peat reuse’.)
Method of reuse
Carbon store
Hydrology connectivity
Availability
Comment
Borrow pit reinstatement
++
Low risk of carbon loss
Low chance of carbon sequestration (carbon increase) in the long term
+
Only if well planned, with impermeable layers and outflows built in
+++
Large storage potential, should have capacity for all excavated peat, however where there is more (or less) peat than planned may lead to issues
Borrow pits have potential to provide an environmentally robust reuse option, however only if best practice is followed and there are contingencies in place if changes in planned volumes occur
Around turbine foundations and crane pad verges
—
High risk of carbon loss through peat drying out and erosion
–
When constructed these areas will automatically have drainage channels cut. The reuse of peat here will likely be impacted by this drainage
+
Small volume
Use to encourage vegetation re-growth around construction areas. Often used as a way of merging the built infrastructure with the surrounding landscape
Side of road/ track or “landscaping”
–
Risk of carbon loss through peat drying out and erosion, however if vegetation regrowth occurs this is less likely
–
Addition of peat should connect the reused peat with the wider environment to maintain hydrology, however, depends on flow patterns and drainage channels across roads
+
Small volume
If vegetation regrowth occurs and there is limited bare peat this has potential to become part of wider landscape
Incorporation of peat in restoration / reinstatement projects
+++
Low risk of carbon loss, has potential to build carbon (dependent on restoration / reuse project)
+++
If well planned, should have hydrological connectivity with landscape
+
Small volume
Usually these projects are highly monitored to assess progress – useful for data gathering in the short term alongside the benefits of using excavated peat in areas that may have been degraded previously
Limitations of data
Through the rapid evidence assessment (REA) we did not consider peatland restoration methods as part of the scope, however there are some strategies that go beyond restoration practices and should be a consideration as part of the reuse of peat. For example, rewetting peatland, drain blocking, revegetation, and fire management (Balode et al., 2024). Although there is academic research on the impact of peatland degradation, how wind farms can reduce reliance on fossil fuels and the social acceptance of wind farms within the environment, there is a lack of published research directly quantifying the impact of wind farms on peatlands, or providing evidence of best practice. Reliance on grey literature and stakeholder discussions is necessary to cover this research gap. For example, where novel reuse methods have been used, the industry has led monitoring of those sites, collected data and written these up as internal reports, which are not obviously available for the wider industry and academia to use. However, “standard practice” is rarely reviewed in academia nor comprehensive data collected, thus it is very difficult to make recommendations on what works best through standard literature reviews. Grey literature may be written with bias, there may be a lack of replication within the data, and it will not have been peer reviewed and is thus less reliable as a data source.
Often there is limited detail within peat management plans and planning applications for wind farms. For example, it is assumed that all excavated material will be peat; differences between peat layers (acrotelm and catotelm) are not distinguished and there is no reference to the vegetation layer. Depending on volumes, the only indication of reuse is stated as backfilling around turbine bases and landscaping around access tracks. As well as the aforementioned issues with the reuse of excavated peat, one important consideration that is often not discussed is that the different layers of peat excavated (acrotelm and catotelm) have different physical properties. Whilst the reuse options discussed above may be appropriate for acrotelm peat, they are unlikely to be suitable for catotelmic peat (generally below 1m depth peat)[1].
There is a lack of understanding related to the outcome of peat reuse – is it to restore peatland bog function, or is it to try to reduce losses of carbon from the excavated peat? Or is it to do something with the excavated peat that will minimally impact the wider environment? The likelihood is that the overall outcome will be somewhere between these points.
Although there is a significant amount of academic research on the impact of wind farms on peatland, there were clear gaps related to what should be deemed ‘best practice’. For example, there is no published work on the measurement of peatland parameters as part of the reinstatement of borrow pits on wind farms – how can best practice be defined when there is no indication of something working in practice, or a clear understanding of what ‘success’ looks like in this context? There have also not been any in-depth assessments of carbon loss after excavation and reuse – discussions were held in relation to loss of carbon as the peat dried out, but there is a lack of direct studies focusing on this over time. This information is also absent from the grey literature. There was a lot of discussion with stakeholders regarding what they believe works best from a real-world perspective (rather than lab based academic studies), but this still lacked underlying reported evidence, and was only discussed in terms of past experience of what worked (to reuse the peat available, and perceived that it remained within the field rather than eroding) and what hasn’t worked, remaining largely unmeasured and therefore unproven. Interestingly, where a wind farm had used a novel method of reuse, there was a monitoring plan set up by the energy company and evidence was gathered to justify this method. Highlighting how energy companies can lead the way in providing evidence of good practice.
Generally, there was a lack of monitoring occurring, both in terms of whether the construction process adheres to what has been set out in the PMPs but also to ascertain whether the approach has worked (and thus could be referred back to and repeated elsewhere). There is also a disconnect between the desired outcomes compared to the aims of the wind farm operators. For the wind farm developers, there is a need to balance aspects such as effectiveness and safety within the construction process (i.e. the need for drainage), with restoration, when that part of the construction process is complete. Removing drainage if it is no longer necessary within the wind farm infrastructure would enable an area to return to a more natural peatland habitat, although dialogue is required to ensure a shared understanding of how this might be defined.
Legislation and advisory documents change over time, for example “Scotland’s Peatland Standard”[1] (SPS) is currently being developed. This document will provide technical information and guidance to promote peatland protection. It will define the minimum for sustainable management and restoration requirements that Scottish Government expects all peatland owners, managers and contactors to follow. Thus, in future could potentially fill some of these knowledge gaps discussed.
We have developed the hierarchy below for reuse of peat through the literature review, stakeholder discussions and site visits presented within this report. We considered the role and nature of a potential hierarchy for peat reuse methods during this project, considering:
What needs to be included in a hierarchy and in which order.
What additional guidance or principles would help guide an environmentally beneficial approach to peat reuse.
Highlighting the research gaps at this time that need to be addressed to better inform a hierarchy of peat reuse methods.
Based on the findings of this study we have three recommendations:
Recommendation 1: Guidance on excavation peat reuse
1a: Planning and preparation steps 1b: A draft hierarchy of reuse methods 1c: Peat reuse and implementation principles
Recommendation 2: Environmental outcomes framework to ensure the multiple potential environmental benefits of peat reuse are considered, avoiding a single-issue focus.
Recommendation 3: Enhanced monitoring of environmental outcomes from reuse of peat – these investigations need to be targeted to address the specific research gaps highlighted in our study, and also better routine monitoring of site reuse implementation and environmental outcomes.
Our recommendations come from learnings acquired during this study. Through a rapid evidence assessment, an understanding was gained of the current research occurring on peatlands and wind farm developments, alongside site visits to see what was occurring in the field and a series of stakeholder discussions and workshops to fill in the gaps where reports or data were lacking. An area of clear agreement across stakeholders, both in terms of construction and also the conservation sector, is to minimise the amount of peat excavated. Avoidance of peat excavation can mean different things to different stakeholders, for example:
Is avoidance about minimising the volume of peat excavated? (reduction of waste and minimising cost) – Yes
Is avoidance about minimising the areas of carbon-rich soil impacted by excavation? (limited footprint of impact) – Yes
Is avoidance about minimising the loss of area of peatland in pristine / good conditions? (protected biodiversity) – Yes
Is avoidance about minimising loss of hydrological connectivity across on-site/off-site peatland and the wider functions of larger peat bodies? (ecosystem services) – Yes
Depending on the perspective of the stakeholder they may agree or disagree with some of the above statements, however they are overlapping in terms of reducing the impact of wind farm construction across peatlands. Avoidance is the essential first step in the hierarchy of reuse.
At times the timeline between site acquirement, site surveys, planning approval, and construction company deployment, leads to issues related to preparation and planning. Discussion with stakeholders highlighted that often the site surveys presented as part of the planning applications may not be at the detailed scale necessary to identify areas with the deepest peat (that should be avoided) at the construction stage. The construction contractors would like to avoid the areas with the deepest peat (due to costs and time, as well as to minimise the amount of peat disturbed) but are limited by what has previously been set out within the planning application. The condition of the existing peatland across the landscape prior to wind farm construction may not have been fully assessed, thus if the peat is already degraded the starting point for the reuse of peat will be lower and has the potential to degrade faster when disturbed.
Understanding the hydrological connectivity of the landscape will enable appropriate placement of drainage, this links closely to site condition – if there are already drier areas within the peatland, they may become drier over time with increased drainage. In some instances it is possible to reduce drainage after construction, if the areas being drained are reinstated with peat, however this is a consideration that should be made at the planning stage. Greater training needs to be provided for the construction operatives, both in terms of implementation of activities, but also to understand why it is important; as key to maintaining the quality of the peat during reuse, is minimising disturbance and maintaining the peat structure from the outset.
The importance of peatland for carbon storage is widely discussed both within the literature and by stakeholders, however, a key disconnection between the planning process and the completion of windfarm construction is the accuracy of the carbon calculations – it was widely discussed that in the majority of developments more peat is excavated than was planned. The actual amount of excavated peat is not used to recalculate the carbon loss and thus the overall impact of the wind farm development is not fully assessed. It also means the contractors inevitably have more peat excavated than was planned for reuse, thus the options for reuse of this peat may lack adequate planning for how to reuse appropriately. It is a pity contractors aren’t required to report how much peat has been excavated during the construction process, as this could improve the accuracy of estimates over time, but currently this data is not available or monitored. The condition of the peat that is reused is rarely monitored (at excavation or afterwards), therefore it is unclear whether this peat will continue storing the carbon it contains or whether carbon will be released into the atmosphere. Academic studies collecting empirical data on the release of carbon from disturbed peat are rare, and do not occur at a field scale or if they do these assessments usually occur in relation to agricultural disturbance rather than windfarm construction and are not wholly applicable. Where the peat was excavated from is also an important consideration for reuse – if it is taken from a borrow pit excavation this lends itself to borrow pit reinstatement, however if it is removed for cabling and road installation than returning the peat to this area (referred to as landscaping) may be a better option.
Recommendation 1: Guidance for Peat Reuse Options
Because detailed evidence to confirm the different environmental outcomes is not available, our recommendation is for a simple hierarchy of peat reuse options accompanied by some additional guidance and requirements which are essential for maximising environmental outcomes:
Recommendation 1a: Preparation and Planning Steps:
Avoiding / minimising peat excavation and
Appraise site circumstances and locally relevant potential reuse options
Recommendation 1b: Hierarchy of Peat Reuse
Recommendation 1c: Peat Reuse Implementation Principles: to guide the site-specific choice of methods and implementation to maximise environmental outcomes.
The hierarchy is not useable as a standalone guide – it must be accompanied by the additional components – as shown in
.
Figure 6: Guidance for Excavated Peat Reuse
Recommendation 1a: Preparation and planning steps
Is critical to conduct investigations to inform preparation and planning in order to maximise environmental outcomes – including first taking action to avoid peat extraction. Our recommended preparation and planning steps are set out in Table 6.
Table 6: Preparation and planning steps to accompany the hierarchy of peat reuse
Step 1: Avoidance
As per NPF4, avoidance of peat excavation is always the priority, in agreement with the NPF4 mitigation hierarchy. As part of the avoidance strategy, a “restorability assessment” should also be included – this should determine the condition of any peat that is due to be excavated and makes an assessment of the potential for reinstating the peat in that location. Taking into account the peatland condition, where it is located within the wider landscape, accessibility and how easy it may be to restore degradation in the future. As part of the avoidance strategy, as well as macro-level site decisions (e.g. develop on peat or not), micro-level decisions on site and in project designing and contracting should be considered to reduce the volume of peat excavated and/or impacted. For example, ensuring peat depth assessments are accurate and are used to guide any micro-siting[1] decisions.
[1] Micro-siting is where small adjustments to the wind farm lay out are made to avoid / minimise damage to peat (or other sensitive environments) on site.
Step 2: Preparation and planning: Appraise site and potential reuse outcomes
Preparation is critical for identifying the most beneficial options available on site and their feasibility. What is the depth of peat across the site? What has the peat been categorised as? If it is not in good condition, does it have potential for restoration? Has it been modified? Or drained? Aligning the details submitted within the application process (EIA) with further surveys, identifying depth and condition of peat at the exact locations for the tracks, turbines, general infrastructure and proposed reuse locations.
Planning, with the desired outcome in mind, is crucial to the successful reuse of peat. Knowing the volumes of peat to be excavated and from where on the site. Knowing the depth of peat and the thickness of each layer (acrotelm and catotelm). Planning where the borrow pit and stockpile need to be located. Planning peat movements to minimise disturbance. Contacting other stakeholders that may be able to enhance reuse of peat activities.
Prior land use:
Understanding what the starting land condition is. Has the land been used for other activities prior to wind farm planning? For example, many wind farms are being built on previous forest sites; some may have been used for grazing or are semi-natural habitats? These previous activities will impact drainage across the site, some areas may be drier or need to have the drained area restored, stump flipping may need to occur, and also natural regeneration of forest may affect the vegetative composition.
Peat condition and depth:
If the peat is in “good” condition prior to wind farm construction, this may negate some of the energy savings of renewable energy generation, as some studies have suggested that the carbon saved from the wind farm development won’t offset the damage to the environment. However, there are very few areas of pristine peatland in Scotland, and it is more likely to be a mosaic of conditions across the landscape – which may need to be considered regarding the progress of construction. The depth of peat in the area is also important, as deeper peats have different properties in terms of acrotelm, catotelm and underlying parent material. Very shallow peats are also a concern as they are more liable to mixing of soil and peat layers.
Reusability of peat at start of construction
The condition of peat prior to excavation will have an impact on its reusability. If the surrounding peatland is degraded, reused peat is unlikely to improve the conditions in the surrounding area (unlike peat extracted for restoration purposes). Inevitably, there will always be some degradation as peat is excavated (whether that’s through a loss of carbon or changes in porosity, hydrology, or vegetation coverage); thus minimising the amount of peat excavated will protect the environment. However, the counter point is that if the peat excavated is in very poor condition to begin with, it may not be able to be reused, and perhaps should not be excavated?
Site specific opportunities for reuse:
For all wind farms (and construction sites), the geographic limits for development activities are set (the development envelope). If there are areas where the reuse of peat would be more appropriate that is outside this area, than the reuse cannot occur there. Consideration should also be given to the site layout and options for reuse destinations – what is being constructed first and where. For example, the floating roads are often the first part of the infrastructure constructed to allow access to all areas. Where are the water courses and flows within the site, what is the connectivity with the wider landscape and habitats e.g. Is there an overlap with prior landuse or adjacent restoration work? Is the order of excavation and reuse appropriate to minimise carbon loss?
Agree desired outcome for use of excavated peat:
Setting a feasible intention (e.g. habitat to aim for) considering the site conditions and opportunities at the outset.
Recommendation 1b: Hierarchy of reuse
The rational for the hierarchy of reuse set out in Table 7 reflects the available evidence for environmental outcomes of peat reuse. The main options all have potential to deliver positive environmental outcomes in comparison to the secondary options or landfilling but there is insufficient evidence to rank the main options further. Their feasibility and environmental outcomes will depend upon the site context and the way they are implemented.
The table provides a supplement to the available information on good practices for use and handling of soil and peat. The evidence of environmental outcomes of reuse options has many gaps currently. Where there is evidence, it cannot always be confidently applied to specific sites and circumstances. Therefore, these principles / considerations are taking the precautionary principal approach and should be used as stepping stones reflecting the consensus amongst technical experts about things which are important to consider in the absence of a complete evidence base.
Table 7: Underlying rationale and details related to hierarchy of reuse of peat
(1) Main re-use options
Borrow pit reinstatement or infill
Borrow pit reinstatement involves putting excavated peat into a borrow pit at the end of the period of use. Potential desired outcomes can vary and should be informed by the planning steps.
Key priorities: Aim for a functioning bog, then consider other locally valuable habitats. Management / design needs to prioritise setting up the reinstated borrow pit appropriately for desired outcomes e.g. including an impermeable layer at the bottom of the pit; water outlet to hydrologically link the borrow pit to the rest of the peatland habitat; layered in a similar way to how it was excavated (including a vegetation layer). Aim to only move peat once if possible. Otherwise, if the peat that is removed from the borrow pit will be returned to the borrow pit it will need to be stockpiled prior to reuse. Reinstating the surface vegetation appropriately should enable recolonisation of the surface layer which will aid the development of a functioning bog habitat and increase biodiversity.
Rationale:
Capable of taking high volume, of which a significant portion may be from the original site as a result of the borrow pit excavation.
Whilst our study did not find peer reviewed studies that confirmed the environmental outcomes of borrow pit reinstatement, observations and comments from stakeholders, and their in-progress monitoring suggests some good environmental outcomes (including maintaining water levels and peatland vegetation), when borrow pit reinstatement is completed properly following the above key priorities.
Further research is needed to confirm these environmental outcomes – we have seen this is occurring at some sites, it would be beneficial to the sector if these results were published.
Other reinstatement
There are other areas impacted by wind farm developments that could be consider for reinstatement – for example areas that have been used for building compounds, crane pads, temporary access tracks etc
Reinstatement involves the reuse of peat to blend the natural habitat with the infrastructure disturbance as a way to encourage vegetation re-growth.
Key priorities: Maintaining hydrological connectivity between the reuse of peat and the landscape in situ. High risk of the peat drying out leading to erosion. To reduce this risk it is important to follow the peatland restoration technical compendium and future requirements of the forthcoming Scotland Peatland Standard.
Restoration
Restoration involves the reuse of excavated peat by incorporating it into areas of peatland on site that have previously been degraded through anthropogenic activities – for example forestry or peat-cuttings directly accessible from the development site. This can offset (compensate) for some of the residual impact of the development or for enhancing peatland conditions in support of the reinstatement of functional peatland. A number of discussions with stakeholders presented examples of this type of restoration occurring on wind farm developments. Although the results are unpublished, the results show promise as a way of delivering enhanced environmental benefits as part of the construction process.
Key priorities: Design must be site specific aiming for functioning peatland or other locally valuable habitat. After a thorough site survey, areas that are degraded peat should be identified and considered part of the reuse process. For long term success of this reuse method there needs to be collaboration between peatland restoration experts alongside the construction sector and use of the peatland restoration technical compendium alongside the Scotland Peatland Standard.
Rationale:
If this method of reuse of excavated peat was to occur, it would initially only be in areas within the wind farm development site identified as potential areas for restoration.
Reusing peat in these areas, although takes more planning and time (including assessing peat slide risks), is likely to be beneficial, particularly if it enables restoration which would not be possible in the absence of available peat.
Reinstating peat where peat has been historically located has a greater likelihood of returning peat to a functioning level than reusing peat in areas that were not peatland previously.
Peer reviewed studies were not available to confirm environmental outcomes of peat in restoration but observations and comments from stakeholders, and their in-progress monitoring suggests potential for good environmental outcomes, although only if well designed – more research is needed to understand effective methods and environmental outcomes.
Landscaping (road verges, embankment slopes etc)
Landscaping involves reinstatement of peat above cabling and alongside floating roads and embankments. Often the excavated peat is from where the cable is to be laid and will be returned to where it was extracted from, however alongside roads and embankments may be from other areas.
Key priorities: Care needs to be taken to maintain peat layering and planning related to hydrology needs to occur (as the peat above the cable risks being hydrologically isolated if situated between the floating road and drainage channels). Floating roads are often higher than the surrounding habitat, as aggregate and geotextile mesh has been put down as part of the construction process, this creates an island effect. It is important to consider the vegetation when reusing peat as part of the landscaping process. It is crucial to not reinstate peat on top of vegetation, this may mean that vegetation needs to be lifted away to reuse peat prior to returning the vegetation to the area.
Rationale:
Reusing peat along these road verges can improve the landscape, by changing the levels between the road and the wider landscape reducing the risk of island effects, but only if the hydrology and placement is considered, will it have the potential to reduce degradation.
It may be the only practical option in some circumstances as blending the zones between the infrastructure and wider environment may reduce the degradation spreading into the undisturbed peatland (through reducing the risk of the peat drying out and erosion occurring).
Reinstating excavated peat along the roadside will stabilise the surface and reduce the sediment runoff which could damage the wider environment.
Reusing excavated peat along roadsides gives the natural vegetation a chance to recolonise and restore these areas close to the wind farm development. Vegetation reduces the risk of erosion and further degradation.
Secondary options (2,3)
There is limited interest in reusing peat offsite and for the majority of construction projects it does not appear to occur. Questions were asked of stakeholders to assess if excavated peat could be reused within the horticulture sector, whisky industry or other aspects of the construction or energy sector. In all instances the answer was a definitive no, there is no evidence for the reuse of peat offsite in these sectors as part of wind farm construction, it does not occur. This is likely due to the volumes of peat involved and the sporadic nature of the supply chain, also as the Scottish Government has committed to phasing out the use of peat in horticulture this is unlikely to gain momentum as a viable option.
There are instances where an area has lost peat previously due to land use activities and offers an opportunity for excavated peat to be reused as part of restoration. An example from the stakeholder consultation was where the reuse of peat from a wind farm construction was used to reinstate an area of mining that had occurred nearby. It is important to note that if onsite reuse cannot occur all endeavours should be made to undertake these secondary options prior to the last option of landfill which should be avoided.
(2) Offsite
(known use)
This reuse occurs on a case-by-case basis and usually occurs where the land ownership or construction operators are linked. For it to occur more frequently, greater planning and preparation needs to be implemented prior to excavation and transport.
(3) Offsite
(unknown use)
Where peat has been extracted and there was no reuse plan in place for it, this could lead to unknown use offsite. This reuse is very unlikely to occur but when it does it is usually in small quantities e.g. for novel trials of reuse options. This is because once peat leaves the site it will be considered waste and is also costly to transport.
(4) Last resort option
Landfill
This should be considered a “last resort” option, and all other options should be prioritised before this.
The effectiveness and likely outcomes of different methods of peat reuse is heavily dependent on-site specific context, feasibility of achieving the desired outcome, and the detailed design of the method (such as borrow pit infill design). Thus, any hierarchy needs to be flexible, but decisions should be guided by a set of principles to maximise environmental outcomes. These include:
Aiming for functioning peatland (as close to natural functioning as possible because full natural functioning is likely to be unachievable in most cases), or other valuable habitat if not possible.
Maintaining / reinstating vegetation
Maintaining / reinstating water flows / hydrological functioning, whilst ensuring site stability and safety.
Minimising peat movement
Maintain peat structure (layers) where possible.
See Table 8 below for more detail.
Putting these into practice is facilitated by the preparation steps set out in Recommendation 1a above. For example greater detail could be requested prior to planning consent, because most peatland management plans lack depth and site-specific details. Requiring this information prior to the start of the construction process will increase the likelihood that planning, and preparation will be undertaken to the necessary extent to improve the outcomes of peat reuse. This would move the onus from contractor and place it with the energy company / landowner that ‘owns’ the consent and is responsible for full legal compliance. Greater detail within the PMPs would also provide a more accurate understanding of the true quantities of peat to be excavated, by including a requirement under the consent for accurate recording and in turn enhance the reuse strategy to be implemented. This could also provide future developments with more accurate calculations to use within their planning applications and PMPs. However, it is beyond the scope of this research to identify where responsibility lies for receiving and reviewing such additional material.
It was clear through the stakeholder consultation that there are a number of very knowledgeable groups working within the sector (Appendix B, including environmental government organisations, wind farm contractors, energy companies, environmental consultants from the private sector, as well as academics and conservation organisations). Capturing this knowledge to ensure recommendations for best practice are supported by what is practical will improve the wind farm construction process in the future.
Table 8: Peat reuse implementation principles – further explanation
Peat reuse implementation principles
Hydrological connectivity
Mapping out the connectivity of the site, will enable better drainage planning, targeted to ensure site stability / safety and support the desired peat reuse goal e.g., desired habitat. It will also enable more successful reuse of the peat if it is kept wet and can connect into the hydrology of the surrounding land at the location of reuse.
Minimise peat handling and disturbance
If enough planning has occurred, it may be possible to only need to move the peat once – from where it is excavated to the site of reuse. This also avoids storage of excavated peat, which generally leads to undesirable changes in peat properties, e.g. loss of water, bulk density increase, carbon loss, damage to microbial populations
Separation of peat layers
When excavating peat, the success of reuse will be increased if the different peat layers are kept separate (acrotelm, catotelm, and underlying mineral soil) as they have very different properties.
Maintain wetness of stockpiles
Stockpiling of excavated peat should be avoided where possible. If necessary to stockpile peat, stockpiles should be watered when necessary to maintain wetness. If the surface of peat dries out, a hydrophobic layer may form. This reduces the overall infiltration rate of the peat blocks and may lead to further desiccation and other negative impacts, as noted above under ‘Minimise disturbance and avoid storage/stockpiling’.
Multiple environmental outcomes should be targeted through peat reuse. To avoid excessive focus on one environmental measure of success, we recommend the following environmental outcomes should be considered when deciding on which peat reuse option to implement on site. These environmental outcomes should be monitored to assess success (see Table 9 for rationale):
Minimising carbon loss from excavated peat
Positive biodiversity outcomes reflecting local and national goals
Ensuring downstream water quality (sediment / nutrient load)
Following on from Recommendation 1 and the hierarchy of reuse options, environmental outcomes framework indicates the priority environmental outcomes for peat reuse. These should be considered by the consenting authority as part of the planning process, in conjunction with the EIA process and developers should be considering these in their development plans. We recommend the consenting authority to check that the applicant has fully considered these areas within the planning proposal as part of their strategy for reuse. The environmental outcomes framework should also guide subsequent monitoring and evaluation, during and after construction. Clarity on what environmental outcomes could potentially be achieved from peat reuse can support all parties to deliver better environmental outcomes.
Table 9: Rationale for Environmental Outcomes Framework for Peat Reuse
Outcome
Rationale for inclusion in the Framework
Minimising carbon loss from excavated peat
Carbon can be lost as the peat is disturbed primarily through hydrological changes and erosion – these two processes are interlinked, as erosion is more likely when peat starts to dry out. Leading to the loss of particulate organic carbon (POC) which is more easily transported by wind or water erosion. As the peat dries out and is exposed to oxygen, aerobic decomposition of the organic matter starts to occur, releasing the stored carbon as CO2. As carbon is lost subsidence of the peatland may also occur, this has knock-on concerns for the wider environment and safety and stability of the wind farm. Where the excavated peat has been left bare of vegetation carbon loss and erosion are also a greater risk.
Positive biodiversity outcomes reflecting local and national goals
Enabling the regrowth of peatland vegetation (particularly indicative peatland species like sphagnum mosses) helps rebuild peat structure and enhances carbon sequestration potential, but it also improves the wider biodiversity within the environment. However, studies focusing on peatland restoration have shown that vegetation is slow to recover and even ten years after restoration the vegetation present can still be dissimilar to pristine peatlands (Kareksela et al., 2015). Thus greater consideration is necessary related to vegetation regrowth to maximise its potential. Within our recommendations we have advised on best practice for the reuse of peat, however action should also be taken to maintain vegetative cover alongside this reuse. Whether this is through moving the vegetation layer as part of the reinstatement of reused peat, seeding the reused peat, or if there is existing vegetation in the area planned for peat reuse, stripping this off and placing aside, so that the vegetation can be replaced once the reused peat is reinstated in the area and stabilise the peat.
Ensuring downstream water quality (sediment / nutrient load)
Excavated peat can lead to increases in dissolved organic carbon (DOC) within water systems leading to changes in downstream water quality, as well as increased sediment loads. This can be through the physical disturbance of the construction process increasing water erosion and DOC leaching. Drainage can cause hydrological alterations and redirect water flows, mobilising sediments (POC) and DOC leading to increased carbon losses and peatland erosion (Grieve & Gilvear, 2008).
Recommendation 3: Improved research and monitoring
In discussion with stakeholders, some monitoring is occurring post wind farm construction for peat reuse, usually by the landowner or energy company, however as discussed previously this monitoring is not mandatory and usually focuses on novel uses, or where the reuse appears to have been successful. We recommend:
Monitoring of environmental outcomes of peat reuse for the life of the windfarm, EIAs often require follow up monitoring in relation to biodiversity post-construction, however Peatland Management Plans (PMPs) do not. We recommend greater considerations is given to PMPs as part of follow up monitoring to include:
Monitoring of peat levels, and wetness around the wind farm, irrespective of reuse option, this should occur to identify areas that may be drying out due to drainage, or where too much waterlogging may be occurring because of the changes in hydrology caused by the construction process.
Monitoring of vegetation cover and types, for example through vegetation surveys are used as indications of functioning peatlands, but other measures (like DOC within the water catchment or carbon fluxes) could provide a more nuanced understanding of the impact reuse is having on the wider environment.
Greater sharing of this data and collaboration with the academic community, would also enable further distinctions of best practice to occur. We recommend a formal advisory relationship to form between developers and the research community facilitated by Scottish Government, so that data sharing can occur and consenting authorities have access to better knowledge of effective peat reuse being undertaken. Data that has historically been collected but has not been reported on could be shared initially to assess how a collaborative data sharing process may work. The current lack of data sharing and credible longitudinal studies was noticeable at the site visits for wind farms that had been commissioned 10+ years previously – key details had been lost with job changes / retirement that could have benefitted the wind farm sector as a whole, with improved understanding of what is now visibly working and what hasn’t worked so well.
Research gaps
There are many research gaps that have been highlighted throughout this study. These could be addressed through the following actions:
The exact volume of peat excavated across a wind farm development is not known at completion of construction → We recommend asking the contractors to update records at the end of construction. Building on this we recommend a study to assess the differences between the amount of peat stated to be extracted prior to the wind farm development commencing compared to the wind farm after construction has finished. This could also be used to improve the accuracy of the carbon calculator providing a more accurate picture of the true carbon losses after completion of construction.
Understanding how the carbon content changes within the peat volume over time for all reuse options → We recommend monitoring projects focusing on carbon loss and GHG emissions
Seeing how the full GHG balance for infilled borrow pits changes dependent on size and age of the borrowpit → We recommend that monitoring of infilled borrow pits including size and volume, and hydro connectivity needs to occur at regular intervals
The environmental outcomes of borrow pits have not been fully assessed → We recommend collecting monitoring data of the regeneration of plants and biodiversity over time will enable this.
Reviewing available printed information on best practice (and standard practice) → Likely this is very limited and may involve contacting energy companies to access internal data and reports. We recommend greater collaboration between the energy companies and academia, with a greater amount of data sharing. Funding opportunities are usually the best way to encourage engagement between different stakeholders.
The level of revegetation on peat that had previously been excavated appears to be reliant on natural recolonisation, how well this occurs is not thoroughly understood. → We recommend monitoring how plants recolonise the excavated peat that has been reused which would enable a better understanding of best practice. From discussions with stakeholders there is limited reseeding occurring and it is largely left to natural revegetation. However, this is more likely to occur if the surface plants are maintained (removing the in situ plants, redistributing the reused peat and returning the plants on top should enhance recolonisation rates).
Conclusions
These results highlight our current understanding of peat reuse methods occurring in wind farm construction in Scotland. We have identified the critical environmental issues and how the reuse of peat can maintain the habitat, allowing for environmentally conscious construction techniques to take precedence.
However, the overriding synthesis of the information gained during this process is that planning prior to construction is key, as well as ensuring that stakeholders work together to achieve best practice. Avoidance of excavation of deep peat is the first priority. Next, acknowledging that once peat is excavated full consideration of how best to reuse it (ideally only moving it once and keeping the different layers separate, while aiming to keep the peat wet and/or maintaining hydrological connectivity) are crucial.
After these main outcomes from the hierarchy, attention needs to focus on delivering site specific reuse. It also became apparent that although there is a lot of knowledge within the peatland and wind farm sector, there has been limited studies collecting data to inform best practice. This needs to be encouraged to understand current research gaps and advise on the right management methods to reduce peatland degradation in the long term.
References
Albanito, F., Roberts, S., Shepherd, A., Hastings, A., 2022. Quantifying the land-based opportunity carbon costs of onshore wind farms. Journal of Cleaner Production 363, 132480.
Armstrong, A., Burton, R.R., Lee, S.E., Mobbs, S., Ostle, N., Smith, V., Waldron, S., Whitaker, J., 2016. Ground-level climate at a peatland wind farm in Scotland is affected by wind turbine operation. Environmental Research Letters 11, 044024.
Austin, K.G., Elsen, P.R., Coronado, E.N.H., DeGemmis, A., Gallego-Sala, A.V., Harris, L., Kretser, H.E., Melton, J.R., Murdiyarso, D., Sasmito, S.D., Swails, E., Wijaya, A., Winton, R.S., Zarin, D., 2025. Mismatch Between Global Importance of Peatlands and the Extent of Their Protection. Conservation Letters 18, e13080.
Balode, L., Bumbiere, K., Sosars, V., Valters, K., Blumberga, D., 2024. Pros and Cons of Strategies to Reduce Greenhouse Gas Emissions from Peatlands: Review of Possibilities, Applied Sciences.
Bragg, O.M., 2002. Hydrology of peat-forming wetlands in Scotland. Science of the Total Environment 294, 111-129.
Brehm, T., Culman, S., 2022. Pipeline installation effects on soils and plants: A review and quantitative synthesis. Agrosystems, Geosciences & Environment 5, e20312.
Chico, G., Clewer, T., Midgley, N.G., Gallego-Anex, P., Ramil-Rego, P., Ferreiro, J., Whayman, E., Goeckeritz, S., Stanton, T., 2023. The extent of wind farm infrastructures on recognised European blanket bogs. Scientific Reports 13, 3919.
Detrey, I., 2022. Bog in a Box: Is long term peat storage for future restoration viable? University of the Highlands and Islands, UHI.
Dykes, A.P., 2022. Landslide investigations during pandemic restrictions: initial assessment of recent peat landslides in Ireland. Landslides 19, 515-525.
Elmes, M.C., Petrone, R.M., Volik, O., Price, J.S., 2022. Changes to the hydrology of a boreal fen following the placement of an access road and below ground pipeline. Journal of Hydrology: Regional Studies 40, 101031.
Evans, M.G., Burt, T.P., Holden, J., Adamson, J.K., 1999. Runoff generation and water table fluctuations in blanket peat: evidence from UK data spanning the dry summer of 1995. Journal of Hydrology 221, 141-160.
Ferretto, A., Brooker, R., Aitkenhead, M., Matthews, R., Smith, P., 2019. Potential carbon loss from Scottish peatlands under climate change. Regional Environmental Change 19, 2101-2111.
Grieve, I.C., Gilvear, D., 2008. Effects of wind farm construction on concentrations and fluxes of dissolved organic carbon and suspended sediment from peat catchments at Braes of Doune, central Scotland. Mires and Peat 4.
Heal, K., Phin, A., Waldron, S., Flowers, H., Bruneau, P., Coupar, A., Cundill, A., 2020. Wind farm development on peatlands increases fluvial macronutrient loading. Ambio 49, 442-459.
Jennings, P., Kane, G., 2015. Geotechnical engineering for wind farms on peatland sites, Geotechnical Engineering for Infrastructure and Development, pp. 595-600.
Jorat, M.E., Minto, A., Tierney, I., Gilmour, D., 2024. Future Carbon-Neutral Societies: Minimising Construction Impact on Groundwater-Dependent Wetlands and Peatlands, Sustainability.
Kareksela, S., Haapalehto, T., Juutinen, R., Matilainen, R., Tahvanainen, T., Kotiaho, J.S., 2015. Fighting carbon loss of degraded peatlands by jump-starting ecosystem functioning with ecological restoration. Science of the Total Environment 537, 268-276.
Lehan, K., McCarter, C.P.R., Moore, P.A., Waddington, J.M., 2022. Effect of stockpiling time on donor-peat hydrophysical properties: Implications for peatland restoration. Ecological Engineering 182, 106701.
Lindsay, R., 2014. Impacts of artifical drainage on peatlands. IUCN UK Committee Peatland Programme. Briefing Note Number 3.
Lindsay, R., 2018. Peatlands and Wind farms: Conflicting Carbon Targets and Environmental Impacts, In: Finlayson, C.M., Milton, G.R., Prentice, R.C., Davidson, N.C. (Eds.), The Wetland Book: II: Distribution, Description, and Conservation. Springer Netherlands, Dordrecht, pp. 413-425.
Monteverde, S., Healy, M.G., O’Leary, D., Daly, E., Callery, O., 2022. Management and rehabilitation of peatlands: The role of water chemistry, hydrology, policy, and emerging monitoring methods to ensure informed decision making. Ecological Informatics 69, 101638.
Moravec, D., Barták, V., Puš, V., Wild, J., 2018. Wind turbine impact on near-ground air temperature. Renewable Energy 123, 627-633.
Morton, P.A., Heinemeyer, A., 2019. Bog breathing: the extent of peat shrinkage and expansion on blanket bogs in relation to water table, heather management and dominant vegetation and its implications for carbon stock assessments. Wetlands Ecology and Management 27, 467-482.
Natural England, 2013. Natural England Evidence Reviews: guidance on the development process and methods (NEER001). Natural England.
Renou-Wilson, F., Farrell, C., 2009. Peatland vulnerability to energy-related developments from climate change policy in Ireland: the case of wind farms. Mires and Peat 4.
Sander, L., Jung, C., Schindler, D., 2024. Global Review on Environmental Impacts of Onshore Wind Energy in the Field of Tension between Human Societies and Natural Systems, Energies.
Scottish Renewables, Scottish Natural Heritage, Scottish Environment Protection Agency, Forestry Commission Scotland and Historic Environment Scotland, 2015. Good Practice during Wind Farm Construction, version 3, available from https://www.nature.scot/doc/good-practice-during-wind-farm-construction
Smith, J., Nayak, D.R., Smith, P., 2014. Wind farms on undegraded peatlands are unlikely to reduce future carbon emissions. Energy Policy 66, 585-591.
Smith, P., Smith, J., Flynn, H., Killham, K., Rangel-Castro, I., Foereid, B., Aitkenhead, M., Chapman, S., Towers, W., Bell, J., Lumsdon, D., Milne, R., Thomson, A., Simmons, I., Skiba, U., Reynolds, B., Evans, C., Frogbrook, Z., Bradley, I., Whitmore, A., Falloon, P., Scottish Executive, Welsh Assembly Government, 2007. ECOSSE: Estimating Carbon in Organic Soils – Sequestration and Emissions: Final Report, Web only.
Tanneberger, F., Moen, A., Barthelmes, A., Lewis, E., Miles, L., Sirin, A., Tegetmeyer, C., Joosten, H., 2021. Mires in Europe—Regional Diversity, Condition and Protection, Diversity.
Waldron, S., Smith, J., Taylor, K., McGinnes, C., Roberts, N., McCallum, D., 2018. Repowering onshore wind farms: a technical and environmental exploration of foundation reuse. Carbon Landscapes and Drainage KE Network-led report. DOI 10.17605/OSF.IO/SCZDE
Wawrzyczek, J., Lindsay, R., Metzger, M.J., Quétier, F., 2018. The ecosystem approach in ecological impact assessment: Lessons learned from wind farm developments on peatlands in Scotland. Environmental Impact Assessment Review 72, 157-165.
Williams-Mounsey, J., Grayson, R., Crowle, A., Holden, J., 2021. A review of the effects of vehicular access roads on peatland ecohydrological processes. Earth-Science Reviews 214, 103528.
Zheng, Y., Waldron, S., Flowers, H., 2018. Fluvial dissolved organic carbon composition varies spatially and seasonally in a small catchment draining a wind farm and felled forestry. Science of the Total Environment 626, 785-794.
Appendix A – Research scope, questions and methods
Research Scope and Questions
To provide a comprehensive overview of the current state of knowledge, identify key knowledge gaps, and highlight areas for future research and policy development in sustainable peatland management within the context of renewable energy infrastructure, particularly in Scotland, this review has centred on the below questions:
Current practices:
How are excavated peat management and reuse practices being employed (of relevance for Scottish wind farm developments) both on-site and off-site?
Environmental impacts of current methods:
What are the impacts and/or benefits of current peat reuse practices in relation to hydrology and water quality, carbon emissions and storage, biodiversity and habitats?
Are there any environmental risks associated with current peat reuse practices, such as increased sediment load, erosion or landscape instability?
How do impacts change over time – what timeframes are relevant and are there long-term impacts of peatland disturbance and reuse practices?
Limitations and challenges:
What are the technical limitations of using excavated peat on-site?
How do regulatory frameworks impact the options for peat reuse?
Best practices:
From current available evidence, what peat reuse practices are preferable for minimising GHG emissions and wider negative environmental impacts?
How can peat management plans be optimised to maximise environmental benefits and minimise carbon losses?
Development of a reuse hierarchy
Hierarchy of Peat Reuse
Preparation and Planning Steps
Peat Reuse Implementation Principles
Research Methods
The following sections describe the information collation methods and data sources used in this study, these methods have been kept purposefully brief here, for more detail please see the appendices. A project database was compiled in Excel and is supplied separately to this project report.
Rapid Evidence Assessment
The method used for performing the evidence review was based on the Natural England (2013) evidence review methodology to ensure that the approach was transparent, objective and rigorous, allowing for robust evidential conclusions to be drawn from the available information for a full description see Appendix A.
Rapid Evidence Assessment methodology
The method used for performing the evidence review was based on the Natural England (2013) evidence review methodology to ensure that the approach was transparent, objective and rigorous, allowing for robust evidential conclusions to be drawn from the available information.
Scope
This rapid evidence assessment (REA) focused on synthesizing current evidence related to peatland excavation and reuse within the context of wind farm construction and similar large-scale developments. The assessment covered:
Current standard practices of peatland excavation and management in development projects.
Environmental impacts of peatland disturbance.
Opportunities for reuse of excavated peat on-site and off-site, including their environmental benefits and limitations over different timescales
Best practices for minimizing peatland disturbance and optimizing peat management plans.
Evidence search approach
The methodology comprises five main steps:
Define search strategy including keyword list compilation and define inclusion/exclusion criteria.
Searching for evidence and record findings.
Title and abstract screen.
Evidence extraction.
Evidence synthesis and evidence gap identification.
Step 1: Keyword list compilation
To establish a systematic search strategy, a list of key search words, search terms and suitable combinations were developed (included in separately shared document). These search terms were recorded for systematic use by the review team to reduce bias.
Step 2: Identification of information sources
In order to develop a comprehensive and relevant evidence base, appropriate information sources were identified. To reduce the risk of publication bias on the evidence base a range of information sources were used, which enabled access to peer-reviewed literature, grey-literature, and unpublished sources.
For this review Science Direct and Scopus were used to identify peer-reviewed information. Google Scholar and Research Gate provided further access to peer-reviewed information to enhance the literature search. Grey literature was also identified in the search and included industry reports and relevant committee proceedings.
Step 3: Evidence search
To facilitate the repeatability and transparency of the search process evidence searches were carried out as Boolean searches (AND, OR, NOT, etc). For example, using Boolean operators we searched (“excavated peat” OR “peatlands” OR “peat bogs” OR “carbon rich soils”) AND (“reuse” OR “recycling” OR “repurposing” OR “reclamation” OR “displaced” OR “borrow pits”) AND (“wind farms” OR “wind turbines” OR “wind energy” OR “onshore wind” OR “renewable energy”) AND (“sustainability” OR “environmental impact” OR “eco-friendly” OR “carbon footprint” OR “climate change” OR “carbon flux” OR “soil restoration” OR “land rehabilitation” OR “habitat restoration” OR “conservation”). The results of each search were recorded, including the number of search hits and number of relevant records returned, date of search and database used. Any other sources, such as evidence provided by stakeholders or generated through stakeholder engagement meetings were also documented similarly.
Developing and establishing search strings was treated as an iterative process and, as such, search strings were amended or adapted to optimise search relevance particularly where the number of search hits or relevance of records retrieved are excessively large or small.
Step 4: Title and abstract screen
In order to allow for a systematic and repeatable approach to screening whilst minimising individual subjectivity and bias, results of the evidence search were screened by title and abstract against pre-established inclusion and exclusion criteria for the review question(s). Evidence that did not satisfy the inclusion criteria were not taken forward for further analysis. References and key details (search date, search terms, publication name, database source and a DOI) were captured for all selected literature. Duplicates are also removed at this stage.
Step 5: Evidence extraction
To allow for interpretation and evaluation of the available literature evidence. A consistent, systematic approach to extracting evidence was taken for each item in the evidence item. Information was extracted on the basis of the review questions. Collated information included details of the type of study, the situation studied, key outcomes, endpoints and geographical extent (reported in separately shared excel document).
Step 6: Evidence synthesis and evidence gap identification
The compilation of evidence allowed for the type and amount of evidence obtained to be scrutinised and for any key evidence gaps or conversely areas of extensive evidence to be highlighted. This allowed for conclusions to be drawn based on the findings review and further enabled the appraisal of whether the collated evidence was adequate and suitable for addressing the review question. The collated information from the review of the literature is detailed in Supplementary Document 1 (finalisation in process).
Availability of the literature
The Rapid Evidence Assessment methodology used (Appendix A) obtained over 250 articles and reports through a range of keyword searches, in Science Direct and Google Scholar as described above. These were screened based on their title and abstract to identify relevant articles. This resulted in 50 articles and reports that were flagged as relevant for further scrutiny. These articles were then reviewed, and key information was extracted and is included within this report.
Desk-based research into current practices
A list of current wind farms in Scotland was obtained from the renewable energy planning database[12] (October 2024, quarter 3) sorted by energy type, location and whether they were currently operational (Figure 7). A sample of wind farms were chosen (as examples of a range of sizes of wind farms and locations across Scotland), to review the information provided within the peatland management plans, amount of peat to be excavated (if stated within application) and other related environmental planning information where obtained.
Figure 7. The distribution of wind farms across Scotland with peatland also highlighted. A list of current wind farms in Scotland was obtained from the renewable energy planning database[13] (October 2024, quarter 3) sorted by energy type, location and whether they were currently operational these were plotted on to a map of Scotland along with the distribution of peatland taken from Carbon and Peatland 2016 map[14].
Site visits
Five wind farm site visits were undertaken in November 2024 (Figure 3), these included three wind farms in the North-east of Scotland and two wind farms in the South-west of Scotland. These sites were chosen to cover a broad geographic distribution, a range of ages (different amounts of time since construction), and variation in peat depth. Visiting these sites provided a greater understanding of what was happening as part of the wind farm construction process, alongside providing context as to how peatland management plans are implemented and the many possible variations which can occur due to the amount of peat extracted, weather conditions and the inherent habitat quality prior to wind farm construction. These site visits also provided ‘real world’ examples of management practices in use, including (a) borrow pit reinstatement (over varying time periods – currently under construction, recent construction (< 5 years), 5-10 years since reinstatement, 10+ years since reinstatement), and (b) the replacement of peat at the side of the constructed roads (as part of the landscaping process and/or to maintain peat levels across the habitat).
Stakeholder Engagement Methods
During the study stakeholders were engaged for the following reasons:
To gain insights into current practices for reuse of peat excavated on wind farms in Scotland.
To gather views on the strengths, weaknesses, applicability and environmental outcomes of different reuse methods.
To gather suggestions for examples and sites which could provide learning about the two points above.
To gain input into the development of recommendations for reuse of excavated peat.
Appendix B Stakeholder engagement
Summary stakeholder engagement approach
Methods of stakeholder engagement:
Several different types of stakeholder engagement were employed in the study to gain further insights into relevant issues, current and potential future peat reuse methods, related considerations and impacts and to help identify sites to visit, get sign-posted to relevant documentation and research resources, and to understand considerations which are being or could be taken into account when decisions about reuse of excavated peat are made. Table 10 provides a brief overview of methods.
Table 10. Overview of stakeholder engagement methods
Dates
Activities
Purpose
Oct-Dec
2025
Research interviews with stakeholders / technical specialists.
Supplement desk-research.
Nov 2025
Site visits to wind farms incorporating local / other stakeholder engagement.
Gain insights into reuse activities on site, local context, site characteristics and how decisions were made.
Dec
2025
Academic / technical specialist online workshop
Supplement desk research, sense-check and refine draft recommendations.
Approach to identifying and selecting stakeholders to engage:
The project sought engagement with a range of different types of stakeholders academics and experts, such as those with a track record of relevant publications (i.e. on topics linked to the use of peat on wind farms in Scotland); practitioners from the energy sector (e.g. Ecological Clark of Works (ECoW) / Ecology officers) with wind farm sites in Scotland and from the construction sector that have been involved in building wind farms in Scotland; Civil Servants (Forestry and Land Scotland, PEAG); and conservation organisations (IUCN UK Peatland Programme). A selection of stakeholders were invited to attend the academic workshop, as well as a series of one-to-one discussions.
This approach to stakeholder engagement enabled the facilitation of site visits along with group discussions.
We identified stakeholders via:
Introduction / recommendations from the project steering group – a group of specialists from across relevant Scottish Government Agencies (see Section 8.1.7.3)
Desk research / REA – to identify relevant academics
‘Snowballing’ – asking our contacts and contacts via the steering group or other interviewees to recommend relevant technical experts or industry contacts who could provide access or insights about wind farm sites.
We have sought a diversity of sites, with reasonable access – but to include a site further North if possible due to variation in vegetation colonisation rates for reuse on site.
When selecting wind farm sites to visit we aimed to achieve a diverse range of sites with reasonable access where we would be able to observe a range of different types and ages of reuse of excavated peat. We chose to include sites in different locations, including some further North due to variation in vegetation colonisation rates which we were advised in earlier stakeholder interviews could likely influence the outcome / progression of reuse methods. We contacted several wind farmer developers / operators – some via introduction and some via publically available contact details and also landowners such as Forestry and Land Scotland. The final selection of sites for visit was based on who was willing to host a visit and practical feasibility in the project timescale and available resources (see Section 9.4). During the visits our hosts often shared wider insights about considerations for reuse of peat and examples from other sites which had worked well or less well – these insights are included in the summary findings here.
When selecting stakeholders to interview we tried to ensure a diverse range of perspectives, but we did not set out to achieve a rigorous sampling approach – we had to take a more pragmatic approach to gather insights from willing participants. The snow-balling approach was valuable in helping us identify people to speak to with relevant scientific and technical knowledge and who could provide insights into what had happened on specific sites. We made a deliberate effort to speak to some stakeholders from outside industry organisations, including academics, non-profit organisations and contractors/technical consultants to achieve some balance in our research. A full list of interviews is in Section 8.1.7.1.
Stakeholder workshop
We held an online workshop for academics and technical specialists on 16th December 2025 from 14:00 to 16:30. In total, 23 people attended (in addition to the Ricardo project team) including academic researchers, non-profit organisations, government agencies, energy company peatland specialists, see Section 8.1.7.2 for the list of attendees.
Workshop aims and objectives:
Gather insights from previous research and ongoing studies which may not yet be published, to fill research gaps.
Get insights into challenges / complexities which may need to be taken into account as we develop recommendations e.g. considerations for applying research results to different contexts / climates.
Discuss, test and refine initial ideas for a hierarchy of excavated peat reuse (or similar simple structured approach which could help guide decisions on peat reuse, depending on what has come from our earlier research.
Whilst the focus of the workshop was to engage academic researchers and technical experts, we also had attendees from industry who were technical specialists with relevant insights to share about their experiences with peat reuse in practice and the day-to-day challenges associated with planning, implementation and evaluation of peat reuse.
Workshop agenda:
Table 11. Workshop agenda
Time
Session
14:00
Introduction: project framing, context and scope; participant introductions.
14:20
Project literature review overview & stakeholder feedback
14:55
Examples of current practices drawn from sites visits / stakeholder interviews: comments, questions, sharing other examples.
Stakeholder feedback on recommendations / hierarchy
16:10
Final Polls: Feedback on options for recommendations
16:20
WRAP up and next steps
Findings from the workshop are incorporated into the stakeholder research results below (Section 8.1.6) and results of polls in Figure 8.
Figure 8: Results of word cloud (a) and other polls (b and c) undertaken during stakeholder workshop
a)
b)
c)
Method of analysis of stakeholder engagement findings:
Recording: Interviews
Transcripts and detailed notes of each stakeholder interview were recorded during the interviews and edited afterwards as needed to create an accurate record.
Recording: Site visits
During site visits photos and notes were taken relating to the site-specific context, practices and decisions. General learning was also noted, where for example the site host had experience across other sites or reuse practices.
Recording: Workshop
Transcripts and detailed notes were recorded during the workshop, as well as the results of polls and participation in interactive aspects of the workshop.
Analysis
Our project team systematically reviewed notes recorded from each element of the stakeholder engagement to identify comments related to the questions:
Current reuse practices
Potential future reuse practices
Insights about environmental outcomes from peat reuse
Other considerations
Evidence gaps
Priorities and recommendations.
Key findings from stakeholder engagement
Current peat reuse practices
During the workshop and stakeholder interviews a variety of practices were explained, along with associated issues, challenges and likely environmental outcomes or state of knowledge about the outcomes. The approaches are summarised in Table
Table 12. Current peat reuse practices
Current practice
Detail, benefits and issues
Borrow pit reinstatement, revegetation and habitat creation.
During site visits and interviews many examples of peat being put into disused borrow pits were shared. Common practices include:
Reinstatement / infill with the layer of peat which was previously on top of the borrow pit – often only part filled and then landscaped on one side to create gentler slope. Depth of infill varies.
Additional infill with peat excavated from elsewhere on site, sometimes designed with water outflow to mimic natural water flow.
Creating structured cells within borrow pits to maintain structure / control water flows with the aim of keeping peat wet / creating functioning peat bog or similar habitat.
Other practice examples included:
Allowing peatland heath type vegetation to develop in borrow pits without infilling any excavated peat (presumably when there was not excess peat).
Piping out peaty slurry from turbine bases into borrow pits.
Issues flagged included:
Water flows after infill – best practice is unclear, and design is unclear.
Peat depth – variable depths were filled, unclear whether all comply with current guidance[15].
Expense of constructing cells.
Insights shared about environmental outcomes:
Some examples seemed to have peatland vegetation indicator species and high-water tables
Often on slopes in landscaped borrow pits drier habitats develop.
Mixed success in maintaining / re-establishing vegetation cover meaning peat is sometimes left bare. More pronounce in northerly locations with slower vegetation colonisation.
Roadside verge reinstatement or revegetation.
A very common practice – excavated peat is stored alongside the road after construction, typically until after cables have also been laid, and then peat is reinstated. Sometimes:
Efforts are made to maintain structure and place turves on top for later reuse.
Wider verges are created / landscaped to hold more excavated peat from elsewhere on site.
Reseed to improve vegetation cover – although not common practice.
Issues flagged included:
Likelihood of peat drying out whilst store on roadside.
Significant risk of mixing soils and changing nutrient balance.
Significant risk of wind / water erosion during storage.
Convenience prioritised over effectiveness
Insights shared about environmental outcomes:
Mostly viewed as something unlikely to return to functioning peat bog due to peat storage, handling, contamination and proximity to road which will affect drainage.
Carbon may be lost during storage.
Revegetation, including wet heath type vegetation, was feasible or they knew of examples.
When vegetated can be beneficial to prevent silt / clay fines washing off into the wider landscape.
Infill historical peat cuttings
Not common but is used sometimes where peat cuttings are on site. Limited information was provided – unclear whether turves were placed on top or natural revegetation happened.
Example of storage in peat cuttings before use in incorporation into a restoration project was also cited.
Issues flagged included:
Only possible where peat cuttings exist – declining availability.
Insights into environmental outcomes:
Wet heath / acid grassland appeared to have developed on one site – although no vegetation survey data was available to confirm this.
Hydrological functioning / GHG emissions unclear – not data / other insights shared.
Reuse of peat where it had historically been located
Incorporate excavated peat into peatland restoration projects (pilot projects)
During two site visits and in other conversations examples of pilot projects to incorporate excavated peat into peatland restoration. Methods included:
Adding a layer of peat under existing turves / filling landscape furrows on former forested site.
Infilling bare sections of peat between hags, on degraded / eroded natural peatland areas.
Issues flagged included:
This is an experimental practice and not routinely permitted.
Access to suitable sites: access for earth works vehicles is difficult, making it hard to do larger areas away from tracks, without creating new access tracks.
Soil mixing is hard to avoid which can change nutrient balance in the peat and influence end result.
Designs aim to manage water to support peat formation whilst also ensuring safety / stability – different views were shared about how this should be done and appropriateness of approaches on site.
Insights shared about environmental outcomes:
Success of vegetation recovery/formation of active peat bog appears mixed so far, although long term observations and measurements are not available to enable evaluation.
GHG emissions fluxes are unclear – no monitoring data available.
Drainage related practices
Multiple stakeholders shared views and experiences on the role of drainage on site currently and typical practices. Current practices vary:
Infilling: some drainage ditches created during construction are infilled, and some aren’t. Those which are, are filled with arisings from the ditch creation, which would have been stored alongside for the duration of construction, mostly likely with limited management e.g. wetting.
Construction methods:
‘rock-filling’ above ground level in road construction to maintain water flows (floating road example)[16];
Angled flumes and other practices to separate silty or polluted drainage water to avoid wider pollution / silt spreading.
Issues flagged included:
Possible excessive / unnecessary drainage on some sites, having a detrimental effect on peatland habitats on site.
The importance of maintaining some ditches / drainage to ensure site stability and safety.
Insights shared about environmental outcomes:
Stakeholders felt that excessive drainage may hinder chances of successful recovery / recreation of peatland habitat re
Drainage important to maintain integrity of construction process – do not want to risk a peat slide
Scope for some of the temporary works drains to be infilled (usually with the arisings from the ditch itself) – however this is often not done (and doesn’t provide scope for vast quantities of peat reuse).
Peat handling & storage practices
Typical practice examples:
Roadside piles – various heights, various levels of attention to maintaining structure and wetness, varied timescales.
Efforts to minimise handling / transport often cited.
Insights shared about environmental outcomes:
Carbon lost when peat oxidises – often results when it dries out or is subject to erosion.
Carbon emissions from fuel use for transport around site (or off-site if that were to happen).
Off-site reuse of peat
No stakeholders cited any examples of peat being reused off-site – many had years of experience in the sector and had never known this to happen.
Other feedback provided by stakeholders on current practices included:
Variable ‘aims’ of reuse currently – ranging from developers who are trying to create functioning peatland on previously degraded land through to examples where people suggested there was no clear intention beyond finding a place to put the excess peat.
Compliance with guidance: multiple stakeholders shared a view / example that guidance is not always followed particularly in relation to peat infill depths and handling practices – reasons were unclear, although separately a skills gap was mentioned.
Quality of PMPs: varied – some followed fairly standard practice without consideration of the uniqueness of the site, whilst some were more nuanced / based on more detailed analysis of possibilities and potential outcomes
Enforcement / monitoring of PMPs: enforcement / monitoring during constructure can be inconsistent – sometimes very good collaboration and active consideration of effective approaches to achieve good environmental outcomes and sometimes poor / ineffective. Monitoring after construction and commissioning is not common practice, except were linked to habitat management plans which have a formal requirement for monitoring over the life of the site.
Influence of contracting process and responsibilities: separate contracts for different parts of the windfarm design and construction are commonly let which can make it difficult to develop and maintain a coherent plan for peat management through from planning permission through to final build and ongoing management. The wind turbine specification can also dictate excavation e.g. to achieve desired gradient for installation, but with more site surveys and consideration between developer, turbine supplier and site works contractor there may be potential to develop techniques which require less excavation.
Important of site selection / micro-siting: the flexibility to move turbines, based on more detailed site surveys of peat is important to reduce peat excavation.
Reuse of peat is well policed – must be in line with SEPA Reuse Guidance and therefore industry stakeholders follow this approach without feeling able to vary from this.
Potential future reuse practices
Practice
Details, benefits and issues
Deliberately targeting specific end habitat e.g. in borrow pits
Stakeholders suggested that it may be feasible to design reuse more intentionally with target end-habitat in mind e.g. designing the borrow-pit structure and planning peat excavation and handling specifically with the aim of targeting a valuable habitat – peat bog recreation if feasible or if not, another locally suitable and ideally wet habitat type. There was uncertainty about how to ensure success and what outcome was feasible on a site-by-site basis given the variability between sites in terms of prior land condition, surrounding context and land scape and land ‘capability’ for habitats.
Further use in restoration
Some stakeholders felt the incorporation of excavated peat into restoration projects had potential to achieve good environmental outcomes – examples highlighted were infill in degraded and eroded peatlands including hag infill, incorporation in former forested / forest bog landscapes – various methods being piloted.
Some apparent success of vegetation recovery on pilot examples was flagged, but stakeholders acknowledged that the environmental outcome were unclear.
Some stakeholder flagged potential concerns about the effectiveness of this approach due to:
Difficulty establishing vegetation on slopes
Potential challenges with water flows, depending on locations and hydrology.
Impact of damage during the restoration process and skills needed in planning, preparation and handling to achieve a good outcome.
Site stability / drainage – general agreement on its importance but different views on how to achieve / balance with other priorities leading to some concern about how to approach more experimental methods.
Infill of drainage ditches (where safety/stability allows)
Stakeholders flagged that, whilst it is important for site safety and stability to ensure suitable drainage is maintained, there could be opportunities to infil more drainage ditches or increase overall wetness on site to benefit existing peatland habitats on site or increase the likelihood of successful peatland habitat forming where peat reuse has aimed for this outcome.
Off-site uses
We asked whether uses such as agriculture/horticulture whiskey industry use would be feasible or environmentally beneficial in any circumstance or whether they knew of any other examples.
No stakeholders felt that off-site use was a good idea due to:
Costs
likely loss of peat structure / liquification during transport
environmental impacts of transport
likelihood that carbon would be lost from peat in the new use – lack of control over this.
Insights about environmental outcomes from peat reuse
Examples and comments on positive environmental outcomes:
Peat / vegetation recovery in restoration / hag infill – appears successful (in short-term) on flatter ground.
Softer trackside verges – vegetation and less slope – can prevent silt migrating into bogs.
Typical vegetation recovery: acid grassland mix initially, then (5-10yrs later) heathers / heath, and then hopefully wetter ones will progress to bog.
Examples and comments on negative environmental outcomes:
Most peat reused on wind farms turns into non-peatland habitat – it doesn’t function as peatland because hydrological conductivity is lost. At best going to form an upland wet heath, more likely to be an acid grassland.
If non-functioning peatland carbon will not be saved within the system Need to keep the carbon gaining and building within the system.
With poor water management silt is migrating into wet bogs.
Contamination of nutrient poor peatbog with mineral sources changes nutrient balance and therefore makes peatbog hard to achieve in reuse/restoration – flushed peat or fen more likely. Several stakeholders flagged that it can be challenging to prevent mineral contamination – storage and handling care is needed, and isn’t always feasible in practice.
Other comments on environmental outcomes:
Potential measurement approaches:
GI stage, peat probing / wetness, catchment mapping, qualitative sample (no one does this despite guidance), Van Post Scale (peat character).
Dip wells – across sites.
Water index via satellite imagery linked to Sentinal programme.
Pressure loggers – data recording for three months.
Options for assessing carbon; current government calculator, in house planning tools; revised carbon calculated – potential for different assumptions about loss of carbon on excavated peat.
Important to balance carbon / biodiversity outcomes. Some stakeholders flagged this in general and also one highlighted the challenge of balancing this in the context of deciding whether to rewet peat during storage – if abstraction from river is required this could have negative consequences for river habitat.
Several flagged nervousness about assuming reused and restored peat delivers the same environmental outcomes as natural peatlands.
Other considerations for excavated peat reuse
Drainage installation, maintenance and infill: stakeholders agreed that ensuring the right amount of drainage during construction and afterwards is important, but did not all agree on how well this is currently being achieved and whether it is possible provide clearer guidance on this.
Peat handling & storage: many stakeholders flagged the need to minimise movement and handling of peat, aim to keep peat local, minimise handling / travel distance. Use of large diggers and trucks makes this hard. Issues included:
Need to keep the peat moist: actively or passively
Need to maintain layers / structure and avoid contamination with mineral soils / aggregate as this will change the nutrient profile and functional structure of the peat.
Peat can liquify in trucks if handled.
Cost for moving peat
Some flagged that temporary storage in ‘groins’ between road junctions is often preferred as there is more space to work there, whilst other advocated designated storage areas. What is practical will vary site to site.
‘Land-made-available’ limitation: land envelope can restrict end destination of any peat reuse ‘on site’ – instances where sensible areas for ‘peat reuse’ are outside the envelope.
Site data availability: planning the peat re-use in advance would be good but often don’t get chance to plan until actually on site and work starts – trees often obscure lidar data.
Excavation timing: contractors don’t get much choice/penalties for delays – timing will influence ability to keep peat wet, keep structure etc.
Evidence gaps
Stakeholders flagged the following issues and gaps in evidence:
Limited monitoring of implementation and outcomes of Peatland Management Plans (PMPs). Monitoring isn’t required for PMPs in the same way as for Habitat Management Plans (which are monitored for the life of the wind farm), and therefore limited data is available on prior land condition, peat reuse/management methods, and environmental outcomes.
Approach and quality of assessments and monitoring could be better. Current over reliance on the presence or absence of specific vegetation as an indicator was highlighted – finding a species at a specific location in a large site doesn’t represent the entire site. Better quality peatland condition assessments are needed, ideally landscape based incorporating species, hydrology and other factors rather than quadrat based. This would provide better data for planning reuse / management and a better baseline for impact monitoring, particularly important as construction is often on degraded peat.
Lack of longitudinal studies into environmental outcomes of peat reuse/management approaches. People cited specific gaps such as study of behaviour and environmental outcomes of peat drying at the side of the road after reinstatement; impacts of storage techniques such as surface roughing to help water infiltration vs allowing crust to form; GHG emissions following disturbance and reinstatement.
General gap in terms of the understanding of peatland and peat behaviour in the context of wind farm construction. This includes peatland hydrology and how this is affected by disruption, how peat behaves in storage, the impact of movement on peat quality and potential for reestablishment in new destination
Evidence of the validity of measures such as water table and indicator species as indictors of GHG emissions / ‘functioning peat bog’ for reinstated / restored peatlands. Stakeholders flagged there is no research on peatland excavation and then reuse, hence need to establish the relationship with vegetation, hydrology.
Limited literature on remote sensing for wind farm monitoring.
Lack of clear guidance on some aspects of engineering and site management e.g. balancing drainage and wetness, storage practices.
Lack of research to show whether implementation of best practice is feasible. NPF4 Policy 5 states that ideally carbon rich soils are actively sequestering carbon, and this should be the aim of the PMP. There is a need for research to show if this is possible – this relates to points above about behaviour of peat after disturbance / validity of indicators.
Priorities and recommendations
In general stakeholders were reluctant to give detailed feedback on which methods of peat reuse on site should be a priority because of variability of site circumstances (e.g. land capability, condition) and the lack of concrete research to provide evidence of the environment outcomes which could be anticipated.
Some key comments and points on priorities were:
Revegetation and minimising bare peat is key to avoid negative cycle of drying and/or erosion: to help success it is important to have follow up surveys and action if issues are identified.
Need to minimise extraction of peat.
Advice must allow for flexibility and be nuanced due to the diversity of peatlands.
Suggested hierarchy:
Avoid;
Reinstate in location contiguous to other peatland where carbon can be retained and retain hydrology and long-term species composition will be at least consistent with species within the species disturbed.
Re-use off site to the same effect.
Alternative suggestion: two different hierarchies, one with the aim of functioning peatland, and one for the aim of using peat in a way that would result it being used for another purpose e.g. wet heath, dry heath.
Essential component is maintaining connectivity of the re-use areas with the hydrology and its immediate area, but also looking further at the wider hydrological unit. This also includes connectivity with the peatland restoration areas that will be undertaken on the site.
Guidance documents can be perfect, however, on the ground can be challenging e.g. to ensure hydrological connectivity – potential need for incentive to go for the best outcome and need to involve different parties to achieve this.
List of stakeholder discussion interviews and workshop attendees
Interviewees
Susan Nicol
Forestry and Land Scotland
Andy Gillan
RJ Mcleod
Mark Mulqueeny
SSE
Derek Healy
Duncan Mackay and Sons
James Allison
Scottish Power
Emma Taylor
SEPA
Roxane Anderson
University of Highlands and Islands
Gill Steel
Ironside Farrar
Siue Allen
Ironside Farrar
Malcolm Crosby
Forestry and Land Scotland
Richard Clarke
Forestry and Land Scotland
Sue White
Shetland Community Trust
David McGinty
SSE Renewables
Workshop attendees
Name
Organisation
Role
Andy Mills
OWC Ltd
Geomorphologist writing many PMP’s
Andy Gillan
RJ McLeod Contractors
Construction projects on peatlands
Irene Tierney
IMTECO Ltd
Ecologist writing many PMP’s
Emma Hinchliffe
IUCN UK Peatland Programme
Director
Cerian Baldwin
PeatlandACTION
Technical director involved in development, Scottish Peatland Standard and reviewing PMPs and EIAs in relation to peat
Alan Cundill
SEPA
Senior Specialist Scientist interested in reuse/management of peat
Claire Campbell
SEPA
Senior Specialist Scientist and reviewing PMP’s
Jessica Fìor-Berry
IUCN UK Peatland Programme
Peatland Programme policy lead
Karen Rentoul
NatureScot
Policy advice manager for uplands and also peatlands
Rachel Short
ScottishPower Renewables
Senior ecology manager responsible for design, construction and operation of wind farms, many on peatlands
Fiona Donaldson
SEPA
Waste policy unit interested in management of excavated peat
Grace Gubbins
NatureScot
Involved in the development of the biodiversity metric for the planning system, also supporting peatland expert advisory group
Roxane Andersen
University of Highlands and Islands
Peatland scientist, also sit on peatland expert advisory group
Chris Marshall
SLR Consulting
Peatland lead dealing with many PMP’s
Susan Nicol
Forestry and Land Scotland
Land managers leasing land for wind farms
Kirsten Lees
University of Derby
Peatland restoration with focus on carbon
Ainoa Pravia
Forest Research
Ecologist (for peatlands)
Iain Detrey
EA
Peatland adviser (for England)
Nicholle Bell
University of Edinburgh
Peatland restoration, and alternative reuse options
Kerry Dinsmore
SG
Principal science advisor on peatlands, also on steering committee
Project steering group
Ben Dipper (Scottish Government)
Kerry Dinsmore (Scottish Government)
Patricia Bruneau (Nature Scot)
Scottish Government policy team representatives
Appendix C Wind Farm Site Research (site visits & desk research)
Wind farm planning document review
This section reviews the desk-based research describing existing wind farms management plans including data on numbers of wind farms across Scotland on peat soils.
Wind farm site visit summary
This section combines the results of the desk-based research describing existing wind farm management plans alongside the information gathered during the site visits. We aimed to visit a diverse range of sites with reasonable access where we would be able to observe a range of different types and ages of reuse of excavated peat. We chose to include sites in different locations, the north-east and south-west of Scotland. In both areas we visited a newly constructed wind farm, alongside older wind farms within the same locality. This provided examples with different vegetation colonisation rates which could influence the success of reuse methods. We contacted several wind farmer developers / operators, the final selection of sites for visit was based on who was willing to host a visit and practical feasibility in the project timescale and available resources.
Desk-based findings
We reviewed the planning information prior to site visits. This included information on when the work was completed / site commissioned to generate energy, the number of turbines that had been built (both initially and in phased extensions), land ownership and whether other stakeholder were involved in the process (e.g. wildlife rangers based on site, ECoW’s).
Sample site selection
Site selection was undertaken taking into account key variables to ensure that a representative sample of wind farms across Scotland was obtained. Primarily, this included considering a range of development site sizes and locations across Scotland, while ensuring that wind farms were both operational and included relevant Peat Management Plans (PMPs). To note, the number of wind turbines was used as a proxy for development size, while the requirement for developments to have PMPs significantly reduced availability of case studies (even though this is an NPF4 requirement).
Peatland management plans
The key limitations in the approach concerned the accuracy of the data held within the PMPs, for which accessing documents with the requisite information (peat depths and volumes) was the first challenge. In those PMPs that were available, the peat volumes were based on peat survey depths, which are extrapolated across sites via peat probe information, meaning that there is a degree of uncertainty between distinct probe points. There is therefore a high degree of mathematical assumption based on converting peat depth extrapolations to volumes via combining this data with site stripping boundaries. Utilising survey information also assumes competence of all surveyors, despite peat surveys (and peat identification more generally) being a highly specialist skill that geo-environmentalists, geotechnical specialists and even soil scientists would not necessarily have experience of. In addition, peat volumes included in PMPs can change during the construction phase, such as where design is updated, or due to poor implementation of PMP measures. This means that volumes at project inception are often unlikely to be the same once wind farms are conducted, given the dynamic nature of the construction phase and typically iterative design approaches.
Overview of key finding from site visits
Key highlights are included in the main section 3.5.2, 3.5.3 and 3.5.4. A number of borrow pits were visited at each of the sites – these varied in effectivity, levels of monitoring and time since reinstatement. Landscaping examples where peat had been put down along the roadside were clearly visible in the newly constructed wind farms, in the older wind farms this was less obvious, in some cases the peat had become part of the surrounding peatland, however the likelihood was that in some areas it had been lost to the wider environment through erosion. Novel restoration reuse was seen, this was experimental and not common practice. No peat was taken off-site for reuse elsewhere.
Limitations of site visits
Although we were very grateful to the stakeholders for taking the time to show us the wind farms and distil their knowledge of the process, it was clear that this view was only able to provide a snapshot in time analysis of what had occurred at that site. Also depending on time from commissioning, some key details related to the reuse of peat were lost (e.g. exact volumes of peat used within infill of peat excavations, how borrow pit reinstatements were originally designed). Thus, it is harder to identify best practice and what has worked and what hasn’t if the methodology is unreported. The site visits could have been impacted by the weather conditions on the day (e.g. low cloud and drizzle for the final site visit), this made note taking and photographing examples harder and some of the finer details may not be visible in the photographs.
How to cite this publication:
Crotty, F., Dowson, F., Schofield, K., Barker, M., Ginns, B., David, T., Herold, L. (2025) ‘Reuse of excavated peat on wind farm development sites’, ClimateXChange. DOI: http://dx.doi.org/10.7488/era/6333
While every effort is made to ensure the information in this report is accurate as at the date of the report, no legal responsibility is accepted for any errors, omissions or misleading statements. The views expressed represent those of the author(s), and do not necessarily represent those of the host institutions or funders.
This work was supported by the Rural and Environment Science and Analytical Services Division of the Scottish Government (CoE – CXC).
Scottish Renewables, Scottish Environment Protection Agency. 2012. Guidance on the Assessment of Peat Volumes, Reuse of Excavated Peat and the Minimisation of Waste ↑
Micro-siting is where small adjustments to the wind farm lay out are made to avoid / minimise damage to peat (or other sensitive environments) on site. ↑

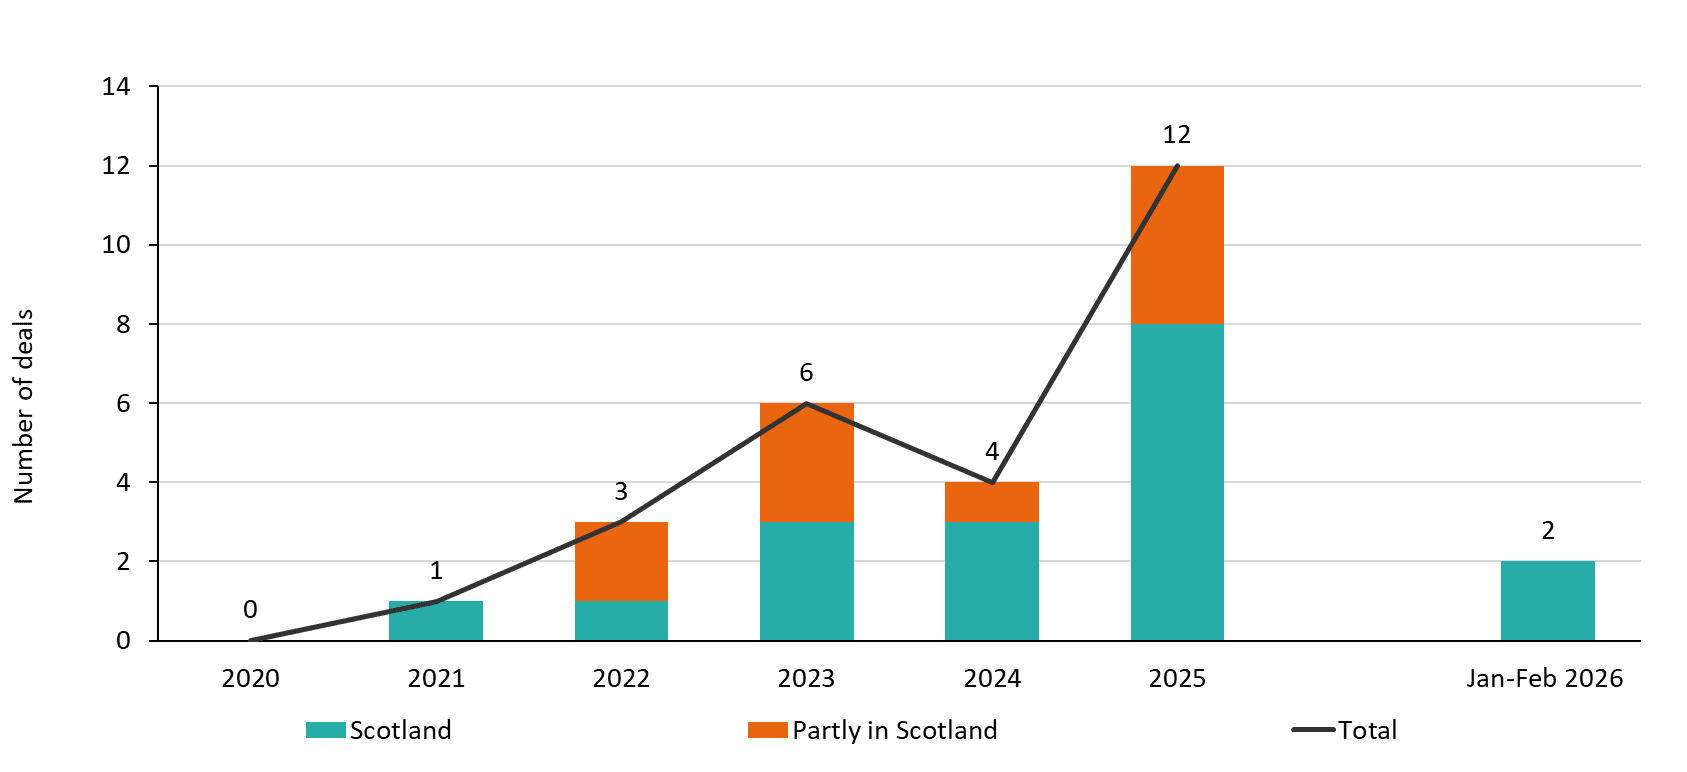
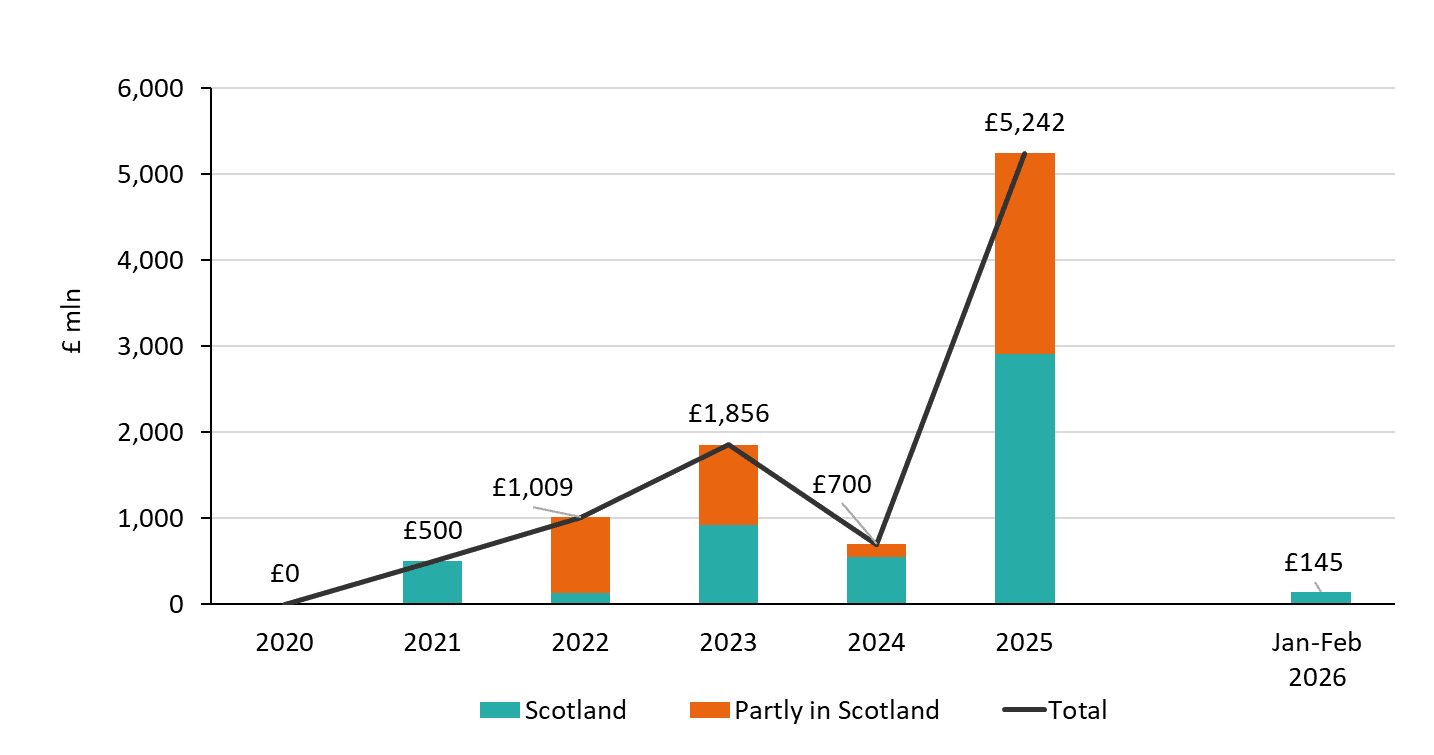
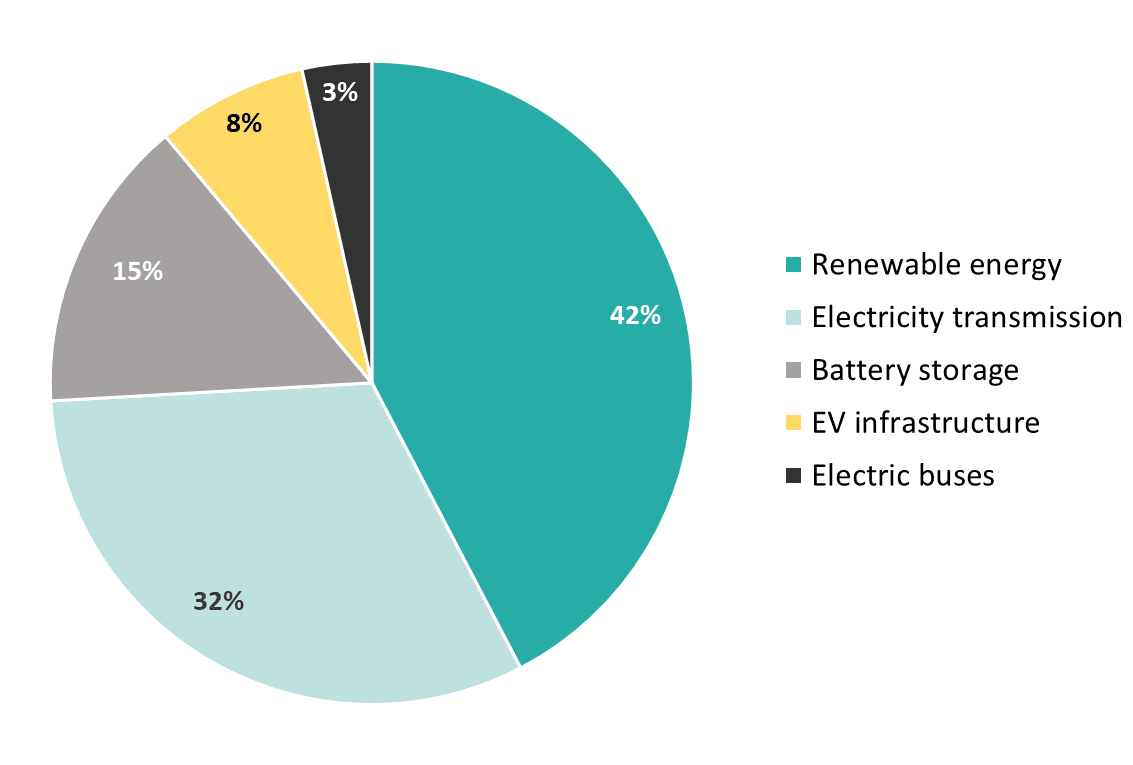
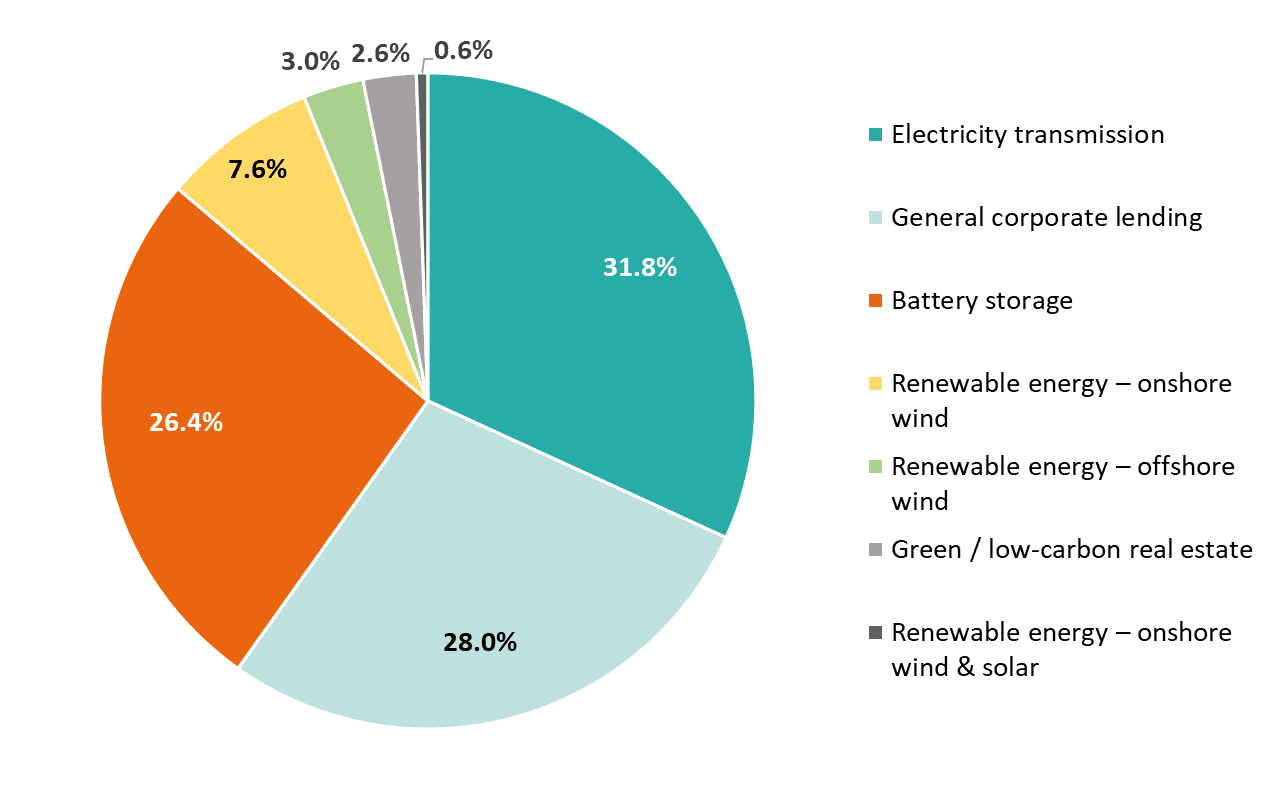 Figure 4. Deals fully located in Scotland – percentage of the total amount per sector, 2020-2026 – loans, bonds, equity
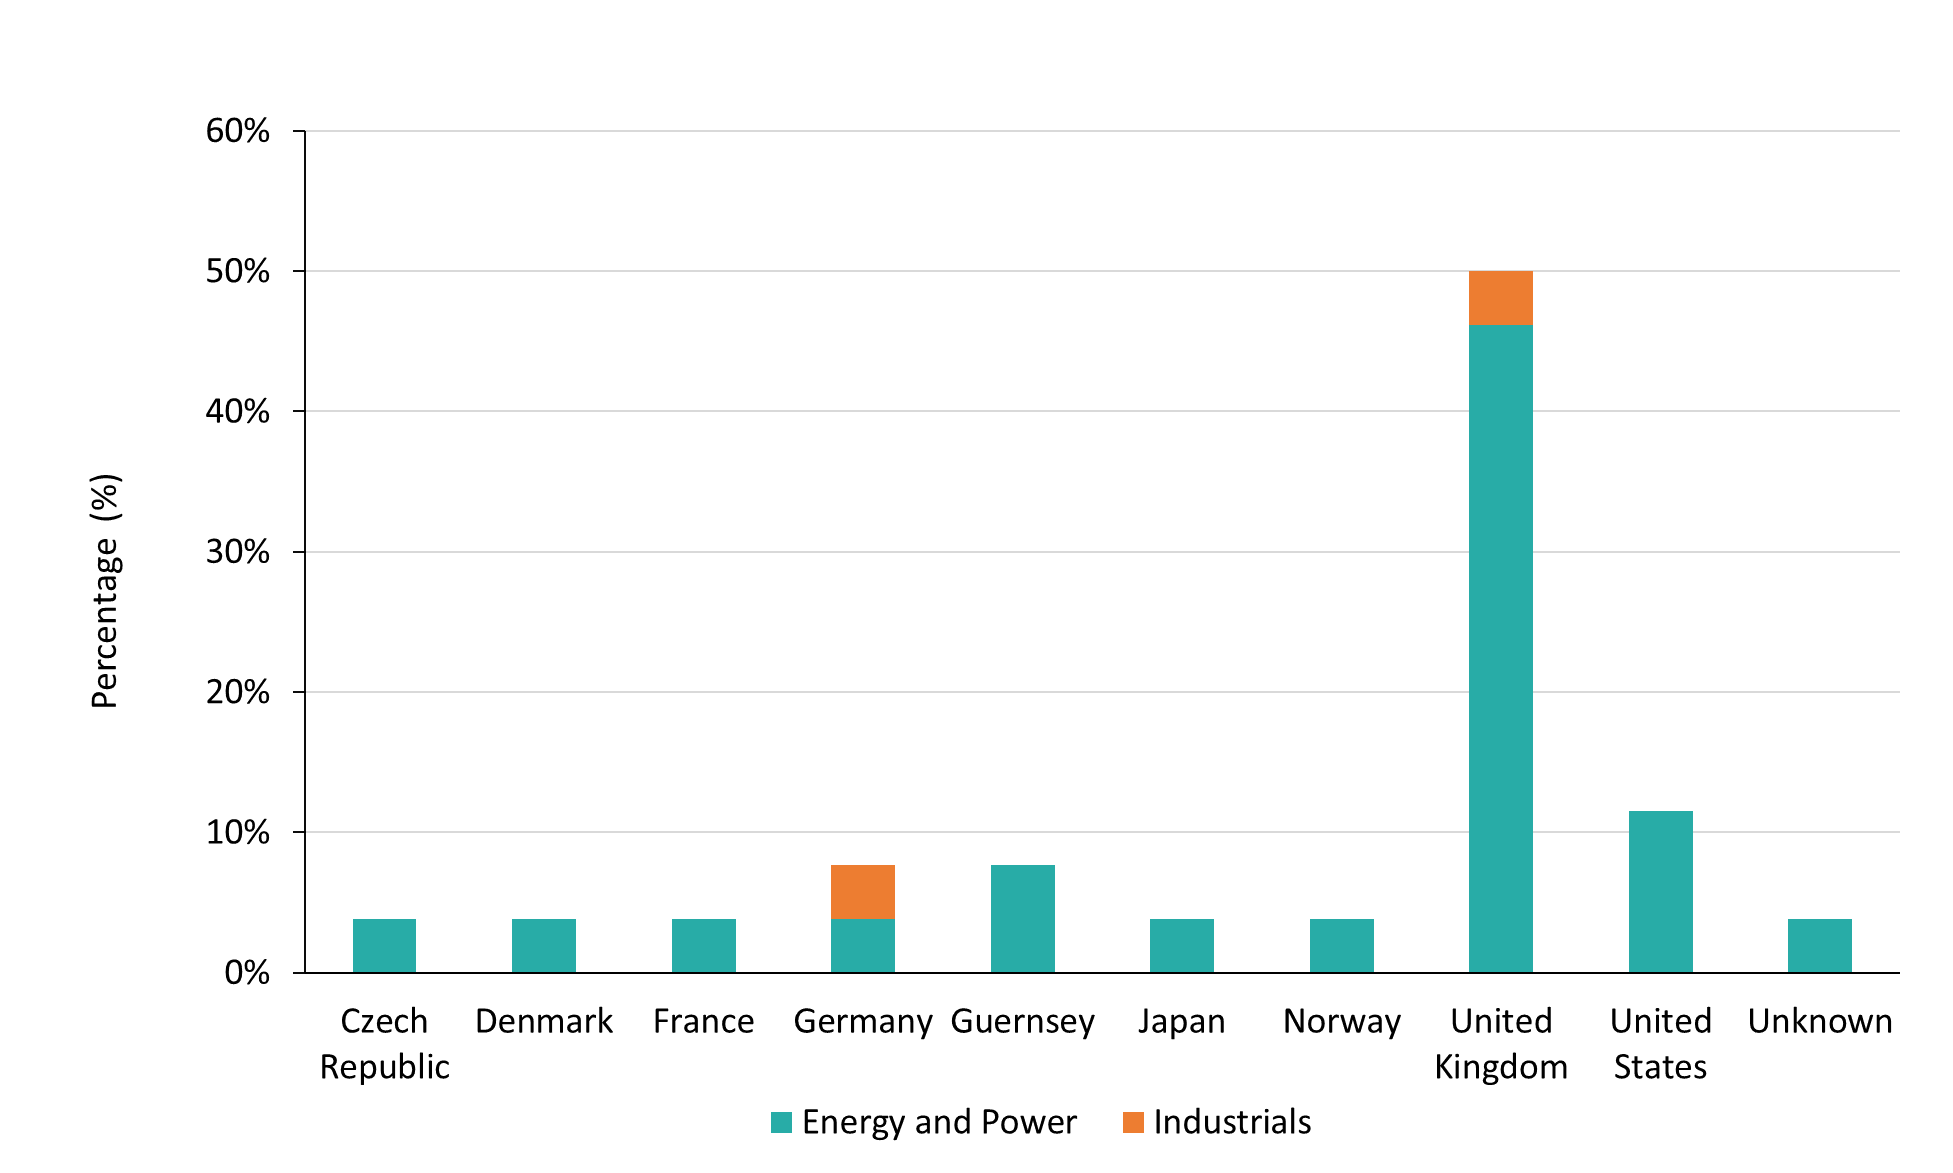
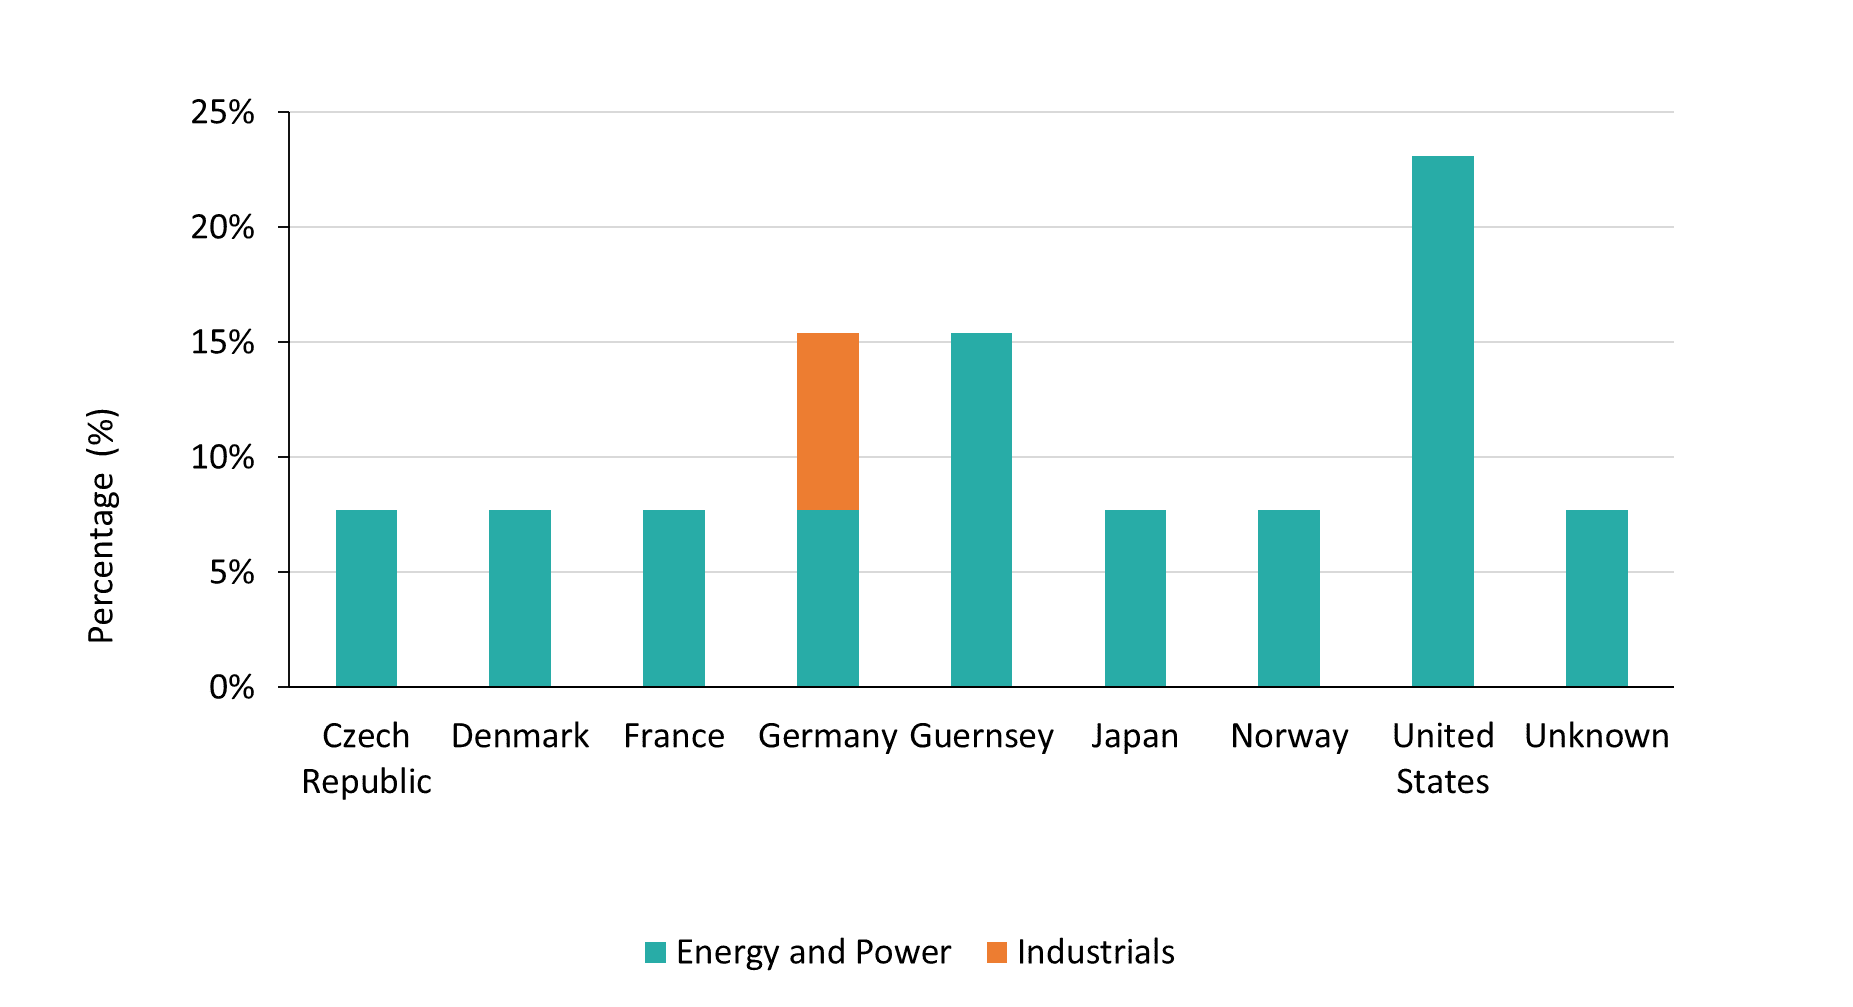
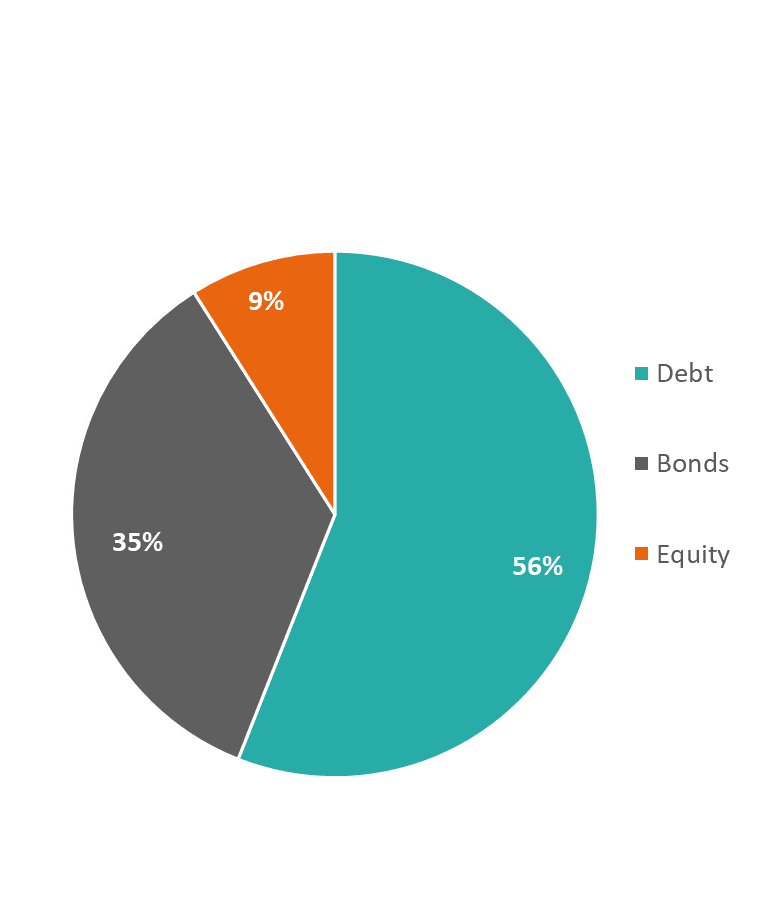
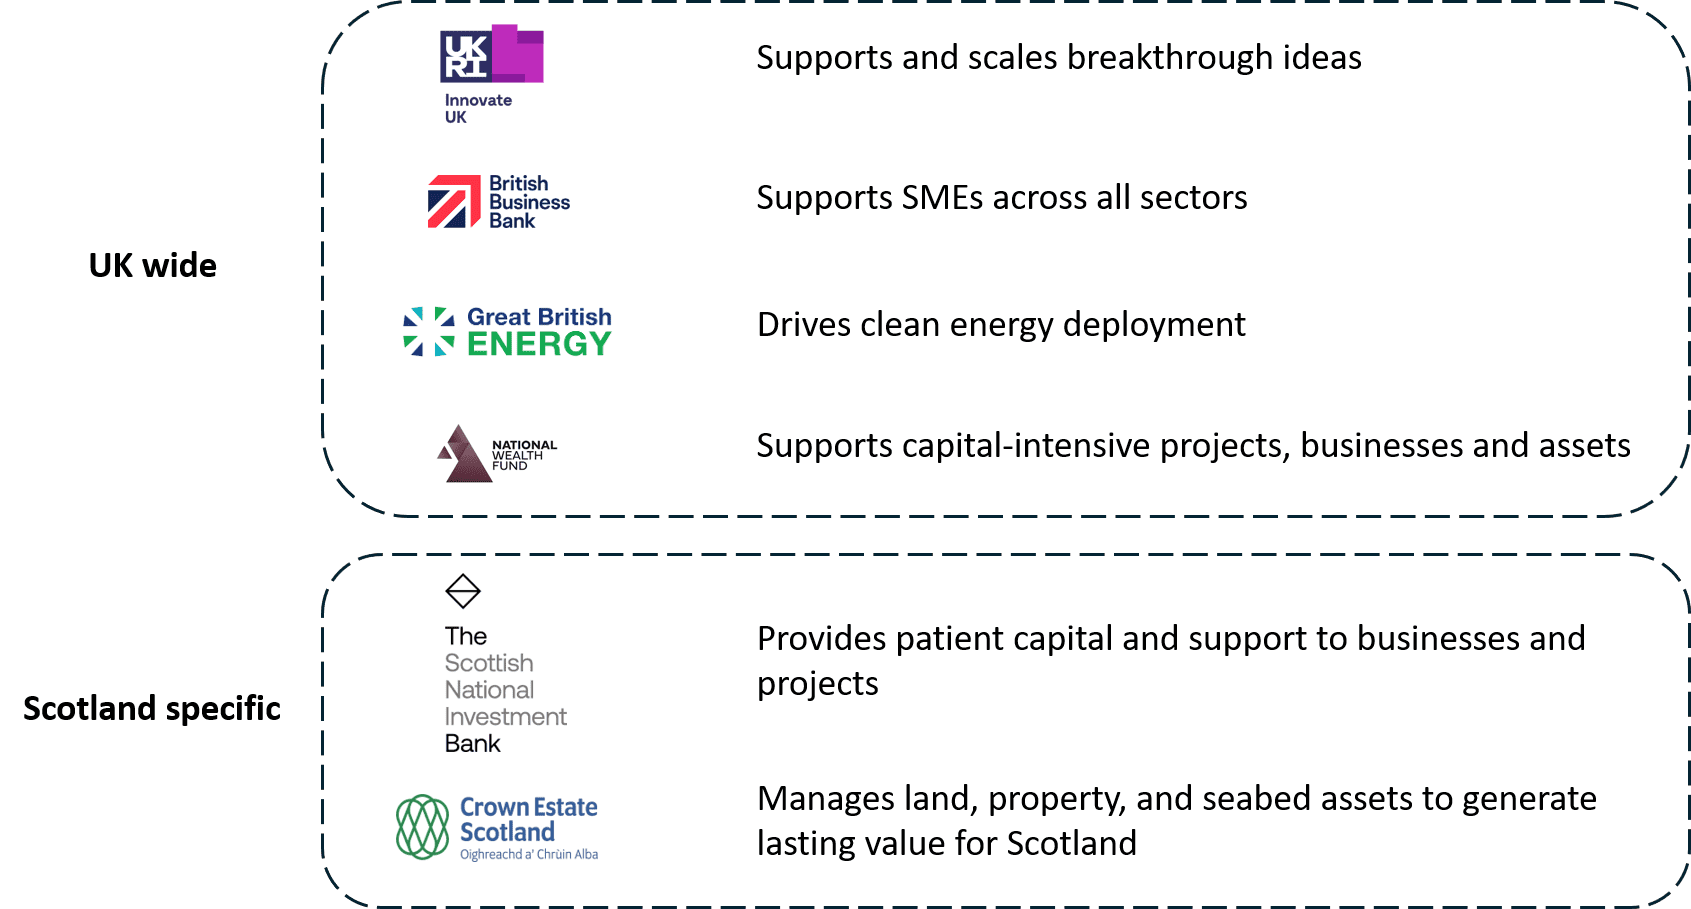
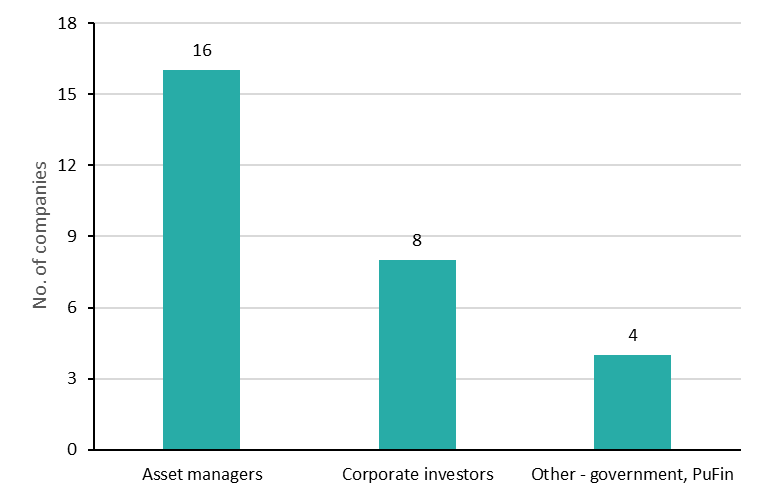
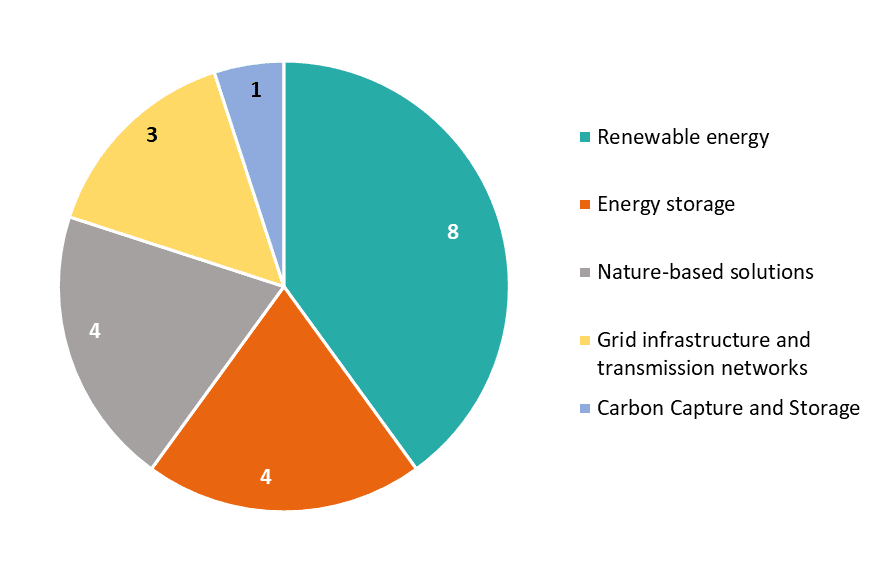
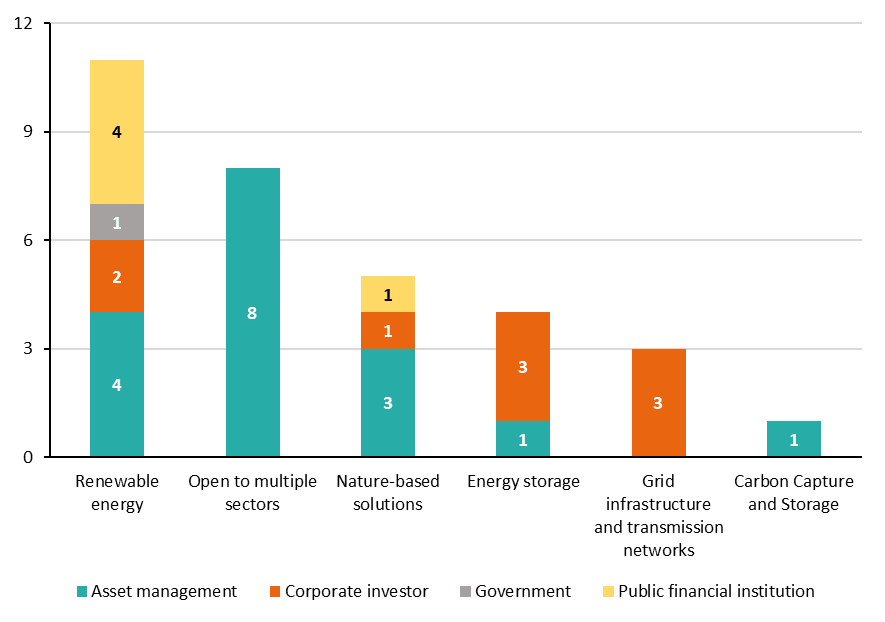
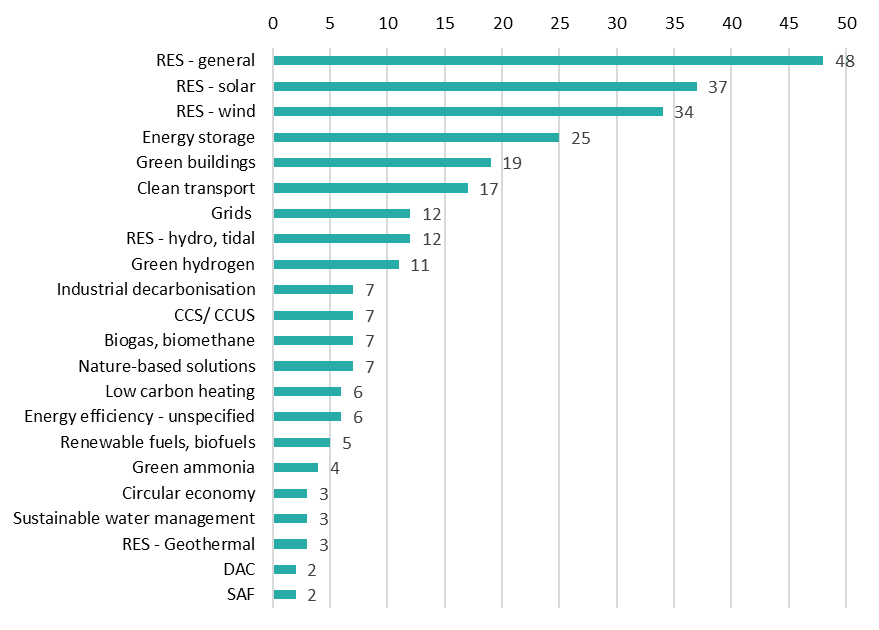
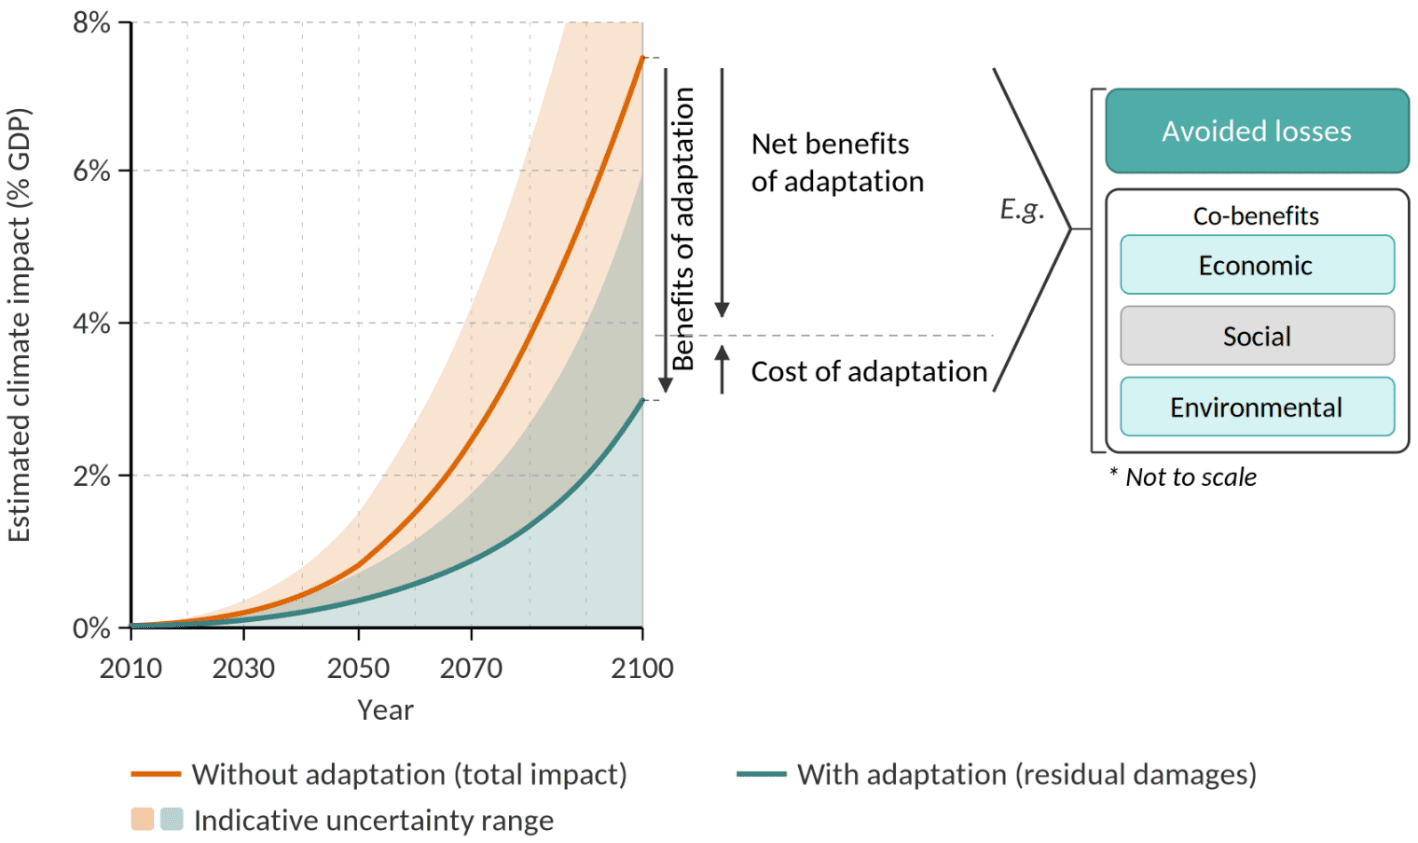
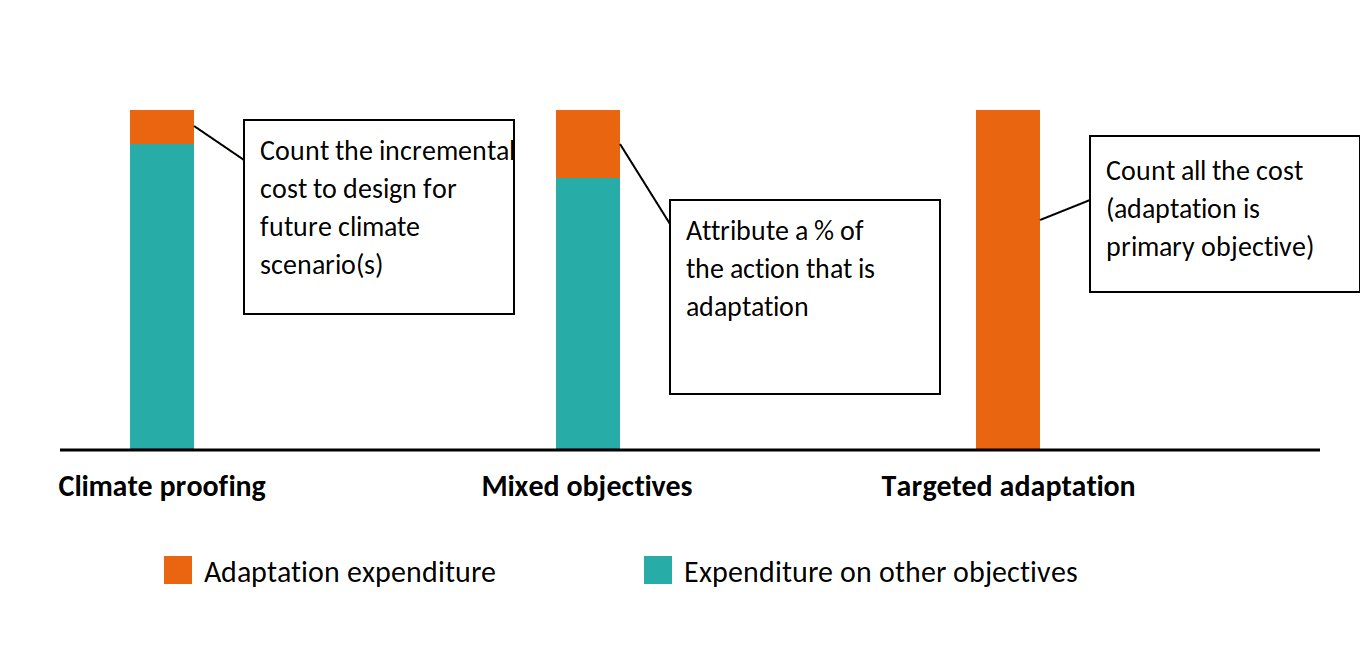
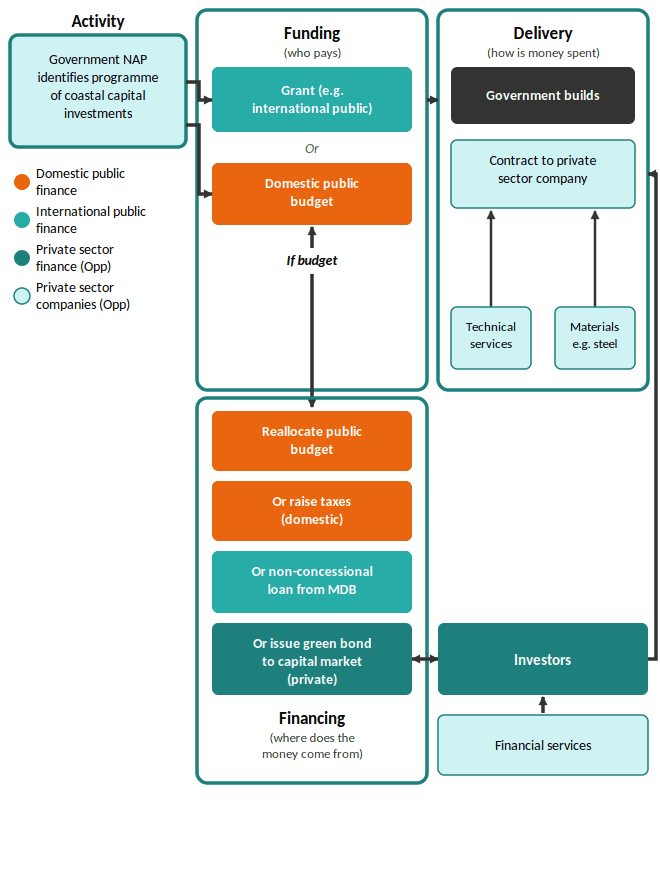
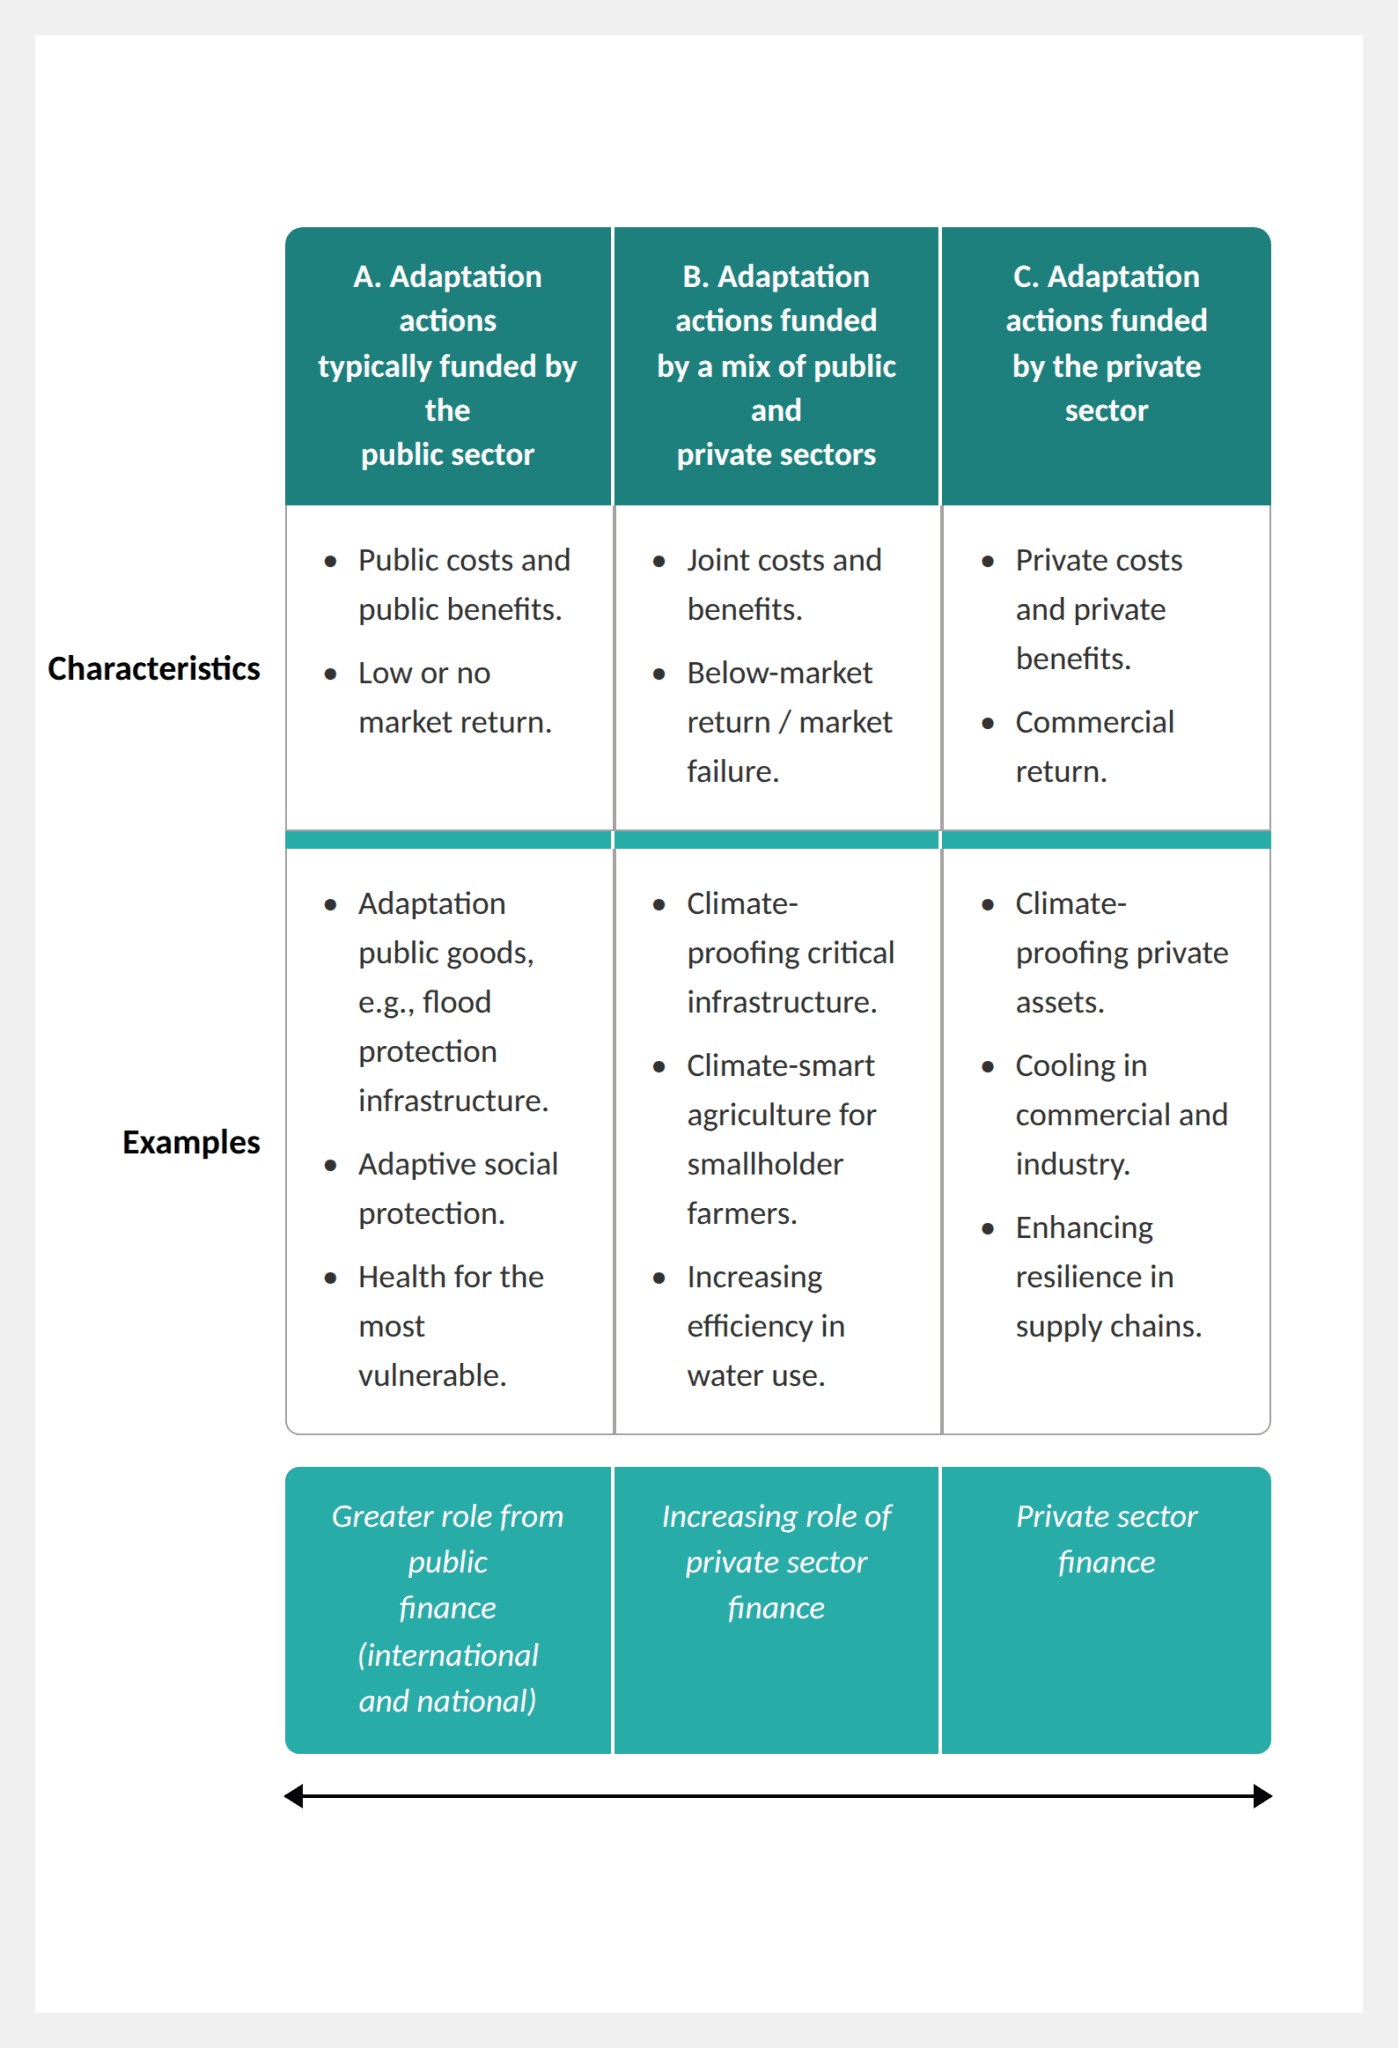
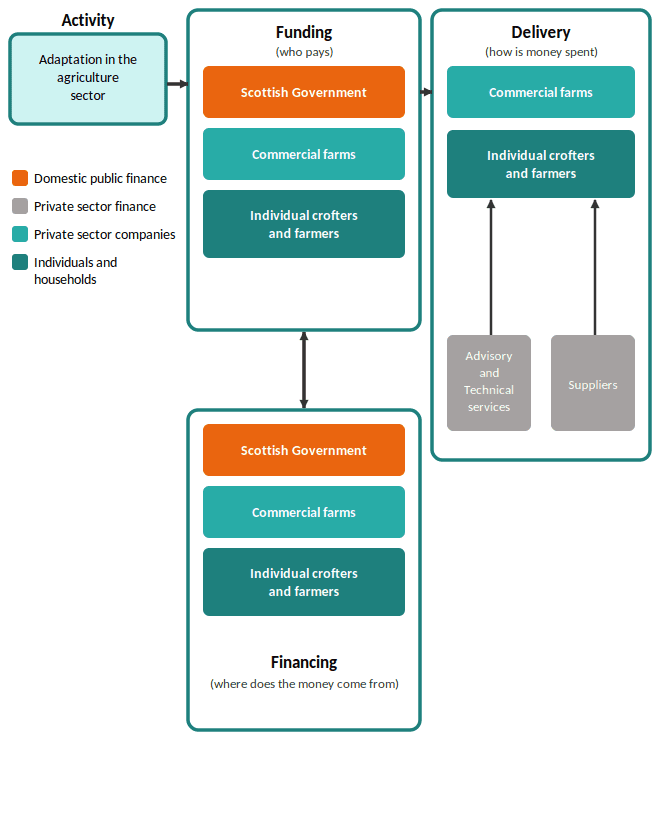

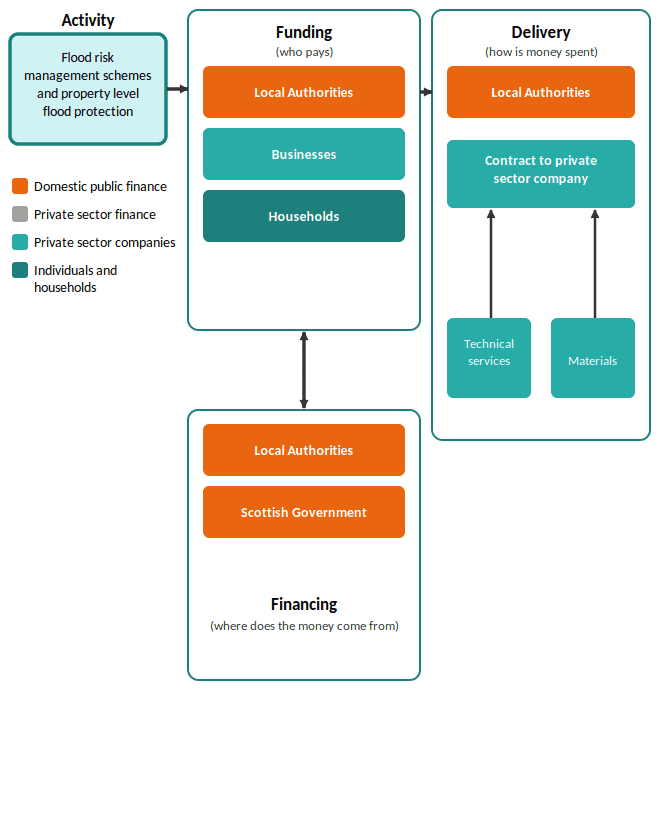
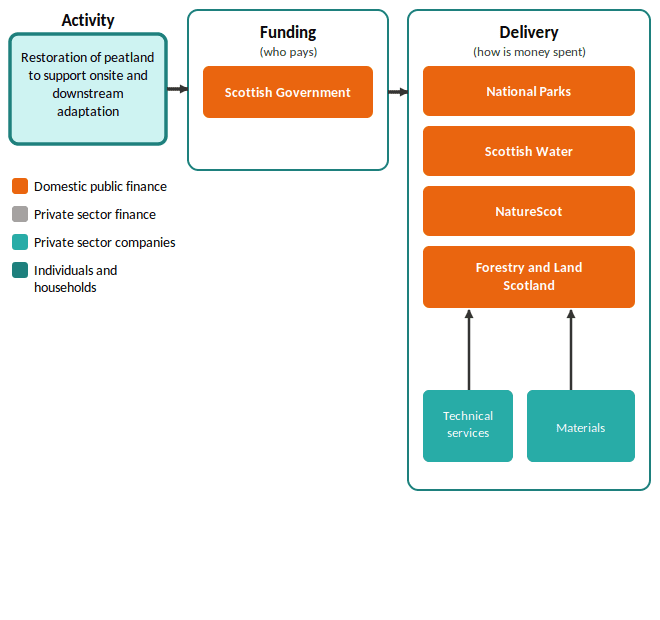
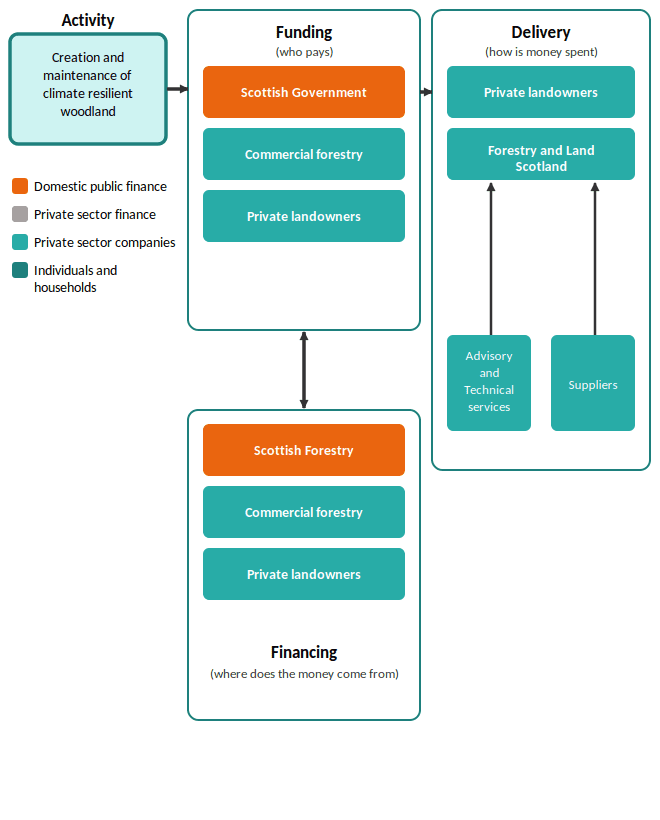
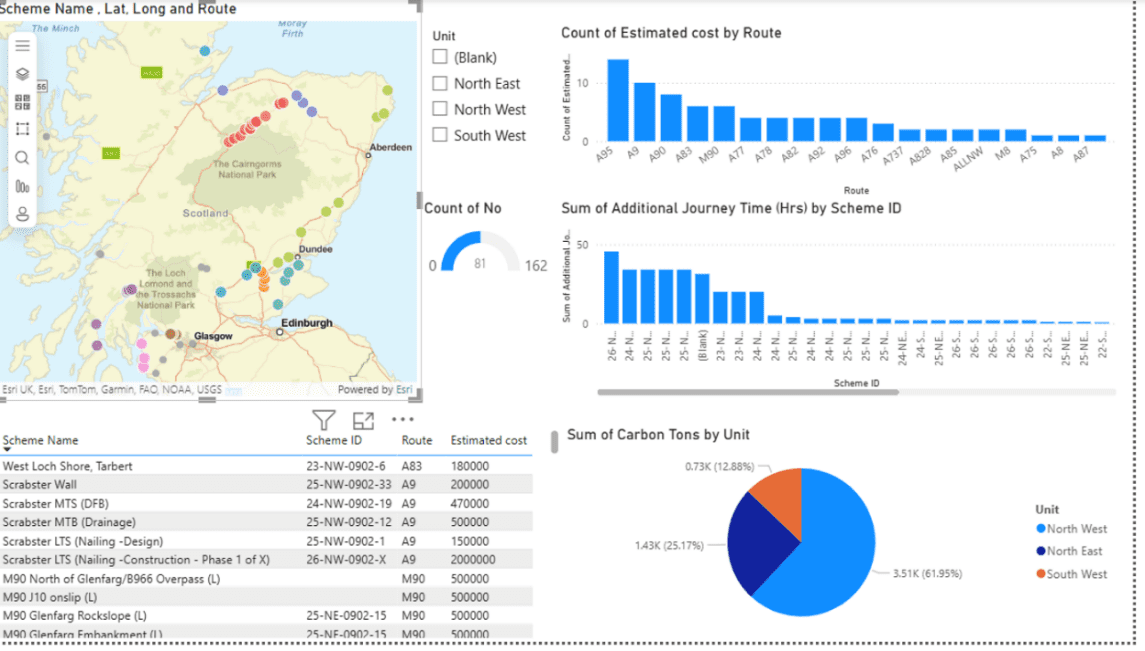

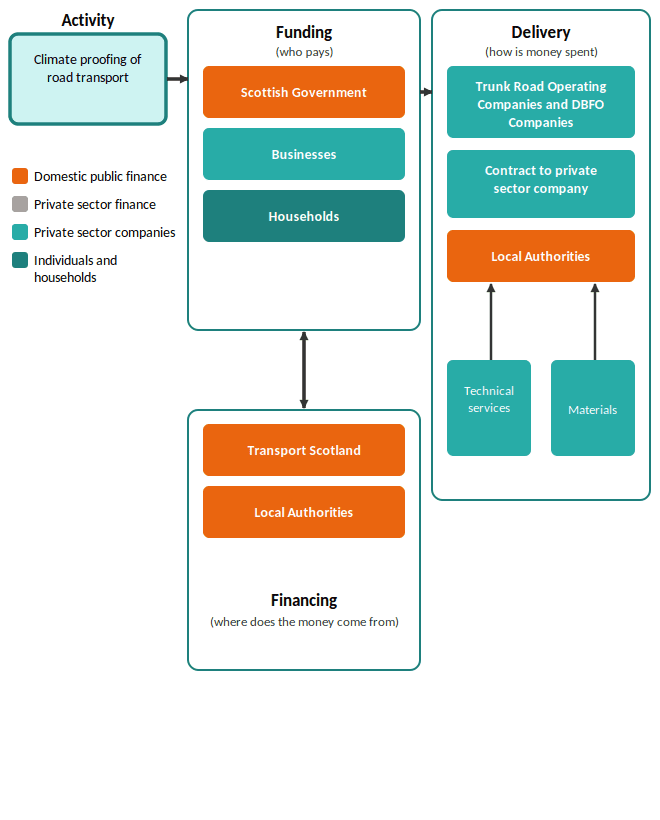
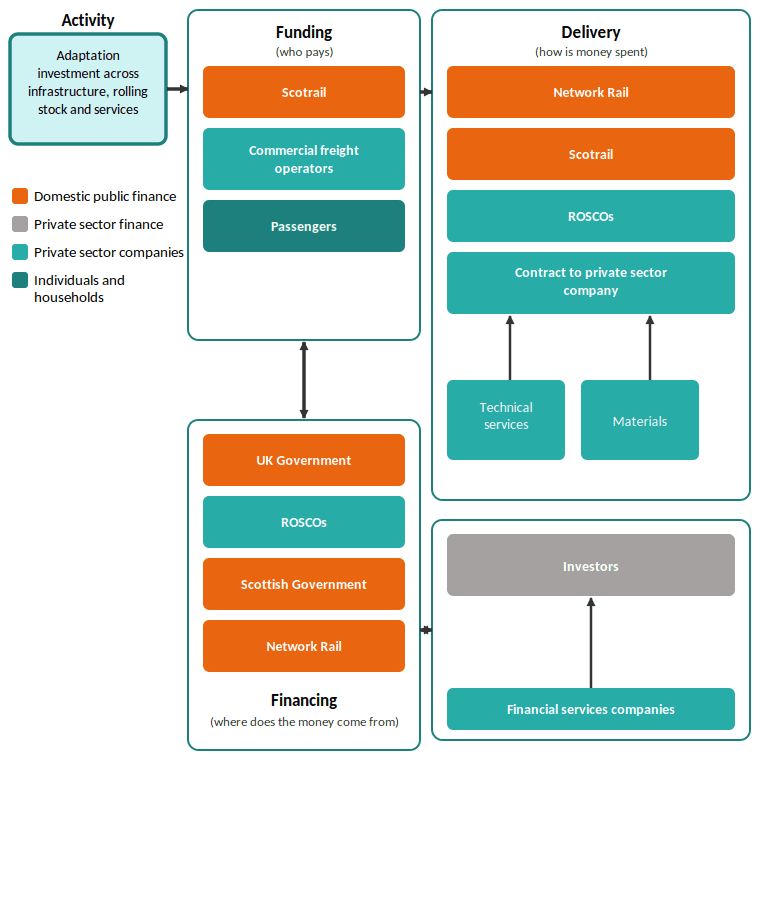

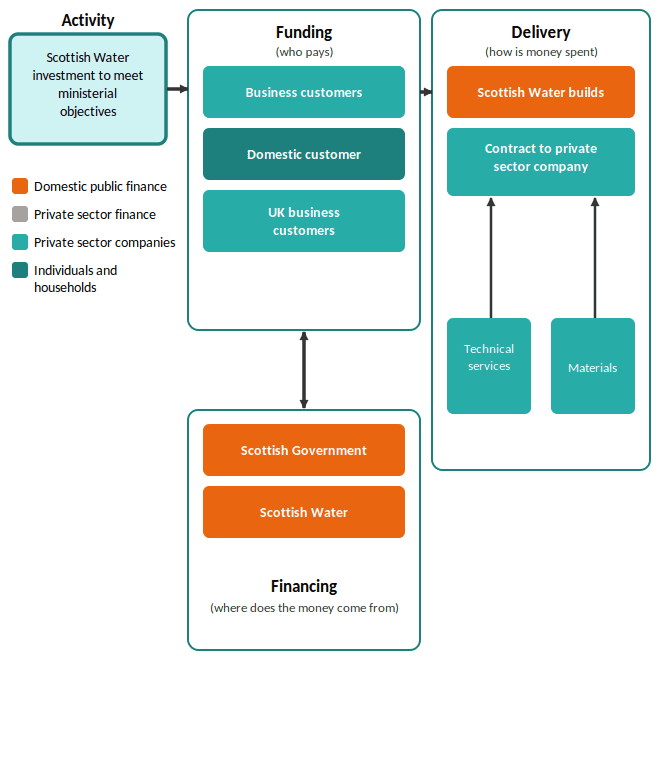
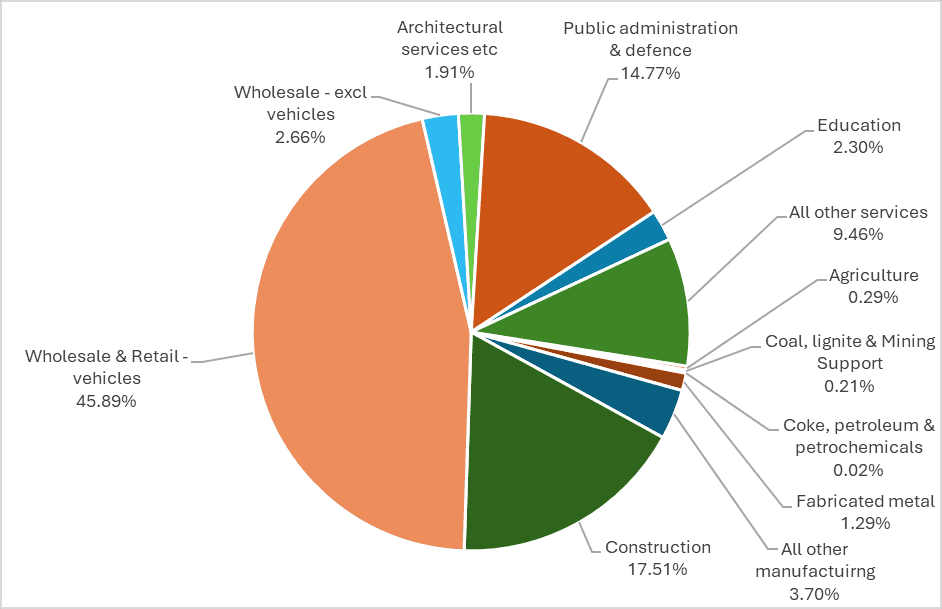 Figure D1. Breakdown of ‘Rail transportation’ adaptation spending
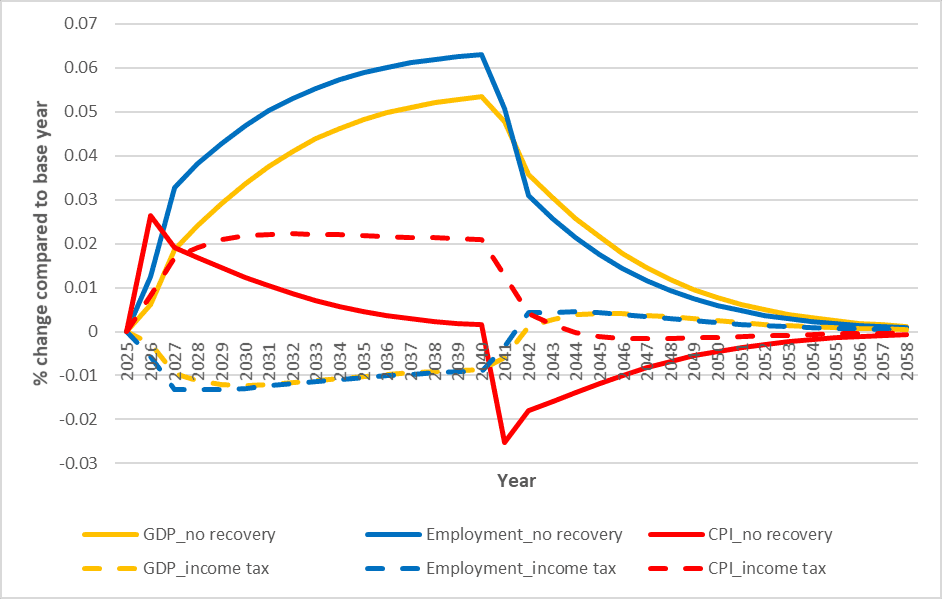
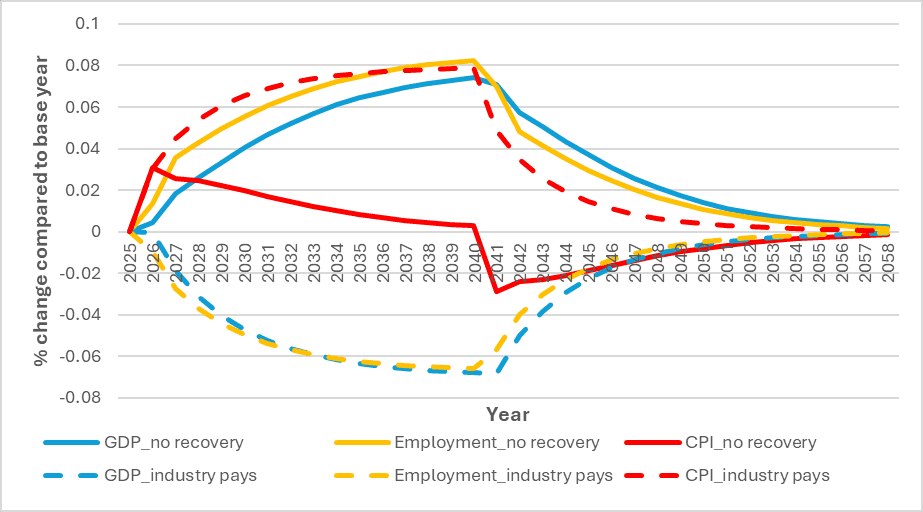
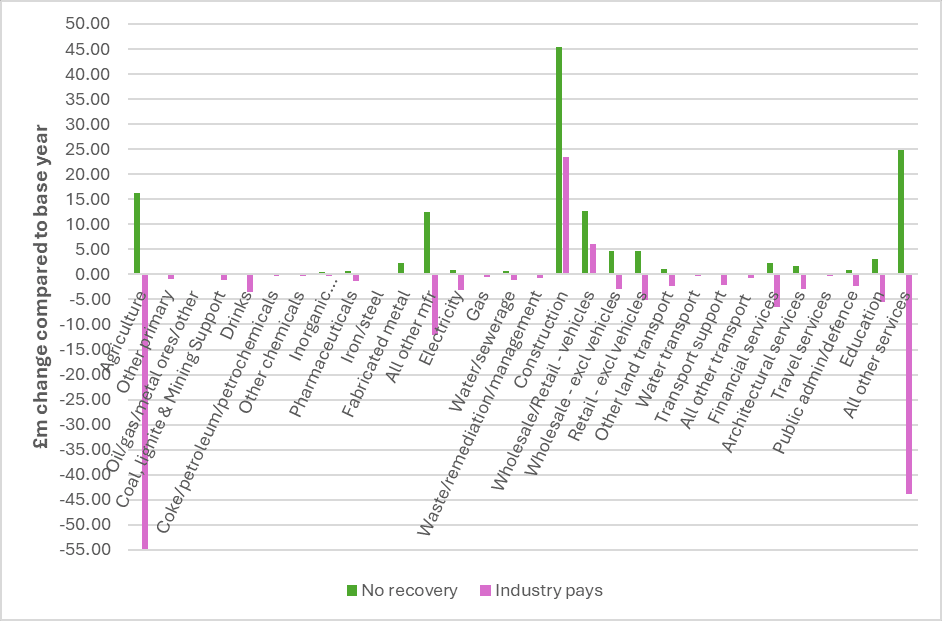
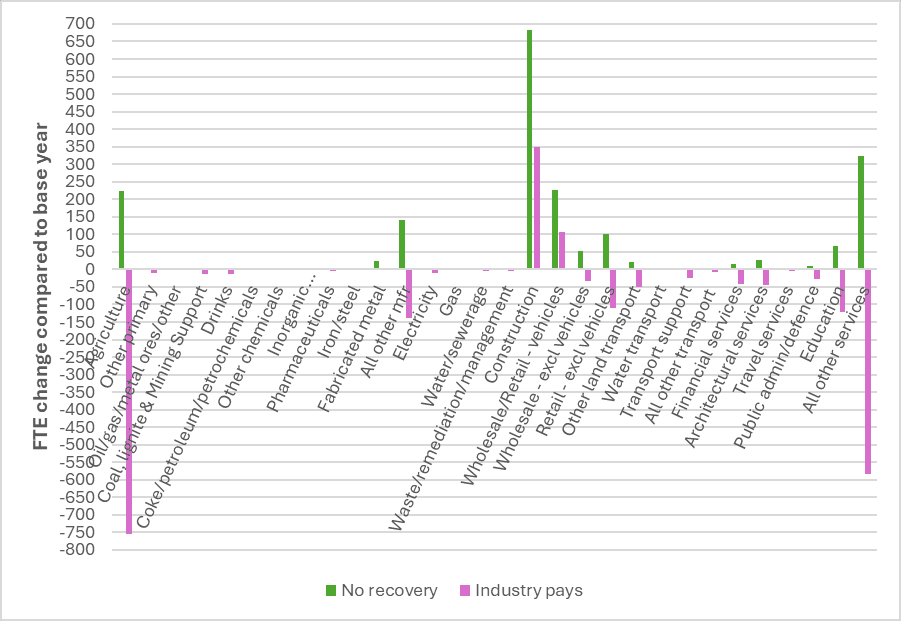
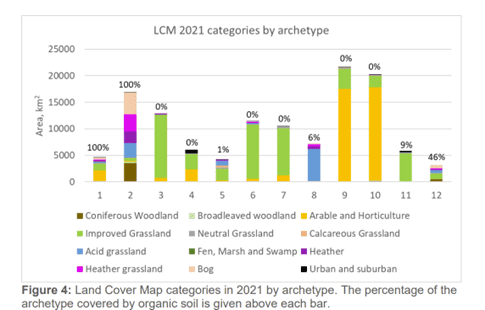
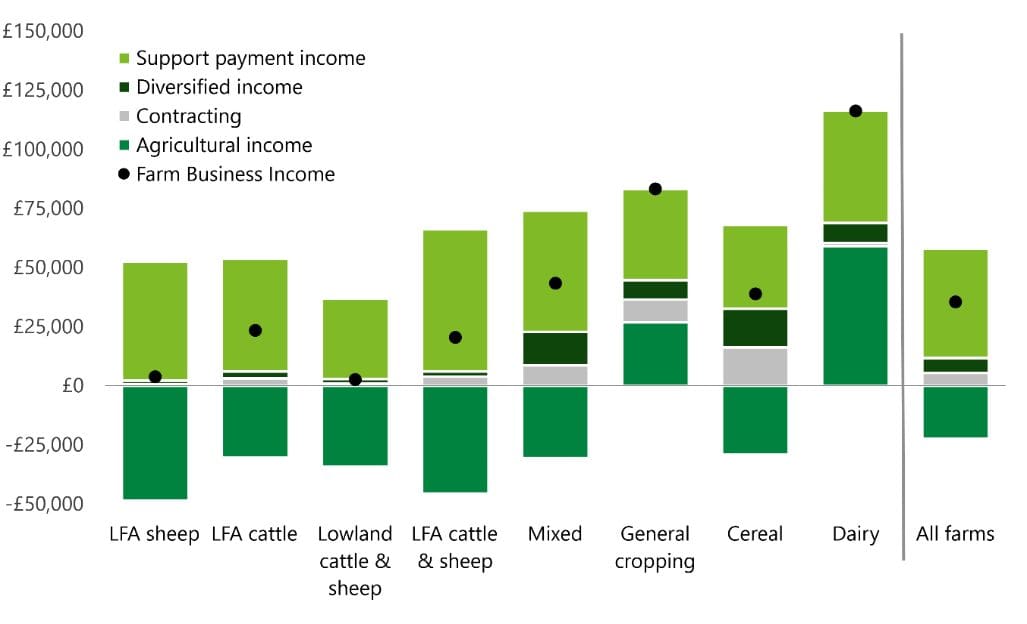
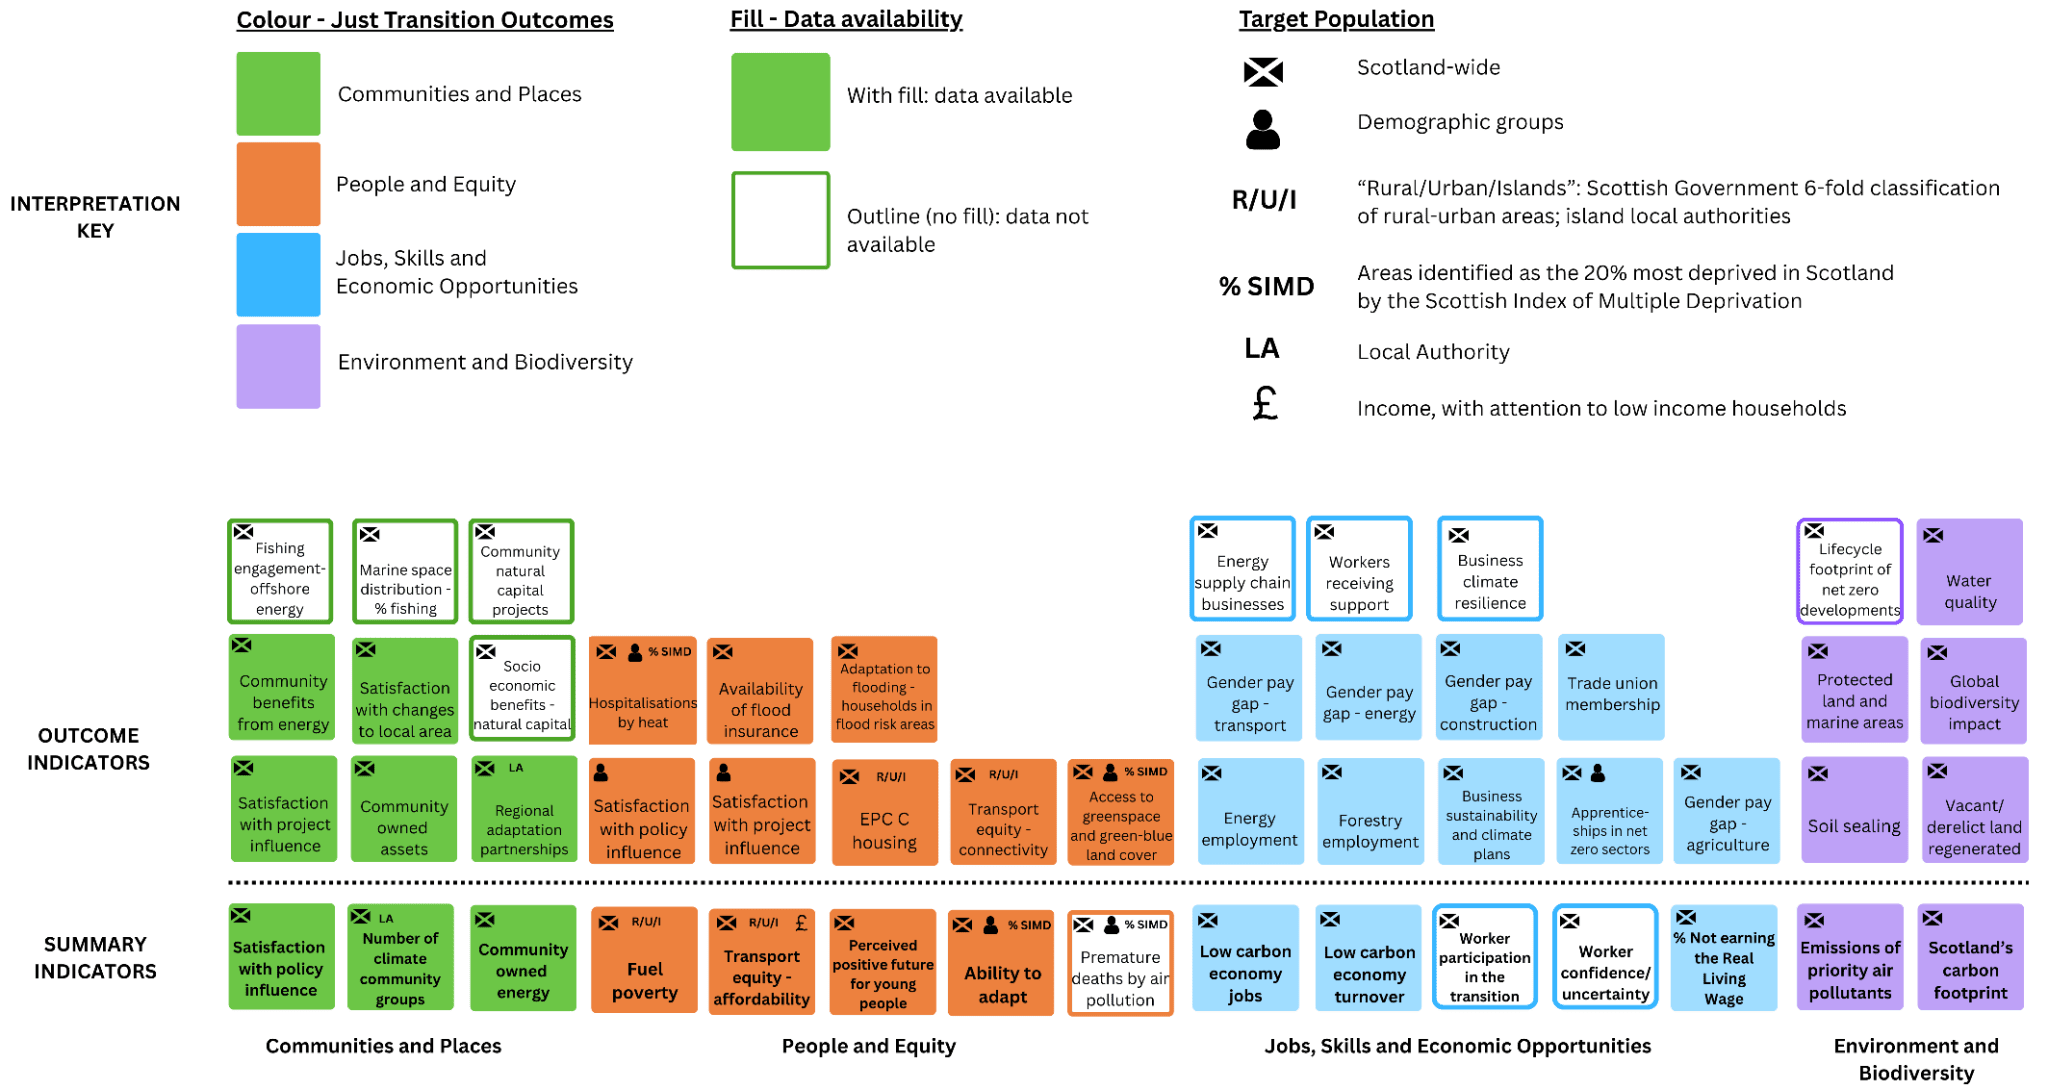
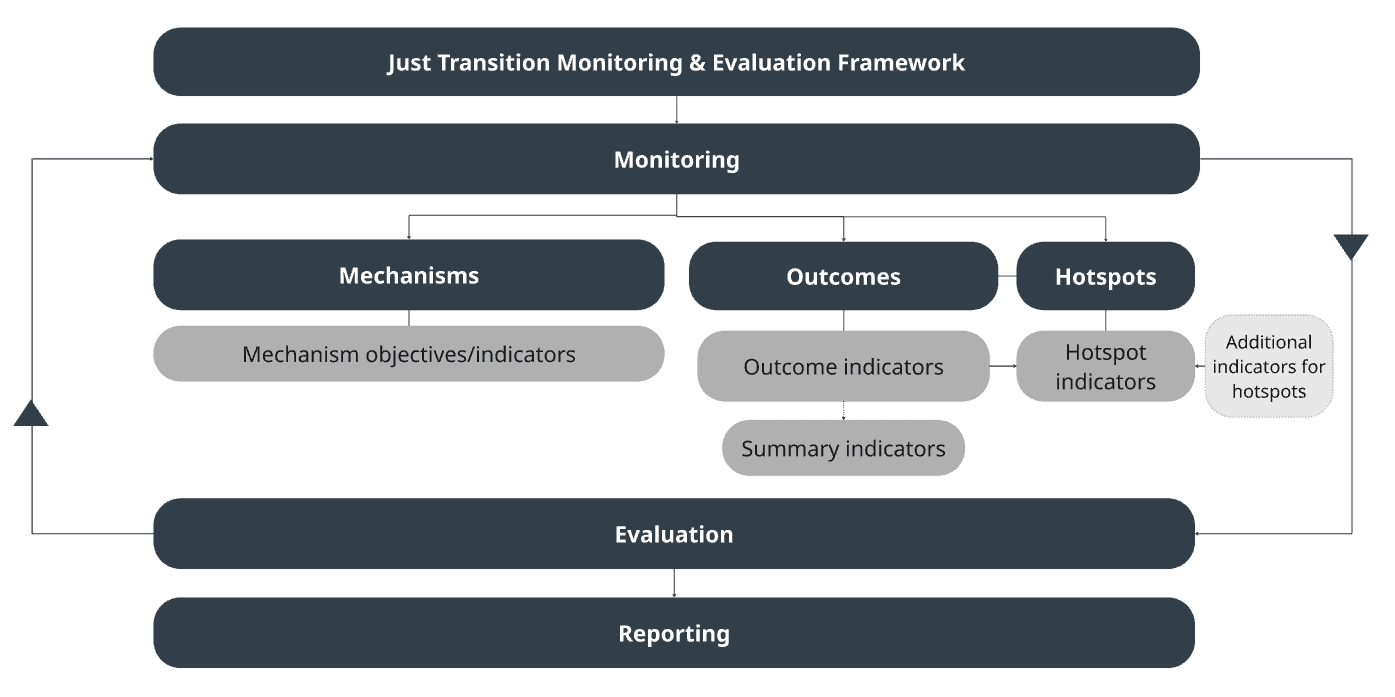
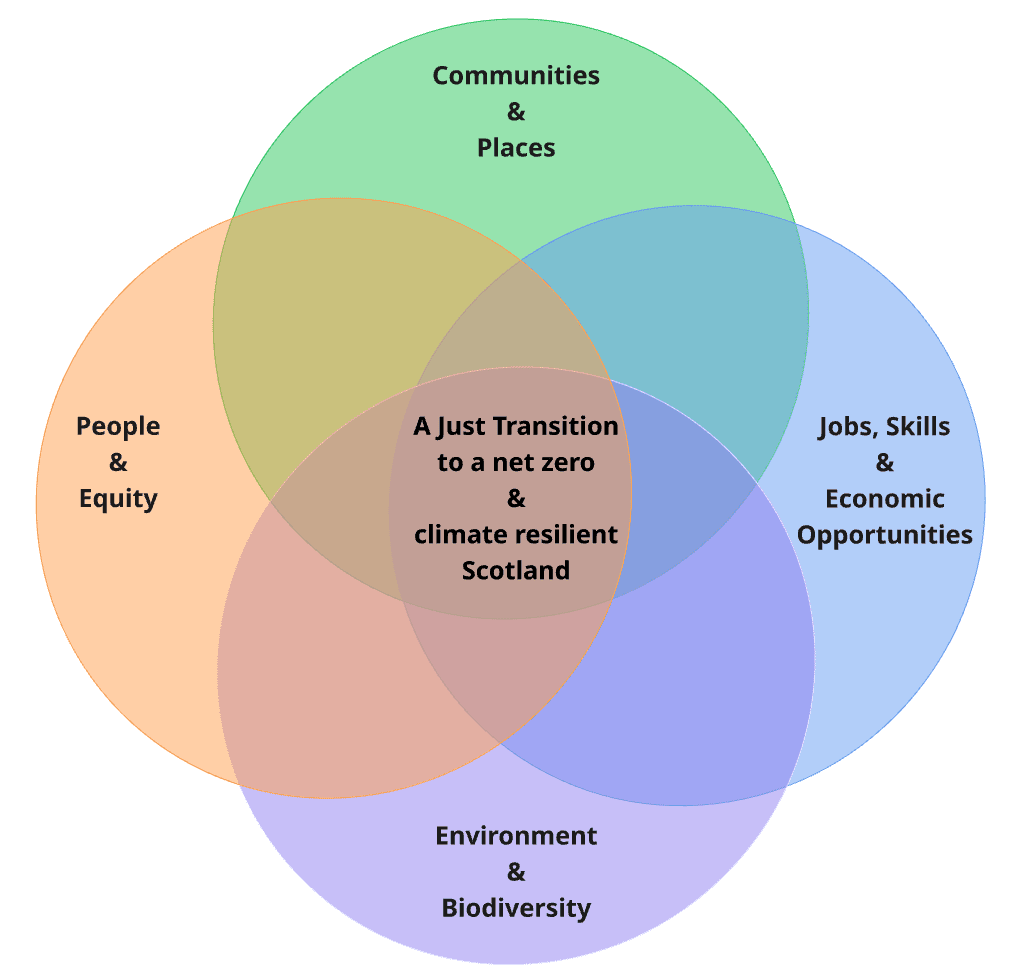

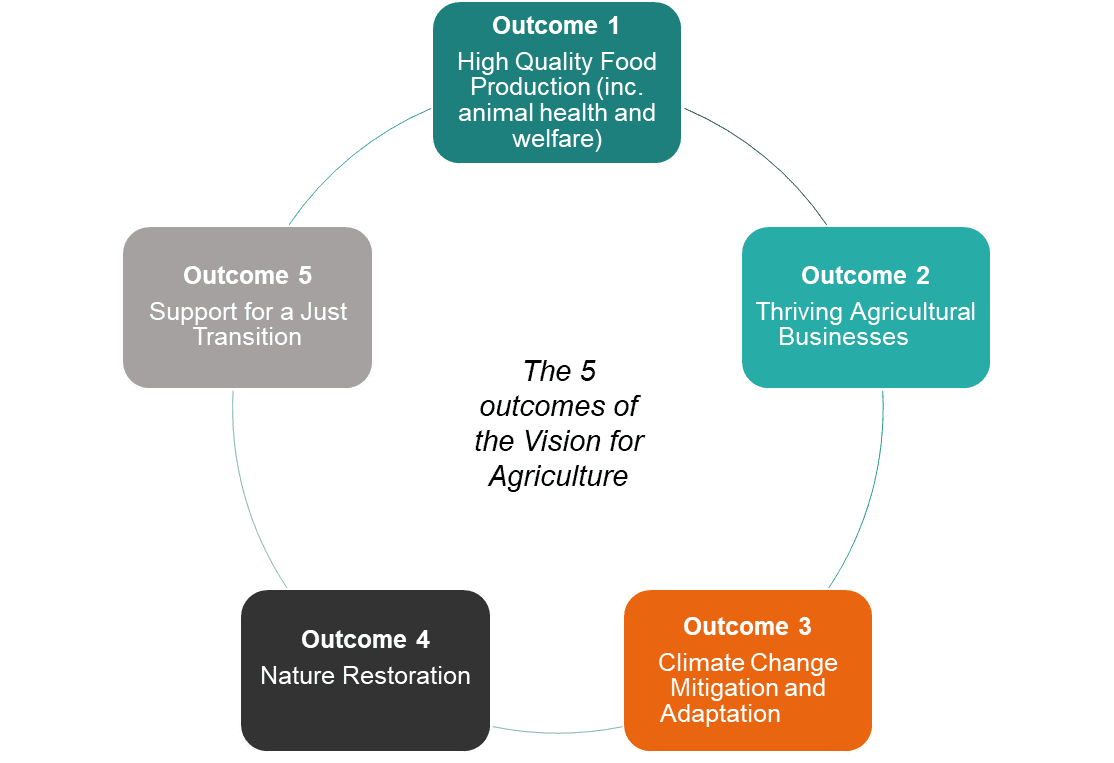
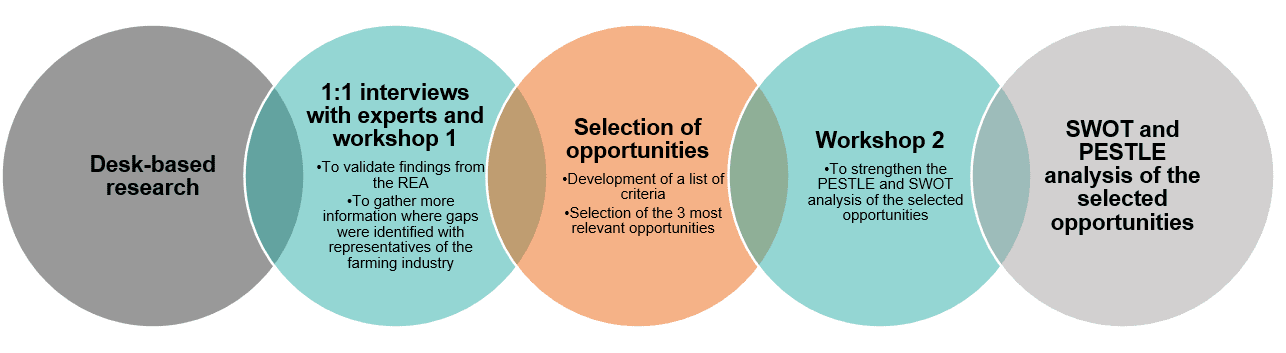
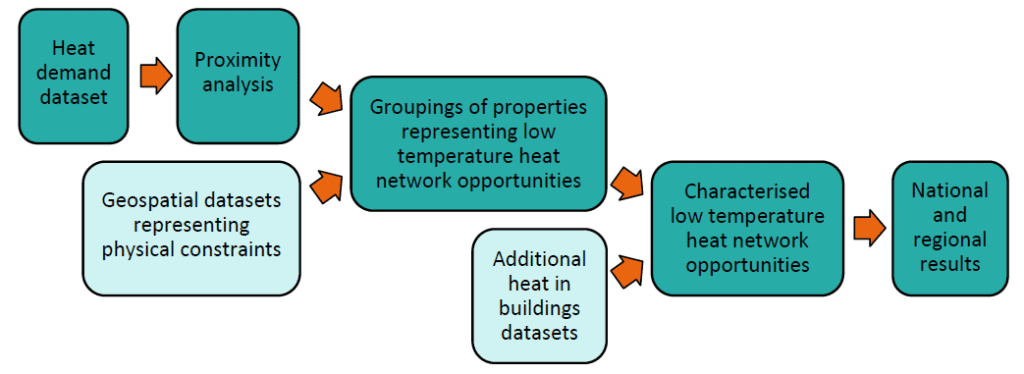
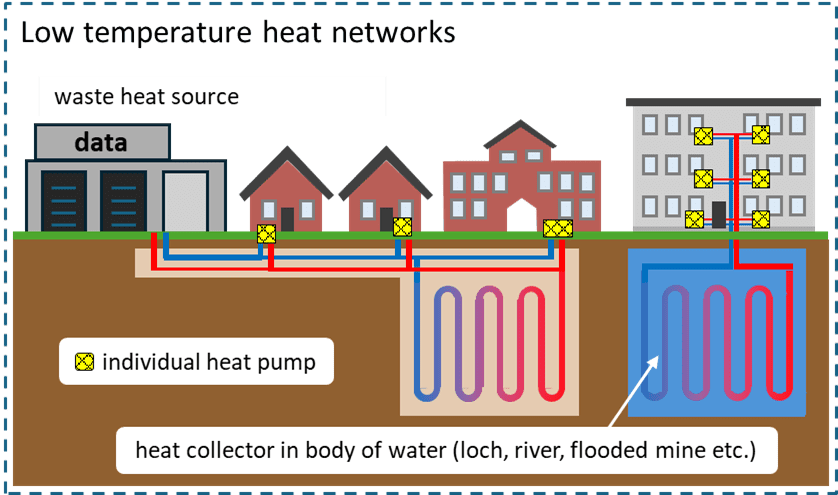
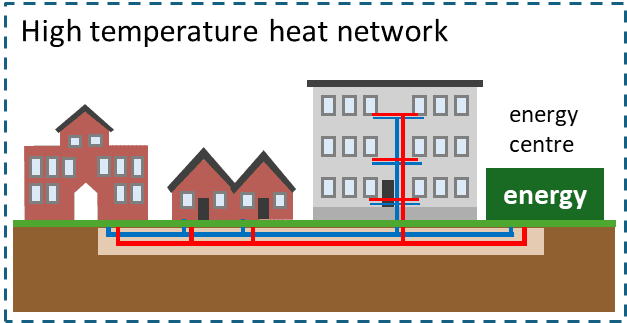

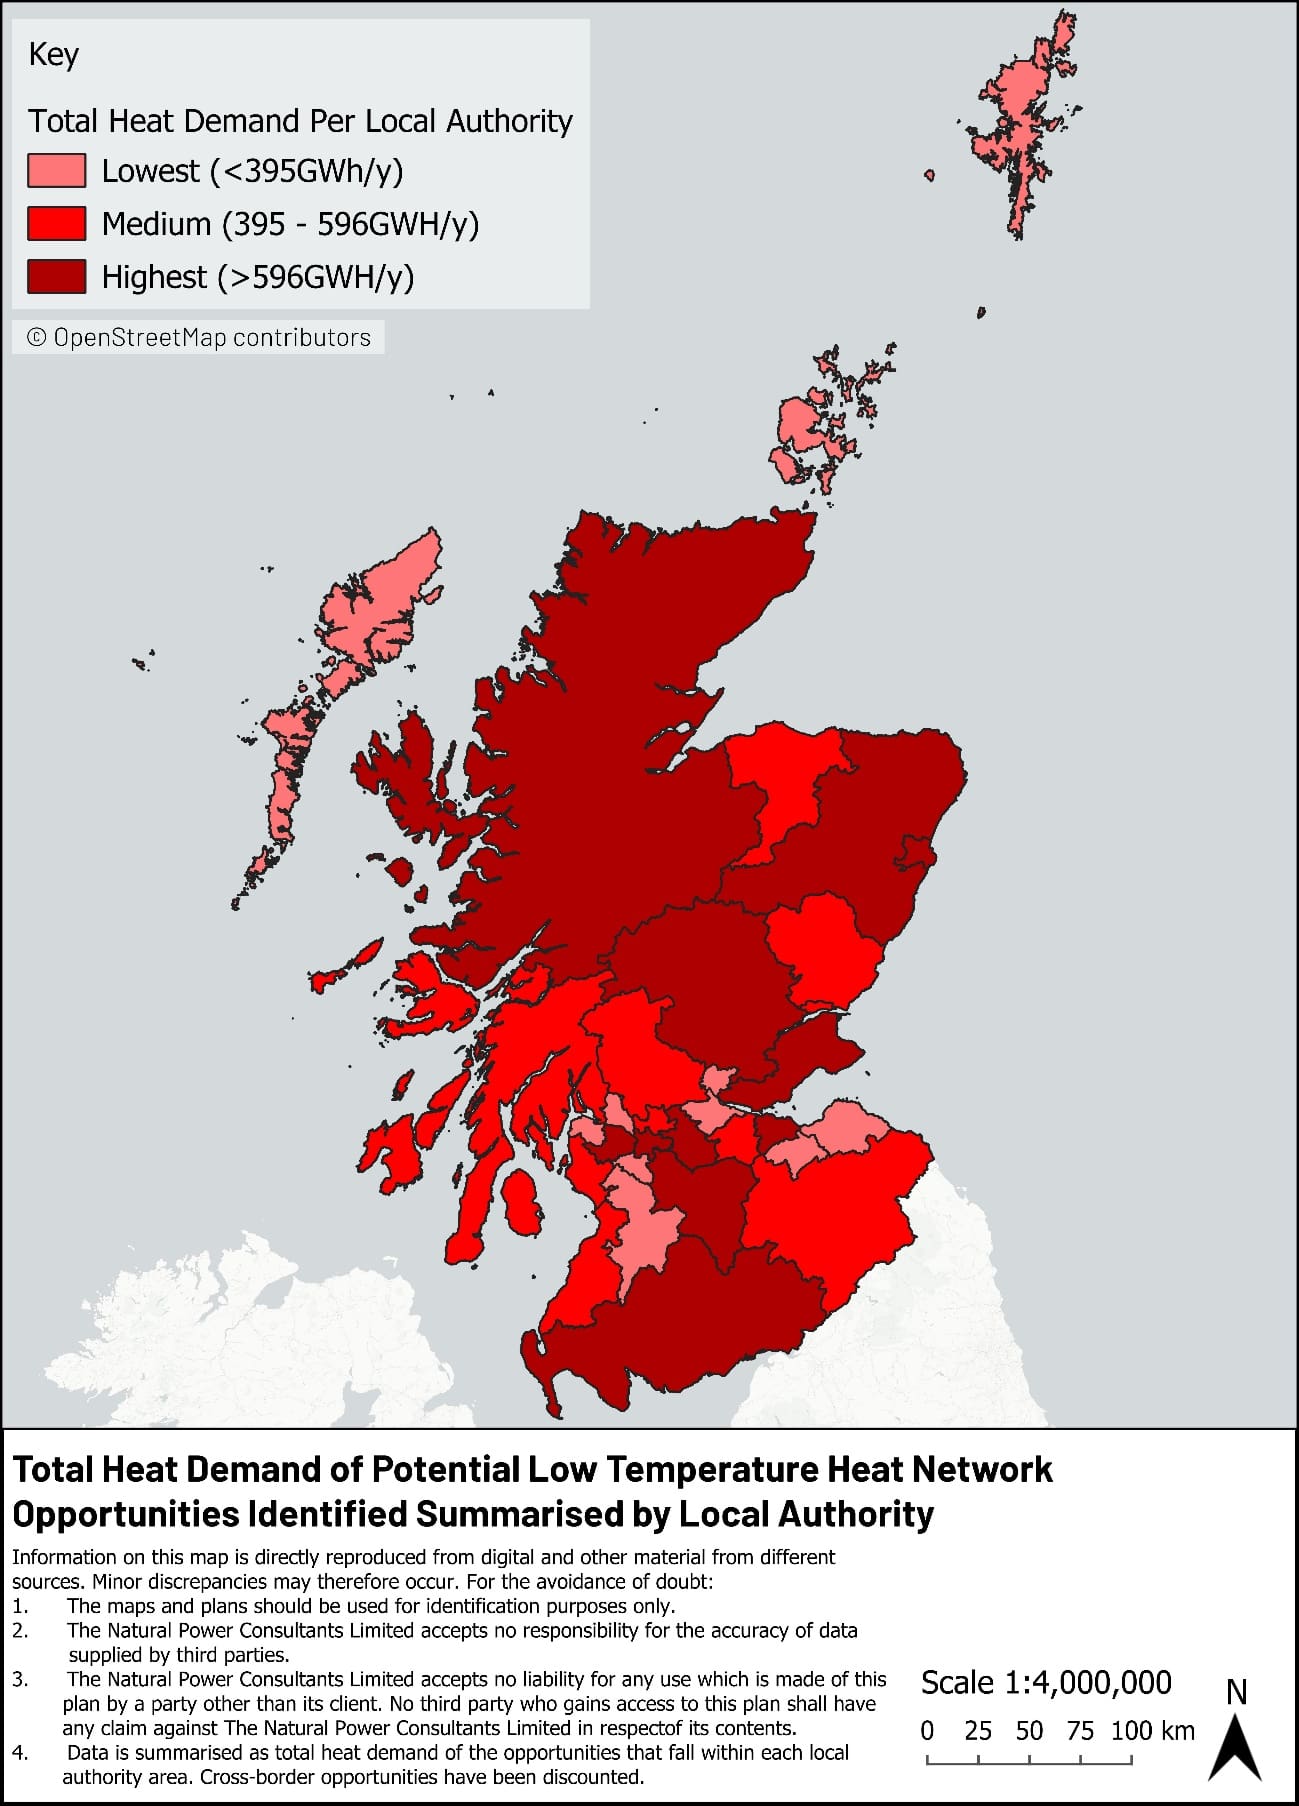
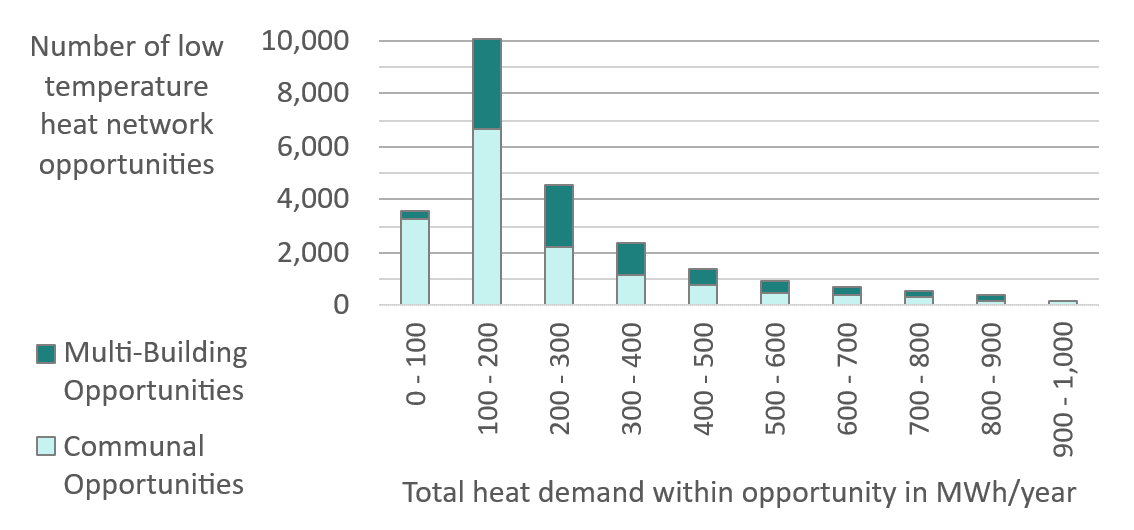
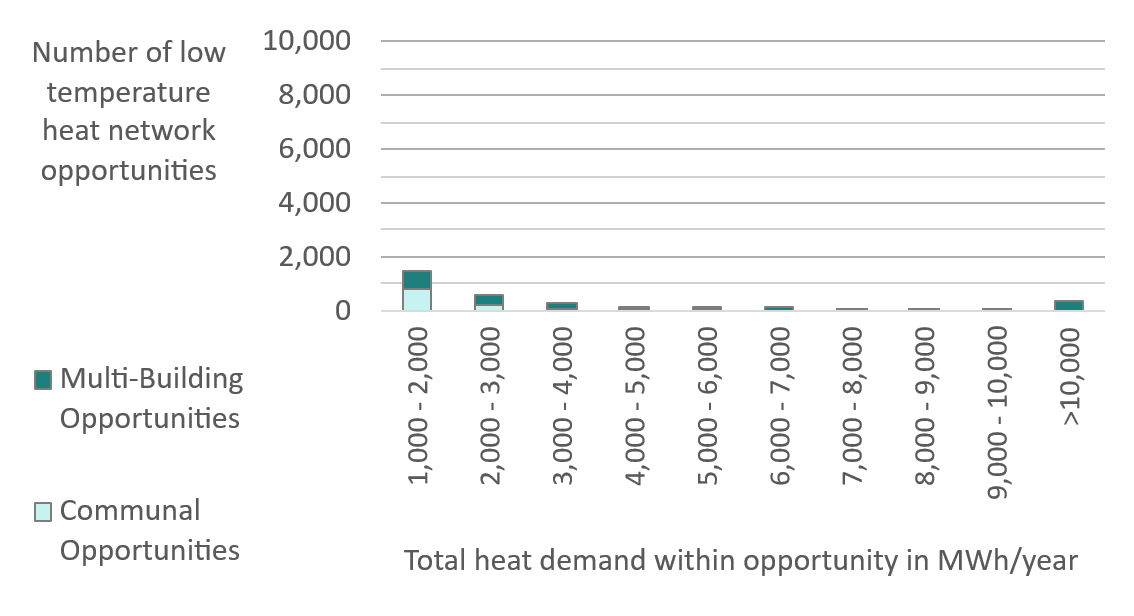
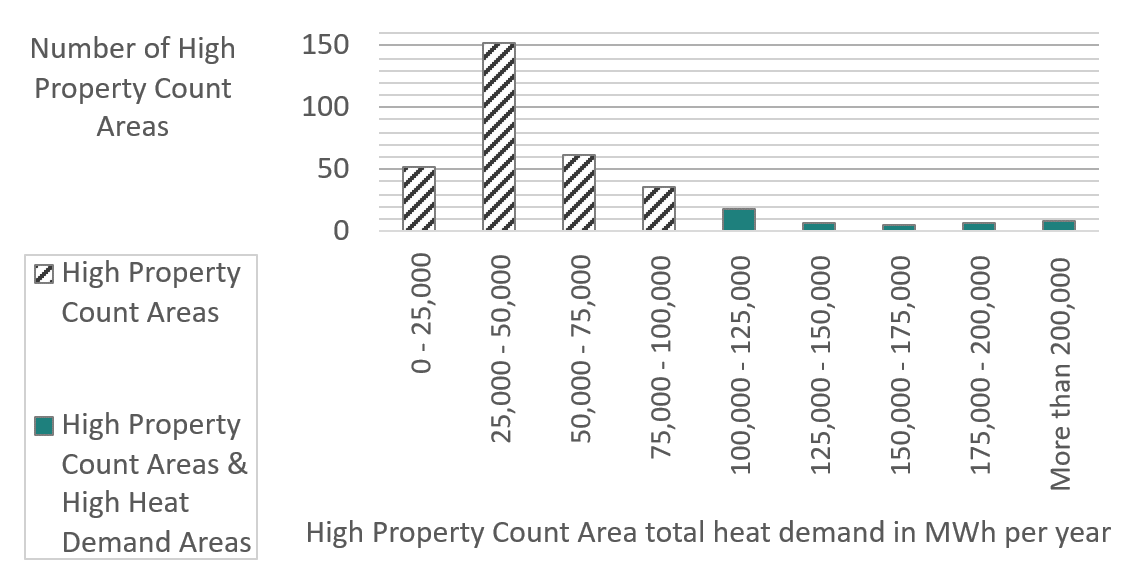
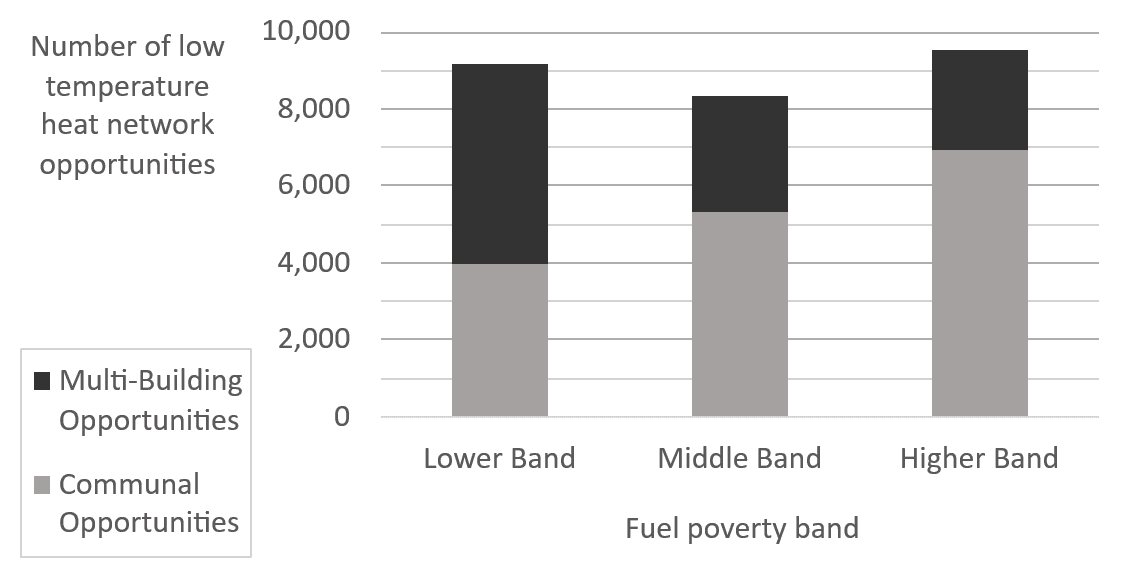
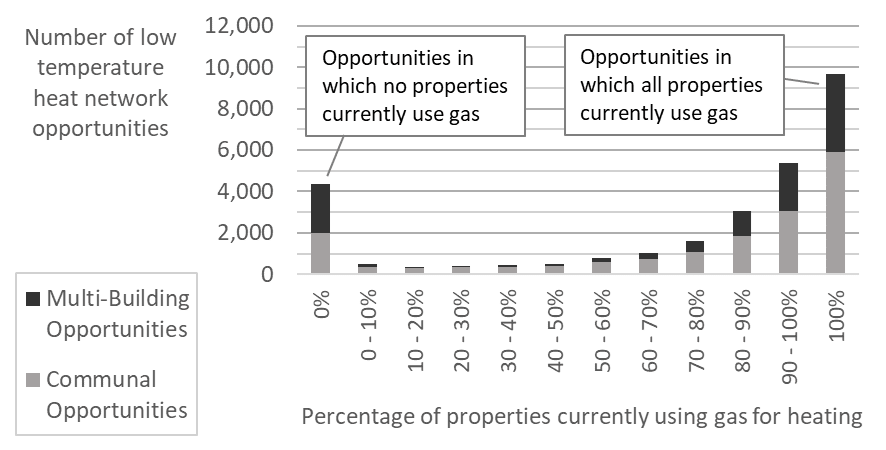
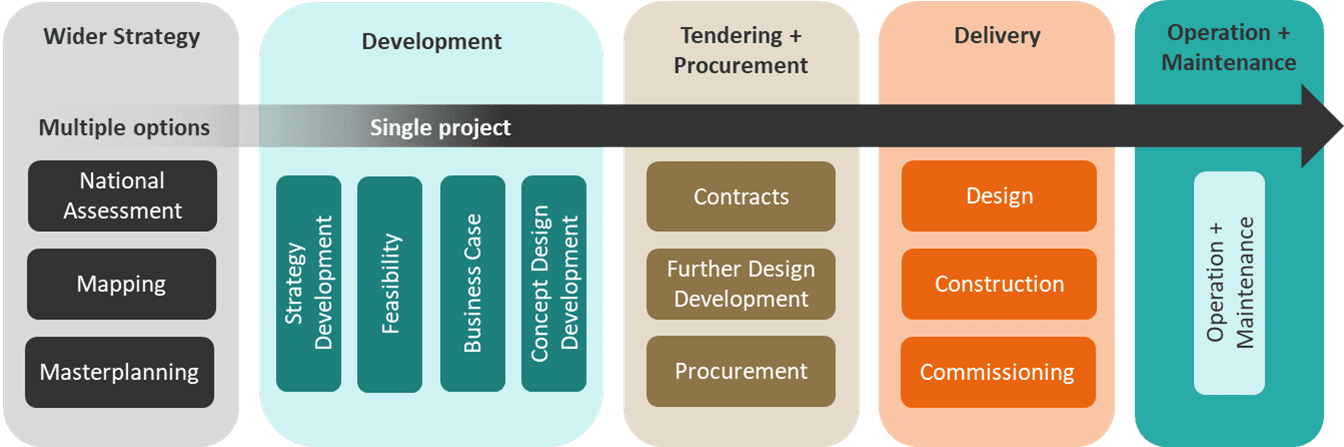

 In the research discussions and homework tasks, participants identified a range of warm-up behaviours which they associated with researching/deciding on a new heating system. This insight gives an indication of the target behaviours which could be modelled or encouraged in communications to encourage heat pump uptake alongside the primary call to action of switching away from gas or oil heating:


 This interactive advice resource from the consumer advice brand Which? was presented as a quiz. Users answered a short series of questions about their living circumstances and driving habits and received tailored advice on whether an EV would be a viable choice for them. This medium was useful in prompting participants to revisit assumptions about the range of EVs, as well as prompting some contemplation about the change of habit required to keep an EV charged up in contrast to their existing habits around filling up at a petrol station. The brand credibility of Which? as a perceived neutral party helped to foster trust in the advice given. It was possible for users to receive advice that recommended against buying an EV, which could be demotivational. However, some participants noted that the fact this was a possible outcome added to the sense of impartiality.
 This core communications proposition also has the potential to increase the sense of EVs as the incoming norm. The perception of EVs as a high-end product was in part linked to the strong impact of brands such as Tesla in popularising earlier generations of EVs. In contrast, promotional communications for more affordable EV models often focus significantly on price. For participants, seeing a wider variety of manufacturers, including mid-market or cheaper brands, helps to drive the idea that EVs are becoming increasingly popular across society rather than just for an affluent subset of the population.
 Similarly to messaging about lower than expected retail prices, there is potential for this message theme to increase perceived behavioural control by lowering the expected up-front cost of an EV.


 The energy supplier Octopus has recently entered the heat pump market with an “all in one” product/service offer (Octopus Energy, 2025). A prominent message in their promotional communications has been around the lack of third-party involvement in the process, with the manufacturer providing survey, design, installation and also offering to apply for funding support on behalf of the customer. This core communications proposition may be worth exploring further with research participants as the time cost of the decision-making and administrative process involved in getting a heat pump has been identified as a potential barrier.

 While luxury is still a prevalent theme in some promotional campaigns for EVs, it is typically associated with products at a higher price point, such as Tesla. However, some manufacturers who are more recent entries to the UK market appear keen to make value for money a key part of their proposition. MG launched a mid-sized fully electric SUV in 2022 with a campaign which presented their product as affordable and accessible, while still emphasising modern technology and features (M3 Agency, 2022). The campaign was built around the idea that “Electric is for everyone” with messaging which highlighted the price point, range, and features such as wireless phone charging. Similarly, Dacia’s communications promoting the Dacia Spring describe it as “Europe’s most affordable new electric car” (Dacia UK, 2024)


 Figure 25: FirstBus #CarFree campaign materials
 Communications created by the Energy Saving Trust presents public transport and active travel as part of a hierarchy, with air travel and ICE vehicle travel as the most environmentally harmful (Energy Saving Trust, 2024). This notably includes digital communication (e.g. video calling) and presents this as being the least impactful option on the climate.
 The Stages of Change Model (Prochaska & DiClemente, 1983), also known as the Transtheoretical Model, describes stages of behaviour change including: Pre-contemplation (not ready to change), Contemplation (considering change), Preparation (planning to change), Action (making changes), Maintenance (sustaining change), and Termination (no longer tempted). This model recognises that change is a process, not an event, and different strategies are effective at each stage.
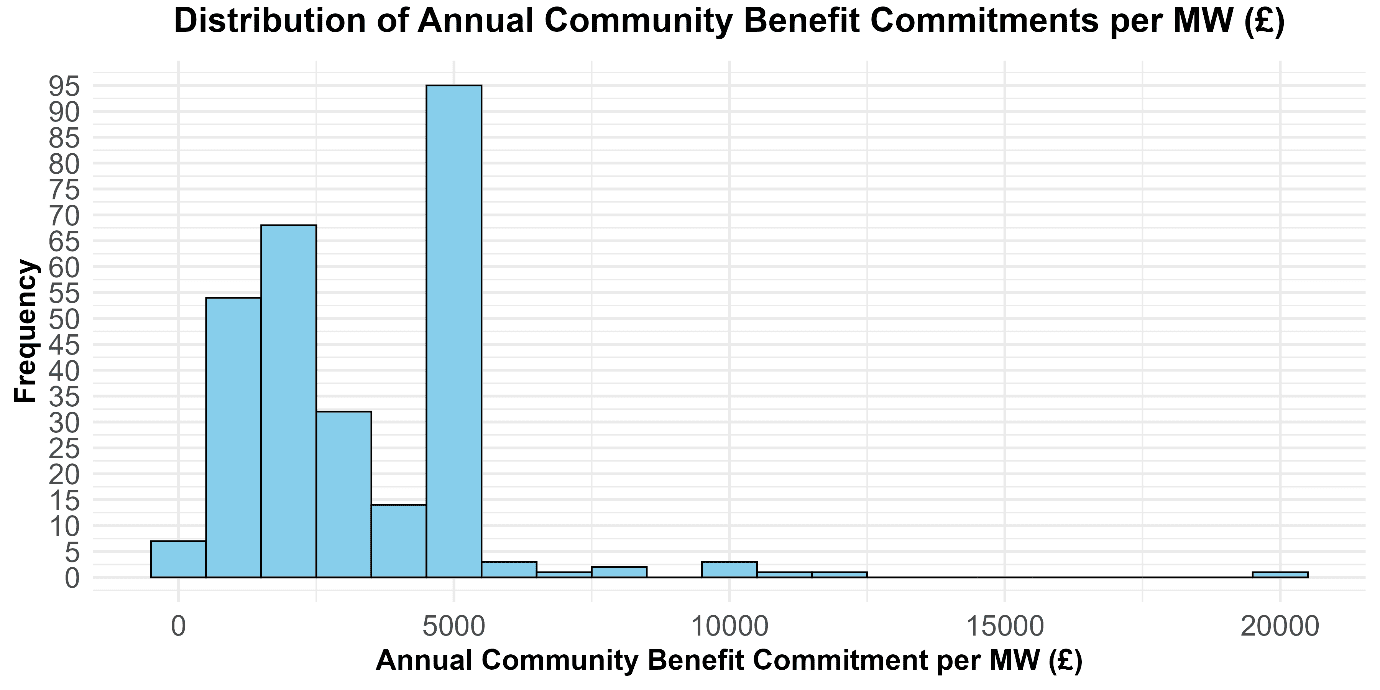
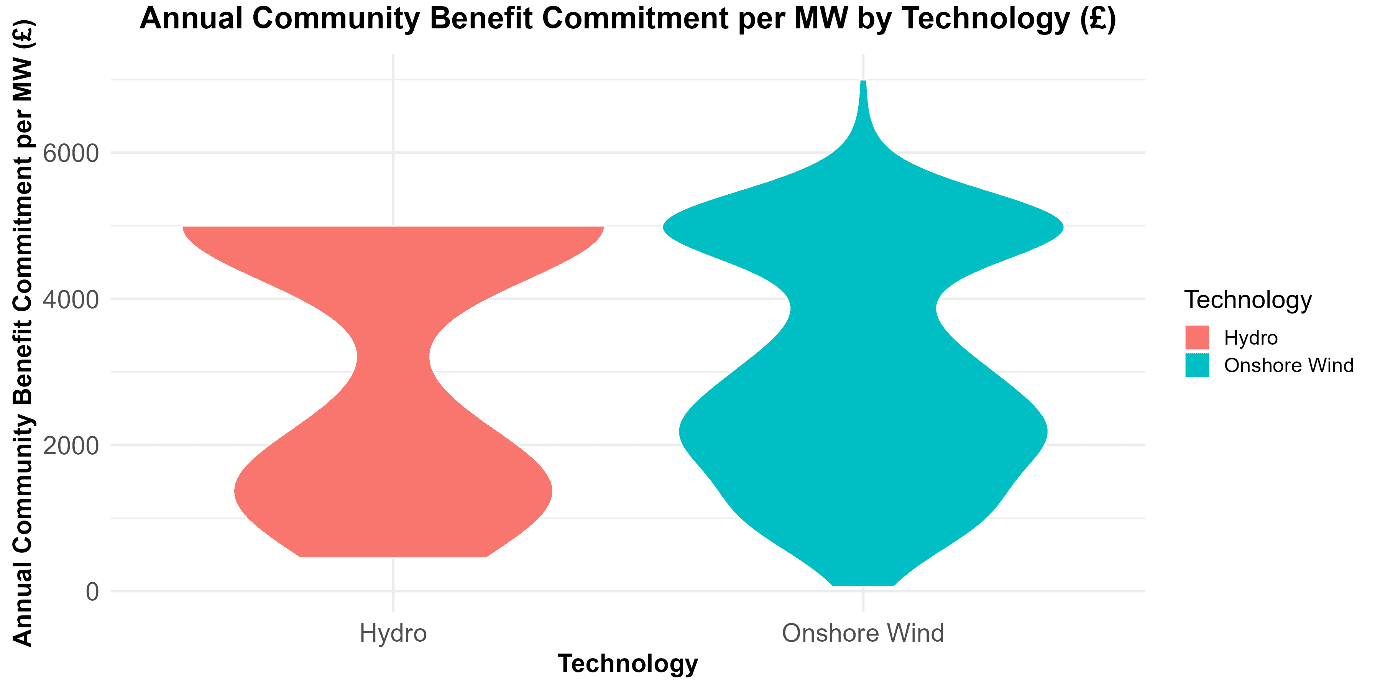
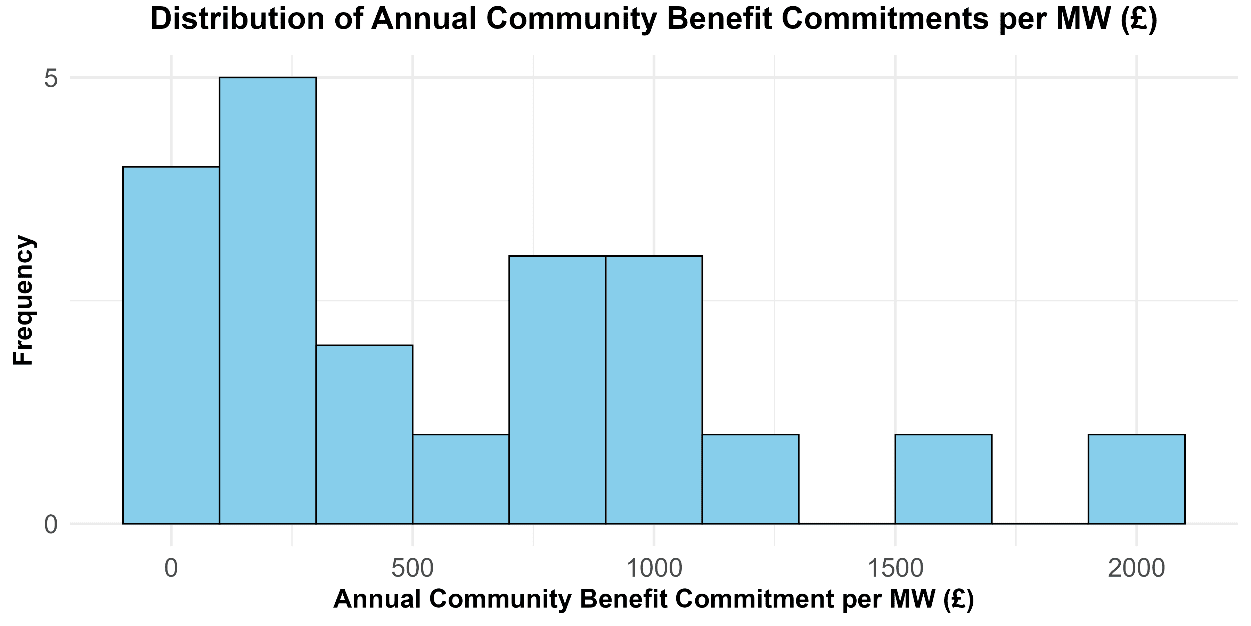
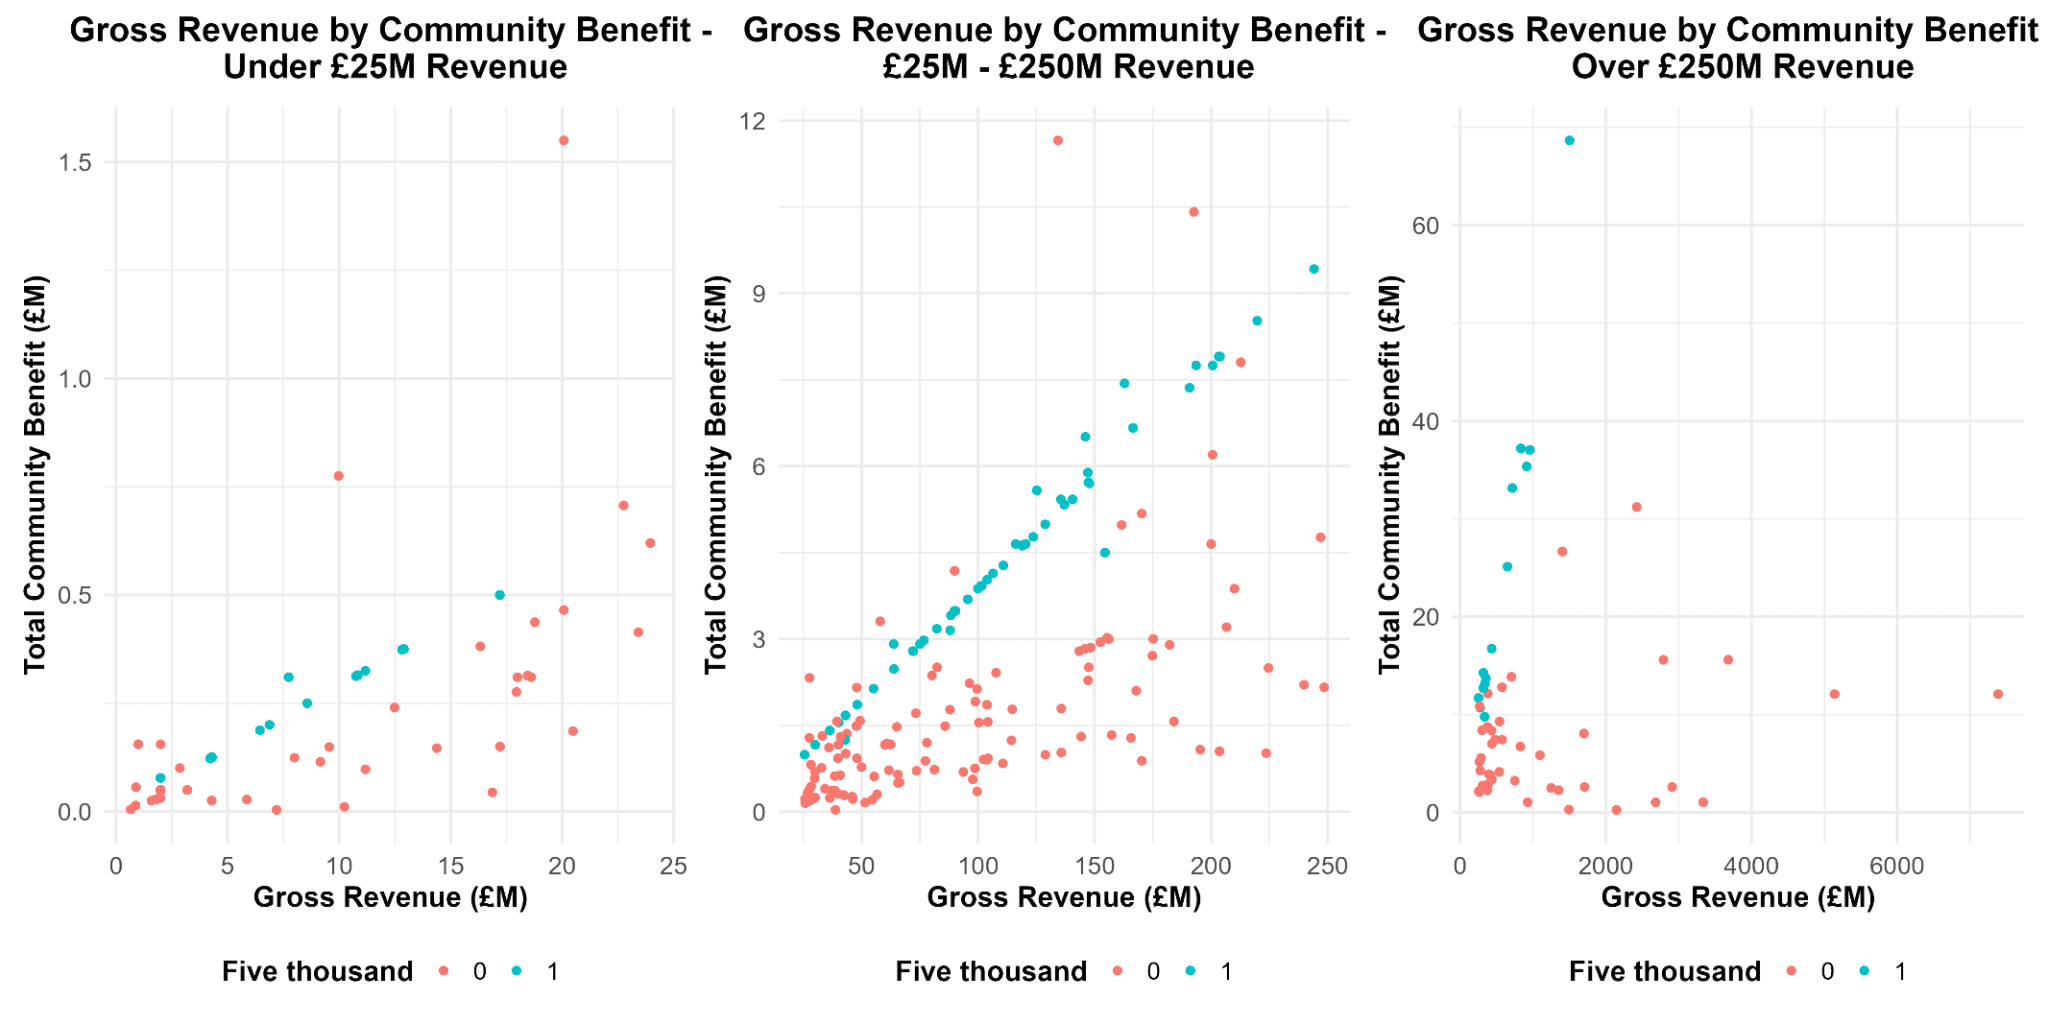
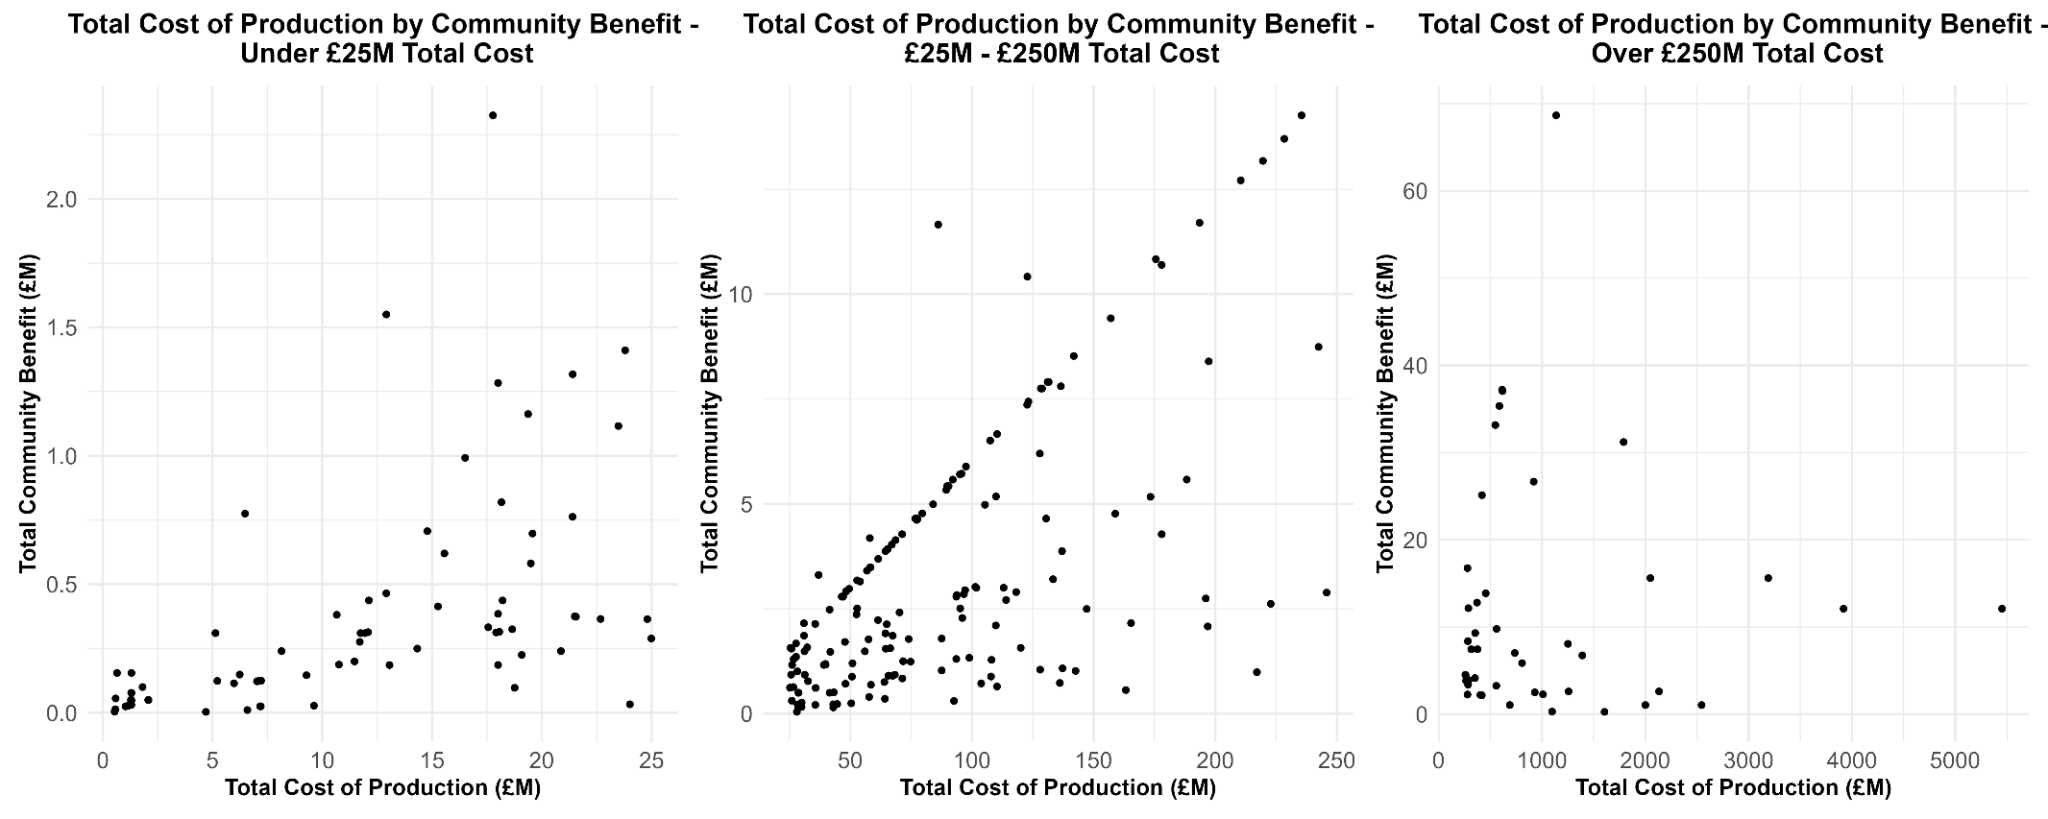
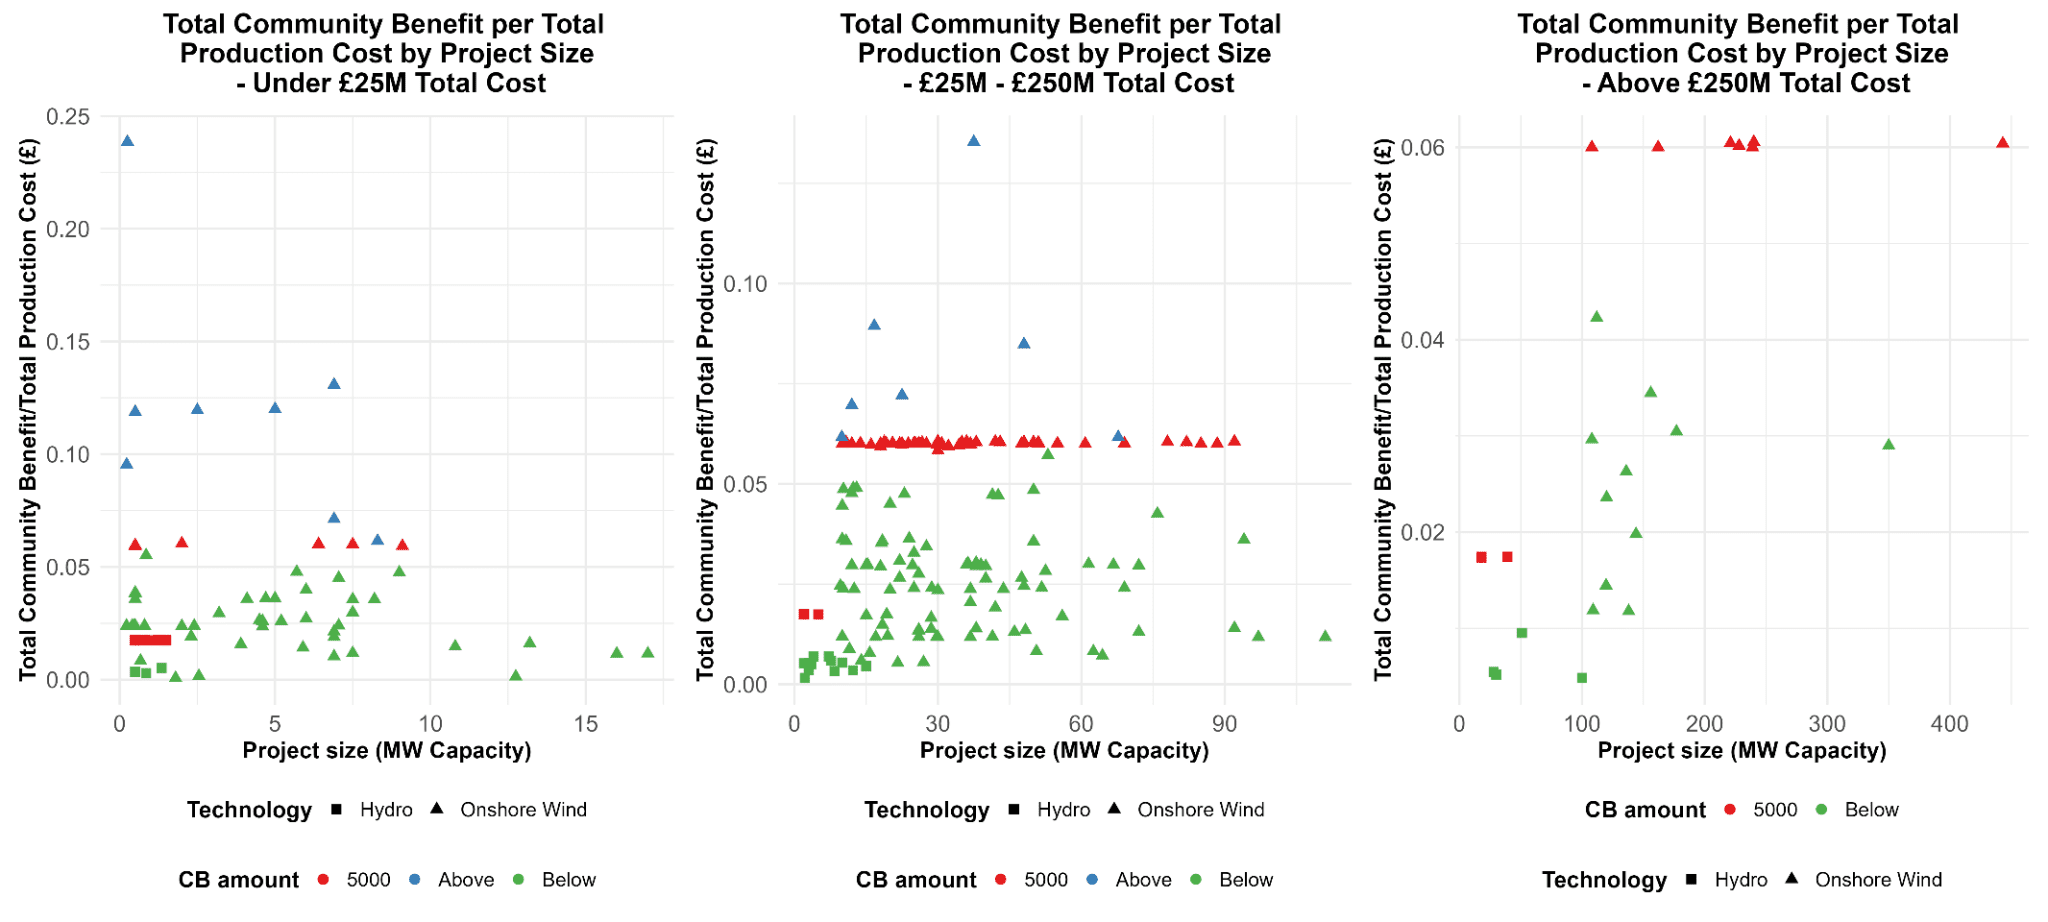
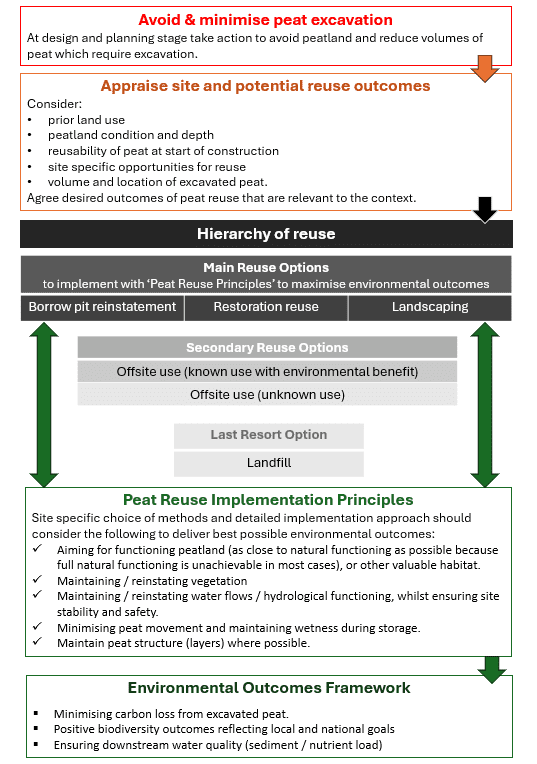
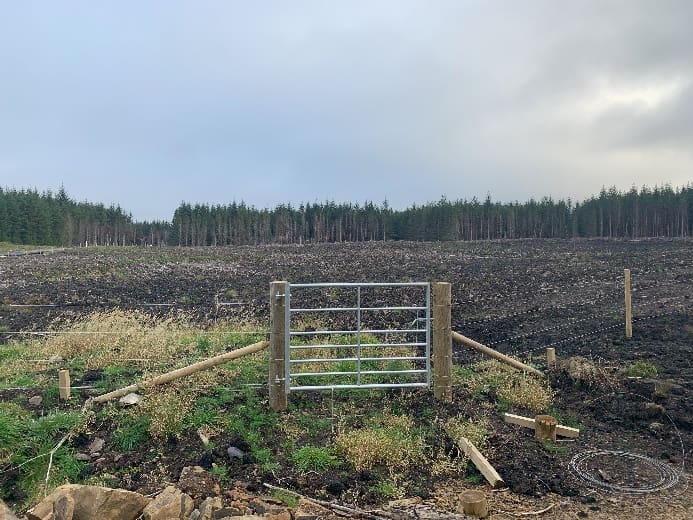


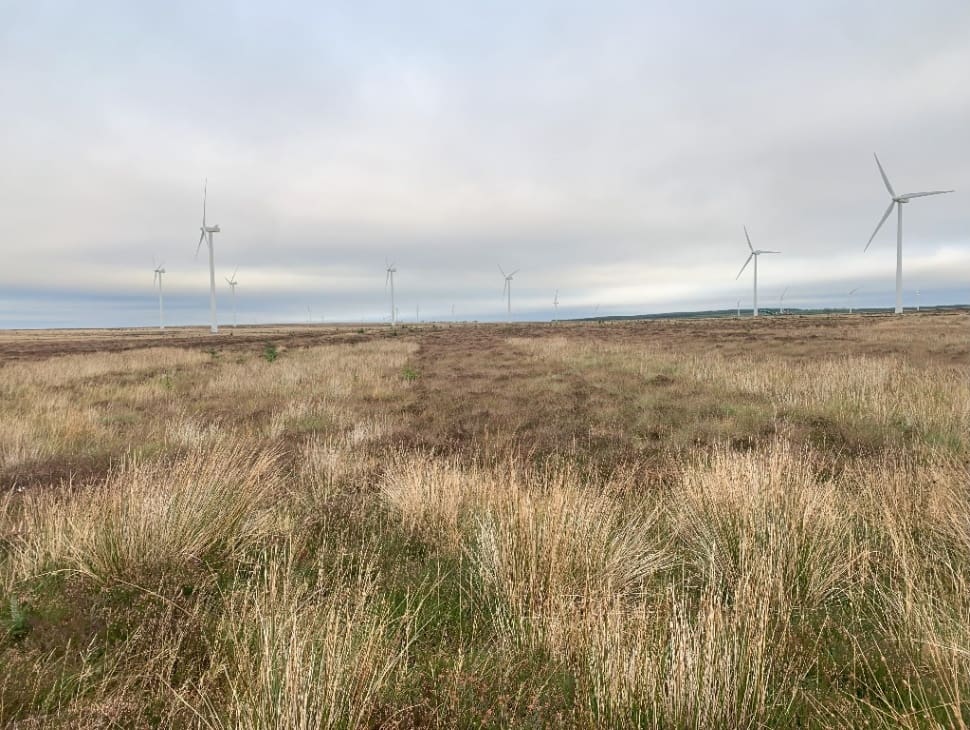
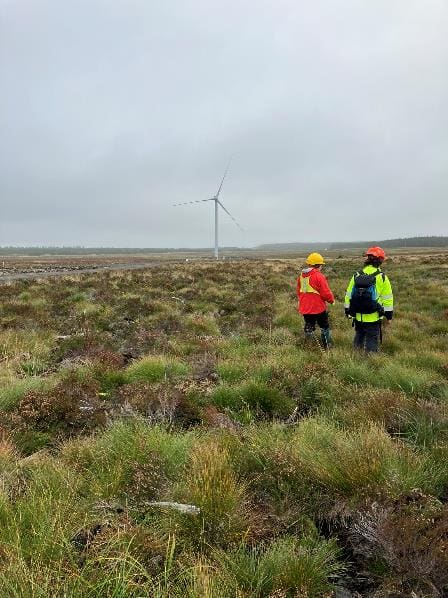

 d)
d)